irish national audit of stroke national report 2019
TRANSCRIPT

IRISH NATIONAL AUDIT OF STROKENATIONAL REPORT 2019
Irish National Audit of Stroke

ACKNOWLEDGING SIGNIFICANT CONTRIBUTIONS FROM THE FOLLOWING:
NATIONAL OFFICE OF CLINICAL AUDIT (NOCA)
NOCA was established in 2012 to create sustainable clinical audit programmes at national level. NOCA is funded by the Health Service Executive National Quality Improvement Team and operationally supported by the Royal College of Surgeons in Ireland. The National Clinical Effectiveness Committee defines national clinical audit as “a cyclical process that aims to improve patient care and outcomes by systematic, structured review and evaluation of clinical care against explicit clinical standards on a national basis” (NCEC, 2015, p. 2). NOCA supports hospitals to learn from their audit cycles.
Citation for this report: National Office of Clinical Audit (2020)Irish National Audit of Stroke National Report 2019.Dublin: National Office of Clinical Audit.
ISSN 2737-7245 Irish National Audit of Stroke (Print)ISSN 2737-7253 Irish National Audit of Stroke (Electronic)
Brief extracts from this publication may be reproduced provided the source is fully acknowledged.Electronic copies of this report can be found at:https://www.noca.ie/publicationsThis report was published on 16th December 2020
National Office of Clinical Audit, 2nd Floor, Ardilaun House, Block B, 111 St Stephen’s Green, Dublin 2, D02 VN51
For more information about this report, contact
Tel: +353 (1) 402 8577 Email: [email protected]
DESIGNED BY
Ann Dalton Deputy CEO/Chief Operations Officer St. James’s Hospital
Prof. Rónán Collins Clinical Lead, National Stroke Programme Consultant in Geriatric and Stroke medicine, Tallaght University Hospital
Dr Eugene Wallace Consultant in Rehabilitation Medicine National Rehabilitation Hospital
Una Moffatt Advanced Nurse Practitioner in Stroke Sligo University Hospital
WITH ASSISTANCE FROM THE IRISH NATIONAL AUDIT OF STROKE GOVERNANCE COMMITTEE:
Glen Arrigan Clinical Nurse Specialist Cork University Hospital
Dr Breda Smyth HSE West Director of Public Health
Paul Gallagher Chief Director of Nursing & Midwifery Ireland East Hospital Group
Edina O’Driscoll Programme Manager, National Stroke Programme
REPORT PREPARED BY:
Olga Brych Data Analyst, National Office of Clinical Audit
Dr Tim Cassidy Chairperson of Irish National Audit of Stroke Governance CommitteeConsultant in Medicine for the Elderly and Stroke Physician, St Vincent’s University Hospital
Prof. Joe Harbison Clinical Lead, Irish National Audit of Stroke Consultant Geriatrician and Stroke Physician, St James’s Hospital
Joan McCormack Cardiovascular Programme Audit Manager, National Office of Clinical Audit
Deirdre Murphy Head of Hospital In-Patient Enquiry (HIPE), Healthcare Pricing Office
Dr Margaret O’Connor Consultant in Geriatric Medicine, University Hospital Limerick
Claire Prendergast Senior Physiotherapist, Our Lady of Lourdes Hospital Drogheda
Martin Quinn Public and Patient Interest Representative, Irish National Audit of Stroke Governance Committee Stroke Survivor and Advocate, Irish Heart Foundation
Prof. John Thornton Consultant Neuroradiologist, Beaumont Hospital Director, National Thrombectomy Service
Aoife Moroney Ward Communications and Events Lead, National Office of Clinical Audit
Dr Marcia Ward Public and Patient Interest Representative, Irish National Audit of Stroke Governance Committee Senior Clinical Neuropsychologist, Headway
This work uses data provided by patients and collected by their healthcare providers as part of their care. NOCA would like to thank all participating hospitals for their valuable contribution, in particular the Irish National Audit of Stroke Audit Coordinators and Clinical Leads. Without their continued support and input, this audit could not continue to produce meaningful analysis of stroke care in Ireland. NOCA would also like to acknowledge the work of the National Stroke Programme during the audit’s transition from the Health Service Executive to NOCA, and look forward to ongoing collaboration to improve patient care as the audit develops. NOCA greatly appreciates the ongoing commitment and support received from the Health Service Executive National Quality Improvement Team and its Director, Dr Philip Crowley, which has led to major growth and development in clinical audit in Ireland. We would also like to thank Philip Dunne, IT Systems Support, Healthcare Pricing Office, who provides ongoing support for the stroke audit portal. This report underwent a single blind review process. NOCA thanks reviewers for their contribution to this report.
ACKNOWLEDGEMENT OF KEY PARTNERS
Irish National Audit of StrokeNational Report 2019
Irish National Audit of Stroke


Prof Joe Harbison National Clinical Lead, Irish National Audit of StrokeNational Office of Clinical Audit 2nd Floor, Ardilaun House 111 St. Stephen’s Green,Dublin 2
13 November, 2020
Dear Prof Harbison,
I wish to acknowledge receipt of the first Irish National Audit of Stroke Report 2019. Following your presentation to the NOCA Governance Board on the 12th November 2020 and feedback garnered from our membership, we are delighted to endorse this report.
I wish to congratulate you, Audit Manager Joan Mc Cormack and your governance committee in the development of this report which is a valuable quality improvement initiative.
We look forward to the findings of the Organisational Audit planned for later in the year that will review staffing, structures including radiology technology, which will no doubt drive further improvements for patients.
Looking to the future, as the audit matures, the Board in the discussion of your report suggested you and your governance group consider recommendations in regard to quality improvement initiatives in the areas of access to diagnostics, anticoagulant management and discharge planning including community care post discharge, as topics worthy of your attention.
Please accept this as formal endorsement from the NOCA Governance Board of the Irish National Audit of Stroke 2019 and we wish you every success in your ongoing commitment to improving the care of Stroke patients.
Yours sincerely,
Mr Kenneth Mealy,Chair National Office of Clinical Audit Governance Board
National Office of Clinical Audit2nd Floor
Ardilaun House, Block B111 St Stephen’s Green
Dublin 2, D02 VN51Tel: + (353) 1 402 8577
Email: [email protected]
NOCA NATIONAL OFFICE OF CLINICAL AUDIT IRISH NATIONAL AUDIT OF STROKE NATIONAL REPORT 2019 76
PREFACE
RÓNÁN COLLINS, CLINICAL LEAD, NATIONAL STROKE PROGRAMME
I am delighted to welcome the publication of the first Irish National Audit of Stroke (INAS) annual report and wish to congratulate the writers and management team at the National Office of Clinical Audit (NOCA), and in particular Ms Joan McCormack, the inaugural National Cardiovascular Programme Audit Manager. The INAS has been a long time in the making, since my predecessors in the National Stroke Programme (NSP), also known as the National Clinical Programme for Stroke (NCPS), set up a National Stroke Register in 2012 to collect data on our processes of care for, and outcomes from, stroke. With the commitment of our clinical nurse specialists and multidisciplinary teams in stroke, the Register has grown over the years in the scope and breadth of data collected, and expanded to collect additional data on emergency care timelines, functional recovery and amount of therapy provided for patients with stroke. This led to increasingly time-consuming and sophisticated annual reports from the National Stroke Programme that we soon realised required a deeper analysis, well beyond the scope of the Programme.
Throughout the development of the National Stroke Register, it was clear that data drove self-reflection, change and improvement in our stroke services, but that in order to be truly effective, such data needed to be more accessible and responsive to the audit and quality improvement needs of local stroke services and hospital management, as well as to the public and to health commissioners. It also needed to be independent of the National Stroke Programme, which is responsible for the development and implementation of the National Stroke Strategy 2020-2025 stroke. We sought a move to a professional and sustainable model of audit in order to meet these criteria and were delighted to be identified by NOCA management as a high priority and key target for national audit, and to secure the necessary resources and funding through Dr Philip Crowley and the Health Service Executive National Quality Improvement Team in 2018.
This audit highlights the huge improvements in the care of patients with a stroke that we have achieved since 2012: in 2019, our median national ‘door to decision’ time was under 1 hour, 9% of patients with a stroke got access to life-altering thrombectomy, and mortality from ischaemic stroke had fallen to 9% from almost double that in 2008. It describes the changing nature of stroke care, as more treatment is provided at home through our Early Supported Discharge teams, although more can still be done in this area to improve outcomes. It also highlights areas for improvement in both messaging and treatment; less than half of all strokes present to hospital quickly enough to make thrombolysis (clot-dissolving) treatment effective, and direct transport to a thrombectomy centre could enable faster treatment to clear a blocked artery. And, critically, this audit points to the need for investment in more designated stroke unit beds to meet our key performance indicators (KPIs), and in stroke therapy staff to provide adequate rehabilitation to patients in order to ensure optimal recovery.
Stroke is becoming the second leading cause of death, and it is the leading cause of acquired adult neurological disability in the developed world. The INAS is an important step in the future development of our stroke services to meet this challenge. It is the necessary independent audit that allows the National Stroke Programme to ‘see itself in the mirror’, to double down on what is working well with ongoing investment and development, and to analyse, understand, and make changes in the areas where we are not achieving our desired outcomes through focused quality improvement initiatives. I am confident that the developing relationship between the National Stroke Programme and the INAS will be both symbiotic and challenging, as it should be; but, ultimately, it is a much desired and necessary relationship in order to improve outcomes for patients with a stroke in Ireland.

NOCA NATIONAL OFFICE OF CLINICAL AUDIT IRISH NATIONAL AUDIT OF STROKE NATIONAL REPORT 2019 76
CONTENTSPREFACE 06CONTENTS 07GLOSSARY OF TERMS AND DEFINITIONS 12EXECUTIVE SUMMARY 15KEY FINDINGS 16PUBLIC AND PATIENT INTEREST REPRESENTATIVE INVOLVEMENT 22
CHAPTER 1: INTRODUCTION 23Introduction 24
What is a stroke? 24
Establishment of the Irish National Audit of Stroke 25
National Office of Clinical Audit (NOCA) 25
Irish National Audit of Stroke Governance Committee 27
Aim and objectives of the INAS 28
Who is this report aimed at? 29
Who we work with 30
CHAPTER 2: METHODOLOGY 33Inclusion criteria 34
Exclusion criteria 34
Data entry 35
Data validation 36
Data analysis 37
CHAPTER 3: DATA QUALITY 37Data quality statement 38
Data coverage 43
Summary 45
CHAPTER 4: EMERGENCY CARE 45Gender and age band 46
Admission source 47
Time from onset of stroke symptoms to hospital arrival 48
Day and time of hospital arrival 50
Time between hospital arrival and time reviewed by medical team 51
Door to imaging 52
Type of stroke 53
Thrombolysis in ischaemic stroke 54
Time between hospital arrival and time of thrombolysis 55
Key findings from Chapter 4 56
CHAPTER 5: THROMBECTOMY 59Thrombectomy in ischaemic stroke 61
Onset of stroke symptoms to CT scan 63
Transfers of patients 64
CTA to decision to transfer patient to EVT stroke centre 65
01
02
0304
05

NOCA NATIONAL OFFICE OF CLINICAL AUDIT IRISH NATIONAL AUDIT OF STROKE NATIONAL REPORT 2019 98
Onset of stroke symptoms to EVT stroke centre arrival 66
Proximal occlusion site 68
Time to recanalisation 69
Intervention outcomes – National Institutes of Health Stroke Scale 71
Transfers of patients back to referring hospital 72
Discharge destination 73
Key findings from Chapter 5 74
CHAPTER 6: STROKE UNIT CARE 75Stroke units 76
Secondary prevention 84
Key findings from Chapter 6 90
CHAPTER 7: OUTCOMES 91Key performance indicators (KPIs) 92
Discharge outcomes 93
Hospital length of stay 96
Discharge destination 99
Key findings from Chapter 7 101
CHAPTER 8: HEALTH AND SOCIAL CARE PROFESSIONALS 103Background 104
HSCP assessment 106
Physiotherapy 108
Occupational therapy 111
Speech and language therapy 116
Key findings from Chapter 8 123
CHAPTER 9: AUDIT UPDATE 125Value of audit 126
Audit developments/improvements 127
Organisational audit 128
CHAPTER 10. RECOMMENDATIONS 129 CHAPTER 11. CONCLUSION 139 REFERENCES 141APPENDICES 147APPENDIX 1: INAS Governance Committee 148
APPENDIX 2: INAS dataset 149
APPENDIX 3: Frequency tables 157
CONTENTS
0607
08
091011

NOCA NATIONAL OFFICE OF CLINICAL AUDIT IRISH NATIONAL AUDIT OF STROKE NATIONAL REPORT 2019 98
TABLES
TABLE 1.1 Irish National Audit of Stroke aim and objectives 28
TABLE 1.2 Hospitals we work with 30
TABLE 3.1 Overview of data quality for the Irish National Audit of Stroke 2019 38
TABLE 3.2 Data coverage 43
TABLE 5.1A Percentage of ischaemic stroke cases who received a thrombectomy, by hospital 61
TABLE 5.1B Cases who received thrombectomy for whom no ischaemic information was available 62
TABLE 6.1 Swallow and mood screening 81
TABLE 6.2 Secondary prevention treatment for patients with ischaemic stroke and with atrial fibrillation 88
TABLE 7.1 Key performance indicators 92
TABLE 7.2 Median and interquartile range of bed days in hospital for patients with a stroke, by age group (N=4275) 96
TABLE 7.3 Composition of a fully resourced Early Supported Discharge team 100
TABLE 8.1 Participating hospitals by discipline 104
TABLE 9.1 Irish National Audit of Stroke data collection calendar 2020 127

NOCA NATIONAL OFFICE OF CLINICAL AUDIT IRISH NATIONAL AUDIT OF STROKE NATIONAL REPORT 2019 1110
FIGURES
FIGURE 1.1 Ischaemic stroke 24
FIGURE 1.2 Haemorrhagic stroke 25
FIGURE 1.3 Governance and management teams for NOCA audits 26
FIGURE 4.1 Percentage of Irish National Audit of Stroke cases, by gender and age group (N=4275) 47
FIGURE 4.2 Admission source (N=4275) 48
FIGURE 4.3 Distribution of time from onset of stroke symptoms to hospital arrival (n=2246) 50
FIGURE 4.4 Distribution of day and time of hospital arrival (n=4013) 51
FIGURE 4.5 Time between hospital arrival and time reviewed by medical team (n=3019) 52
FIGURE 4.6 Door to imaging time, median and interquartile range, by hospital, in minutes (n=3640) 53
FIGURE 4.7 Percentage of Irish National Audit of Stroke cases, by stroke type (N=4275) 54
FIGURE 4.8 Percentage of thrombolysis in ischaemic stroke cases, by hospital (n=3659) 55
FIGURE 4.9 Door to needle time, median and interquartile range, by hospital, in minutes (n=353) 56
FIGURE 5.1 Thrombectomy 60
FIGURE 5.2 Time from onset of stroke symptoms to computed tomography scan for thrombectomy cases, median and interquartile range, by hospital (n=211) 63
FIGURE 5.3 Percentage of patients transferred to EVT stroke centre (n=361) 64
FIGURE 5.4 Time from computed tomography angiogram to decision to transfer patient to EVT stroke centre for thrombectomy cases, median and interquartile range, by hospital (n=235) 65
FIGURE 5.5A Time from onset of stroke symptoms to EVT stroke centre arrival, median and interquartile range, for thrombectomy cases who were admitted directly to the EVT stroke centre (n=42) 66
FIGURE 5.5B Time from onset of stroke symptoms to EVT stroke centre arrival, median and interquartile range, for thrombectomy cases who were transferred to the EVT stroke centre (n=165) 67
FIGURE 5.6 Proximal occlusion site (n=361) 68
FIGURE 5.7A Time from onset of stroke symptoms to recanalisation, median and interquartile range, for patients admitted directly to the EVT stroke centre (n=42) 69
FIGURE 5.7B Time from onset of stroke symptoms to recanalisation, median and interquartile range, for patients transferred from another hospital to the EVT stroke centre (n=160) 70
FIGURE 5.8 Intervention outcomes – National Institutes of Health Stroke Scale scores (n=328) 71
FIGURE 5.9 Percentage of cases transferred immediately back to referring hospital (n=292) 72
FIGURE 5.10 Discharge destination for patients admitted directly to the EVT stroke centre (n=69) 73
FIGURE 6.1 Admission to stroke unit, by hospital (N=4275) 76
FIGURE 6.2A Reason for non-admission to a stroke unit (n=1235) 77
FIGURE 6.2B Other reasons for non-admission to a stroke unit (n=456) 78
FIGURE 6.3 Swallow screening, by hospital (N=4275) 79
FIGURE 6.4 Mood screening (N=4275) 80
FIGURE 6.5A Health and social care professional assessment (n=3741) 82
FIGURE 6.5B Assessed by clinical nurse specialist (N=4275) 83
FIGURE 6.6 Start times for antithrombotics (n=3026) 84
FIGURE 6.7 Breakdown of pre-stroke atrial fibrillation data for patients with ischaemic and haemorrhagic stroke (N=4275) 86
FIGURE 6.8 Secondary prevention treatment for atrial fibrillation in patients with ischaemic stroke (n=1109) 87
FIGURE 6.9 Patients with a stroke diagnosed with carotid stenosis (N=4275) 89

NOCA NATIONAL OFFICE OF CLINICAL AUDIT IRISH NATIONAL AUDIT OF STROKE NATIONAL REPORT 2019 1110
FIGURE 7.1A Modified Rankin Scale scores in patients with ischaemic stroke, pre-stroke and on discharge (n=3145) 93
FIGURE 7.1B Modified Rankin Scale scores in patients with haemorrhagic stroke, pre-stroke and on discharge (n=516) 94
FIGURE 7.2 Pre-stroke modified Rankin Scale scores, by age group (N=4275) 95
FIGURE 7.3 Median bed days in stroke unit, by hospital (n=3003) 97
FIGURE 7.4 Percentage of bed days spent in stroke unit, by hospital (N=57515) 98
FIGURE 7.5 Discharge destination of patients with a stroke (N=4275) 99
FIGURE 7.6 Cases discharged home with Early Supported Discharge, by hospital (n=2110) 100
FIGURE 8.1 Number of patients assessed by health and social care professionals 105
FIGURE 8.2 Time from hospital arrival to therapy assessment, by discipline 106
FIGURE 8.3 Intensity of therapy, by discipline 107
FIGURE 8.4 Physiotherapy mobility outcomes (n=1443) 108
FIGURE 8.5 Physiotherapy cases requiring the assistance of more than one therapist/therapy assistant (n=1604) 109
FIGURE 8.6 Physiotherapy onward referral destination (n=1604) 110
FIGURE 8.7 Occupational therapy activities of daily living pre- and post-stroke (n=1133) 111
FIGURE 8.8 Occupational therapy visual field assessment (n=1194) 112
FIGURE 8.9 Occupational therapy patient education on returning to work and driving 113
FIGURE 8.10 Occupational therapy cases requiring the assistance of more than one therapist/therapy assistant (n=1194) 114
FIGURE 8.11 Occupational therapy onward referral destination (n=612) 115
FIGURE 8.12 Communication and swallow difficulties identified by speech and language therapists (n=845) 116
FIGURE 8.13 Speech and language therapy pre- and post-stroke communication ability (n=934) 117
FIGURE 8.14 Speech and language therapy swallow investigations (n=993) 118
FIGURE 8.15 Speech and language therapy pre- and post-stroke modified diet (n=948) 119
FIGURE 8.16 Speech and language therapy pre- and post-stroke modified fluids (n=950) 120
FIGURE 8.17 Speech and language therapy enteral feeding on discharge (n=993) 121
FIGURE 8.18 Speech and language therapy onward referral destination (n=993) 122

NOCA NATIONAL OFFICE OF CLINICAL AUDIT IRISH NATIONAL AUDIT OF STROKE NATIONAL REPORT 2019 1312
GLOSSARY OF TERMS AND DEFINITIONS
ACRONYM FULL TERM
ADLs activities of daily living
AF atrial fibrillation
aphasia A disorder that affects the ability to speak, read, write and understand language
AVERT A Very Early Rehabilitation Trial
carotid endarterectomy
Carotid endarterectomy is surgery that removes plaque build-up from inside a carotid artery in the neck.
carotid stenosis Carotid stenosis is a narrowing of the carotid arteries, the two major arteries that carry oxygen-rich blood from the heart to the brain.
carotid stenting Carotid stenting is a procedure in which a vascular surgeon or neuroradiologist inserts a stent which expands inside the carotid artery in order to increase blood flow in areas blocked by plaque.
cognitive linguistic communication disorders
Disorders that can affect attention, memory, problem solving and interpretive language, which in turn affect communication abilities
CT computed tomography – a scanning technique that uses X-rays to take highly detailed images of the body/brain
CTA computed tomography angiogram
DTI door to imaging – this is a term used to indicate the time between the arrival of the patient at the hospital and the time of the first brain scan. Once the patient has a brain scan, the decision about treatment can be made.
DTN door to needle – this is a term used to indicate the time between the arrival of the patient at the hospital and the time of thrombolysis treatment.
DVR Data Validation Report
dysarthria A speech disorder caused by muscle weakness
dyspraxia A condition that affects movement and coordination
ESD Early Supported Discharge
EVT endovascular thrombectomy
EVT stroke centre A hospital that can provide a thrombectomy service
FAST face, arm, speech and time
FEES fiberoptic endoscopic evaluation of swallowing
haemorrhagic stroke
Haemorrhagic stroke occurs when a blood vessel in the brain leaks or ruptures.
HIPE Hospital In-Patient Enquiry
HIQA Health Information and Quality Authority
HPO Healthcare Pricing Office
HSCP health and social care professional
TABLE 1.0: ACRONYMS / ABBREVIATIONS
NOCA NATIONAL OFFICE OF CLINICAL AUDIT IRISH NATIONAL AUDIT OF STROKE NATIONAL REPORT 2019 1312
ACRONYM FULL TERM
HSE Health Service Executive
ICD 10 International Classification of Diseases, Tenth Revision
IHF Irish Heart Foundation
INAS Irish National Audit of Stroke
INR international normalised ratio
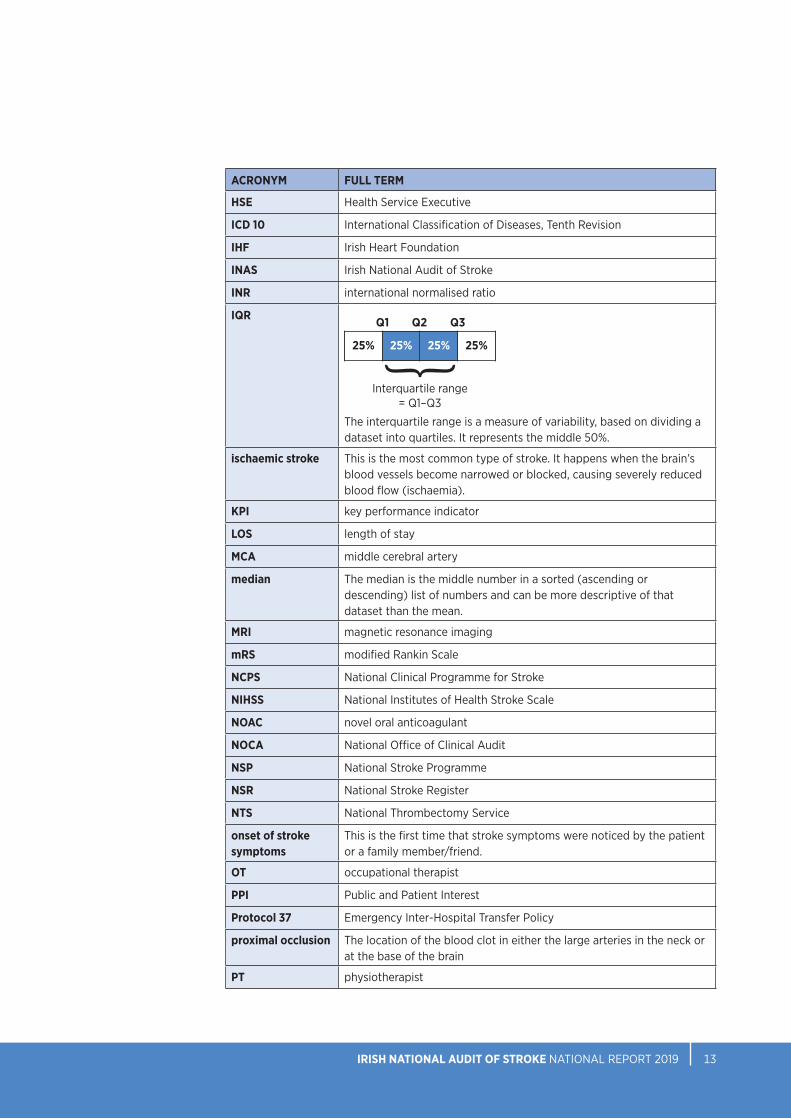
IQR
The interquartile range is a measure of variability, based on dividing a dataset into quartiles. It represents the middle 50%.
ischaemic stroke This is the most common type of stroke. It happens when the brain’s blood vessels become narrowed or blocked, causing severely reduced blood flow (ischaemia).
KPI key performance indicator
LOS length of stay
MCA middle cerebral artery
median The median is the middle number in a sorted (ascending or descending) list of numbers and can be more descriptive of that dataset than the mean.
MRI magnetic resonance imaging
mRS modified Rankin Scale
NCPS National Clinical Programme for Stroke
NIHSS National Institutes of Health Stroke Scale
NOAC novel oral anticoagulant
NOCA National Office of Clinical Audit
NSP National Stroke Programme
NSR National Stroke Register
NTS National Thrombectomy Service
onset of stroke symptoms
This is the first time that stroke symptoms were noticed by the patient or a family member/friend.
OT occupational therapist
PPI Public and Patient Interest
Protocol 37 Emergency Inter-Hospital Transfer Policy
proximal occlusion The location of the blood clot in either the large arteries in the neck or at the base of the brain
PT physiotherapist
Q1 Q2 Q3
25% 25%25% 25%
Interquartile range= Q1–Q3
}

NOCA NATIONAL OFFICE OF CLINICAL AUDIT IRISH NATIONAL AUDIT OF STROKE NATIONAL REPORT 2019 1514
ACRONYM FULL TERM
recanalisation The term used to describe when blood flow in the occluded blood vessel is restored.
subarachnoid haemorrhage
Subarachnoid haemorrhage is a life-threatening type of stroke caused by bleeding into the space surrounding the brain.
SLT speech and language therapist
SPSS Statistical Package for the Social Sciences
SSNAP Sentinel Stroke National Audit Programme
Stroke Unit A geographically discrete area in a ward where patients with a stroke are cared for by a multidisciplinary team that has specialist knowledge, protocols, training and skills in stroke care and the ability to monitor and regulate basic physiological function
thrombectomy The mechanical removal of a blood clot in the brain
thrombolysis The breakdown of blood clots formed in blood vessels using medication
Time is Brain ‘Time is Brain’ is a term that simply means that the more time passes before a patient with a stroke receives treatment, the worse the outcome will be. It also means that if the stroke is treated immediately, brain damage will be minimised.
UK United Kingdom
WTE whole time equivalent
NOCA NATIONAL OFFICE OF CLINICAL AUDIT IRISH NATIONAL AUDIT OF STROKE NATIONAL REPORT 2019 1514
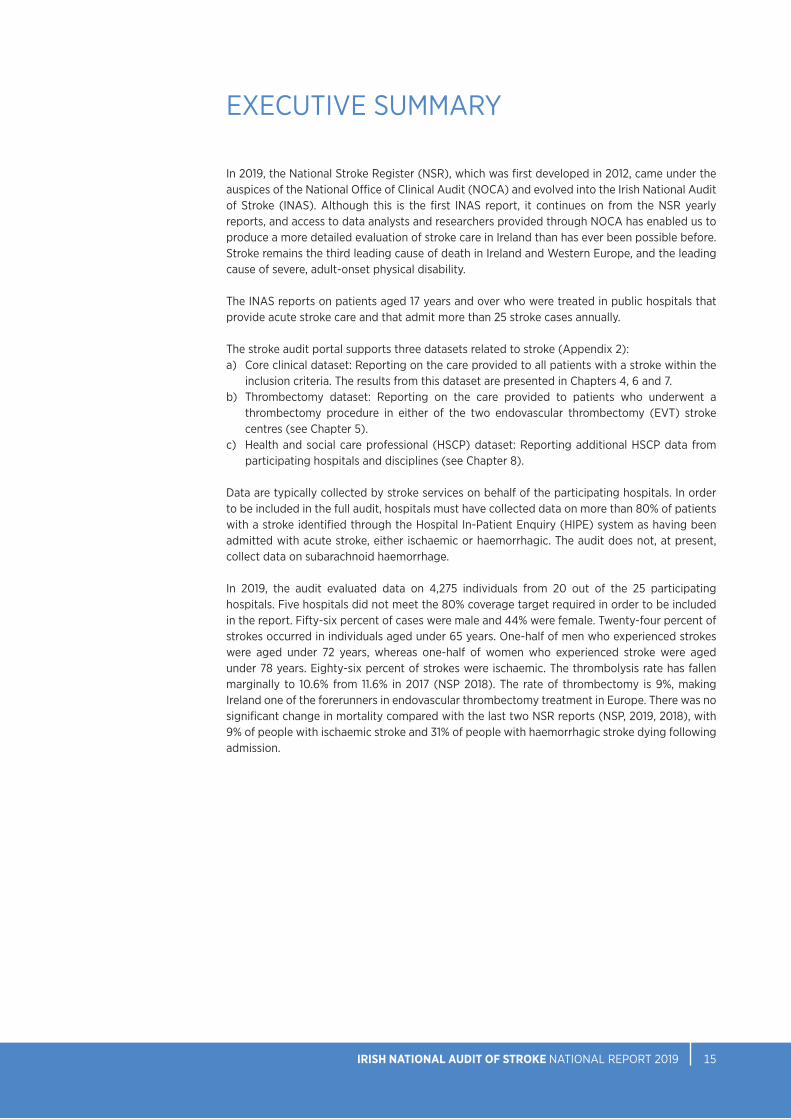
EXECUTIVE SUMMARY
In 2019, the National Stroke Register (NSR), which was first developed in 2012, came under the auspices of the National Office of Clinical Audit (NOCA) and evolved into the Irish National Audit of Stroke (INAS). Although this is the first INAS report, it continues on from the NSR yearly reports, and access to data analysts and researchers provided through NOCA has enabled us to produce a more detailed evaluation of stroke care in Ireland than has ever been possible before. Stroke remains the third leading cause of death in Ireland and Western Europe, and the leading cause of severe, adult-onset physical disability.
The INAS reports on patients aged 17 years and over who were treated in public hospitals that provide acute stroke care and that admit more than 25 stroke cases annually.
The stroke audit portal supports three datasets related to stroke (Appendix 2):a) Core clinical dataset: Reporting on the care provided to all patients with a stroke within the
inclusion criteria. The results from this dataset are presented in Chapters 4, 6 and 7.b) Thrombectomy dataset: Reporting on the care provided to patients who underwent a
thrombectomy procedure in either of the two endovascular thrombectomy (EVT) strokecentres (see Chapter 5).
c) Health and social care professional (HSCP) dataset: Reporting additional HSCP data fromparticipating hospitals and disciplines (see Chapter 8).
Data are typically collected by stroke services on behalf of the participating hospitals. In order to be included in the full audit, hospitals must have collected data on more than 80% of patients with a stroke identified through the Hospital In-Patient Enquiry (HIPE) system as having been admitted with acute stroke, either ischaemic or haemorrhagic. The audit does not, at present, collect data on subarachnoid haemorrhage.
In 2019, the audit evaluated data on 4,275 individuals from 20 out of the 25 participating hospitals. Five hospitals did not meet the 80% coverage target required in order to be included in the report. Fifty-six percent of cases were male and 44% were female. Twenty-four percent of strokes occurred in individuals aged under 65 years. One-half of men who experienced strokes were aged under 72 years, whereas one-half of women who experienced stroke were aged under 78 years. Eighty-six percent of strokes were ischaemic. The thrombolysis rate has fallen marginally to 10.6% from 11.6% in 2017 (NSP 2018). The rate of thrombectomy is 9%, making Ireland one of the forerunners in endovascular thrombectomy treatment in Europe. There was no significant change in mortality compared with the last two NSR reports (NSP, 2019, 2018), with 9% of people with ischaemic stroke and 31% of people with haemorrhagic stroke dying following admission.

NOCA NATIONAL OFFICE OF CLINICAL AUDIT IRISH NATIONAL AUDIT OF STROKE NATIONAL REPORT 2019 1716
KEY FINDINGS
>Treatment of acute stroke is time dependent, but less than one-half of cases (49%, n=1103) for which data were available arrived at hospital within 3 hours of onset of stroke symptoms, which is a decrease from 53% in 2017.
>Having arrived in hospital, two-thirds (66%, n=1989) of patients for whom data were available were seen by the medical team within 1 hour of presentation. The median time to contact with the medical team after hospital arrival was 17 minutes.
>In 2019, 94% (n=3816) of patients (excluding patients that had a stroke while in the hospital (n=211)) had a brain scan using computed tomography (CT) or magnetic resonance imaging (MRI) after stroke, and 44% (n=1600) of these were carried out within 1 hour of presentation. The median ‘door to imaging’ (DTI) time was 1 hour and 20 minutes.
>In 2019, 10.6% (n=389) of people with ischaemic strokes underwent clot-busting thrombolysis therapy, which represents a decrease from 11.6% in 2017. The national median ‘door to needle’ (DTN) time was 56 minutes.
>In 2019, 9% (n=302) of patients for whom ischaemic stroke data were available underwent thrombectomy; 97% (n=319) of thrombectomy cases for which National Institutes of Health Stroke Scale data were recorded had at least moderate stroke symptoms prior to thrombectomy.
> In 2019, 81% (n=292) of thrombectomy cases were transferred from other hospitals to EVT stroke centres.
>The median time from onset of stroke symptoms to CT scan in thrombectomy cases in 2019 was 1 hour and 39 minutes. The median time from CT angiogram (CTA) to decision time for thrombectomy was 26 minutes.
>The median time from onset of stroke symptoms to arrival at the EVT stroke centre was 1 hour and 33 minutes for patients who were admitted directly to an EVT stroke centre, and 4 hours for those who were transferred from another hospital.
>Among cases for which National Institutes of Health Stroke Scale data were recorded, the number of patients with moderate to severe stroke decreased from 100 patients pre-thrombectomy to 46 patients 24 hours post-thrombectomy. Similarly, the number of patients with severe stroke decreased from 60 patients pre-thrombectomy to 32 patients 24 hours post-thrombectomy.
>In 2019, 71% (n=3040) of patients with a stroke were admitted to a stroke unit, well below the target of 90%. The most common reasons for non-admission were: a lack of capacity, with no stroke unit bed being available in 38% (n=471) of cases; and lack of a stroke unit, with the hospital not having a stroke unit in 20% (n=249) of cases.
KEY
FIN
DIN
GS

NOCA NATIONAL OFFICE OF CLINICAL AUDIT IRISH NATIONAL AUDIT OF STROKE NATIONAL REPORT 2019 1716
>Sixty-seven percent (n=2850) of patients had the safety of their swallow screened in 2019, and of those, only 44% (n=1248) had the screen within 4 hours of admission. Patients were 1.7 times more likely to receive swallow screening and nearly twice as likely to receive mood screening if they were admitted to a stroke unit.
>Less than one-quarter (22%, n=958) of patients with a stroke had a mood screen performed; for 32% (n=1348) of patients, it was reported that mood screening was not indicated. Only 4% (n=141) of patients with a stroke who were assessed by a HSCP had a psychological assessment.
>
Most patients with a stroke were assessed by a clinical nurse specialist (84%, n=3593). Of the HSCP occupations for which data were collected, patients were most likely to have been assessed by a physiotherapist (92%, n=3426), occupational therapist (83%, n=3107), or speech and language therapist (66%, n=2473). A minority of patients were assessed by a medical social worker (26%, n=969) or dietitian (33%, n=1228).
>In 2019, 30% (n=1109) of ischaemic stroke cases had a diagnosis of atrial fibrillation (AF). Pre-stroke, 20% (n=832) of all stroke cases had a diagnosis of AF, and treatment with anticoagulant medication was reported in 83% (n=694) of these cases. Novel oral anticoagulant (NOAC) treatment was prescribed in 65% (n=452) of cases and warfarin in 17% (n=116) of cases pre-stroke.
>A total of 88% (n=3228) of patients with ischaemic stroke were prescribed antithrombotic therapy for post-stroke secondary prevention. Seventy-four percent (n=823) of patients with ischaemic stroke and with AF had antiplatelet or anticoagulant medication prescribed for secondary prevention on discharge.
>For patients with a stroke who were admitted to an acute stroke unit, the percentage of their hospital stay spent in the stroke unit was 76% – the target is 90%.
>Stroke is the leading cause of acquired disability, and the modified Rankin Scale (mRS) scores indicate that 72% (n=2262) of ischaemic stroke cases and 62% (n=317) of haemorrhagic stroke cases had disabilities on discharge. The recording of the mRS continues to improve, with a total of 86% (n=3661) of all stroke cases having both pre-stroke and discharge mRS data inputted in 2019.
>Stroke unit length of stay (LOS) varied between hospitals, and may reflect the rapid movement of patients with a stroke in and out of a stroke unit in order to accommodate new patients with a stroke. The shortage of beds was reflected in hospitals failing to hit their key performance indicator (KPI) target of spending at least 90% of their hospital admission in the stroke unit.
> More than one-half of patients (56%, n=2402) were discharged home.
KEY FIND
ING
S

NOCA NATIONAL OFFICE OF CLINICAL AUDIT IRISH NATIONAL AUDIT OF STROKE NATIONAL REPORT 2019 1918
KEY FINDINGS
> In 2019, there were six Early Supported Discharge (ESD) teams in Ireland. Only 5% of patients nationally were discharged home with ESD.
>The 2019 mortality figures for ischaemic (9%, n=315) and haemorrhagic (31%, n=193) stroke show no significant change from 2017 (NSP, 2018) or 2018 (NSP, 2019).
>Within the HSCP dataset, almost one-half of patients who were seen by a physiotherapist (49%, n=778) or by a speech and language therapist (44%, n=437) were seen on the day of or the day after hospital arrival. One-third of patients who were seen by an occupational therapist (32%, n=379) were seen on the day of or the day after hospital arrival.
>Within the HSCP dataset, physiotherapists reported that 53% (n=850) of patients were not receiving sufficient treatment intensity, occupational therapists reported that 67% (n=801) of patients were not receiving sufficient treatment intensity, and speech and language therapists reported that 57% (n=569) of patients were not receiving sufficient treatment intensity.
>About one-quarter of patients with a stroke who were assessed by a PT (n=419) or an OT (n=292) within the HSCP dataset were physically dependent following their stroke, requiring the simultaneous assistance of two therapists for rehabilitation.
>Within the HSCP dataset, occupational therapists reported that, almost one-half (46%, n=550) drove prior to admission, and 19% (n=230) were working prior to their stroke.
> Within the HSCP dataset, in 85% (n=845) of stroke cases assessed by a speech and language therapist, a swallowing or communication difficulty was diagnosed.
>Within the HSCP dataset, physiotherapists reported that 8% (n=112) of patients with a stroke required a full hoist for transfer on hospital discharge, occupational therapists reported that 10% (n=118) required full care with activities of daily living on hospital discharge, and speech and language therapists reported that 7% (n=65) required enteral feeding on hospital discharge.
>Within the HSCP dataset, all therapists reported that approximately one-half of their patient groups required follow-up therapy on discharge. There are various follow-up options available across Ireland reflected in the results, including community therapy, inpatient rehabilitation, day hospital, and ESD.KE
Y FI
ND
ING
S

NOCA NATIONAL OFFICE OF CLINICAL AUDIT IRISH NATIONAL AUDIT OF STROKE NATIONAL REPORT 2019 1918
KEY RECOMMENDATIONS
RECOMMENDATIONS FOR NOCA
• All hospitals providing acute stroke care should fully participate in the Irish NationalAudit of Stroke.
• Complete an organisational audit of stroke units to review the availability andaccessibility of stroke unit beds, the availability of the appropriate number of trainedstroke staff, and accessibility to diagnostic tests and investigations.
• Complete an audit of Early Supported Discharge services nationally.
RECOMMENDATIONS FOR THE NATIONAL STROKE PROGRAMME
• Develop a stroke awareness campaign.
• Pilot a large vessel occlusion ambulance bypass to the endovascular thrombectomystroke centres in Dublin and Cork.
RECOMMENDATIONS FOR HOSPITAL MANAGERS, CLINICIANS, AND AUDIT COORDINATORS
• Improve the level of swallow screening for patients with a stroke.
• All stroke services should have access to a clinical neuro/psychologist as part of aspecialist multidisciplinary team providing care to patients with a stroke.

NOCA NATIONAL OFFICE OF CLINICAL AUDIT IRISH NATIONAL AUDIT OF STROKE NATIONAL REPORT 2019 2120
KEY FINDINGS 2019
WHO HAS A STROKE?The average age of patients with a stroke was 72 years and 24% were aged under 65 years.
56%44%
20HOSPITALS
4275PATIENTS RECORDED
83%DATA COVERAGE
TIME IS BRAIN - EMERGENCY CARE
49% of patients arrived at hospital within 3 hours from onset of stroke symptoms.
66% of patients were seen
by a doctor within 1 hour of arrival at
hospital
44% of CT scans were performed
within 1 hour of arrival at
hospital
The median timebetween arrival at hospital and treatment with thrombolysis 56 minutes
Thrombectomy (EVT) is a procedure where large clots can be removed from arteries in the brain.In 2019, 9% of patients with a stroke had a thrombectomy. The rate of thrombectomy in Europe is 2%.
Thrombolysis is the breakdown of blood clots formed in blood vessels using medication. It can only be given within 4.5-hours of onset of stroke symptoms. In 2019, 10.6% of patients with ischaemic stroke had treatment with thrombolysis.
10.6%
9%

NOCA NATIONAL OFFICE OF CLINICAL AUDIT IRISH NATIONAL AUDIT OF STROKE NATIONAL REPORT 2019 2120
OUTCOMESSTROKE UNIT CAREA stroke unit is a ward or area within a hospital where patients with a stroke are cared for by multidisciplinary teams with expertise in managing patients with a stroke.
22% of patients had a mood screen performed.
67% of patients had a swallow screen performed.
71% of patients were admitted to a stroke unit.
The median length of stay in a stroke unit was 8 days.
MULTIDISCIPLINARY TEAM ASSESSMENTS
Clinical nurse specialist in stroke
84%
Speech and language therapist
66%
Occupational therapist
83%Dietician
33%Physiotherapist
92%Psychologist
4% Mortality rate for ischaemicstroke mortality is 9% and 31% in haemorrhagic stroke.
72% of patients with ischaemicstroke and 62% of patients withhaemorrhagic stroke haddisabilities on discharge.
51% of patients with a stroke were discharged home.
5% of patients with a stroke were discharged home with Early Supported Discharge (ESD) - stroke specific rehabilitation in the home setting. 8% of patients with a stroke were discharged to long term care.
The HSCP dataset was developed by the NSP in collaboration with the professional bodies for physiotherapy, occupational therapy, and speech and language therapy. The data represents additional rehabilitation information from 1,604 physiotherapy cases, 1,194 occupational therapy cases and 993 speech and language therapy cases in 17 participating hospitals. It is not a representation of rehabilitation for all patients with stroke.
Within the HSCP dataset Physiotherapists, Occupational therapists and Speech and language therapists reported that:
More than 50% of patients did not receive sufficient therapy.
Approximately 50% of their patient groups required follow-up therapy on discharge.
THE HEALTH AND SOCIAL CARE PROFESSIONAL(HSCP) DATASET

NOCA NATIONAL OFFICE OF CLINICAL AUDIT22
PUBLIC AND PATIENT INTEREST REPRESENTATIVE INVOLVEMENTMy name is Martin Quinn, and I am a stroke survivor. I am a native of Bansha, Co Tipperary, and have been a community activist for many years. Over the past 7 years, I have also been a stroke advocate as a result of suffering a stroke in 2013. The stroke occurred while I was doing an interview on local radio and left me unable to answer the interviewer’s questions in a coherent manner. It resulted in me having to spend many months in rehabilitation before I regained my speech and the full use of my affected limbs. The life-changing incident left me with a desire to advocate on behalf of stroke survivors, and I have been very active with the Irish Heart Foundation (IHF) in telling others about my experience and in advocating for better services for those living with the effects of stroke.
I am passionate about the need for all patients with a stroke to have immediate access to a stroke unit and for them to remain there throughout their hospital stay; this was something that I highlighted to former Minister for Health, Mr Simon Harris TD, when I met him in November 2019. I, along with my colleague Dr Rónán Collins and Mr Chris Macey of the IHF, also highlighted to the Minister the need for a new stroke awareness campaign to increase awareness of stroke symptoms; speedy access to acute treatments such as thrombectomy; and availability of, and access to, the Early Supported Discharge service, which is an international model of best care for patients with a stroke. I am very pleased that these are included as some of the key recommendations in the Irish National Audit of Stroke (INAS) report for 2019. I am delighted to be a member of the INAS Governance Committee, representing and advocating for patient and public interests in stroke care.
My name is Dr Marcia Ward and I am pleased to be involved in the INAS in the capacity of a Public and Patient Interest (PPI) Representative. As a clinical neuropsychologist, I have worked for the past 10 years in supporting individuals to live full and meaningful lives following acquired brain injury, including stroke. I work for Headway, which for more than 30 years has been Ireland’s leading non-profit organisation in helping survivors of acquired brain injury. I am involved in projects related to advocacy, education, peer support, and the provision of evidence-based intervention services to meet the varying needs of stroke survivors and their families.
This first INAS report examines the care provided to people with stroke during the acute phase of stroke, and it is clear that people hearing the important message to attend hospital as soon as stroke symptoms appear ensures the best possible outcome. There are some significant gaps in the service, however, and I see that psychological care within hospital for people with stroke is very low, with only 4% of patients having a psychological assessment in 2019. As the INAS develops, it will be important to capture the longer-term aspects of the patient journey. I believe that in order to improve services we need to listen to, learn from, and collaborate to improve the patient experience. The value placed on patient experience is evident in the inclusion of PPI representatives such as myself in national audits. The provision of reliable data to service users and service providers via audits assists in improving patient outcomes and in facilitating change in the Irish healthcare system. I look forward to continuing my involvement with the INAS.

CHAPTER 1INTRODUCTION
NOCA NATIONAL OFFICE OF CLINICAL AUDIT IRISH NATIONAL AUDIT OF STROKE NATIONAL REPORT 2019 2524
CHAPTER 1: INTRODUCTION
INTRODUCTIONStroke is the third leading cause of death in Western Europe and is the leading cause of severe long-term adult disability (The Stroke Alliance for Europe, 2020). Stroke is an important health issue for people in Ireland, with approximately 5,500 adults admitted to hospitals with a stroke in 2019. Stroke can affect people physically, emotionally and socially. It has a significant impact on Health Service Executive (HSE) resources, accounting for up to 4% of total health expenditure annually (Health Information and Quality Authority, 2017a). Although the economic costs of stroke in terms of lost employment and the cost of support in the community are significant, the impact on family members or friends who care for stroke survivors is massive. It is therefore important that all hospitals providing acute stroke services deliver high-quality and equitable stroke care.
WHAT IS A STROKE?A stroke occurs when the blood supply to part of the brain is interrupted or reduced, preventing brain tissue from getting oxygen and nutrients. Brain cells begin to die in minutes. Stroke is a medical emergency, and prompt treatment is crucial. Early action can reduce brain damage and other complications.
There are two main causes of stroke: a blocked artery (ischaemic stroke) or a blood vessel leaking or bursting (haemorrhagic stroke). Some people may have only a temporary disruption of blood flow to the brain, known as a transient ischaemic attack (TIA) that does not cause lasting symptoms.
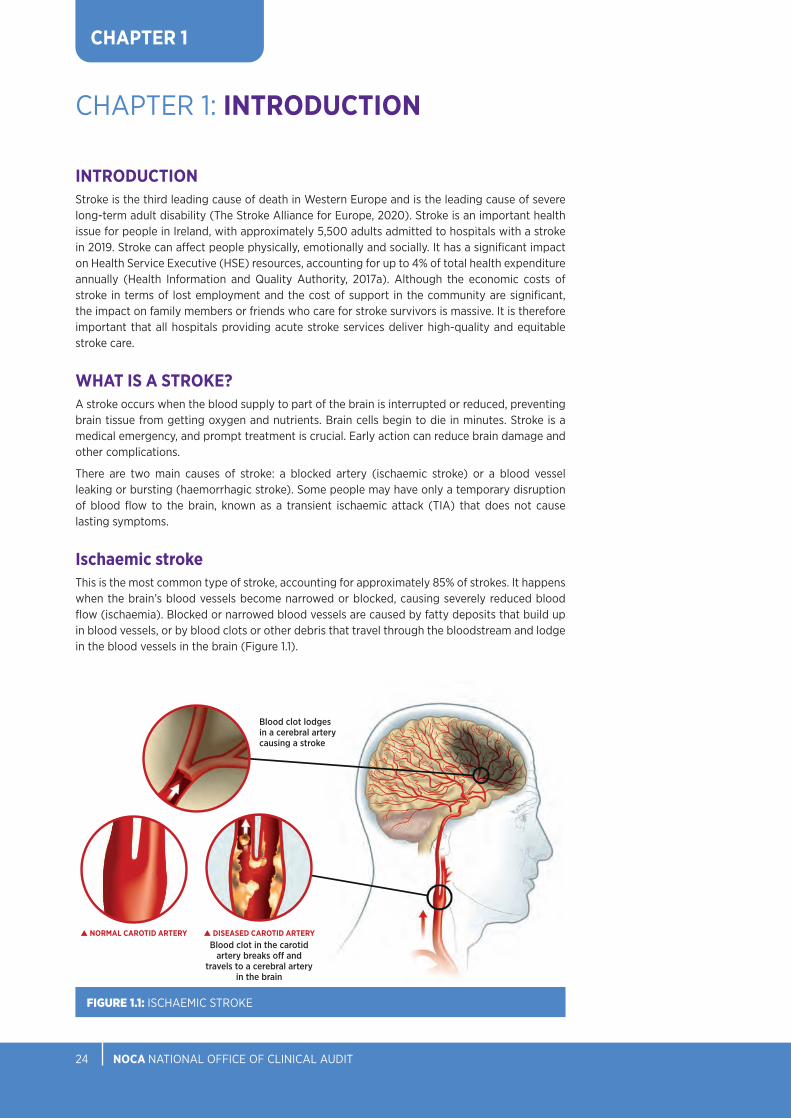
Ischaemic strokeThis is the most common type of stroke, accounting for approximately 85% of strokes. It happens when the brain’s blood vessels become narrowed or blocked, causing severely reduced blood flow (ischaemia). Blocked or narrowed blood vessels are caused by fatty deposits that build up in blood vessels, or by blood clots or other debris that travel through the bloodstream and lodge in the blood vessels in the brain (Figure 1.1).
FIGURE 1.1: ISCHAEMIC STROKE
Blood clot lodges in a cerebral artery causing a stroke
Blood clot in the carotid artery breaks off and
travels to a cerebral artery in the brain
pDISEASED CAROTID ARTERYpNORMAL CAROTID ARTERY
CHAPTER 1

NOCA NATIONAL OFFICE OF CLINICAL AUDIT IRISH NATIONAL AUDIT OF STROKE NATIONAL REPORT 2019 2524
1 On 1 January 2014, the National Casemix Programme and the Health Research and Information Division of the ESRI became the Healthcare Pricing Office (HPO).
CHAPTER 1
Haemorrhagic stroke Haemorrhagic stroke occurs when a blood vessel in the brain leaks or ruptures (Figure 1.2).
FIGURE 1.2: HAEMORRHAGIC STROKE
A rupture of the blood vessel
Haemorrhage
ESTABLISHMENT OF THE IRISH NATIONAL AUDIT OF STROKEThe HSE National Stroke Programme was established in 2010, with a mission to shape the delivery of better care through better use of resources, and in 2012, the Stroke Model of Care was published (HSE, 2012). The National Stroke Programme is also known as the National Clinical Programme for Stroke but will be referred to herein as the National Stroke Programme (NSP). In 2012, the National Stroke Register (NSR) was developed by the NSP in partnership with the Health Research and Information Division of the Economic and Social Research Institute (ESRI)1 to measure the effect of the implementation of the Stroke Model of Care. Through collaboration with the Hospital In-Patient Enquiry’s (HIPE’s) existing information system and the addition of a stroke-specific data entry system, the NSR provided data for planning and estimation of resource requirements for stroke services, for evaluation, and for clinical audits. The NSR has evolved to include data collection on thrombectomy and on discipline-specific rehabilitation metrics. The integration of quality improvement initiatives throughout the system highlighted the importance of national clinical audit to improve stroke pathways of care for patients with a stroke. In 2019, governance of the NSR was transferred to the National Office of Clinical Audit (NOCA).
NATIONAL OFFICE OF CLINICAL AUDIT (NOCA)NOCA enables the Irish healthcare system to continually improve by maintaining a portfolio of prioritised national clinical audits measured against national and international standards. By making reliable data available to those who use, manage and deliver healthcare, clinical audits

NOCA NATIONAL OFFICE OF CLINICAL AUDIT IRISH NATIONAL AUDIT OF STROKE NATIONAL REPORT 2019 2726
help to refine Irish healthcare, improve patient outcomes, and achieve change at local and national level. NOCA works to promote an open culture of shared learning from national clinical audit in order to improve clinical outcomes and patient safety.
NOCA is funded by the Health Service Executive National Quality Improvement Team, governed by an independent voluntary board, and operationally supported by the Royal College of Surgeons in Ireland (RCSI) (Figure 1.3).
FIGURE 1.3: GOVERNANCE AND MANAGEMENT TEAMS FOR NOCA AUDITS
Noca governance structure
External reporting
Noca management structure
Contractual relationship
NOCA Governance BoardHSE National Quality
Improvement TeamRCSI
Department of Surgical
Affairs Managing Director
NOCA Executive Director
NOCA Clinical Director
Clinical Audit Governance Committee
NOCA Clinical Lead
NOCA Audit Manager
NOCA Executive Team
CHAPTER 1

NOCA NATIONAL OFFICE OF CLINICAL AUDIT IRISH NATIONAL AUDIT OF STROKE NATIONAL REPORT 2019 2726
CHAPTER 1
IRISH NATIONAL AUDIT OF STROKE GOVERNANCE COMMITTEEIn 2019, governance of the NSR was transferred to NOCA and was renamed the Irish National Audit of Stroke (INAS). Professor Joe Harbison was appointed Irish National Audit of Stroke Clinical Lead and the INAS Governance Committee was established (Appendix 1). Its membership comprises clinical experts, Public and Patient Interest representatives, the HPO, senior accountable healthcare management, and research and specialist bodies. The purpose of the INAS Governance Committee is to oversee the national clinical audit by:
• shaping the strategic direction of the INAS
• ensuring that the INAS complies with all legal and statutory requirements, such as freedom of information and data protection
• overseeing compliance with key NOCA policies, e.g. the NOCA Monitoring and Escalation Policy
• providing assurance to the NOCA Governance Board on identification and management of INAS risks
• reviewing and agreeing content of INAS annual reports before forwarding reports for review and sign-off by the NOCA Governance Board
• monitoring staffing needs for the INAS, both in NOCA and at hospital level, and supporting requests for staff as service grows
• acting as an escalation point for subcommittees of the INAS Governance Committee and the INAS Clinical Lead
• ensuring that the INAS adheres to the highest standards of corporate and social responsibility.
The Clinical Lead, supported by the NOCA Executive Team, has operational responsibility for implementation of the INAS.

NOCA NATIONAL OFFICE OF CLINICAL AUDIT IRISH NATIONAL AUDIT OF STROKE NATIONAL REPORT 2019 2928
AIM AND OBJECTIVES OF THE INASThe INAS Governance Committee developed the aim and objectives for the INAS (Table 1.1). The Governance Committee ensures that these objectives are met and that confidential processes are upheld. The INAS Governance Committee also ensures that all relevant stakeholders are represented, in order to verify that outputs of the audit findings are interpreted appropriately.
OBJECTIVE 3
To disseminate the outputs from the data in a timely manner to all relevant stakeholders.
OBJECTIVE 2
To support the collection of high-quality data on all inpatient strokes in Ireland in order to permit local and national reporting of outcomes.
OBJECTIVE 4
To benchmark stroke care and outcomes against national and international standards.
OBJECTIVE 5
To support/promote the use of stroke data for quality improvement initiatives at local and national level.
OBJECTIVE 6
To provide data to support and inform national policy for stroke and related conditions.
OBJECTIVE 1
To maintain a database of all inpatients with a stroke in Ireland in order to drive continuous quality improvement and to deliver the best patient outcomes.
AIMTo conduct
audit of stroke care, including
clinical care and service
organisation.
CHAPTER 1
TABLE 1.1: IRISH NATIONAL AUDIT OF STROKE AIM AND OBJECTIVES
NOCA NATIONAL OFFICE OF CLINICAL AUDIT IRISH NATIONAL AUDIT OF STROKE NATIONAL REPORT 2019 2928
CHAPTER 1
WHO IS THIS REPORT AIMED AT?The INAS annual report is intended for use by a wide range of individuals and organisations, including:
1. patients and carers; patient advocacy organisations
2. healthcare professionals; hospital managers; Hospital Groups
3. policy-makers
4. researchers.
The report has been designed in two parts:
1. The Irish National Audit of Stroke Report 2019 presents our key findings on the INAS, case mix, patient pathway and outcomes.
2. The Irish National Audit of Stroke Report 2019: Summary Report will be of particular interest to patients, patient organisations and the public.

NOCA NATIONAL OFFICE OF CLINICAL AUDIT IRISH NATIONAL AUDIT OF STROKE NATIONAL REPORT 2019 3130
NOTE: Dublin Hospitals have been displayed collectively by hospital group
SAOLTA UNIVERSITY HEALTH CARE GROUPLetterkenny University HospitalMayo University HospitalSligo University HospitalPortiuncula University Hospital University Hospital Galway
RCSI HOSPITALSBeaumont HospitalCavan General HospitalConnolly HospitalOur Lady of Lourdes Hospital, Drogheda
DUBLIN MIDLANDS HOSPITAL GROUPTallaght University HospitalNaas General HospitalSt James’s Hospital
IRELAND EAST HOSPITAL GROUPOur Lady’s Hospital, Navan Mater Misericordiae University HospitalRegional Hospital MullingarSt Luke’s General Hospital, Carlow/KilkennySt Vincent’s University HospitalWexford General Hospital
UL HOSPITAL GROUPUniversity Hospital Limerick
SOUTH/SOUTH WEST HOSPITAL GROUPBantry General HospitalCork University HospitalUniversity Hospital KerryMercy University HospitalSouth Tipperary General HospitalUniversity Hospital Waterford
LETTERKENNY UNIVERSITY HOSPITAL
CLINICAL LEAD: Dr Ken Mulpeter
AUDIT COORDINATOR: Christine McLaughlin
MAYO UNIVERSITY HOSPITAL
CLINICAL LEAD: Dr Tom O’Malley
AUDIT COORDINATOR: Niamh Murtagh
SLIGO UNIVERSITY HOSPITAL
CLINICAL LEAD: Dr Paula Hickey
AUDIT COORDINATOR: Una Moffatt
UNIVERSITY HOSPITAL LIMERICK
CLINICAL LEAD: Dr Margaret O’Connor
AUDIT COORDINATOR: Nora Cunningham
AUDIT COORDINATOR: Ingrid O’Brien
AUDIT COORDINATOR: Shiji Paulose
UNIVERSITY HOSPITAL KERRY
CLINICAL LEAD: Dr Richard Liston
AUDIT COORDINATOR: Mary Donovan
CORK UNIVERSITY HOSPITAL
CLINICAL LEAD: Dr Simon Cronin
CLINICAL LEAD: Dr Liam Healy
AUDIT COORDINATOR: Glen Arrigan
AUDIT COORDINATOR: Karena Hayes
UNIVERSITY HOSPITAL WATERFORD
CLINICAL LEAD: Prof. Riona Mulcahy
CLINICAL LEAD: Dr George Pope
AUDIT COORDINATOR: Breda Jones
SOUTH TIPPERARY GENERAL HOSPITAL
CLINICAL LEAD: Dr Christine Donnelly
AUDIT COORDINATOR: Bency Varghese
MERCY UNIVERSITY HOSPITAL
CLINICAL LEAD: Dr Kieran O'Connor
AUDIT COORDINATOR: Inês Saramago
Each hospital that participates in the INAS should have a local governance committee that includes a clinical lead and an audit coordinator (Table 1.2). We would like to acknowledge the work of those who are involved in producing high-quality data – particularly the audit coordinators – and the efforts of interdisciplinary teams in each hospital to ensure that the stroke pathway for patients is continuously monitored and improved.
HOSPITALS AND PEOPLE WE WORK WITH
UNIVERSITY HOSPITAL GALWAY
CLINICAL LEAD: Dr Niamh Hannon
AUDIT COORDINATOR: Vacant position
PORTIUNCULA HOSPITAL
CLINICAL LEAD: Dr Niamh Hannon
AUDIT COORDINATOR: Mary Diskin
BANTRY GENERAL HOSPITAL
CLINICAL LEAD: Dr Brian Carey
AUDIT COORDINATOR: Noreen Lynch
CHAPTER 1

NOCA NATIONAL OFFICE OF CLINICAL AUDIT IRISH NATIONAL AUDIT OF STROKE NATIONAL REPORT 2019 3130
BEAUMONT HOSPITAL
CLINICAL LEAD: Dr Barry Moynihan
CLINICAL LEAD: Prof. John Thornton
AUDIT COORDINATOR: Emma Hickey
AUDIT COORDINATOR: Julie Lynch
AUDIT COORDINATOR: Leonie Weekes
CAVAN GENERAL HOSPITAL
CLINICAL LEAD: Dr John Corrigan
AUDIT COORDINATOR: Frances Smith
CONNOLLY HOSPITAL
CLINICAL LEAD: Dr Eamon Dolan
AUDIT COORDINATOR: Lisa Donaghy
CLINICAL LEAD: Dr Olwyn Lynch
CLINICAL LEAD: Dr Martin Mulroy
AUDIT COORDINATOR: Fiona Connaughton
OUR LADY OF LOURDES HOSPITAL, DROGHEDA
ST VINCENT’S UNIVERSITY HOSPITAL
CLINICAL LEAD: Dr Tim Cassidy
AUDIT COORDINATOR: Imelda Noone
AUDIT COORDINATOR: Mary Kate Meagher
WEXFORD GENERAL HOSPITAL
CLINICAL LEAD: Dr Eithne Harkin
AUDIT COORDINATOR: Elaine Crosby
CLINICAL LEAD: Dr Sean Murphy
AUDIT COORDINATOR: Caroline Deegan
MATER MISERICORDIAE UNIVERSITY HOSPITAL
REGIONAL HOSPITAL MULLINGAR
CLINICAL LEAD: Dr Clare Fallon
AUDIT COORDINATOR: Sinead Gallagher
ST LUKE’S GENERAL HOSPITAL
CLINICAL LEAD: Dr Paul Cotter
AUDIT COORDINATOR: Ann Flahive
TALLAGHT UNIVERSITY HOSPITAL
CLINICAL LEAD: Prof. Rónán Collins
AUDIT COORDINATOR: Nicola Cogan
AUDIT COORDINATOR: Helen Hobson
AUDIT COORDINATOR: Suzanne Dunne
NAAS GENERAL HOSPITAL
CLINICAL LEAD: Dr Paul O’Brien
AUDIT COORDINATOR: Trish Daly
ST JAMES’S HOSPITAL
CLINICAL LEAD: Prof. Joe Harbison
AUDIT COORDINATOR: Roisin Kelly
OUR LADY'S HOSPITAL, NAVAN
CLINICAL LEAD: Vacant position
AUDIT COORDINATOR: Mary Flanagan
CHAPTER 1


CHAPTER 2METHODOLOGY

NOCA NATIONAL OFFICE OF CLINICAL AUDIT IRISH NATIONAL AUDIT OF STROKE NATIONAL REPORT 2019 3534
CHAPTER 2: METHODOLOGYThe INAS collects additional stroke-specific data on patients with a stroke through a stroke audit portal on the HIPE system in collaboration with the HPO. The dataset has three sections (Appendix 2):
a) core clinical datasetb) thrombectomy datasetc) health and social care professional (HSCP) dataset.
Chapters 4, 6 and 7 of this document will report on the core clinical dataset. Chapter 5 will report on the thrombectomy dataset and Chapter 8 will report on the HSCP dataset.
The reference population for the national report includes patients aged 17 years and over, who were treated in public hospitals, providing acute stroke care and that admit more than 25 stroke cases annually. Data from the HIPE system, such as age, gender, admission source, etc., are merged with additional INAS data, such as hospital arrival and stroke unit admission data. An extract of data for the national report is sent to NOCA from the HPO, with the cases anonymised.
INCLUSION CRITERIAAnalysis is based on records as captured on the HIPE Stroke Audit Portal software. It includes cases that were:
i discharged between 1 January 2019 and 31 December 2019, inclusiveii diagnosed, on HIPE, with International Classification of Diseases, Tenth Revision (ICD 10)
codes I61 or I63 or I64 as a principal diagnosis2
iii aged 17 years and overiv core clinical dataset – all cases with the stroke unit field populated with either ‘1=Yes’ or
‘2=No’ within the stroke audit portalv thrombectomy dataset – all cases with the thrombectomy field populated with ‘1=Yes’ within
the stroke audit portalvi HSCP dataset – all cases with ‘1=Yes’ populated for seen by physiotherapist and/or occupational
therapist and/or speech and language therapist within the stroke audit portal.
EXCLUSION CRITERIAi patients aged 16 years and underii hospitals with fewer than 25 cases of acute stroke admitted in the reporting periodiii core clinical dataset – hospitals with less than 80% coverage of stroke cases on the stroke
audit portaliv core clinical dataset – patients who had a thrombectomy in Beaumont Hospital and were
transferred back to the referring hospital on the same day.
HIPE
HIPE
CHAPTER 2
2 The principal diagnosis on HIPE is defined as “The diagnosis established after study to be chiefly responsible for occasioning an episode of admitted patient care, an episode of residential care or an attendance at the health care establishment, as represented by a code” (National Casemix and Classification Centre, 2013).
NOCA NATIONAL OFFICE OF CLINICAL AUDIT IRISH NATIONAL AUDIT OF STROKE NATIONAL REPORT 2019 3534
CHAPTER 2
DATA ENTRYEach hospital has an audit coordinator and a clinical lead who leads on stroke service governance within the hospital. The audit coordinator enters the core clinical data through the HIPE Stroke Audit Portal in the individual hospital. A list of cases eligible for inclusion is identified by running a HIPE Discharge Report within the HIPE Stroke Audit Portal. Additional cases may be identified manually. Most data are entered retrospectively.
Thrombectomy data are entered by the audit coordinators in the endovascular thrombectomy (EVT) stroke centres in Beaumont Hospital and Cork University Hospital.
HSCP data are entered by discipline (i.e. physiotherapy, occupational therapy, speech and language therapy) in participating hospitals. The HSCP data collection began in 2018 and remains in the implementation phase; it will take time for data collection and reporting to become embedded into practice in all hospitals.
The final date for submission of 2019 data was 30 April 2020, after which the HIPE file was closed.
DATA VALIDATIONIn 2019, the NOCA statistical analysis team developed a data validation process for the INAS core clinical dataset. This process involves the data analyst producing a report of any missing information within the data and any data anomalies. The report is sent to the audit coordinators, who amend the record. A pilot Data Validation Report (DVR) was successfully implemented in two hospitals in January 2020. In February 2020, a limited version of the DVR was sent to each hospital for completion prior to the close of the HIPE file. All missing data for 2019 will be reported. In 2020, DVRs will be sent to hospitals quarterly in order to reduce missing data and data anomalies, thus improving data quality.
DATA ANALYSISThe full stroke audit portal 2019 data extract was received from the HPO by NOCA on 15 May 2020, and analysis was completed by the NOCA Data Analyst following data checks with the HPO. The analysis was conducted using Statistical Package for the Social Sciences (SPSS) V25.

NOCA NATIONAL OFFICE OF CLINICAL AUDIT IRISH NATIONAL AUDIT OF STROKE NATIONAL REPORT 2019 3736

NOCA NATIONAL OFFICE OF CLINICAL AUDIT IRISH NATIONAL AUDIT OF STROKE NATIONAL REPORT 2019 3736
CHAPTER 3DATA
QUALITYRelevance
Accessibility and clarity
Timeliness and punctuality
Coherence and comparability
Accuracy and reliability
NOCA NATIONAL OFFICE OF CLINICAL AUDIT IRISH NATIONAL AUDIT OF STROKE NATIONAL REPORT 2019 3938
CHAPTER 3: DATA QUALITY
CHAPTER 3
Governance of the NSR was transferred from the HSE NSP to NOCA in October 2019. It was renamed the Irish National Audit of Stroke (INAS), and the INAS Governance Committee was established to oversee the development of the audit. Many new data quality measures will be implemented in 2020, and reporting of 2019 data will include identification of any data quality concerns or anomalies.
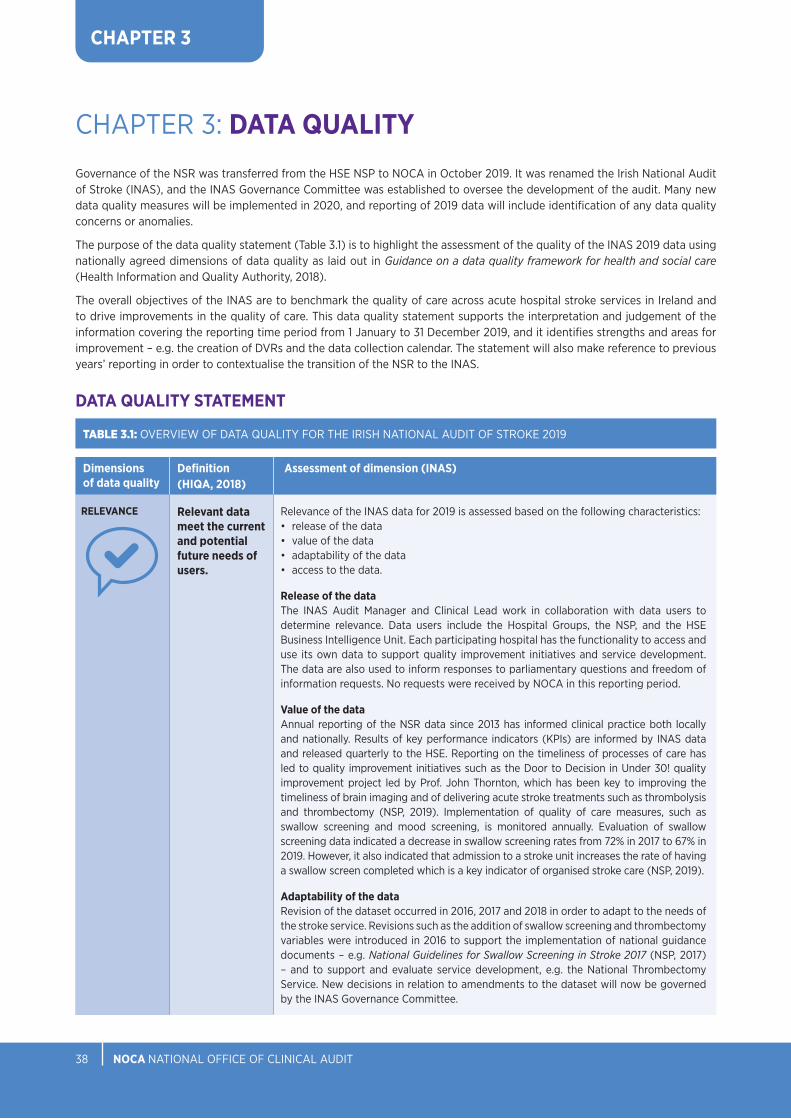
The purpose of the data quality statement (Table 3.1) is to highlight the assessment of the quality of the INAS 2019 data using nationally agreed dimensions of data quality as laid out in Guidance on a data quality framework for health and social care (Health Information and Quality Authority, 2018).
The overall objectives of the INAS are to benchmark the quality of care across acute hospital stroke services in Ireland and to drive improvements in the quality of care. This data quality statement supports the interpretation and judgement of the information covering the reporting time period from 1 January to 31 December 2019, and it identifies strengths and areas for improvement – e.g. the creation of DVRs and the data collection calendar. The statement will also make reference to previous years’ reporting in order to contextualise the transition of the NSR to the INAS.
DATA QUALITY STATEMENT
TABLE 3.1: OVERVIEW OF DATA QUALITY FOR THE IRISH NATIONAL AUDIT OF STROKE 2019
Assessment of dimension (INAS)Definition (HIQA, 2018)
Dimensions of data quality
Relevant data meet the current and potential future needs of users.
Relevance of the INAS data for 2019 is assessed based on the following characteristics: • release of the data• value of the data• adaptability of the data• access to the data.
Release of the dataThe INAS Audit Manager and Clinical Lead work in collaboration with data users to determine relevance. Data users include the Hospital Groups, the NSP, and the HSE Business Intelligence Unit. Each participating hospital has the functionality to access and use its own data to support quality improvement initiatives and service development. The data are also used to inform responses to parliamentary questions and freedom of information requests. No requests were received by NOCA in this reporting period.
Value of the dataAnnual reporting of the NSR data since 2013 has informed clinical practice both locally and nationally. Results of key performance indicators (KPIs) are informed by INAS data and released quarterly to the HSE. Reporting on the timeliness of processes of care has led to quality improvement initiatives such as the Door to Decision in Under 30! quality improvement project led by Prof. John Thornton, which has been key to improving the timeliness of brain imaging and of delivering acute stroke treatments such as thrombolysis and thrombectomy (NSP, 2019). Implementation of quality of care measures, such as swallow screening and mood screening, is monitored annually. Evaluation of swallow screening data indicated a decrease in swallow screening rates from 72% in 2017 to 67% in 2019. However, it also indicated that admission to a stroke unit increases the rate of having a swallow screen completed which is a key indicator of organised stroke care (NSP, 2019).
Adaptability of the dataRevision of the dataset occurred in 2016, 2017 and 2018 in order to adapt to the needs of the stroke service. Revisions such as the addition of swallow screening and thrombectomy variables were introduced in 2016 to support the implementation of national guidance documents – e.g. National Guidelines for Swallow Screening in Stroke 2017 (NSP, 2017) – and to support and evaluate service development, e.g. the National Thrombectomy Service. New decisions in relation to amendments to the dataset will now be governed by the INAS Governance Committee.
RELEVANCE

NOCA NATIONAL OFFICE OF CLINICAL AUDIT IRISH NATIONAL AUDIT OF STROKE NATIONAL REPORT 2019 3938
CHAPTER 3
Assessment of dimension (INAS)Definition (HIQA, 2018)
Dimensions of data quality
The addition of a HSCP dataset to assess discipline-specific variables for physiotherapy, occupational therapy, and speech and language therapy came into effect in 2018 following extensive collaboration with discipline-specific professional bodies.
In 2019, NOCA, in collaboration with the NSP, submitted a proposal for funding through the Health Research Board’s Applied Partnership Awards to develop an internationally benchmarked core minimum dataset for the INAS. This submission was successful and the INAS has secured the resource of 1.4 whole time equivalent research posts for 24 months to optimise the current dataset, and plans to further develop the audit to include post-acute rehabilitation along with patient-reported outcome measures. This project is due to commence in Janary 2021, and the partnership approach will ensure that the dataset will be adaptable and useful to users.
Access to the dataAccess to data from the NSR has been limited to date due to inadequate resourcing and governance. All data requests for research and service evaluation will now be supported by NOCA’s policies and procedures. No research data requests were received in 2019 after the transfer of governance of the NSR to NOCA.
The accuracy of data refers to how closely the data correctly describe what they were designed to measure.Reliability refers to whether those data consistently measure, over time, the reality of the metrics that they were designed to represent.
The accuracy and reliability of INAS data for 2019 is assessed based on the following characteristics: • coverage • data capture and collection • data completeness and validity.
CoverageThe INAS collects data on patients with acute stroke through a stroke audit portal in the HIPE system in collaboration with the HPO. The reference population for the national report includes patients aged 17 years and over, with a principal diagnosis of ICD 10 codes I61, I63 or I64, who are admitted to any of the 25 public hospitals providing acute stroke services to more than 25 patients annually. Data on subarachnoid haemorrhage or traumatic haemorrhage are not collected.
The stroke audit portal has three distinct datasets:• core clinical dataset• thrombectomy dataset • HSCP dataset.
Core clinical datasetThe core clinical dataset comprises additional clinical data that are collected for all eligible stroke cases.
Full coverage is defined as when all acute stroke admissions coded with stroke as a principal diagnosis (ICD 10 codes I61, I63 or I64) in the HIPE system have additional clinical information submitted to the stroke audit portal. Cases that were transferred to an endovascular thrombectomy centre for a thrombectomy and then transferred directly back to the referring hospital are excluded from the denominator when calculating the performance and quality indicators within this report. This will also avoid double counting. The expected standard for inclusion in INAS reporting is a minimum of 80% coverage of stroke cases.
In 2019, HIPE recorded 5,356 stroke cases in the 25 participating hospitals. Of these, 4,444 had additional core clinical data submitted. This gives a national coverage rate of 83%. Hospitals must have at least 80% coverage to be included in the analysis. Twenty participating hospitals had at least 80% coverage for 2019, and data from these hospitals (N=4275 cases) informed the analysis of this report (Table 3.2).
ACCURACY AND RELIABILITY
RELEVANCE
NOCA NATIONAL OFFICE OF CLINICAL AUDIT IRISH NATIONAL AUDIT OF STROKE NATIONAL REPORT 2019 4140
CHAPTER 3
Assessment of dimension (INAS)Definition (HIQA, 2018)
Dimensions of data quality
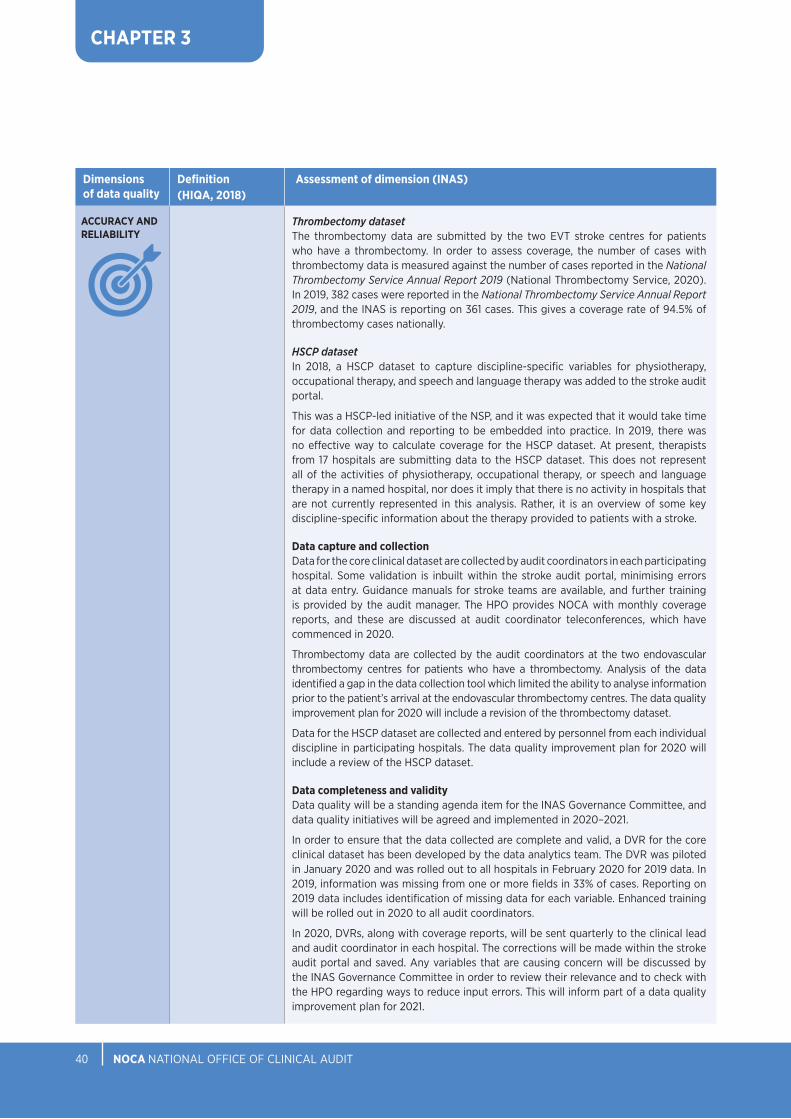
Thrombectomy datasetThe thrombectomy data are submitted by the two EVT stroke centres for patients who have a thrombectomy. In order to assess coverage, the number of cases with thrombectomy data is measured against the number of cases reported in the National Thrombectomy Service Annual Report 2019 (National Thrombectomy Service, 2020). In 2019, 382 cases were reported in the National Thrombectomy Service Annual Report 2019, and the INAS is reporting on 361 cases. This gives a coverage rate of 94.5% of thrombectomy cases nationally.
HSCP datasetIn 2018, a HSCP dataset to capture discipline-specific variables for physiotherapy, occupational therapy, and speech and language therapy was added to the stroke audit portal.
This was a HSCP-led initiative of the NSP, and it was expected that it would take time for data collection and reporting to be embedded into practice. In 2019, there was no effective way to calculate coverage for the HSCP dataset. At present, therapists from 17 hospitals are submitting data to the HSCP dataset. This does not represent all of the activities of physiotherapy, occupational therapy, or speech and language therapy in a named hospital, nor does it imply that there is no activity in hospitals that are not currently represented in this analysis. Rather, it is an overview of some key discipline-specific information about the therapy provided to patients with a stroke.
Data capture and collectionData for the core clinical dataset are collected by audit coordinators in each participating hospital. Some validation is inbuilt within the stroke audit portal, minimising errors at data entry. Guidance manuals for stroke teams are available, and further training is provided by the audit manager. The HPO provides NOCA with monthly coverage reports, and these are discussed at audit coordinator teleconferences, which have commenced in 2020.
Thrombectomy data are collected by the audit coordinators at the two endovascular thrombectomy centres for patients who have a thrombectomy. Analysis of the data identified a gap in the data collection tool which limited the ability to analyse information prior to the patient’s arrival at the endovascular thrombectomy centres. The data quality improvement plan for 2020 will include a revision of the thrombectomy dataset.
Data for the HSCP dataset are collected and entered by personnel from each individual discipline in participating hospitals. The data quality improvement plan for 2020 will include a review of the HSCP dataset.
Data completeness and validityData quality will be a standing agenda item for the INAS Governance Committee, and data quality initiatives will be agreed and implemented in 2020–2021.
In order to ensure that the data collected are complete and valid, a DVR for the core clinical dataset has been developed by the data analytics team. The DVR was piloted in January 2020 and was rolled out to all hospitals in February 2020 for 2019 data. In 2019, information was missing from one or more fields in 33% of cases. Reporting on 2019 data includes identification of missing data for each variable. Enhanced training will be rolled out in 2020 to all audit coordinators.
In 2020, DVRs, along with coverage reports, will be sent quarterly to the clinical lead and audit coordinator in each hospital. The corrections will be made within the stroke audit portal and saved. Any variables that are causing concern will be discussed by the INAS Governance Committee in order to review their relevance and to check with the HPO regarding ways to reduce input errors. This will inform part of a data quality improvement plan for 2021.
ACCURACY AND RELIABILITY
NOCA NATIONAL OFFICE OF CLINICAL AUDIT IRISH NATIONAL AUDIT OF STROKE NATIONAL REPORT 2019 4140
CHAPTER 3
Assessment of dimension (INAS)Definition (HIQA, 2018)
Dimensions of data quality
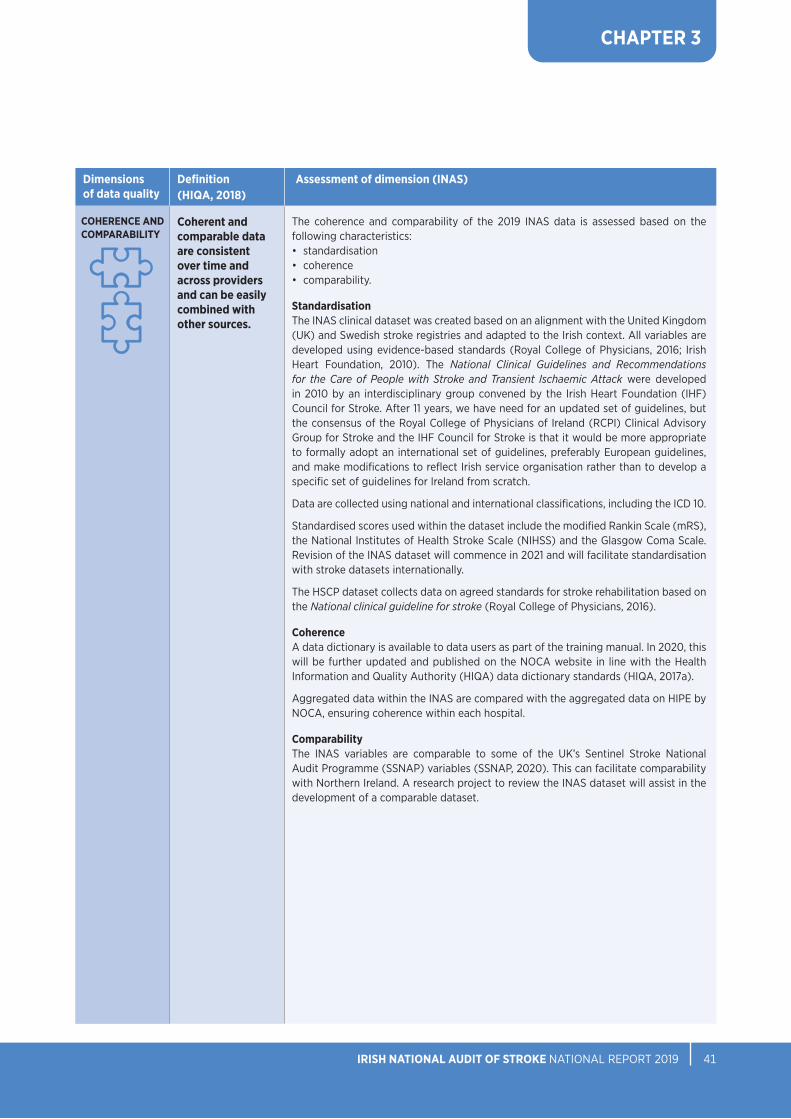
Coherent and comparable data are consistent over time and across providers and can be easily combined with other sources.
The coherence and comparability of the 2019 INAS data is assessed based on the following characteristics: • standardisation• coherence• comparability.
StandardisationThe INAS clinical dataset was created based on an alignment with the United Kingdom (UK) and Swedish stroke registries and adapted to the Irish context. All variables are developed using evidence-based standards (Royal College of Physicians, 2016; Irish Heart Foundation, 2010). The National Clinical Guidelines and Recommendations for the Care of People with Stroke and Transient Ischaemic Attack were developed in 2010 by an interdisciplinary group convened by the Irish Heart Foundation (IHF) Council for Stroke. After 11 years, we have need for an updated set of guidelines, but the consensus of the Royal College of Physicians of Ireland (RCPI) Clinical Advisory Group for Stroke and the IHF Council for Stroke is that it would be more appropriate to formally adopt an international set of guidelines, preferably European guidelines, and make modifications to reflect Irish service organisation rather than to develop a specific set of guidelines for Ireland from scratch.
Data are collected using national and international classifications, including the ICD 10.
Standardised scores used within the dataset include the modified Rankin Scale (mRS), the National Institutes of Health Stroke Scale (NIHSS) and the Glasgow Coma Scale. Revision of the INAS dataset will commence in 2021 and will facilitate standardisation with stroke datasets internationally.
The HSCP dataset collects data on agreed standards for stroke rehabilitation based on the National clinical guideline for stroke (Royal College of Physicians, 2016).
CoherenceA data dictionary is available to data users as part of the training manual. In 2020, this will be further updated and published on the NOCA website in line with the Health Information and Quality Authority (HIQA) data dictionary standards (HIQA, 2017a).
Aggregated data within the INAS are compared with the aggregated data on HIPE by NOCA, ensuring coherence within each hospital.
ComparabilityThe INAS variables are comparable to some of the UK’s Sentinel Stroke National Audit Programme (SSNAP) variables (SSNAP, 2020). This can facilitate comparability with Northern Ireland. A research project to review the INAS dataset will assist in the development of a comparable dataset.
COHERENCE AND COMPARABILITY

NOCA NATIONAL OFFICE OF CLINICAL AUDIT IRISH NATIONAL AUDIT OF STROKE NATIONAL REPORT 2019 4342
Assessment of dimension (INAS)Definition (HIQA, 2018)
Dimensions of data quality
Timely data are collected within a reasonable agreed time period after the activity that they measure. Punctuality refers to whether data are delivered on the dates promised, advertised, or announced.
For 2019 discharges, all submissions were expected to be entered by the close of the HIPE file on 30 April 2020.
For 2020, it has been agreed that all submissions will be entered in the system within the quarter following discharge from hospital.
Data entry targets will be reviewed quarterly at each INAS Governance Committee meeting. The final data entry date is linked to the HIPE closure date for the reporting year and is updated annually.
TIMELINESS AND PUNCTUALITY
CHAPTER 3
Data are easily obtainable and clearly presented in a way that can be understood.
There are several inbuilt reports on the stroke audit portal that can be run by the audit coordinator at hospital level. Stroke audit portal data can be exported locally into Excel for further analysis. Access to the data for research or service evaluation is managed by the Audit Manager following NOCA data access policies.
The 2017 and 2018 NSR annual reports are available on the HSE website (https://www.hse.ie/eng/about/who/cspd/ncps/stroke/resources/). The INAS National Report 2019 will be available on the NOCA website (www.noca.ie).
The plan for quarterly reporting is to develop a dashboard-style reporting system to make data interpretation as user-friendly as possible. This is scheduled for Q4 2020.
Ongoing work is underway to update the INAS data dictionary in line with HIQA standards (2018).
ACCESSIBILITY AND CLARITY

NOCA NATIONAL OFFICE OF CLINICAL AUDIT IRISH NATIONAL AUDIT OF STROKE NATIONAL REPORT 2019 4342
DATA COVERAGECoverage is defined as the number of stroke cases with ICD 10 diagnosis codes of I61, I63 or I64 as the principal diagnosis which have additional stroke audit data added to them, and which meet the inclusion criteria detailed in Chapter 2. Five participating hospitals were excluded from the analysis in 2019 as they did not reach the 80% coverage target. In 2019, 4,275 cases from 20 participating hospitals are included.
CHAPTER 3
Hospital Stroke audit portal
HIPE Coverage
Cavan General Hospital 130 130 100%
South Tipperary General Hospital 109 109 100%
Mayo University Hospital 198 198 100%
Mercy University Hospital 96 96 100%
Beaumont Hospital 470 470 100%
University Hospital Limerick 270 271 100%
Connolly Hospital 196 199 99%
Sligo University Hospital 177 182 97%
Letterkenny University Hospital 173 179 97%
Tallaght University Hospital 240 250 96%
Wexford General Hospital 142 149 95%
Cork University Hospital 483 508 95%
University Hospital Waterford 136 143 95%
Our Lady’s Hospital, Navan 76 84 91%
St James’s Hospital 245 271 90%
Our Lady of Lourdes Hospital Drogheda 192 213 90%
Bantry General Hospital 91 101 90%
Naas General Hospital 183 213 86%
St Vincent’s University Hospital 362 435 83%
Mater Misericordiae University Hospital 306 375 82%
St Luke’s General Hospital, Carlow/Kilkenny* 71 116 61%
University Hospital Kerry* 61 148 41%
Portiuncula University Hospital* 16 67 24%
University Hospital Galway* 21 306 7%
Regional Hospital Mullingar* 0 143 0%
National 4444 5356 83%
*Excluded from the 2019 analysis due to <80% coverage.
TABLE 3.2: DATA COVERAGE
NOCA NATIONAL OFFICE OF CLINICAL AUDIT IRISH NATIONAL AUDIT OF STROKE NATIONAL REPORT 2019 4544
CHAPTER 3
SUMMARYIt is important to acknowledge all of the work involved in bringing the NSR from its inception in 2012 to the high standard of data collection that it has achieved. HIQA’s Guidance on a data quality framework for health and social care (2018) has identified areas for improvement within this healthcare dataset, as outlined within the data quality statement.
Data quality initiatives have been identified and will be implemented in 2020, including:• implementing the DVR to improve coverage, completeness and accuracy• working with the HPO on ways to reduce data input errors• revising the variables for thrombectomy data• working with HSCPs to increase participation in hospitals and among disciplines that are not
currently participating in the audit.
The INAS will continue to evolve, and we look forward to collaborating with all stakeholders to make it a high-quality and adaptable audit for stroke services in Ireland.

NOCA NATIONAL OFFICE OF CLINICAL AUDIT IRISH NATIONAL AUDIT OF STROKE NATIONAL REPORT 2019 4544
CHAPTER 4EMERGENCY CARE

NOCA NATIONAL OFFICE OF CLINICAL AUDIT IRISH NATIONAL AUDIT OF STROKE NATIONAL REPORT 2019 4746
CHAPTER 4
CHAPTER 4: EMERGENCY CAREStroke is a medical emergency and if outcomes are to be optimised, there should be no time delays in determining the diagnosis and treatment (Royal College of Physicians, 2016). Timely emergency department (ED) evaluation and stroke team assessment is paramount for all patients with a stroke, particularly with the increasing availability of acute stroke treatments.
The image below indicates the emergency pathway of care for patients with a stroke from onset of stroke symptoms through to decision to treat with thrombolysis and/or thrombectomy.
Home Doctor ThrombolysisHospital Brain Scan Thrombectomy
TIME IS BRAIN

NOCA NATIONAL OFFICE OF CLINICAL AUDIT IRISH NATIONAL AUDIT OF STROKE NATIONAL REPORT 2019 4746
CHAPTER 4
GENDER AND AGE BANDThis report examines 4,275 cases with stroke that were reported through the stroke audit portal in 2019. The absolute number of strokes occurring annually in Ireland depends on the definition used, but it ranges from 6,000 to 8,000 cases per annum. The median age of patients recorded in the INAS in 2019 was 74 years (interquartile range [IQR]: 65–82 years), and the mean age was 72 years. These figures are consistent with data from other Western European countries (The Stroke Alliance for Europe, 2020). The mean age of female patients with a stroke was 75 years (range: 20–101 years), and the mean age of male patients with a stroke was 70 years (range: 19–99 years). Almost one-quarter (24%, n=1044) of all cases were aged under 65 years, with 30% (n=712) of males and 18% (n=332) of females aged under 65 years.
As in previous stroke reports, more than one-half (56.4%, n=2410) of all stroke cases with ICD 10 codes I61, I63 or I64 as the principal diagnosis in the 20 included hospitals in 2019 were male (Figure 4.1). This is similar to the gender breakdown reported in Irish Heart Foundation/HSE National Stroke Audit 2015, where males accounted for 57% of stroke cases (McElwaine et al., 2015). Men tended to suffer strokes at a younger age than women, reflecting earlier onset of cardiovascular disease; however, the proportion of those aged under 65 years suffering strokes has not changed significantly since the publication of Irish Heart Foundation/HSE National Stroke Audit 2015, which reported that 24% of strokes occurred in this age group.
FIGURE 4.1: PERCENTAGE OF IRISH NATIONAL AUDIT OF STROKE CASES, BY GENDER AND AGE GROUP (N=4275)
Figure 4.1 Percentage of Irish National Audit of Stroke cases, by gender and age group (N=4275)
68%61%
42%
56%
32%39%
58%
44%
0%
20%
40%
60%
80%
100%
17–64 65–79 80+ Total
PERC
ENTA
GE
AGE GROUP
Male Female
56%
44%

NOCA NATIONAL OFFICE OF CLINICAL AUDIT IRISH NATIONAL AUDIT OF STROKE NATIONAL REPORT 2019 4948
CHAPTER 4
FIGURE 4.2: ADMISSION SOURCE (N=4275)
ADMISSION SOURCEThe majority (98%, n=4178) of stroke cases reported were classified as emergency admissions. The admission source data (Figure 4.2) show that most patients with a stroke (88%, n=3746) were living at home prior to their stroke. Figure 4.2 Admission source (N=4275)
88%
8%4% 1%
0%
10%
20%
30%
40%
50%
60%
70%
80%
90%
Home Transfer from nursinghome/convalescent home or
other long-stayaccommodation
Transfer of admitted patientfrom acute hospital
Other
PERC
ENTA
GE
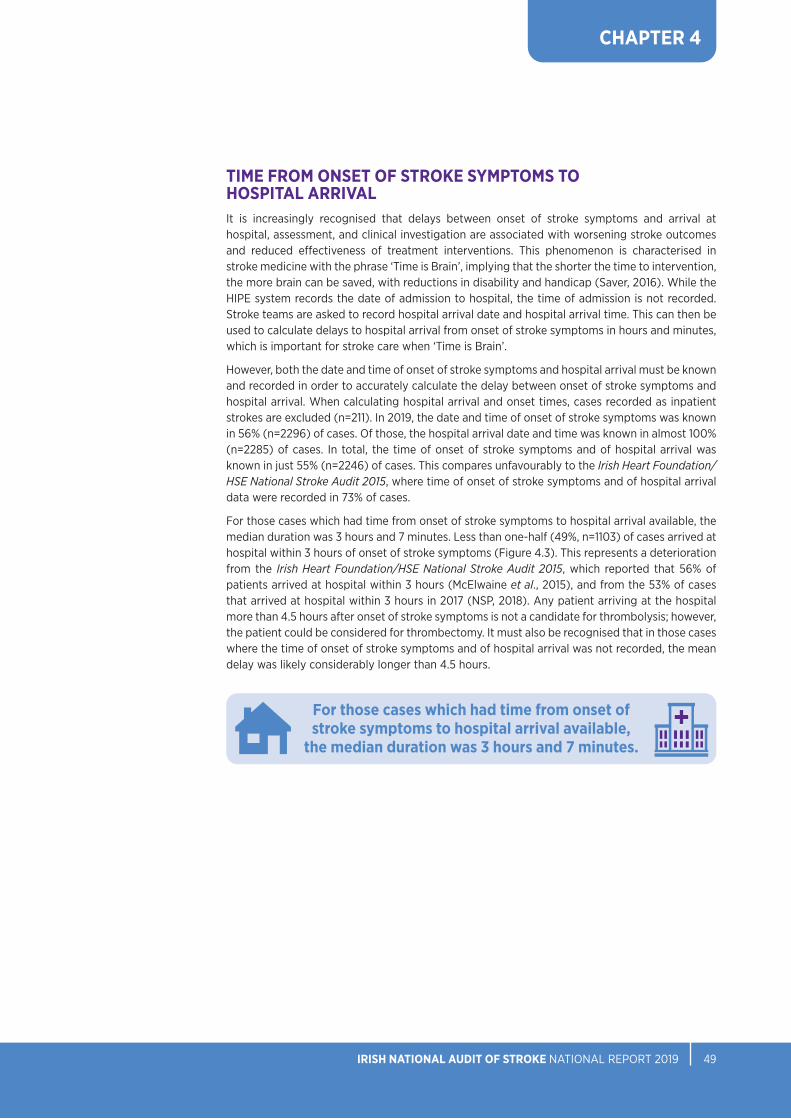
NOCA NATIONAL OFFICE OF CLINICAL AUDIT IRISH NATIONAL AUDIT OF STROKE NATIONAL REPORT 2019 4948
CHAPTER 4
TIME FROM ONSET OF STROKE SYMPTOMS TO HOSPITAL ARRIVALIt is increasingly recognised that delays between onset of stroke symptoms and arrival at hospital, assessment, and clinical investigation are associated with worsening stroke outcomes and reduced effectiveness of treatment interventions. This phenomenon is characterised in stroke medicine with the phrase ‘Time is Brain’, implying that the shorter the time to intervention, the more brain can be saved, with reductions in disability and handicap (Saver, 2016). While the HIPE system records the date of admission to hospital, the time of admission is not recorded. Stroke teams are asked to record hospital arrival date and hospital arrival time. This can then be used to calculate delays to hospital arrival from onset of stroke symptoms in hours and minutes, which is important for stroke care when ‘Time is Brain’.
However, both the date and time of onset of stroke symptoms and hospital arrival must be known and recorded in order to accurately calculate the delay between onset of stroke symptoms and hospital arrival. When calculating hospital arrival and onset times, cases recorded as inpatient strokes are excluded (n=211). In 2019, the date and time of onset of stroke symptoms was known in 56% (n=2296) of cases. Of those, the hospital arrival date and time was known in almost 100% (n=2285) of cases. In total, the time of onset of stroke symptoms and of hospital arrival was known in just 55% (n=2246) of cases. This compares unfavourably to the Irish Heart Foundation/HSE National Stroke Audit 2015, where time of onset of stroke symptoms and of hospital arrival data were recorded in 73% of cases.
For those cases which had time from onset of stroke symptoms to hospital arrival available, the median duration was 3 hours and 7 minutes. Less than one-half (49%, n=1103) of cases arrived at hospital within 3 hours of onset of stroke symptoms (Figure 4.3). This represents a deterioration from the Irish Heart Foundation/HSE National Stroke Audit 2015, which reported that 56% of patients arrived at hospital within 3 hours (McElwaine et al., 2015), and from the 53% of cases that arrived at hospital within 3 hours in 2017 (NSP, 2018). Any patient arriving at the hospital more than 4.5 hours after onset of stroke symptoms is not a candidate for thrombolysis; however, the patient could be considered for thrombectomy. It must also be recognised that in those cases where the time of onset of stroke symptoms and of hospital arrival was not recorded, the mean delay was likely considerably longer than 4.5 hours.
For those cases which had time from onset of stroke symptoms to hospital arrival available,
the median duration was 3 hours and 7 minutes.

NOCA NATIONAL OFFICE OF CLINICAL AUDIT IRISH NATIONAL AUDIT OF STROKE NATIONAL REPORT 2019 5150
CHAPTER 4
3 Cases recorded as inpatient strokes are excluded. 1,818 cases did not have time information recorded or it was recorded incorrectly. These cases have been excluded from Figure 4.3.
FIGURE 4.3: DISTRIBUTION OF TIME FROM ONSET OF STROKE SYMPTOMS TO HOSPITAL ARRIVAL (n=2246)3
Figure 4.3 Distribution of time from onset of stroke symptoms to hospital arrival (n=2246)
49%
10%
20% 21%
0%
5%
10%
15%
20%
25%
30%
35%
40%
45%
50%
Between 0 and 3 hours Between 3 hours and 4hours, 30 minutes
Between 4 hours, 30minutes and 12 hours
More than 12 hours
PERC
ENTA
GE
TIME FROM ONSET OF STROKE SYMPTOMS TO HOSPITAL ARRIVAL

NOCA NATIONAL OFFICE OF CLINICAL AUDIT IRISH NATIONAL AUDIT OF STROKE NATIONAL REPORT 2019 5150
CHAPTER 4
4 Cases recorded as inpatient strokes are excluded. 51 cases did not have time information recorded or it was recorded incorrectly. These cases have been excluded from Figure 4.4.
DAY AND TIME OF HOSPITAL ARRIVALThe distribution of day and time of hospital arrival indicates that 44% (n=1771) of cases arrived during working hours, while 56% (n=2242) arrived outside of working hours (any time on Saturday or Sunday, or between 5.00pm and 8.59am Monday to Friday), (Figure 4.4). These data are consistent with findings of previous years and with international data. In itself it is unremarkable, but would add some evidence that data on patients with a stroke are not being preferentially collected for those admitted during working hours.
FIGURE 4.4: DISTRIBUTION OF DAY AND TIME OF HOSPITAL ARRIVAL (n=4013)4
Figure 4.4 Distribution of day and time of hospital arrival (n=4013)
14% 11% 13% 12% 11% 14% 13% 12%
56%57%
60% 58% 59% 59%54% 58%
30% 33% 28% 30% 30% 27% 33% 30%
0%
10%
20%
30%
40%
50%
60%
70%
80%
90%
100%
Sunday Monday Tuesday Wednesday Thursday Friday Saturday Total
PERC
ENTA
GE
DAYS OF THE WEEK
00:00–8:59 9:00–16:59 17:00–23:59

NOCA NATIONAL OFFICE OF CLINICAL AUDIT IRISH NATIONAL AUDIT OF STROKE NATIONAL REPORT 2019 5352
CHAPTER 4
TIME BETWEEN HOSPITAL ARRIVAL AND TIME REVIEWED BY MEDICAL TEAMEarly review by the medical team ensures that the patient has an initial stroke assessment and a brain scan completed as soon as possible. This facilitates prompt treatment, thus reducing brain cell death (Saver, 2016). Cases recorded as inpatient strokes are excluded (n=211). Time and date of hospital arrival and time and date reviewed by the medical team were available and recorded correctly for 74% (n=3019) of cases; 66% (n=1989) of these were seen by the medical team within 1 hour of hospital arrival (Figure 4.5). The median time to contact with the medical team after hospital arrival was 17 minutes.
This is a substantial improvement from the National Stroke Register Report 2017 (NSP, 2018), where 56% of patients were seen within 1 hour and 69% were seen within 3 hours. This may reflect the impact of a national quality improvement project which explored the ‘door to decision’ times for patients with an ischaemic stroke. It also reflects an ongoing improvement in response time since 2013, when the collection of annual data for this measure commenced.
FIGURE 4.5: TIME BETWEEN HOSPITAL ARRIVAL AND TIME REVIEWED BY MEDICAL TEAM (n=3019)5
Figure 4.5 Time between hospital arrival and time reviewed by medical team (n=3019)
44%
13%
8%
11%
20%
3%
0%
10%
20%
30%
40%
50%
Less than 10minutes
11 to 30 minutes 31 minutes to 1hour
More than 1 hourto 3 hours
More than 3hours to 24
hours
More than 24hours
PERC
ENTA
GE
5 Cases recorded as inpatient strokes are excluded. 1,045 cases did not have time information recorded or it was recorded incorrectly. These cases have been excluded from Figure 4.5.
Two-thirds of patients were seen by a doctor within 1 hour of arrival at hospital

NOCA NATIONAL OFFICE OF CLINICAL AUDIT IRISH NATIONAL AUDIT OF STROKE NATIONAL REPORT 2019 5352
HO
SPIT
ALS
Bantry General Hospital
Beaumont Hospital
Cavan General Hospital
Connolly Hospital
Cork University Hospital
Letterkenny University Hospital
Mater Misericordiae University Hospital
Mayo University Hospital
Mercy University Hospital
Naas General Hospital
Our Lady of Lourdes Hospital Drogheda
Our Lady’s Hospital, Navan
Sligo University Hospital
South Tipperary General Hospital
St James’s Hospital
St Vincent’s University Hospital
Tallaght University Hospital
University Hospital Limerick
University Hospital Waterford
Wexford General Hospital
MEDIAN AND IQR TIME DOOR TO IMAGING (MINUTES)
1320
1260
1200
1140
1080
1020
960
900
840
780
720
660
600
540
480
420
360
300
240
180
120
600
Page 1
CHAPTER 4
6 Figure 4.6 excludes in hospital stroke cases (n=211). 176 cases did not have time information recorded or it was recorded incorrectly. These cases have been excluded from Figure 4.6.
FIGURE 4.6: DOOR TO IMAGING TIME, MEDIAN AND INTERQUARTILE RANGE, BY HOSPITAL, IN MINUTES (n=3640)6
DOOR TO IMAGINGStandard: Patients with suspected acute stroke should receive brain imaging urgently – at most within 1 hour of arrival at hospital (Royal College of Physicians, 2016).
In total, 94% (n=3816) of patients (cases recorded as inpatient strokes are excluded (n=211)) had a computed tomography (CT) or magnetic resonance imaging (MRI) scan after their stroke in their hospital of admission, with a further 6% (n=227) of patients having a CT or MRI scan performed pre-admission or in a previous hospital, in cases of hospital transfer. Out of those who had CT or MRI brain scanning, information about time and date was available for 95% (n=3640) of patients.
Data in relation to the timeliness of imaging have always been important in order to ensure prompt decision to treat; however, given recent advances in understanding of the acute phase of stroke, it is even more important to improve the timeliness of access to imaging and treatment within each hospital. Acute management for ischaemic and haemorrhagic strokes now differs substantially, and timely performance of a brain scan is the only reliable method of distinguishing between the two. In 2019, the national median 'door to imaging' (DTI) time for all patients with a stroke was 1 hour and 20 minutes and 44% (n=1600) had imaging within 1 hour of arrival. Figure 4.6 indicates the DTI times for each participating hospital in 2019. Improvement in this key time point has the potential to change processes to support the provision of thrombectomy.
Of 12 hospitals with comparable data from the National Stroke Register Report 2017 (NSP, 2018) and the National Stroke Register Report 2018 (NSP, 2019), 9 (75%) saw improvements in their DTI time. However, it is of concern that 14 out of 20 (70%) of the participating hospitals had a median DTI in excess of 60 minutes in 2019.
94% of patients had a brain scan. 44% had a brain scan within 1 hour of arrival.

NOCA NATIONAL OFFICE OF CLINICAL AUDIT IRISH NATIONAL AUDIT OF STROKE NATIONAL REPORT 2019 5554
CHAPTER 4
TYPE OF STROKEThe great majority of stroke cases in 2019 were ischaemic (86%, n=3659) (Figure 4.7), reflecting known prevalence rates. Of note, the INAS has not to date recorded data on care of people with subarachnoid haemorrhage (ICD 10 code I60) because of differences in the process of care and management of this type of stroke compared with other patients with a stroke – e.g. patients with subarachnoid haemorrhage frequently do not pass through stroke teams or stroke units where register data are recorded. However, in the absence of alternate data collection means, it may be appropriate to explore the feasibility of collecting data on these patients in future, using alternate processes.
FIGURE 4.7: PERCENTAGE OF IRISH NATIONAL AUDIT OF STROKE CASES, BY STROKE TYPE (N=4275)
14% 86%Haemorrhagic stroke
Ischaemic stroke

NOCA NATIONAL OFFICE OF CLINICAL AUDIT IRISH NATIONAL AUDIT OF STROKE NATIONAL REPORT 2019 5554
CHAPTER 4
FIGURE 4.8: PERCENTAGE OF THROMBOLYSIS IN ISCHAEMIC STROKE CASES, BY HOSPITAL (n=3659)
THROMBOLYSIS IN ISCHAEMIC STROKE Standard: Patients with acute ischaemic stroke, regardless of age or stroke severity, in whom treatment can be started within 4.5 hours of known stroke onset should be considered for treatment with thrombolysis (Royal College of Physicians, 2016).
Figure 4.8 shows that for patients with ischaemic stroke (ICD 10 code I63 or I64) (n=3659), the intravenous thrombolysis rate was 10.6% (n=389). This represents a decrease from the Irish Heart Foundation/HSE National Stroke Audit 2015 (McElwaine et al., 2015), where 11.1% of patients were thrombolysed, and from the National Stroke Register Report 2017 (NSP, 2018), where 11.6% were thrombolysed. This may reflect slight changes in practice with regard to thrombolysis of minor strokes, and increased availability of alternative treatment strategies, such as use of thrombectomy in some cases. A concern would be if the reduction in thrombolysis reflects the apparent increased delay between the onset of stroke symptoms and presentation to hospital, which may reflect a deterioration in public awareness of stroke symptoms and appropriate responses if symptoms occur.
Figure 4.8 Percentage of thrombolysis in ischaemic stroke cases, by hospital (n=3659)
22%
18%
15%14%
12% 12%11% 10% 10% 10% 10%
9% 9% 9% 9% 9%8% 8%
6%5%
0%
5%
10%
15%
20%
25%
Mat
er M
iseric
ordi
ae U
nive
rsity
Hos
pita
l
Our
Lad
y’s H
ospi
tal,
Nav
an
Bant
ry G
ener
al H
ospi
tal
Talla
ght U
nive
rsity
Hos
pita
l
Mer
cy U
nive
rsity
Hos
pita
l
Cava
n Ge
nera
l Hos
pita
l
St Ja
mes
’s Ho
spita
l
Unive
rsity
Hos
pita
l Lim
erick
Unive
rsity
Hos
pita
l Wat
erfo
rd
Cork
Uni
vers
ity H
ospi
tal
Lette
rken
ny U
nive
rsity
Hos
pita
l
Wex
ford
Gen
eral
Hos
pita
l
Beau
mon
t Hos
pita
l
St V
ince
nt’s
Unive
rsity
Hos
pita
l
Naa
s Gen
eral
Hos
pita
l
Slig
o Un
ivers
ity H
ospi
tal
Sout
h Ti
pper
ary
Gene
ral H
ospi
tal
Conn
olly
Hosp
ital
Our
Lad
y of
Lou
rdes
Hos
pita
l Dro
ghed
a
May
o Un
iver
sity
Hosp
ital
PERC
ENTA
GE
HOSPITALS
National
The intravenous thrombolysis rate
was 10.6%

NOCA NATIONAL OFFICE OF CLINICAL AUDIT IRISH NATIONAL AUDIT OF STROKE NATIONAL REPORT 2019 5756
CHAPTER 4
7 Refers to ischaemic stroke cases that received thrombolysis only. 36 cases did not have time information recorded or it was recorded incorrectly. These cases have been excluded from Figure 4.9.
FIGURE 4.9: DOOR TO NEEDLE TIME, MEDIAN AND INTERQUARTILE RANGE, BY HOSPITAL, IN MINUTES (n=353)7
TIME BETWEEN HOSPITAL ARRIVAL AND TIME OF THROMBOLYSISStandard: ‘Door to needle’ time less than 60 minutes (Irish Heart Foundation, 2015).
The ‘door to needle’ (DTN) time was available and recorded correctly in 91% (n=353) of cases of ischaemic stroke where thrombolysis was performed in 2019. The median DTN time nationally was 56 minutes (Figure 4.9); in 2017, this was reported nationally as 71 minutes (NSP, 2018), and in 2018, it was reported as 58 minutes (NSP, 2019). This improvement follows the Door to Decision in Under 30! quality improvement project led by Prof. John Thornton which commenced in 2018. The Sentinel Stroke National Audit Programme UK (SSNAP, 2020) reports a median DTN time of 52 minutes.
Time between hospital arrival and time of thrombolysis was 56 minutes
HO
SPIT
ALS
Bantry General Hospital
Beaumont Hospital
Cavan General Hospital
Connolly Hospital
Cork University Hospital
Letterkenny University Hospital
Mater Misericordiae University Hospital
Mayo University Hospital
Mercy University Hospital
Naas General Hospital
Our Lady of Lourdes Hospital Drogheda
Our Lady’s Hospital, Navan
Sligo University Hospital
South Tipperary General Hospital
St James’s Hospital
St Vincent’s University Hospital
Tallaght University Hospital
University Hospital Limerick
University Hospital Waterford
Wexford General Hospital
TIME (MINUTES)
1501209060300
Page 1

NOCA NATIONAL OFFICE OF CLINICAL AUDIT IRISH NATIONAL AUDIT OF STROKE NATIONAL REPORT 2019 5756
CHAPTER 4
KEY FINDINGS FROM CHAPTER 4
• Treatment of acute stroke is time-dependent, but less than half of cases (49%, n=1103) for which data were available arrived at hospital within 3 hours of onset of stroke symptoms, which is a decline from 53% in 2017.
• Having arrived in hospital, two-thirds of patients (66%, n=1989) for whom data were available were seen by the medical team within 1 hour of presentation (Figure 4.5). The median time to contact with the medical team after hospital arrival was 17 minutes.
• In 2019, 94% (n=3816) (excluding patients that had a stroke while in the hospital (n=211)) of patients had a CT or MRI brain scan after stroke, and 44% (n=1600) of these scans were carried out within 1 hour of presentation (Figure 4.6). The median DTI time was 1 hour and 20 minutes.
• In 2019, 10.6% (n=389) of patients with ischaemic stroke underwent clot-busting thrombolysis therapy, which represents a decrease from 11.6% in 2017. The national median ‘door to needle’ time was 56 minutes (Figure 4.9).


CHAPTER 5THROMBECTOMY

NOCA NATIONAL OFFICE OF CLINICAL AUDIT IRISH NATIONAL AUDIT OF STROKE NATIONAL REPORT 2019 6160
CHAPTER 5
CHAPTER 5: THROMBECTOMYThrombectomy in stroke is the mechanical removal of a blood clot in a large blood vessel in the brain (Figure 5.1).
This treatment has been proven by multiple randomised controlled trials and meta-analyses to be very effective in appropriately selected patients up to 24 hours after the onset of stroke symptoms. ‘Time is Brain’, and emergency thrombectomy is one of the most time-sensitive medical treatments for stroke. On average, every minute saved for a patient undergoing thrombectomy results in an additional week of independent living (Meretoja et al., 2017).
There are two endovascular thrombectomy (EVT) stroke centres providing thrombectomy for acute stroke in Ireland. Beaumont Hospital provides this service on a 24-hour basis, 7 days a week, and Cork University Hospital provides an 8.00am to 8.00pm service 5 days a week for its surrounding region. Outside these hours, suitable patients may be transferred to Beaumont Hospital for treatment.
Data on thrombectomy are collected in Beaumont Hospital and Cork University Hospital; they are recorded on the National Thrombectomy Service (NTS) database in the two EVT Stroke Centres and they are also uploaded to the stroke audit portal. The NTS produced an annual report in 2019 (NTS, 2020) using data from the NTS database, and this provides further detailed analysis of the thrombectomy service. When comparing the INAS 2019 annual report and the NTS 2019 annual report, it is important to note that different methodologies were used. The two particular differences to note are:
1. The National Thrombectomy Service Annual Report 2019 uses the total number of ischaemic stroke cases admitted to hospitals, as reported by HIPE, as its denominator. The INAS report uses the number of ischaemic stroke cases admitted to each hospital which have additional stroke audit information and meet the 80% coverage target, as outlined in the data quality statement in Chapter 3.
2. The INAS thrombectomy dataset did not collect information related to the date and time of admission to the referring hospital. This was an error in design which will be rectified for the 2020 data. This means that some key performance indicators, such as ‘door to CT’ for thrombectomy patients as identified in the National Thrombectomy Service Annual Report 2019, are not available for comparison.
FIGURE 5.1: THROMBECTOMY
Blood vessel
Blood clot(cought in stent and removed)
Stent

NOCA NATIONAL OFFICE OF CLINICAL AUDIT IRISH NATIONAL AUDIT OF STROKE NATIONAL REPORT 2019 6160
CHAPTER 5
THROMBECTOMY IN ISCHAEMIC STROKEIn 2019, ischaemic stroke data were available for 20 participating hospitals (Table 5.1A); 9% (n=302) of these hospital cases had a thrombectomy performed. Aguiar de Sousa et al. (2018) reported a 1.9% thrombectomy rate across 44 European countries, highlighting how Ireland is at the forefront in endovascular intervention in stroke.
Cases from hospitals where information on ischaemic stroke was unavailable are presented in Table 5.1B. As these patients had a thrombectomy, they were included in the remaining analysis in Chapter 5, but they are excluded from the analysis in Table 5.1A.
Hospital Number of ischaemic
stroke cases
Number of thrombectomy
cases
%
Bantry General Hospital 86 - *
Beaumont Hospital 327 39 12%
Cavan General Hospital 107 - *
Connolly Hospital 179 8 4%
Cork University Hospital 369 35 9%
Letterkenny University Hospital 145 - *
Mater Misericordiae University Hospital 254 47 19%
Mayo University Hospital 175 10 6%
Mercy University Hospital 82 6 7%
Naas General Hospital 160 20 13%
Our Lady of Lourdes Hospital Drogheda 173 19 11%
Our Lady’s Hospital, Navan 65 - *
Sligo University Hospital 161 - *
South Tipperary General Hospital 95 - *
St James’s Hospital 201 19 9%
St Vincent’s University Hospital 296 29 10%
Tallaght University Hospital 206 22 11%
University Hospital Limerick 232 9 4%
University Hospital Waterford 120 10 8%
Wexford General Hospital 110 9 8%
National 35439 302 9%- Denotes five cases or fewer* Further suppression required to prevent disclosure of five cases or fewer
TABLE 5.1A: PERCENTAGE OF ISCHAEMIC STROKE CASES WHO RECEIVED A THROMBECTOMY, BY HOSPITAL8
8 In 59 thrombectomy cases, the total number of ischaemic strokes for each hospital was not available. See Table 5.1B.9 Excluding cases transferred to Beaumont Hospital and Cork University Hospital for thrombectomy (n=116).

NOCA NATIONAL OFFICE OF CLINICAL AUDIT IRISH NATIONAL AUDIT OF STROKE NATIONAL REPORT 2019 6362
CHAPTER 5
Hospital Number of thrombectomy
cases
University Hospital Galway 21
Regional Hospital Mullingar 11
St Luke's General Hospital, Carlow/Kilkenny 9
Portiuncula University Hospital -
University Hospital Kerry 8
Other *
Total 59
- Denotes five cases or fewer* Further suppression required to prevent disclosure of five cases or fewer
TABLE 5.1B CASES WHO RECEIVED THROMBECTOMY FOR WHOM NO ISCHAEMIC INFORMATION WAS AVAILABLE

NOCA NATIONAL OFFICE OF CLINICAL AUDIT IRISH NATIONAL AUDIT OF STROKE NATIONAL REPORT 2019 6362
CHAPTER 5
10 150 cases did not have time information recorded or it was recorded incorrectly. These cases have been excluded from Figure 5.2. Hospitals with fewer than five cases do not have a median or IQR displayed.
ONSET OF STROKE SYMPTOMS TO CT SCANStandard: All patients with suspected acute ischaemic stroke should typically have a CT scan and a computed tomography angiogram (CTA), and if there is a large vessel occlusion showing on the CTA, the patient should be considered for thrombectomy (Irish Heart Foundation, 2015).
As outlined at the beginning of this chapter, data on arrival date and time to the referring hospitals were not available for analysis, and therefore the date and time of onset of stroke symptoms was used as a substitute. Time from onset of stroke symptoms to CT scan includes time for ambulance transfer to hospital, initial assessment and transfer to CT scan. More than one-half (63%, n=227) of thrombectomy cases had the date and time of onset of stroke symptoms recorded. Of those cases who did not have the date and time of onset of stroke symptoms recorded, the majority (85%, n=114) had ‘last time well’ date and time recorded. These cases were not included in the analysis.
Just over one-half of thrombectomy cases (58%, n=211) have both onset of stroke symptoms and CT scan date and time recorded, and recorded correctly. In 2019, for thrombectomy cases, the national median time between the onset of stroke symptoms and CT scan was 1 hour and 39 minutes. Figure 4.3 in Chapter 4 shows that 59% (n=1333) of all patients with a stroke who had time and date for hospital arrival and onset time recorded, and recorded correctly, arrived at hospital within 4.5 hours and the median onset to arrival was 3 hours and 7 minutes. This suggests that when a patient has a witnessed onset of moderate to severe stroke they do access emergency care quickly, and although thrombectomy can be performed up to 24 hours in selected cases it is important that patients continue to move quickly from onset of stroke symptoms to decision to treat with thrombectomy.
Figure 5.2 displays the time from onset of stroke symptoms to CT scan for thrombectomy cases by median and IQR for all hospitals. As with all tables in this report, the median time was not calculated for hospitals that had fewer than five thrombectomy cases recorded, as the median tends to be less accurate and more biased when the sample size is small. Those cases were, however, included in the analysis of the national median figure.
FIGURE 5.2 TIME FROM ONSET OF STROKE SYMPTOMS TO COMPUTED TOMOGRAPHY SCAN FOR THROMBECTOMY CASES, MEDIAN AND INTERQUARTILE RANGE, BY HOSPITAL (n=211)10
HO
SPIT
ALS
Bantry General HospitalBeaumont Hospital
Cavan General HospitalConnolly Hospital
Cork University HospitalLetterkenny University Hospital
Mater Misericordiae University HospitalMayo University HospitalMercy University Hospital
Naas General HospitalOur Lady of Lourdes Hospital Drogheda
Our Lady’s Hospital, NavanPortiuncula University Hospital
Regional Hospital MullingarSligo University Hospital
South Tipperary General HospitalSt James’s Hospital, Dublin
St Luke’s General Hospital, Carlow/KilkennySt Vincent’s University Hospital
Tallaght University HospitalUniversity Hospital Galway
University Hospital KerryUniversity Hospital Limerick
University Hospital WaterfordWexford General Hospital
Other
TIME (MINUTES)
3303002702402101801501209060300
Page 1

NOCA NATIONAL OFFICE OF CLINICAL AUDIT IRISH NATIONAL AUDIT OF STROKE NATIONAL REPORT 2019 6564
CHAPTER 5
TRANSFERS OF PATIENTSThe majority of thrombectomy cases were transferred to the EVT stroke centre (81%, n=292) from a referring hospital (Figure 5.3).Figure 5.2 Percentage of patients transferred to EVT stroke centre (n=361)
19%
81%
Admitted directly to an EVT stroke centre Transferred to an EVT stroke centreFigure 5.2 Percentage of patients transferred to EVT stroke centre (n=361)
19%
81%
Admitted directly to an EVT stroke centre Transferred to an EVT stroke centre
FIGURE 5.3: PERCENTAGE OF PATIENTS TRANSFERRED TO EVT STROKE CENTRE (n=361)

NOCA NATIONAL OFFICE OF CLINICAL AUDIT IRISH NATIONAL AUDIT OF STROKE NATIONAL REPORT 2019 6564
CHAPTER 5
11 Figure 5.4 refers to patients transferred to EVT Stroke Centre. 57 cases did not have time information known or recorded, or it was recorded incorrectly. These cases have been excluded from Figure 5.4. Hospitals with fewer than five cases do not have a median or IQR displayed.
CTA TO DECISION TO TRANSFER PATIENT TO EVT STROKE CENTREA CTA is a scan that shows if there is an occlusion in the large arteries in the brain. Measuring the time between CTA to decision to transfer the patient to an EVT stroke centre reflects the efficiency of radiology review, communication with the stroke team, and contact with the endovascular centre. Of those who were transferred to an EVT stroke centre, time and date information was available for 81% (n=235) of patients (Figure 5.4). The national median CTA to decision time for thrombectomy was 26 minutes.
FIGURE 5.4 TIME FROM COMPUTED TOMOGRAPHY ANGIOGRAM TO DECISION TO TRANSFER PATIENT TO EVT STROKE CENTRE FOR THROMBECTOMY CASES, MEDIAN AND INTERQUARTILE RANGE, BY HOSPITAL (n=235)11
The national median CTA to decision time for thrombectomy was 26 minutes
HO
SPIT
ALS
Bantry General HospitalCavan General Hospital
Connolly HospitalLetterkenny University Hospital
Mater Misericordiae University HospitalMayo University HospitalMercy University Hospital
Naas General HospitalOur Lady of Lourdes Hospital Drogheda
Our Lady’s Hospital, NavanPortiuncula University Hospital
Regional Hospital MullingarSligo University Hospital
South Tipperary General HospitalSt James’s Hospital
St Luke’s General Hospital, Carlow/KilkennySt Vincent’s University Hospital
Tallaght University HospitalUniversity Hospital Galway
University Hospital KerryUniversity Hospital Limerick
University Hospital WaterfordWexford General Hospital
Other
TIME (MINUTES)
706050403020100
Page 1

NOCA NATIONAL OFFICE OF CLINICAL AUDIT IRISH NATIONAL AUDIT OF STROKE NATIONAL REPORT 2019 6766
CHAPTER 5
ONSET OF STROKE SYMPTOMS TO EVT STROKE CENTRE ARRIVAL In 2019, 19.1% (n=69) of thrombectomy patients arrived directly to an EVT stroke centre. The remaining 81% (n=292) of patients were admitted to their nearby primary stroke centre, where they received immediate clinical and radiological evaluation followed by contact with the EVT stroke centre for a decision to transfer for thrombectomy. If accepted for thrombectomy, they were then transferred using Protocol 37 (the National Ambulance Service and Dublin Fire Brigade Emergency Inter-Hospital Transfer Policy) for urgent inter-hospital transfer.
For patients admitted directly to an EVT stroke centre, 61% (n=42) had time and date known and recorded correctly for the time of onset of stroke symptoms and of arrival at EVT stroke centre. More than half (57%, n=165) of patients who were transferred to an EVT stroke centre had time and date known and recorded correctly for the time of onset of stroke symptoms and of arrival at EVT stroke centre.
The median time between onset of stroke symptoms and EVT stroke centre arrival differed between patients who arrived directly to an EVT stroke centre and patients who were transferred from another hospital. In 2019, the median time was 1 hour and 33 minutes for patients who arrived directly at an EVT stroke centre (Figure 5.5A), and 4 hours for those who were transferred from another hospital (Figure 5.5B). This difference is inherent in the nature of the model of care. If patients with large vessel occlusion could be transferred directly to the EVT stroke centre without going to a primary stroke centre first, a considerable amount of time could be saved, which would result in improved outcomes for patients with a stroke.
FIGURE 5.5A: TIME FROM ONSET OF STROKE SYMPTOMS TO EVT STROKE CENTRE ARRIVAL, MEDIAN AND INTERQUARTILE RANGE, FOR THROMBECTOMY CASES WHO WERE ADMITTED DIRECTLY TO THE EVT STROKE CENTRE (n=42)12
12 Figure 5.5A refers to cases who were admitted directly to the EVT stroke centre. 27 cases did not have time information known or recorded, or it was recorded incorrectly. These cases have been excluded from Figure 5.5A.
Time of stroke symptom onset to EVT stroke centre arrival for thrombectomy patients transferred
from another hospital is 4 hours
HO
SPIT
ALS
Beaumont Hospital
Cork University Hospital
TIME (MINUTES)
3002702402101801501209060300
Page 1

NOCA NATIONAL OFFICE OF CLINICAL AUDIT IRISH NATIONAL AUDIT OF STROKE NATIONAL REPORT 2019 6766
HO
SPIT
ALS
Bantry General HospitalCavan General Hospital
Connolly HospitalLetterkenny University Hospital
Mater Misericordiae University HospitalMayo University HospitalMercy University Hospital
Naas General HospitalOur Lady of Lourdes Hospital Drogheda
Our Lady’s Hospital, NavanPortiuncula University Hospital
Regional Hospital MullingarSligo University Hospital
South Tipperary General HospitalSt James’s Hospital
St Luke’s General Hospital, Carlow/KilkennySt Vincent’s University Hospital
Tallaght University HospitalUniversity Hospital Galway
University Hospital KerryUniversity Hospital Limerick
University Hospital WaterfordWexford General Hospital
Other
TIME (MINUTES)
420360300240180120600
Page 1
CHAPTER 5
FIGURE 5.5B: TIME FROM ONSET OF STROKE SYMPTOMS TO EVT STROKE CENTRE ARRIVAL, MEDIAN AND INTERQUARTILE RANGE, FOR THROMBECTOMY CASES WHO WERE TRANSFERRED TO THE EVT STROKE CENTRE (n=165)13
13 Figure 5.5B refers to patients transferred from another hospital to the EVT Stroke Centre. 127 cases did not have time information recorded or it was recorded incorrectly. These cases have been excluded from Figure 5.5B. Hospitals with fewer than five cases do not have a median or IQR displayed.

NOCA NATIONAL OFFICE OF CLINICAL AUDIT IRISH NATIONAL AUDIT OF STROKE NATIONAL REPORT 2019 6968
Figure 5.5 Proximal occlusion site (n=361)
55%
17%14%
7%4%
2%1%
0%
10%
20%
30%
40%
50%
60%
MCA 1 MCA 2 Internal carotidartery terminus
Internal carotidartery cervical
segment
Basilar Vertebrobasilar Unknown
PERC
ENTA
GE
PROXIMAL OCCLUSION SITEFigure 5.6 shows the distribution of sites of proximal occlusion. More than one-half (55%, n=199) of thrombectomy cases had proximal occlusion in middle cerebral artery (MCA) 1; 17% (n=60) of patients had proximal occlusion in MCA 2.
CHAPTER 5
FIGURE 5.6: PROXIMAL OCCLUSION SITE (n=361)

NOCA NATIONAL OFFICE OF CLINICAL AUDIT IRISH NATIONAL AUDIT OF STROKE NATIONAL REPORT 2019 6968
CHAPTER 5
TIME TO RECANALISATIONRecanalisation is the term used to describe when a clot is removed and blood flow is restored. Time to recanalisation reflects the time from onset of stroke symptoms to arrival in the EVT stroke centre and also includes the time to prepare for and perform the thrombectomy. Transferred patients mostly go directly to the angiography laboratory for the procedure, as they would have already been evaluated. Patients presenting directly to the EVT stroke centre require initial evaluation, diagnosis and decision prior to the procedure.
The median time from onset of stroke symptoms to recanalisation for patients who were directly admitted to the EVT stroke centre is displayed in Figure 5.7A. The median time from onset of stroke symptoms to recanalisation for patients who were transferred to the EVT stroke centre from another hospital is displayed in Figure 5.7B. Median time to recanalisation was shorter for thrombectomy patients who were admitted directly to the EVT stroke centre (3 hours and 32 minutes) than for thrombectomy patients who were transferred from another hospital (4 hours and 39 minutes).
FIGURE 5.7A: TIME FROM ONSET OF STROKE SYMPTOMS TO RECANALISATION, MEDIAN AND INTERQUARTILE RANGE, FOR PATIENTS ADMITTED DIRECTLY TO THE EVT STROKE CENTRE (n=42)14
14 Figure 5.7A refers to patients who were admitted directly to the EVT stroke centre. 27 cases did not have time information recorded or it was recorded incorrectly. These cases have been excluded from Figure 5.7A.
Time of stroke symptom onset to reperfusion for thrombectomy patients transferred from
another hospital is 4 hours 39 minutes
HO
SPIT
ALS
Beaumont Hospital
Cork University Hospital
TIME (MINUTES)
480420360300240180120600
Page 1

NOCA NATIONAL OFFICE OF CLINICAL AUDIT IRISH NATIONAL AUDIT OF STROKE NATIONAL REPORT 2019 7170
FIGURE 5.7B: TIME FROM ONSET OF STROKE SYMPTOMS TO RECANALISATION, MEDIAN AND INTERQUARTILE RANGE, FOR PATIENTS TRANSFERRED FROM ANOTHER HOSPITAL TO THE EVT STROKE CENTRE (N=160)15
15 Figure 5.7B refers to patients transferred from another hospital to the EVT Stroke Centre. 132 cases did not have time information recorded or it was recorded incorrectly. These cases have been excluded from Figure 5.7B. Hospitals with fewer than five cases do not have a median or IQR displayed.
CHAPTER 5H
OSP
ITA
LS
Bantry General HospitalCavan General Hospital
Connolly HospitalLetterkenny University Hospital
Mater Misericordiae University HospitalMayo University HospitalMercy University Hospital
Naas General HospitalOur Lady of Lourdes Hospital Drogheda
Our Lady’s Hospital, NavanPortiuncula University Hospital
Regional Hospital MullingarSligo University Hospital
South Tipperary General HospitalSt James’s Hospital
St Luke’s General Hospital, Carlow/KilkennySt Vincent’s University Hospital
Tallaght University HospitalUniversity Hospital Galway
University Hospital KerryUniversity Hospital Limerick
University Hospital WaterfordWexford General Hospital
Other
TIME (MINUTES)
540480420360300240180120600
Page 1
HO
SPIT
ALS
Bantry General HospitalCavan General Hospital
Connolly HospitalLetterkenny University Hospital
Mater Misericordiae University HospitalMayo University HospitalMercy University Hospital
Naas General HospitalOur Lady of Lourdes Hospital Drogheda
Our Lady’s Hospital, NavanPortiuncula University Hospital
Regional Hospital MullingarSligo University Hospital
South Tipperary General HospitalSt James’s Hospital
St Luke’s General Hospital, Carlow/KilkennySt Vincent’s University Hospital
Tallaght University HospitalUniversity Hospital Galway
University Hospital KerryUniversity Hospital Limerick
University Hospital WaterfordWexford General Hospital
Other
TIME (MINUTES)
540480420360300240180120600
Page 1

NOCA NATIONAL OFFICE OF CLINICAL AUDIT IRISH NATIONAL AUDIT OF STROKE NATIONAL REPORT 2019 7170
CHAPTER 5
INTERVENTION OUTCOMES – NATIONAL INSTITUTES OF HEALTH STROKE SCALEEarly recovery is a good predictor of final outcome post-thrombectomy. The National Institutes of Health Stroke Scale (NIHSS) is a stroke scale that enables the doctor to rapidly determine the severity and possible location of the stroke. NIHSS scores are strongly associated with outcome and can help to identify those patients who are likely to benefit from reperfusion therapies, as well as those who are at higher risk of developing complications from the stroke itself or from potential reperfusion strategies (Wouters et al., 2018). The distribution of NIHSS scores pre-thrombectomy and 24 hours post-thrombectomy is displayed in Figure 5.8. In 2019, 97% (n=319) of patients had at least moderate stroke symptoms prior to thrombectomy.
The number of patients with moderate to severe stroke halved from 100 patients (31%) pre-thrombectomy to 46 patients (14%) by 24 hours post-thrombectomy. Similarly, the number of patients with severe stroke decreased from 60 patients pre-thrombectomy (18%) to 32 patients (10%) 24 hours post-thrombectomy. Six percent (n=19) of patients had no stroke symptoms recorded 24 hours post-thrombectomy. The percentage of patients with minor stroke symptoms increased from 3% (n=9) pre-thrombectomy to 32% (n=105) at 24 hours post-thrombectomy.
FIGURE 5.8: INTERVENTION OUTCOMES – NATIONAL INSTITUTES OF HEALTH STROKE SCALE SCORES (n=328)16
16 33 cases did not have an NIHSS score recorded. These cases have been excluded from Figure 5.8.
Figure 5.7 Intervention outcomes – National Institutes of Health Stroke Scale scores (n=328)
6% 32%
3%
38%
48%
14%
30%
10%
18%
0% 10% 20% 30% 40% 50% 60% 70% 80% 90% 100%
24 hours post-thrombectomy
Pre-thrombectomy
PERCENTAGE
No stroke symptoms (0) Minor stroke (1–4)Moderate stroke (5–15) Moderate to severe stroke (16–20)Severe stroke (21–42)

NOCA NATIONAL OFFICE OF CLINICAL AUDIT IRISH NATIONAL AUDIT OF STROKE NATIONAL REPORT 2019 7372
TRANSFERS OF PATIENTS BACK TO REFERRING HOSPITAL The NTS provides its service on the basis of using the existing stroke service in all referring hospitals. It is essential for the ongoing functioning of the NTS that patients are repatriated to the referring hospital as soon as possible. This process works very well. Figure 5.9 shows that the majority (64%, n=188) of thrombectomy patients who were transferred to an EVT stroke centre for thrombectomy were transferred back to their referring hospital immediately after the procedure. Out of those who were not transferred immediately back to referring hospital, majority (78%, n=77) were transferred back to the referring hospital following a period of time in the EVT stroke centre. The median stay in the EVT stroke centre for patients who were not immediately transferred back to their referring hospital was 3 days.
CHAPTER 5
FIGURE 5.9: PERCENTAGE OF CASES TRANSFERRED IMMEDIATELY BACK TO REFERRING HOSPITAL (n=292)17
17 Figure 5.9 refers to patients transferred from another hospital to the EVT Stroke Centre for thrombectomy.
Figure 5.8 Percentage of cases transferred immediately back to referring hospital (n=292)
64%
34%
2%
Yes No Unknown
Figure 5.8 Percentage of cases transferred immediately back to referring hospital (n=292)
64%
34%
2%
Yes No Unknown

NOCA NATIONAL OFFICE OF CLINICAL AUDIT IRISH NATIONAL AUDIT OF STROKE NATIONAL REPORT 2019 7372
DISCHARGE DESTINATIONFigure 5.10 displays the discharge destination for thrombectomy patients who were admitted directly to an EVT stroke centre.
Forty-six percent (n=32) of thrombectomy patients were discharged directly home from hospital, and 23% (n=16) died. Cork University Hospital had fewer than five thrombectomy cases (3%) that transferred to non-acute hospitals in 2019 and Beaumont Hospital had none. Fewer than five thrombectomy patients (3%) were discharged to a hospice from Beaumont Hospital. No thrombectomy patients were discharged to a hospice from Cork University Hospital
CHAPTER 5
FIGURE 5.10: DISCHARGE DESTINATION FOR PATIENTS ADMITTED DIRECTLY TO THE EVT STROKE CENTRE (n=69)
Figure 5.9 Discharge destination for patients admitted directly to the EVT stroke centre (n=69)
43%
50%
6%
21%
23%
6%
3%
3%
26%
21%
0% 20% 40% 60% 80% 100%
Cork University Hospital
Beaumont Hospital
PERCENTAGE
HO
SPIT
ALS
Home
Nursing home, convalescent home or long-stay accommodation
Transfer to acute hospital
Transfer to non-acute hospital
Hospice (not in HIPE hospital listing)
Died

NOCA NATIONAL OFFICE OF CLINICAL AUDIT74
CHAPTER 5
KEY FINDINGS FROM CHAPTER 5
• In 2019, 9% (n=302) (Table 5.1A) of patients for whom ischaemic stroke data were available underwent thrombectomy; 97% (n=319) of thrombectomy cases for which NIHSS data were recorded had at least moderate stroke symptoms prior to thrombectomy.
• In 2019, 81% of thrombectomy cases were transferred from other hospitals to the EVT stroke centres (Figure 5.3).
• The median time from onset of stroke symptoms to CT scan was 1 hour and 39 minutes (Figure 5.2). The median CTA to decision time for thrombectomy was 26 minutes (Figure 5.4).
• The median time from onset of stroke symptoms to arrival at the EVT stroke centre was 1 hour and 33 minutes for patients who arrived directly at an EVT stroke centre (Figure 5.5A), and 4 hours for those who were transferred from another hospital (Figure 5.5B).
• Twenty-four hours post-thrombectomy, the number of patients with moderate to severe stroke halved from 100 patients pre-thrombectomy to 46 patients post-thrombectomy. Similarly, the number of patients with severe stroke decreased from 60 patients pre-thrombectomy to 32 patients 24 hours post-thrombectomy (Figure 5.8).

CHAPTER 6STROKE UNIT CARE

NOCA NATIONAL OFFICE OF CLINICAL AUDIT IRISH NATIONAL AUDIT OF STROKE NATIONAL REPORT 2019 7776
CHAPTER 6
CHAPTER 6: STROKE UNIT CARE
STROKE UNITSOrganised inpatient (stroke unit) care is provided by multidisciplinary teams with expertise in managing patients with a stroke. Team members aim to provide coordinated multidisciplinary care using standard approaches in order to manage common post-stroke problems. A Cochrane Review by Langhorne et al. (2020) found that patients with a stroke who receive organised inpatient stroke unit care are more likely to be alive (an extra 2 patients for every 100), independent (an extra 6 patients for every 100), and living at home (an extra 6 patients for every 100) 1 year after the stroke. These outcomes were independent of patient age, sex, initial stroke severity, and stroke type, and were most obvious in units based in a discrete stroke ward.
ADMISSION TO A STROKE UNITStandard: People with stroke should be treated in a stroke unit throughout their hospital stay unless their stroke is not the predominant clinical problem (Royal College of Physicians, 2016; IHF, 2010).
Figure 6.1 shows that in 2019, 71% (n=3040) of all patients with a stroke were admitted to a stroke unit for some or all of their hospital stay. This is a significant improvement from the 54% (n=472) of patients who were admitted to a stroke unit in 2015 (McElwaine et al., 2015) and 2% (n=42) in 2008 (Horgan et al., 2008). However, this is a national key performance indicator (KPI), with a target of 90%. In order to achieve the agreed target, patients with a stroke should have immediate access to a stroke unit and should remain there throughout their hospital stay. Additionally, they should be cared for by a multidisciplinary team that has specialist knowledge, protocols, training and skills in stroke care and the ability to monitor and regulate basic physiological function. This will require additional capacity in many stroke units and the development of geographically discrete stroke units in those hospitals without a dedicated acute stroke unit.
FIGURE 6.1: ADMISSION TO STROKE UNIT, BY HOSPITAL (N=4275)18
18 Figure 6.1 does not include Our Lady’s Hospital, Navan or Letterkenny University Hospital, as these hospitals do not have a stroke unit.
Figure 6.1 Admission to stroke unit, by hospital (N=4275)
94% 92%86% 86% 84% 83%
75% 73% 71% 71% 71% 71% 70% 70% 70% 69%65%
41%
71%
0%
20%
40%
60%
80%
100%
Slig
o Un
ivers
ity H
ospi
tal
May
o Un
iver
sity
Hosp
ital
St Ja
mes
’s Ho
spita
l
Bant
ry G
ener
al H
ospi
tal
Talla
ght U
nive
rsity
Hos
pita
l
Beau
mon
t Hos
pita
l
St V
ince
nt’s
Unive
rsity
Hos
pita
l
Naa
s Gen
eral
Hos
pita
l
Our
Lad
y of
Lou
rdes
Hos
pita
l Dro
ghed
a
Unive
rsity
Hos
pita
l Wat
erfo
rd
Unive
rsity
Hos
pita
l Lim
erick
Cava
n Ge
nera
l Hos
pita
l
Cork
Uni
vers
ity H
ospi
tal
Mat
er M
iseric
ordi
ae U
nive
rsity
Hos
pita
l
Mer
cy U
nive
rsity
Hos
pita
l
Conn
olly
Hosp
ital
Sout
h Ti
pper
ary
Gene
ral H
ospi
tal
Wex
ford
Gen
eral
Hos
pita
l
Nat
iona
l
PERCEN
TAGE
HOSPITALS
Target 90%
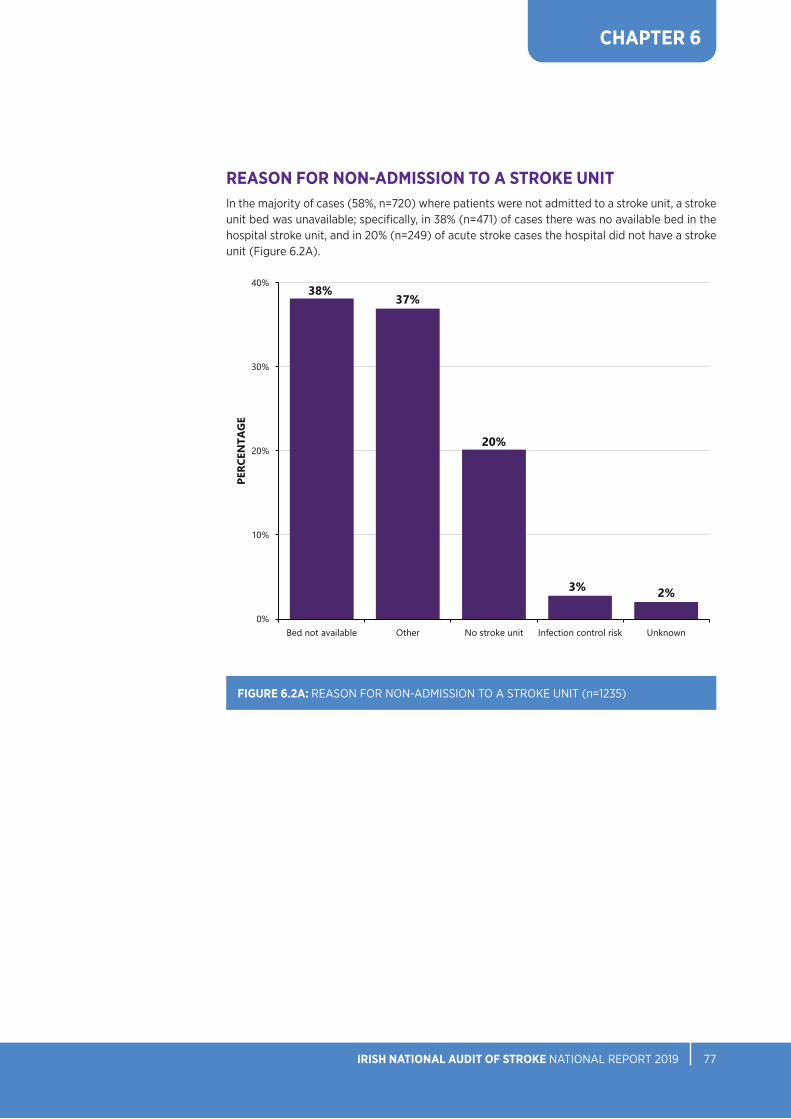
NOCA NATIONAL OFFICE OF CLINICAL AUDIT IRISH NATIONAL AUDIT OF STROKE NATIONAL REPORT 2019 7776
Figure 6.2A Reason for non-admission to a stroke unit (n=1235)
38%37%
20%
3% 2%
0%
10%
20%
30%
40%
Bed not available Other No stroke unit Infection control risk Unknown
PERC
ENTA
GE
CHAPTER 6
REASON FOR NON-ADMISSION TO A STROKE UNIT In the majority of cases (58%, n=720) where patients were not admitted to a stroke unit, a stroke unit bed was unavailable; specifically, in 38% (n=471) of cases there was no available bed in the hospital stroke unit, and in 20% (n=249) of acute stroke cases the hospital did not have a stroke unit (Figure 6.2A).
FIGURE 6.2A: REASON FOR NON-ADMISSION TO A STROKE UNIT (n=1235)

NOCA NATIONAL OFFICE OF CLINICAL AUDIT IRISH NATIONAL AUDIT OF STROKE NATIONAL REPORT 2019 7978
CHAPTER 6
FIGURE 6.2B: OTHER REASONS FOR NON-ADMISSION TO A STROKE UNIT (n=456)
A free text box enables the provision of further explanation for when ‘Other’ was selected as a reason for not admitting a patient to a stroke unit. This text was analysed and grouped into seven distinct categories (Figure 6.2B). There was no information available for 17% (n=77) of cases. The most prominent documented reason for patients not being admitted to a stroke unit was because they were too unwell (27%, n=125) and required care in a higher dependency unit (e.g. an intensive care unit). Admission to an intensive care unit may be the appropriate level of care in some circumstances, and having the KPI target for admission to a stroke unit set at 90% rather than 100% supports the different care needs of patients. An organisational audit of current stroke unit facilities needs to be undertaken in order to review the availability and accessibility of stroke unit beds, the availability of the appropriate number of trained stroke staff, and accessibility to diagnostic tests and investigations.Figure 6.2B Other reasons for non-admission to a stroke unit (n=456)
27%
17%16%
13%
11%
9%
5%
2%
0%
5%
10%
15%
20%
25%
30%
Too unwell Unknown Not referredto strokeservice
Too well End-of-lifecare
Bedmanagement
decision
Transferred toother hospital
Patient choice
PERC
ENTA
GE

NOCA NATIONAL OFFICE OF CLINICAL AUDIT IRISH NATIONAL AUDIT OF STROKE NATIONAL REPORT 2019 7978
CHAPTER 6
SWALLOW SCREENINGStandard: Swallow screening should be performed on all patients with a stroke within 4 hours of admission and before any oral intake (NSP, 2017; Royal College of Physicians, 2016; IHF, 2010).
Swallowing difficulties are common in patients with a stroke, and this can lead to food, fluid, and/or saliva entering the airway. This increases the risk of pneumonia (Bray et al., 2017) and therefore poor outcomes, including a longer hospital stay and a higher risk of disability and death (Martino et al., 2009). Swallow screening is a good indicator of organised acute stroke care. A guidance document on swallow screening was developed by the National Stroke Programme (2017); the screen generally involves a ‘sip test’ performed by trained medical or nursing staff. If this test is failed, the patient may progress to a formal swallow assessment, typically performed by a speech and language therapist.
In 2019, 67% (n=2850) of stroke cases had a swallow screen performed. In comparison, 71% (n=2301) of patients with a stroke had a swallow screen performed in 2018 (NSP, 2019), which represents a reduction in the rate of conducting this important acute stroke intervention in 2019.
Just over 40% (n=1248) of those patients who received a swallow screening had it completed within 4 hours of presentation to hospital. Increasing access to acute stroke unit care would have an immediate impact on the prevalence of swallow screening. A quality improvement initiative is necessary in order to increase training for stroke healthcare professionals in the application of validated swallow screening tools. Additionally, a plan for acute stroke units to provide outreach to other wards in order to support swallow screening out of hours could be considered.
FIGURE 6.3: SWALLOW SCREENING, BY HOSPITAL (N=4275)
Figure 6.3 Swallow screening, by hospital (N=4275)
100%94% 91% 90%
84%84% 83%78%
73% 71%66%
61% 59%
51% 50%
40%
25%19%
14%
4%
67%
0%
10%
20%
30%
40%
50%
60%
70%
80%
90%
100%
Conn
olly
Hosp
ital
Sout
h Ti
pper
ary
Gene
ral H
ospi
tal
Slig
o Un
ivers
ity H
ospi
tal
Talla
ght U
nive
rsity
Hos
pita
l
St Ja
mes
’s Ho
spita
l
Unive
rsity
Hos
pita
l Lim
erick
Cork
Uni
vers
ity H
ospi
tal
Mat
er M
iseric
ordi
ae U
nive
rsity
Hos
pita
l
Beau
mon
t Hos
pita
l
Bant
ry G
ener
al H
ospi
tal
Unive
rsity
Hos
pita
l Wat
erfo
rd
Wex
ford
Gen
eral
Hos
pita
l
St V
ince
nt’s
Unive
rsity
Hos
pita
l
Our
Lad
y of
Lou
rdes
Hos
pita
l Dro
ghed
a
Mer
cy U
nive
rsity
Hos
pita
l
Lette
rken
ny U
nive
rsity
Hos
pita
l
Our
Lad
y’s H
ospi
tal,
Nav
an
May
o Un
iver
sity
Hosp
ital
Naa
s Gen
eral
Hos
pita
l
Cava
n Ge
nera
l Hos
pita
l
Nat
iona
l
PERCEN
TAGE
HOSPITALS

NOCA NATIONAL OFFICE OF CLINICAL AUDIT IRISH NATIONAL AUDIT OF STROKE NATIONAL REPORT 2019 8180
CHAPTER 6
MOOD SCREENINGStandard: Stroke care should include provision of screening for mood disturbance (Royal College of Physicians, 2016).
The reporting of mood screening was added into the dataset in 2017. Less than one-quarter of patients with a stroke were reported to have had a mood screen performed in 2019 (22%, n=958) (Figure 6.4), which is a reduction from 32% (n=900) in 2018 (NSP, 2019). However, for 32% (n=1348) of acute stroke cases, it was reported that mood screening was not indicated. Further education and training in relation to mood screening in the acute stage of stroke is required.
The NSP is in the process of developing a guidance document to assist in the management of mood and cognition for patients with a stroke. At present, a pathway for the assessment and management of depression following stroke in the acute setting is available on the NSP website (NSP, 2016).
FIGURE 6.4: MOOD SCREENING (N=4275)
Figure 6.4 Mood screening (N=4275)
22%
27%
32%
19%
0%
5%
10%
15%
20%
25%
30%
35%
Yes No Not indicated Unknown
PERC
ENTA
GE
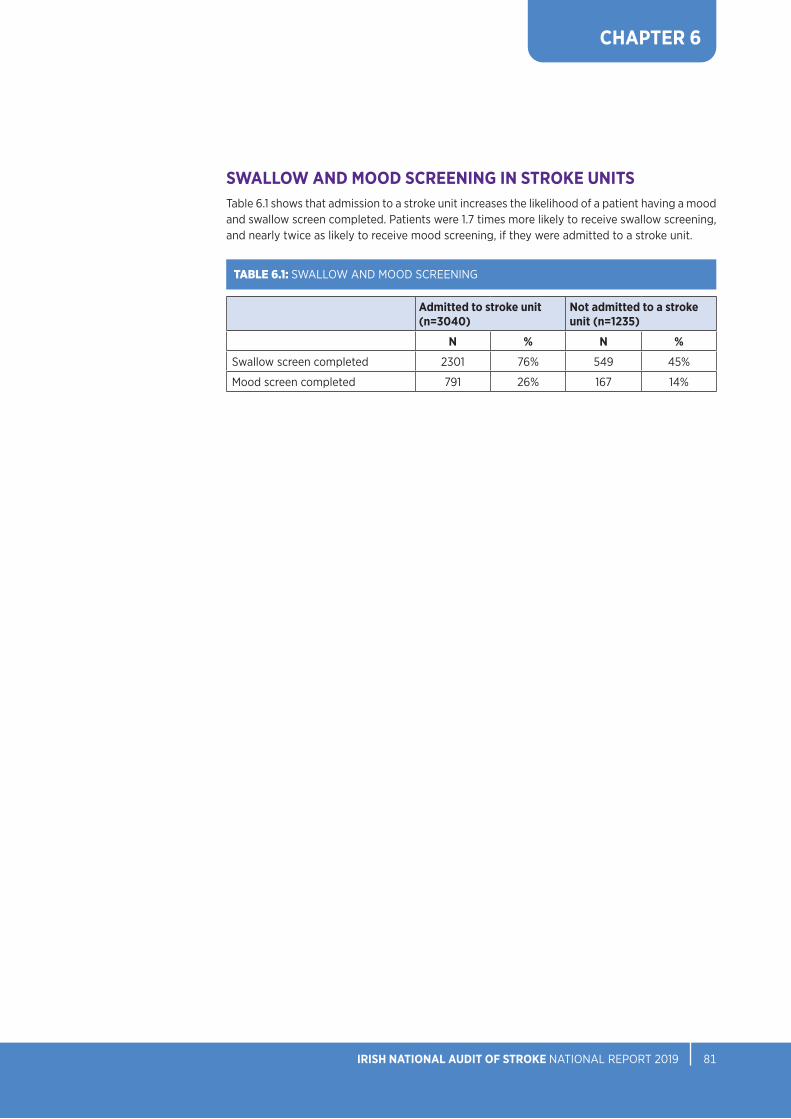
NOCA NATIONAL OFFICE OF CLINICAL AUDIT IRISH NATIONAL AUDIT OF STROKE NATIONAL REPORT 2019 8180
CHAPTER 6
SWALLOW AND MOOD SCREENING IN STROKE UNITS Table 6.1 shows that admission to a stroke unit increases the likelihood of a patient having a mood and swallow screen completed. Patients were 1.7 times more likely to receive swallow screening, and nearly twice as likely to receive mood screening, if they were admitted to a stroke unit.
Admitted to stroke unit (n=3040)
Not admitted to a stroke unit (n=1235)
N % N %
Swallow screen completed 2301 76% 549 45%
Mood screen completed 791 26% 167 14%
TABLE 6.1: SWALLOW AND MOOD SCREENING

NOCA NATIONAL OFFICE OF CLINICAL AUDIT IRISH NATIONAL AUDIT OF STROKE NATIONAL REPORT 2019 8382
CHAPTER 6
ACCESS TO HEALTH AND SOCIAL CARE PROFESSIONALSFigure 6.5A shows the percentage of patients who were assessed by each of six types of health and social care professionals (HSCPs). Eighty-eight percent (n=3741) of patients were assessed by at least one type of HSCP. Patients were most commonly assessed by physiotherapists (92%, n=3426), followed by occupational therapists (83%, n=3107), speech and language therapists (66%, n=2473), dietitians (33%, n=1228), medical social workers (26%, n=969), and psychologists (4%, n=141). The audit does not measure the quantity or quality of therapy a patient receives, although additional information on rehabilitation through physiotherapy, occupational therapy, and speech and language therapy is presented in Chapter 8.
The Irish Heart Foundation/HSE National Stroke Audit 2015 (McElwaine et al., 2015) highlighted the deficit of psychology services in stroke care. This is reflected in the limited number of cases assessed by a psychologist in 2019. Patients with a stroke should have access to a clinical neuro/psychologist as part of the core multidisciplinary stroke rehabilitation team (Royal College of Physicians, 2016).Figure 6.5A Health and social care professional assessment (n=3741)
92%
83%
66%
33%
26%
4%
4%
8%
12%
24%
31%
47%
4%
8%
18%
32%
32%
32%
1%
2%
4%
11%
11%
17%
0% 10% 20% 30% 40% 50% 60% 70% 80% 90% 100%
Physiotherapist
Occupational therapist
Speech and language therapist
Dietitian
Medical social worker
Psychologist
PERCENTAGE
Yes No Not indicated Unknown
Figure 6.5A Health and social care professional assessment (n=3741)
92%
83%
66%
33%
26%
4%
4%
8%
12%
24%
31%
47%
4%
8%
18%
32%
32%
32%
1%
2%
4%
11%
11%
17%
0% 10% 20% 30% 40% 50% 60% 70% 80% 90% 100%
Physiotherapist
Occupational therapist
Speech and language therapist
Dietitian
Medical social worker
Psychologist
PERCENTAGE
Yes No Not indicated Unknown
FIGURE 6.5A: HEALTH AND SOCIAL CARE PROFESSIONAL ASSESSMENT (n=3741)19
19 Figure 6.5A refers to patients who were assessed by a HSCP.
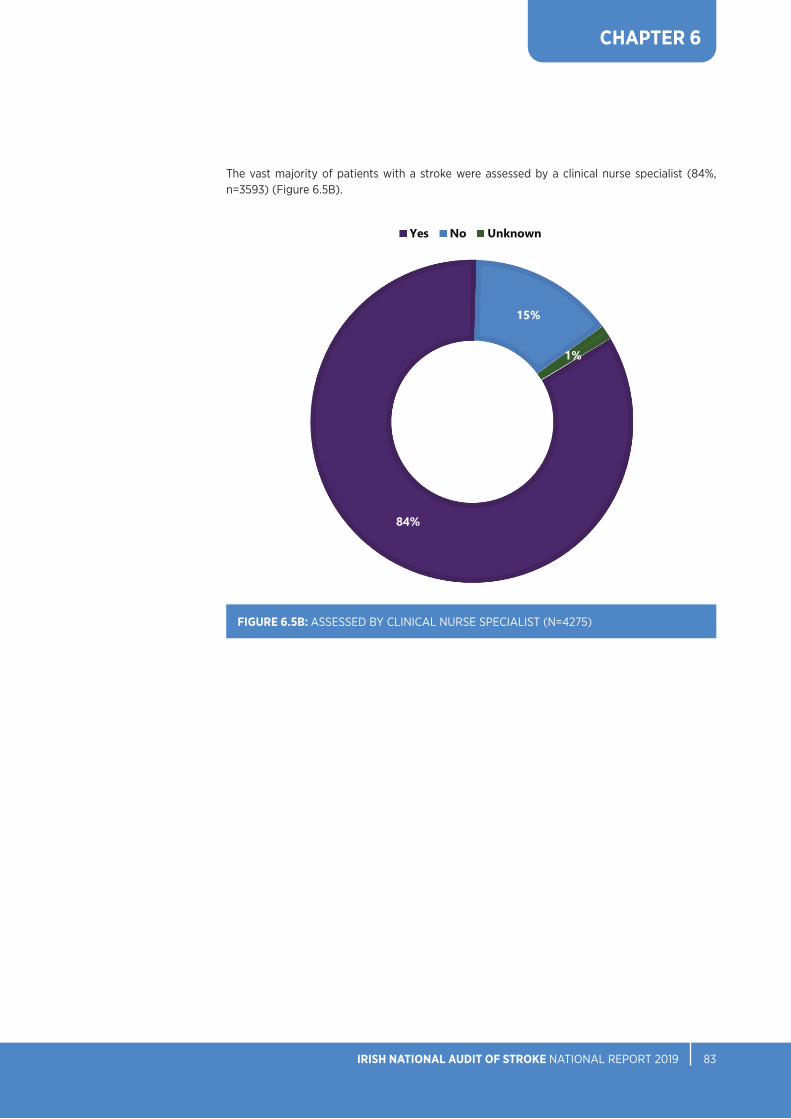
NOCA NATIONAL OFFICE OF CLINICAL AUDIT IRISH NATIONAL AUDIT OF STROKE NATIONAL REPORT 2019 8382
CHAPTER 6
The vast majority of patients with a stroke were assessed by a clinical nurse specialist (84%, n=3593) (Figure 6.5B).
FIGURE 6.5B: ASSESSED BY CLINICAL NURSE SPECIALIST (N=4275)
Figure 6.5B Assessed by clinical nurse specialist (N=4275)
84%
15%
1%
Yes No Unknown
Figure 6.5B Assessed by clinical nurse specialist (N=4275)
84%
15%
1%
Yes No Unknown

NOCA NATIONAL OFFICE OF CLINICAL AUDIT IRISH NATIONAL AUDIT OF STROKE NATIONAL REPORT 2019 8584
SECONDARY PREVENTIONWhen a person has had a stroke, they have an increased risk of further strokes over time; 26% of patients will experience a further stroke within 5 years and 39% will experience another stroke within 10 years (Mohan et al., 2011). Patients should be assessed for, and given information on, risk factors and lifestyle management issues (e.g. exercise, smoking, diet, weight, alcohol, stress management), and should be counselled on possible strategies to modify their lifestyle and risk factors (IHF, 2010). Secondary prevention includes early treatment with antithrombotics such as aspirin, and the diagnosis and treatment of atrial fibrillation and symptomatic carotid stenosis.
ANTITHROMBOTIC THERAPYStandard: Patients with acute ischaemic stroke should be given 300 mg of aspirin as soon as possible within 24 hours of stroke, unless contraindicated (Royal College of Physicians, 2016; IHF, 2010).
In 2019, a total of 88% (n=3228) of patients with ischaemic stroke had antithrombotic therapy prescribed. Figure 6.6 shows that more than one-half (58%, n=1752) of patients for whom time information was available commenced antithrombotic therapy on the same day as hospital arrival.
CHAPTER 6
20 Figure 6.6 refers to patients with ischaemic stroke who received antithrombotic therapy. 202 cases did not have time information recorded or it was recorded incorrectly. These cases have been excluded from Figure 6.6.
FIGURE 6.6: START TIMES FOR ANTITHROMBOTICS (n=3026)20
Figure 6.6 Start times for antithrombotics (n=3026)
58%
31%
9%
2%
0%
10%
20%
30%
40%
50%
60%
Same day Next day 2–7 days More than 8 days
PERC
ENTA
GE

NOCA NATIONAL OFFICE OF CLINICAL AUDIT IRISH NATIONAL AUDIT OF STROKE NATIONAL REPORT 2019 8584
CHAPTER 6
ATRIAL FIBRILLATIONStandard: For patients with atrial fibrillation and ischaemic stroke, anticoagulant medication is the standard treatment unless contraindicated (Royal College of Physicians, 2016; IHF, 2010).
ATRIAL FIBRILLATION PRE-STROKEAtrial fibrillation (AF) is the rapid, irregular beating of the heart resulting in a slow flow of blood through the heart. As the blood slows down it pools, and this can result in the formation of blood clots. If a clot leaves the heart and travels to the brain, it can cause a stroke by blocking the flow of blood through cerebral arteries. AF is treated with medications that prevent the formation of blood clots in the heart.
In 2019, 20% (n=832) of all stroke cases had a diagnosis of AF pre-stroke. Treatment with anticoagulant medication pre-stroke was reported in 83% (n=694) of these cases: novel oral anticoagulant (NOAC) treatment was reported in 65% (n=452) of cases and warfarin was reported in 17% (n=116) of cases. This is an improvement in the levels of anticoagulant medication prescribed for AF pre-stroke from 53% in 2015 (McElwaine et al., 2015) and 80% in 2017 (NSP, 2018). Twenty-seven percent (n=31) of cases who were taking warfarin pre-stroke were within the 2–3 international normalised ratio (INR) range on admission. Figure 6.7 indicates the breakdown of AF data by stroke type.

NOCA NATIONAL OFFICE OF CLINICAL AUDIT IRISH NATIONAL AUDIT OF STROKE NATIONAL REPORT 2019 8786
CHAPTER 6
FIGURE 6.7: BREAKDOWN OF PRE-STROKE ATRIAL FIBRILLATION DATA FOR PATIENTS WITH ISCHAEMIC AND HAEMORRHAGIC STROKE (N=4275)
ATRIAL FIBRILLATION IN PATIENTS WITH A STROKE
ALL PATIENTS WITH A STROKE (N=4275)
Ischaemic StrokeNumber of patients with
ischaemic stroke (n=3659)
30% (n=1109) of patients with ischaemic stroke had AF
81% (n=572) of patients with ischaemic stroke were prescribed
anticoagulant medication for AF prior to stroke.
AF was known prior to stroke in 63% (n=703) of patients with
ischaemic stroke.
26% (n=25) of patients with ischaemic stroke prescribed warfarin
for AF prior to stroke had an INR of between 2 and 3 on
admission to hospital.
64% (n= 366)of patients
with ischaemic stroke were prescribed
NOACsfor AF prior to stroke.
17% (n=96)of patients
with ischaemic stroke were prescribed warfarin for
AF prior to stroke.
Haemorrhagic StrokeNumber of patients with
haemorrhagic stroke (n=616)
24% (n=148) of patients withhaemorrhagic stroke had AF
95% (n=122) of patients with haemorrhagic stroke were prescribed
anticoagulant medication for AF prior to stroke.
AF was known prior to stroke in 87% (n=129) of patients with
haemorrhagic stroke.
30% (n=6) of patients with haemorrhagic stroke prescribed
warfarin for AF prior to stroke had an INR of between 2 and 3 on
admission to hospital.
71% (n=86)of patients withhaemorrhagic stroke were prescribedNOACs for AF priorto stroke.
16% (n=20) of patients withhaemorrhagic stroke were prescribedwarfarin for
AF priorto stroke.

NOCA NATIONAL OFFICE OF CLINICAL AUDIT IRISH NATIONAL AUDIT OF STROKE NATIONAL REPORT 2019 8786
ATRIAL FIBRILLATION AFTER STROKEA total of 1,109 ischaemic stroke cases in 2019 were reported to have an AF diagnosis; therefore, more than one-third (37%, n=406) of AF cases remain undiagnosed pre-stroke and are diagnosed after acute stroke. A previous study – conducted in association with the National Stroke Programme and the National Stroke Register (NSR) – on opportunistic screening for AF in general practice shows this to be cost-effective in stroke prevention (Moran et al., 2016). A clinical care pathway across primary and secondary care is required for the prevention and detection of AF.
In 2019, the prevalence of AF in patients with ischaemic stroke in Ireland was 30% (n=1109). In the UK, SSNAP (2020) reported it as 22%; however, caution is advised when comparing AF data between the National Stroke Register Report 2017 (NSP, 2018), the National Stroke Register Report 2018 (NSP, 2019) and the Sentinel Stroke National Audit Programme (2020) due to the difference in methodologies. The prevalence of AF in Ireland is consistent with that previously found in the North Dublin Population Stroke Study (Callaly et al., 2016).
FIGURE 6.8: SECONDARY PREVENTION TREATMENT FOR ATRIAL FIBRILLATION IN PATIENTS WITH ISCHAEMIC STROKE (n=1109)
Figure 6.8 Secondary prevention treatment for atrial fibrillation in patients with ischaemic stroke (n=1109)
74%
17%
9%
Yes No Unknown
Figure 6.8 Secondary prevention treatment for atrial fibrillation in patients with ischaemic stroke (n=1109)
74%
17%
9%
Yes No Unknown
CHAPTER 6

NOCA NATIONAL OFFICE OF CLINICAL AUDIT IRISH NATIONAL AUDIT OF STROKE NATIONAL REPORT 2019 8988
CHAPTER 6
Seventy-four percent (n=823) of patients with ischaemic stroke with an AF diagnosis had antiplatelet or anticoagulant medication prescribed post-stroke for secondary prevention on discharge (Figure 6.8). Table 6.2 shows that, of those, 86% (n=707) were prescribed NOAC. Further evaluation is required to understand the high level of patients in this cohort who were not prescribed antiplatelet or anticoagulant medication. Validation of the patients’ data may be required where information is unknown.
N %
NOAC 707 86%
Warfarin 36 4%
Aspirin 40 5%
Clopidogrel - *
Other antiplatelet - *
Dual antiplatelet therapy 6 1%
Antiplatelet and anticoagulant 25 3%
Unknown - *
Total 823 100.0%
- Denotes five cases or fewer* Further suppression required to prevent disclosure of five cases or fewer
TABLE 6.2 SECONDARY PREVENTION TREATMENT FOR PATIENTS WITH ISCHAEMIC STROKE AND WITH ATRIAL FIBRILLATION

NOCA NATIONAL OFFICE OF CLINICAL AUDIT IRISH NATIONAL AUDIT OF STROKE NATIONAL REPORT 2019 8988
CHAPTER 6
CAROTID STENOSISStandard: Patients with transient ischaemic attack (TIA) or an acute non-disabling stroke with stable neurological symptoms who have symptomatic severe carotid stenosis of 50–99% should be assessed and referred for carotid endarterectomy to be performed as soon as possible. Patients who meet the criteria for carotid intervention but who are unsuitable for open surgery (e.g. inaccessible carotid bifurcation, restenosis following endarterectomy, radiotherapy-associated carotid stenosis) should be considered for carotid angioplasty and stenting (Royal College of Physicians, 2016).
‘Stenosis’ is a medical term for narrowing of the blood vessels in the body due to a build-up of inflammatory substances and cholesterol deposits, called plaque. Two carotid arteries in the neck provide most of the blood flow from the heart to the brain. When stenosis occurs in these arteries, it is known as carotid artery stenosis. Patients with carotid artery stenosis are at increased risk for a stroke and should receive appropriate therapy.
Eight percent (n=325) of patients with a stroke in 2019 had symptomatic carotid stenosis (Figure 6.9), with 39% (n=126) referred for carotid endarterectomy and 9% (n=29) referred for carotid stenting and 8% (n=25) referred to both.
FIGURE 6.9: PATIENTS WITH A STROKE DIAGNOSED WITH CAROTID STENOSIS (N=4275)
Figure 6.9 Patients with a stroke diagnosed with carotid stenosis (N=4275)
8%
81%
11%
Yes No Unknown
Figure 6.9 Patients with a stroke diagnosed with carotid stenosis (N=4275)
8%
81%
11%
Yes No Unknown
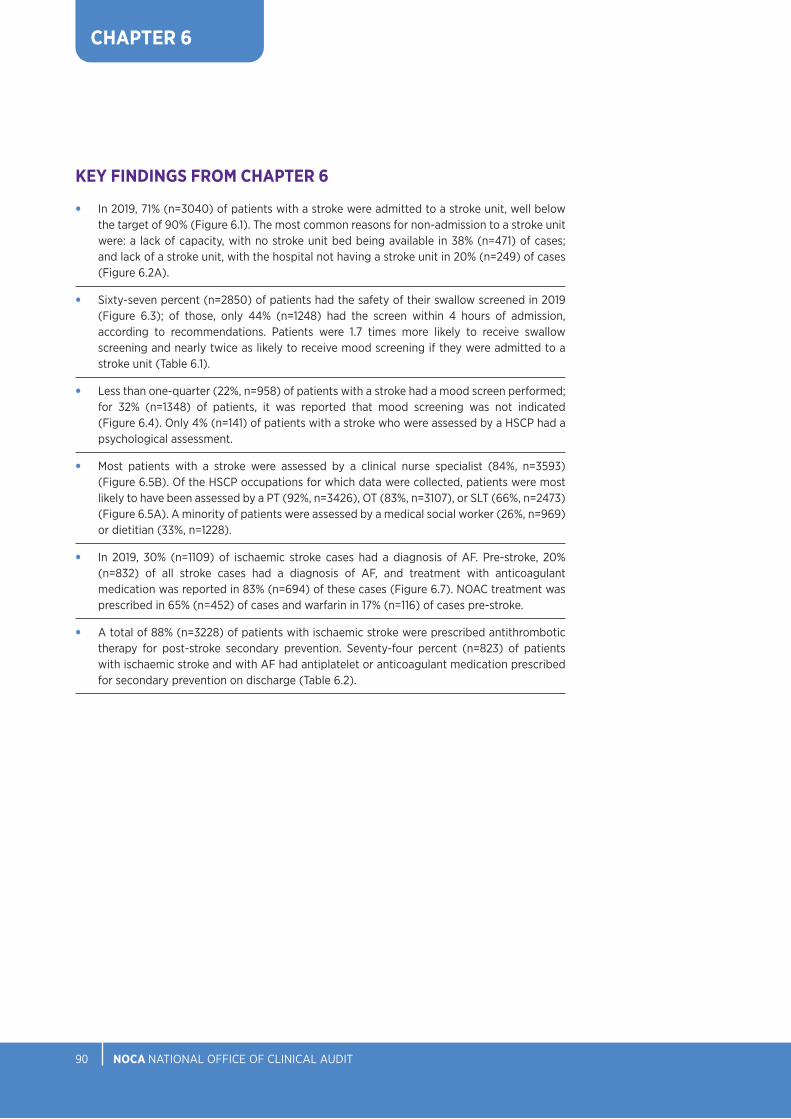
NOCA NATIONAL OFFICE OF CLINICAL AUDIT90
CHAPTER 6
KEY FINDINGS FROM CHAPTER 6
• In 2019, 71% (n=3040) of patients with a stroke were admitted to a stroke unit, well below the target of 90% (Figure 6.1). The most common reasons for non-admission to a stroke unit were: a lack of capacity, with no stroke unit bed being available in 38% (n=471) of cases; and lack of a stroke unit, with the hospital not having a stroke unit in 20% (n=249) of cases (Figure 6.2A).
• Sixty-seven percent (n=2850) of patients had the safety of their swallow screened in 2019 (Figure 6.3); of those, only 44% (n=1248) had the screen within 4 hours of admission, according to recommendations. Patients were 1.7 times more likely to receive swallow screening and nearly twice as likely to receive mood screening if they were admitted to a stroke unit (Table 6.1).
• Less than one-quarter (22%, n=958) of patients with a stroke had a mood screen performed; for 32% (n=1348) of patients, it was reported that mood screening was not indicated (Figure 6.4). Only 4% (n=141) of patients with a stroke who were assessed by a HSCP had a psychological assessment.
• Most patients with a stroke were assessed by a clinical nurse specialist (84%, n=3593) (Figure 6.5B). Of the HSCP occupations for which data were collected, patients were most likely to have been assessed by a PT (92%, n=3426), OT (83%, n=3107), or SLT (66%, n=2473) (Figure 6.5A). A minority of patients were assessed by a medical social worker (26%, n=969) or dietitian (33%, n=1228).
• In 2019, 30% (n=1109) of ischaemic stroke cases had a diagnosis of AF. Pre-stroke, 20% (n=832) of all stroke cases had a diagnosis of AF, and treatment with anticoagulant medication was reported in 83% (n=694) of these cases (Figure 6.7). NOAC treatment was prescribed in 65% (n=452) of cases and warfarin in 17% (n=116) of cases pre-stroke.
• A total of 88% (n=3228) of patients with ischaemic stroke were prescribed antithrombotic therapy for post-stroke secondary prevention. Seventy-four percent (n=823) of patients with ischaemic stroke and with AF had antiplatelet or anticoagulant medication prescribed for secondary prevention on discharge (Table 6.2).

CHAPTER 7OUTCOMES

NOCA NATIONAL OFFICE OF CLINICAL AUDIT IRISH NATIONAL AUDIT OF STROKE NATIONAL REPORT 2019 9392
CHAPTER 7
CHAPTER 7: OUTCOMES
KEY PERFORMANCE INDICATORS (KPIS)In 2012, the NSP agreed on three national KPIs to support the implementation of the Stroke Model of Care (HSE, 2012). These KPIs inform the HSE National Service Plan (HSE, 2019). The three KPIs are displayed in Table 7.1.
In 2019, the percentage of patients with acute stroke who spent all or some of their hospital stay in a stroke unit was 71% (n=3040). A detailed percentage breakdown by hospital is displayed in Figure 6.1.
Seventy-six percent (n=43907) of total bed days in 2019 were spent in a stroke unit. Individual hospital percentages are shown in Figure 7.4.
In 2019, 10.6% (n=389) of patients diagnosed with ischaemic stroke received thrombolysis treatment. Figure 4.8 displays the percentage of thrombolysis treatment in ischaemic stroke cases by hospital.
2019
Target % National %
KPI 1. Percentage of acute patients with stroke* who spent all or some of their hospital stay in a stroke unit 90% 71.1%
KPI 2. For patients with acute stroke admitted to an acute stroke unit, the percentage of their hospital stay spent in the stroke unit
90% 76.3%
KPI 3. The percentage of patients with confirmed acute ischaemic stroke who received thrombolysis 12% 10.6%
*Denotes wording used by National Service Plan 2020 (HSE, 2019)
TABLE 7.1 KEY PERFORMANCE INDICATORS

NOCA NATIONAL OFFICE OF CLINICAL AUDIT IRISH NATIONAL AUDIT OF STROKE NATIONAL REPORT 2019 9392
Figure 7.1A Modified Rankin Scale scores in patients with ischaemic stroke, pre-stroke and on discharge (n=3145)
19%
64%
35%
19%
37%
17%
9%
0% 10% 20% 30% 40% 50% 60% 70% 80% 90% 100%
On discharge
Pre-stroke
PERCENTAGE
No disability (0) Mild disability (1, 2) Moderate disability (3, 4, 5) Dead (6)
Figure 7.1A Modified Rankin Scale scores in patients with ischaemic stroke, pre-stroke and on discharge (n=3145)
19%
64%
35%
19%
37%
17%
9%
0% 10% 20% 30% 40% 50% 60% 70% 80% 90% 100%
On discharge
Pre-stroke
PERCENTAGE
No disability (0) Mild disability (1, 2) Moderate disability (3, 4, 5) Dead (6)
CHAPTER 7
FIGURE 7.1A: MODIFIED RANKIN SCALE SCORES IN PATIENTS WITH ISCHAEMIC STROKE, PRE-STROKE AND ON DISCHARGE (n=3145)21
21 514 ischaemic stroke cases did not have a pre-stroke and/or discharge mRS score recorded. These cases were excluded from Figure 7.1A.
DISCHARGE OUTCOMESPre-stroke and discharge modified Rankin Scale scoresThe modified Rankin Scale (mRS) is a simple universal scoring system for disability. While it is criticised by some, as it can be subjective, it is recognised internationally and allows hospitals and countries to compare their stroke populations. This is important, as a pre-stroke mRS score will have an impact on outcome. The recording of mRS scores continues to improve; in 2019, pre-stroke and discharge mRS score data were inputted on a total of 86% (n=3661) of all stroke cases. Figure 7.1A shows mRS scores for patients with ischaemic stroke (n=3659) and Figure 7.1B shows mRS scores for patients with haemorrhagic stroke (n=616).
Before admission to hospital for stroke, 64% (n=2017) of patients with ischaemic stroke had no disability (mRS score=0). On discharge, the majority 72% (n=2262) of patients with ischaemic stroke had a disability. The number of cases with moderate disability on admission (17%, n=536) increased on discharge (37%, n=1157). Stroke is a major cause of disability (Katan and Luft, 2018); consequently, Figures 7.1A and 7.1B reflect this decline in function after stroke. Nine percent of patients with ischaemic stroke were reported to have died (n=270).
Modified Rankin Scale (MRS)0 No symptoms1 No significant disability, despite symptoms; able to perform all usual duties and activities2 Slight disability; unable to perform all previous activities but able to look after own affairs without
assistance3 Moderate disability; requires some help, but able to walk without assistance4 Moderately severe disability; unable to walk without assistance and unable to attend to own bodily
needs without assistance5 Severe disability; bedridden, incontinent and requires constant nursing care and attention6 Death

NOCA NATIONAL OFFICE OF CLINICAL AUDIT IRISH NATIONAL AUDIT OF STROKE NATIONAL REPORT 2019 9594
Figure 7.1B Modified Rankin Scale scores in patients with haemorrhagic stroke, pre-stroke and on discharge (n=516)
8%
60%
19%
19%
43%
21%
30%
0% 10% 20% 30% 40% 50% 60% 70% 80% 90% 100%
On discharge
Pre-stroke
PERCENTAGE
No disability (0) Mild disability (1, 2) Moderate disability (3, 4, 5) Dead (6)
CHAPTER 7
By contrast, the majority of patients with haemorrhagic stroke (60%, n=309) had no disability pre-stroke (mRS score=0); however, only a small number of these patients were discharged with no disability (8%, n=42). In comparison, 20% (n=613) of patients with ischaemic stroke had no disability on discharge.
Patients with haemorrhagic stroke were also more likely to die (30%, n=157) than patients with ischaemic stroke (9%, n=270).
FIGURE 7.1B: MODIFIED RANKIN SCALE SCORES IN PATIENTS WITH HAEMORRHAGIC STROKE, PRE-STROKE AND ON DISCHARGE (n=516)22
22 100 haemorrhagic stroke cases did not have a pre-stroke and/or discharge mRS score recorded. These cases were excluded from Figure 7.1B.

NOCA NATIONAL OFFICE OF CLINICAL AUDIT IRISH NATIONAL AUDIT OF STROKE NATIONAL REPORT 2019 9594
CHAPTER 7
FIGURE 7.2: PRE-STROKE MODIFIED RANKIN SCALE SCORES, BY AGE GROUP (N=4275)
Figure 7.2 shows the pre-admission mRS scores for all stroke cases by age group. The distribution of scores, when presented by age group, shows that the score increases with age. The majority (52%, n=748) of patients with a stroke who were aged 80 years and over had mild or moderate disability pre-admission. The comparable figures were 26% (n=468) for patients aged between 65 and 79 years, and 13% (n=135) for patients aged between 17 and 64 years.
Figure 7.2 Pre-stroke modified Rankin Scale scores, by age group (N=4275)
34%
61%
78%
23%
16%
9%
29%
10%
4%
14%
13%
9%
0% 10% 20% 30% 40% 50% 60% 70% 80% 90% 100%
80+
65–79
17–64
PERCENTAGE
AGE
GRO
UP
No disability (0) Mild disability (1, 2) Moderate disability (3, 4, 5) Unknown

NOCA NATIONAL OFFICE OF CLINICAL AUDIT IRISH NATIONAL AUDIT OF STROKE NATIONAL REPORT 2019 9796
CHAPTER 7
HOSPITAL LENGTH OF STAYThe national median length of stay (LOS) in hospital for patients with a stroke was 9 days in 2019 (IQR: 5–19). Table 7.2 displays the median and IQR of total bed days spent in hospital by age group. Patients with a stroke aged 80 years or over spent more days (median: 11) in hospital than the younger patients, possibly due to the fact that they were more likely to have a pre-existing disability (see Figure 7.2), thus limiting their ability to rehabilitate as quickly as younger patients with a stroke.
Comparison of hospital LOS between hospitals is difficult due to different patient pathways in some stroke services. For example, an acute hospital may have a system in place for rapid transfer of patients with a stroke to an off-site rehabilitation unit. Where this occurs, these patients with a stroke will lead to a shorter LOS figure compared with a hospital that provides the majority of rehabilitation care on-site.
Age group
N (patients)
N (days)
Median (days)
IQR
Percentile 25 (days)
Percentile 75 (days)
17–64 1044 17448 8 4 15
65–79 1781 31446 8 5 18
80+ 1450 29953 11 5 25
Total 4275 78847 9 5 19
*Denotes wording used by National Service Plan 2020 (HSE, 2019)
TABLE 7.2 MEDIAN AND INTERQUARTILE RANGE OF BED DAYS IN HOSPITAL FOR PATIENTS WITH A STROKE, BY AGE GROUP (N=4275)

NOCA NATIONAL OFFICE OF CLINICAL AUDIT IRISH NATIONAL AUDIT OF STROKE NATIONAL REPORT 2019 9796
Figure 7.3 Median bed days in stroke unit, by hospital (n=3003)
16
13 13
11 11
10
9
8 8 8 8
7 7 7 7
6 6
5
8
0
2
4
6
8
10
12
14
16
Sout
h Ti
pper
ary
Gene
ral
Hosp
ital
Naa
s Gen
eral
Hos
pita
l
St V
ince
nt’s
Unive
rsity
Ho
spita
l
May
o Un
iver
sity
Hosp
ital
Our
Lad
y of
Lou
rdes
Hosp
ital D
rogh
eda
Cava
n Ge
nera
l Hos
pita
l
Unive
rsity
Hos
pita
lLim
erick
Slig
o Un
ivers
ity H
ospi
tal
Wex
ford
Gen
eral
Hos
pita
l
Cork
Uni
vers
ity H
ospi
tal
Bant
ry G
ener
al H
ospi
tal
Unive
rsity
Hos
pita
lW
ater
ford
Mat
er M
iseric
ordi
aeUn
ivers
ity H
ospi
tal
Mer
cy U
nive
rsity
Hos
pita
l
Beau
mon
t Hos
pita
l
Conn
olly
Hosp
ital
Talla
ght U
nive
rsity
Hosp
ital
St Ja
mes
’s Ho
spita
l
Nat
iona
l
MED
IAN
LO
S (D
AYS)
CHAPTER 7
LENGTH OF STAY IN STROKE UNITSIn 2019, 71% (n=3040) of patients with a stroke were admitted to a stroke unit. The majority of these cases had dates recorded for admission and discharge to stroke unit (99%, n=3003). The national mean LOS in a stroke unit was 15 days (standard deviation: 22).
Figure 7.3 illustrates the median bed days in a stroke unit by hospital. Although the national median LOS was 8 days, it varied by hospital from 5 to 16 days. The units with shorter median LOS may have different arrangements for transfer out of an acute unit to a rehabilitation unit, thus leading to a shorter hospital LOS. The LOS for any patient with a stroke should be the sum of the time they spent in an acute unit and a rehabilitation unit until their discharge from the acute hospital sector. Therefore, caution needs to be taken when suggesting that stroke unit care shortens LOS, as this may just reflect local circumstances.
FIGURE 7.3: MEDIAN BED DAYS IN STROKE UNIT, BY HOSPITAL (n=3003)23
23 37 cases did not have time information recorded or recorded incorrectly. These cases have been excluded from Figure 7.3

NOCA NATIONAL OFFICE OF CLINICAL AUDIT IRISH NATIONAL AUDIT OF STROKE NATIONAL REPORT 2019 9998
CHAPTER 7
PERCENTAGE OF HOSPITAL STAY SPENT IN THE STROKE UNITFigure 7.4 shows the percentage of bed days spent in a stroke unit. Out of 57,515 bed days spent in hospital in 2019, 76% (n=43907) were spent in a stroke unit. This is an increase from 71% (n=33552) in 2018 (NSR, 2019).
This is an issue for our health service. If a patient with a stroke spends 1 day waiting either in the emergency department or on a general medical ward for transfer to a stroke unit, the patient has to spend 9 days in the stroke unit to achieve the KPI target of 90%.
There is great variability between hospitals in the percentage of time patients spent in stroke units. This ranges from 42% to 98% (Figure 7.4), which is suggestive of a lack of sufficient stroke unit beds in the acute hospital sector. In order to achieve the KPI target of 90%, two factors are critical: First, there should be a free bed available to admit a patient with a stroke directly from the emergency department to the stroke unit. Second, the hospital should have a sufficient bed base not to move a patient with a stroke out of the stroke unit in order to make way for the next patient with a stroke. Figure 6.2A shows that the biggest reason for non-admission to a stroke unit is lack of a stroke unit bed.
FIGURE 7.4: PERCENTAGE OF BED DAYS SPENT IN STROKE UNIT, BY HOSPITAL (N=57515)
Figure 7.4 Percentage of bed days spent in stroke unit, by hospital (N=57515)
42%
51%
58%
60%
62%
68%
68%
69%
80%
81%
82%
87%
88%
94%
95%
95%
95%
98%
76%
0% 10% 20% 30% 40% 50% 60% 70% 80% 90% 100%
St James’s Hospital
Tallaght University Hospital
Wexford General Hospital
Connolly Hospital
University Hospital Waterford
Mater Misericordiae University Hospital
Beaumont Hospital
Mercy University Hospital
St Vincent’s University Hospital
University Hospital Limerick
Naas General Hospital
Cavan General Hospital
Our Lady of Lourdes Hospital Drogheda
South Tipperary General Hospital, Clonmel
Cork University Hospital
Mayo University Hospital
Sligo University Hospital
Bantry General Hospital
National
PERCENTAGE
HO
SPIT
ALS
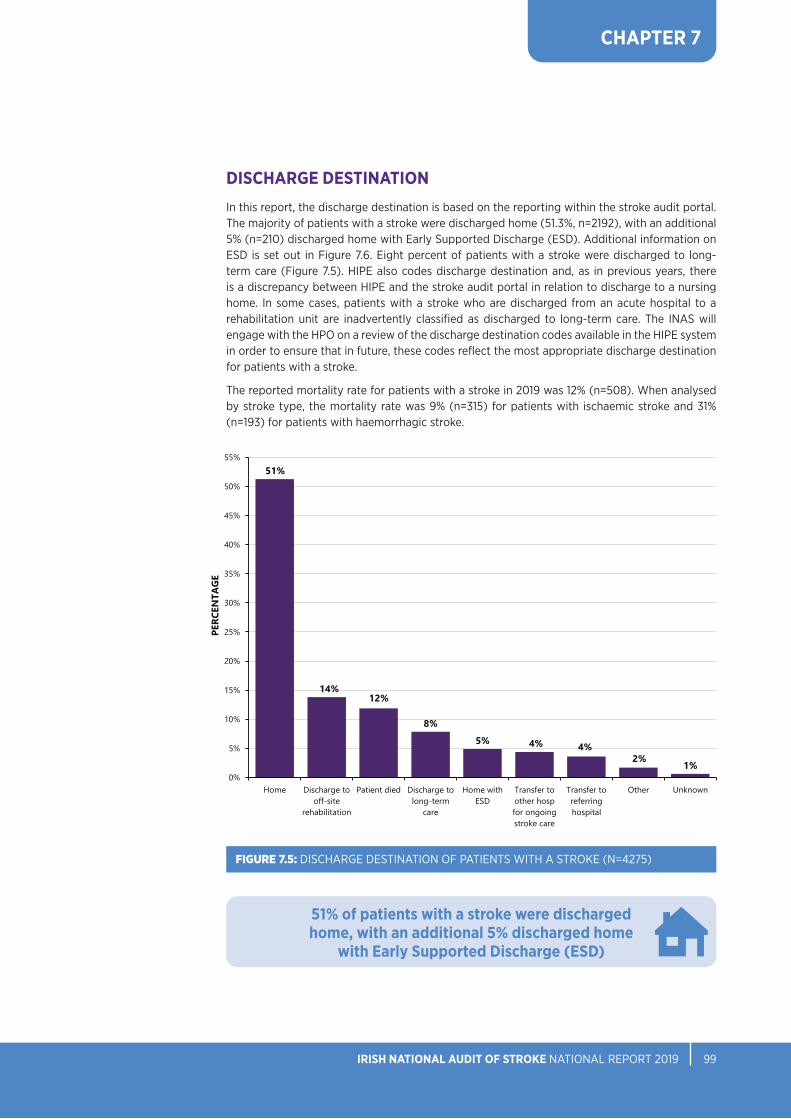
NOCA NATIONAL OFFICE OF CLINICAL AUDIT IRISH NATIONAL AUDIT OF STROKE NATIONAL REPORT 2019 9998
CHAPTER 7
DISCHARGE DESTINATIONIn this report, the discharge destination is based on the reporting within the stroke audit portal. The majority of patients with a stroke were discharged home (51.3%, n=2192), with an additional 5% (n=210) discharged home with Early Supported Discharge (ESD). Additional information on ESD is set out in Figure 7.6. Eight percent of patients with a stroke were discharged to long-term care (Figure 7.5). HIPE also codes discharge destination and, as in previous years, there is a discrepancy between HIPE and the stroke audit portal in relation to discharge to a nursing home. In some cases, patients with a stroke who are discharged from an acute hospital to a rehabilitation unit are inadvertently classified as discharged to long-term care. The INAS will engage with the HPO on a review of the discharge destination codes available in the HIPE system in order to ensure that in future, these codes reflect the most appropriate discharge destination for patients with a stroke.
The reported mortality rate for patients with a stroke in 2019 was 12% (n=508). When analysed by stroke type, the mortality rate was 9% (n=315) for patients with ischaemic stroke and 31% (n=193) for patients with haemorrhagic stroke.
FIGURE 7.5: DISCHARGE DESTINATION OF PATIENTS WITH A STROKE (N=4275)
Figure 7.5 Discharge destination of patients with a stroke (N=4275)
51%
14%12%
8%5% 4% 4%
2% 1%0%
5%
10%
15%
20%
25%
30%
35%
40%
45%
50%
55%
Home Discharge tooff-site
rehabilitation
Patient died Discharge tolong-term
care
Home withESD
Transfer toother hospfor ongoingstroke care
Transfer toreferringhospital
Other Unknown
PERC
ENTA
GE
51% of patients with a stroke were discharged home, with an additional 5% discharged home
with Early Supported Discharge (ESD)

NOCA NATIONAL OFFICE OF CLINICAL AUDIT IRISH NATIONAL AUDIT OF STROKE NATIONAL REPORT 2019 101100
CHAPTER 7
ESD is international best practice in providing care for patients with a stroke as it improves patient outcomes while facilitating a reduced LOS in hospital through the provision of stroke-specific rehabilitation in the home setting. Implementation of ESD is a fundamental aspect of the Stroke Model of Care (HSE, 2012). However, only six ESD teams are currently operational nationally. In 2019, 5% (n=210) of cases were discharged home with ESD. When calculated on the basis of the provision of ESD services from hospitals that have access to an ESD team, this rate was 10%. In the UK, discharge home with ESD is reported in 39% of cases (SSNAP 2020).
Figure 7.6 indicates the number of cases discharged home with ESD from each hospital that has access to an ESD team. It is important to note that no ESD team in Ireland has a fully resourced team, and this is reflected in the variable activity of each ESD team. Table 7.3 shows the composition of a fully resourced ESD team.
24 University Hospital Galway was excluded from the 2019 analysis.
FIGURE 7.6: CASES DISCHARGED HOME WITH EARLY SUPPORTED DISCHARGE, BY HOSPITAL (n=2110)24
Figure 7.6 Cases discharged home with Early Supported Discharge, by hospital (n=2110)
16%15%
10%
7%6%
0%
5%
10%
15%
20%
Mater MisericordiaeUniversity Hospital
University HospitalLimerick
Cork UniversityHospital/Mercy
University Hospital
Tallaght University Hospital/St James’s
Hospital
Beaumont Hospital
PERC
ENTA
GE
HOSPITALS
Profession Whole time equivalent (WTE)
Clinical nurse specialist 0.5 WTE
Occupational therapist, senior 1.0 WTE
Physiotherapist, senior 1.0 WTE
Speech and language therapist, senior 1.0 WTE
Medical social worker, senior 0.5 WTE
Therapy assistant 1.0 WTE
TABLE 7.3 COMPOSITION OF A FULLY RESOURCED EARLY SUPPORTED DISCHARGE TEAM

NOCA NATIONAL OFFICE OF CLINICAL AUDIT IRISH NATIONAL AUDIT OF STROKE NATIONAL REPORT 2019 101100
CHAPTER 7
KEY FINDINGS FROM CHAPTER 7
• For patients with a stroke who were admitted to an acute stroke unit, the percentage of their hospital stay spent in the stroke unit was 76% – the target is 90% (Table 7.1).
• Stroke is the leading cause of acquired disability, and the mRS scores indicate that 72% (n=2262) of ischaemic stroke cases (Figure 7.1A) and 62% (n=317) of haemorrhagic stroke cases (Figure 7.1B) had disabilities on discharge. The recording of the mRS continues to improve, with a total of 86% (n=3661) of all stroke cases having both pre-stroke and discharge mRS data inputted in 2019.
• Stroke unit LOS varied between hospitals (Figure 7.3), and may reflect the rapid movement of patients with a stroke in and out of a stroke unit, in order to accommodate new patients with a stroke. The shortage of beds was reflected in hospitals failing to hit their KPI target of spending at least 90% of their hospital stay in a stroke unit (Table 7.1).
• More than one-half (56%, n=2402) of patients were discharged home (Figure 7.5).
• In 2019, there were six ESD teams in Ireland (Figure 7.6). Only 5% of patients nationally were discharged home with ESD.
• The 2019 mortality figures for ischaemic (9%, n=315) and haemorrhagic (31%, n=193) stroke show no significant change from 2017 (NSP, 2018) or 2018 (NSP, 2019).


CHAPTER 8HEALTH AND SOCIAL
CARE PROFESSIONALS

NOCA NATIONAL OFFICE OF CLINICAL AUDIT IRISH NATIONAL AUDIT OF STROKE NATIONAL REPORT 2019 105104
CHAPTER 8
BACKGROUNDThe HSCP dataset was developed by the NSP in collaboration with the professional bodies for physiotherapy, occupational therapy, and speech and language therapy. It was piloted in 2017 and the first publication of the data was in 2018 (NSP, 2019). Data are collected by therapists in the hospital, and are presented in aggregate form. The HSCP dataset includes data from hospitals that are not reported on in other chapters. Further information can be found in the data quality statement in Chapter 3.
It is important to highlight that this chapter does not represent all of the PT, OT or SLT activity in a named hospital, nor does it imply that there is no activity in hospitals that are not currently represented in this analysis. Rather, it is an overview of some key discipline-specific information about the therapy provided to patients with a stroke.
PARTICIPATING HOSPITALSIn 2019, 17 hospitals had additional data recorded for patients who were seen by a HSCP. In Table 8.1, check marks () signify that a hospital had additional HSCP information recorded. In 2019, 11 hospitals had all three included disciplines reporting to the audit, which is an increase from 7 hospitals in 2018 (NSP, 2019).
CHAPTER 8: HEALTH AND SOCIAL CARE PROFESSIONALS
Hospital PT OT SLT
Beaumont Hospital
Connolly Hospital
Cork University Hospital
University Hospital Galway
Mater Misericordiae University Hospital
Regional Hospital Mullingar
Naas General Hospital
Our Lady of Lourdes Hospital Drogheda
St James’s Hospital
St Luke’s General Hospital, Carlow/Kilkenny
St Vincent’s University Hospital
Sligo University Hospital
Tallaght University Hospital
University Hospital Limerick
Cavan General Hospital
Mayo University Hospital
Mercy University Hospital
Bantry General Hospital
Letterkenny University Hospital
Our Lady’s Hospital, Navan
Portiuncula University Hospital
South Tipperary General Hospital
University Hospital Kerry
University Hospital Waterford
Wexford General Hospital
TABLE 8.1 PARTICIPATING HOSPITALS BY DISCIPLINE

NOCA NATIONAL OFFICE OF CLINICAL AUDIT IRISH NATIONAL AUDIT OF STROKE NATIONAL REPORT 2019 105104
CHAPTER 8
FIGURE 8.1: NUMBER OF PATIENTS ASSESSED BY HEALTH AND SOCIAL CARE PROFESSIONALS
Figure 8.1 Number of patients assessed by health and social care professionals
1604
1194
993
0
200
400
600
800
1000
1200
1400
1600
1800
PT OT SLT
NUM
BER
OF
PATI
ENTS
PARTICIPATING HSCP DISCIPLINESIn 2019, a total of 2,483 patients with a stroke had additional HSCP information recorded. Figure 8.1 displays the number of patients who had information recorded by each participating HSCP discipline.

NOCA NATIONAL OFFICE OF CLINICAL AUDIT IRISH NATIONAL AUDIT OF STROKE NATIONAL REPORT 2019 107106
CHAPTER 8
FIGURE 8.2: TIME FROM HOSPITAL ARRIVAL TO THERAPY ASSESSMENT, BY DISCIPLINE
Figure 8.2 Time from hospital arrival to therapy assessment, by discipline
17%
7%
16%
27%
25%
33%
11%
15%
11%
14%
27%
17%
2%
3%
2%
29%
23%
22%
0% 10% 20% 30% 40% 50% 60% 70% 80% 90% 100%
Speech and language therapy (n=993)
Occupational therapy (n=1194)
Physiotherapy (n=1604)
PERCENTAGE
Same day Next day 2 days 3–7 days 8 days or more Unknown
HSCP ASSESSMENTTime from hospital arrival to therapy assessmentThe number of days between arrival at hospital and assessment by a HSCP is displayed in Figure 8.2 for each of the disciplines. Almost one-half of patients who were seen by a PT (49%, n=778) or by a SLT (44%, n=437) were seen on the day of or the day after hospital arrival. One-third of patients who were seen by an OT (32%, n=379) were seen on the day of or the day after hospital arrival.
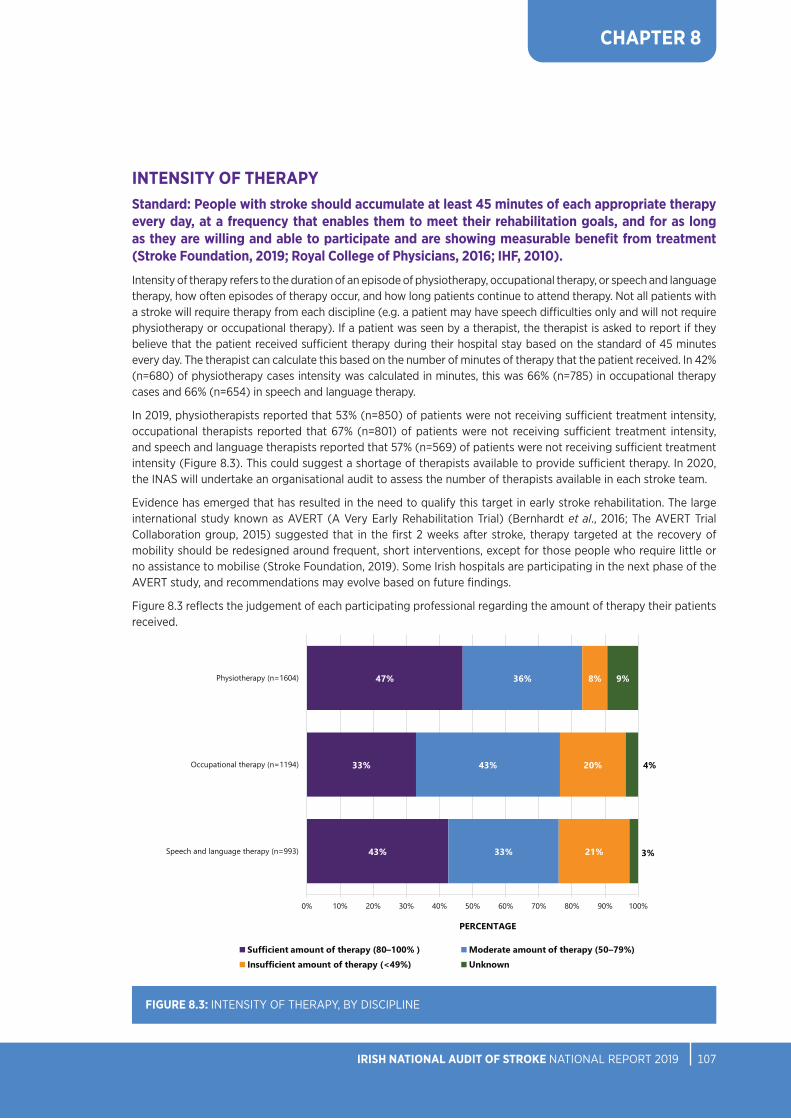
NOCA NATIONAL OFFICE OF CLINICAL AUDIT IRISH NATIONAL AUDIT OF STROKE NATIONAL REPORT 2019 107106
CHAPTER 8
FIGURE 8.3: INTENSITY OF THERAPY, BY DISCIPLINE
Figure 8.3 Intensity of therapy, by discipline
43%
33%
47%
33%
43%
36%
21%
20%
8%
3%
4%
9%
0% 10% 20% 30% 40% 50% 60% 70% 80% 90% 100%
Speech and language therapy (n=993)
Occupational therapy (n=1194)
Physiotherapy (n=1604)
PERCENTAGE
Sufficient amount of therapy (80–100% ) Moderate amount of therapy (50–79%)
Insufficient amount of therapy (<49%) Unknown
INTENSITY OF THERAPYStandard: People with stroke should accumulate at least 45 minutes of each appropriate therapy every day, at a frequency that enables them to meet their rehabilitation goals, and for as long as they are willing and able to participate and are showing measurable benefit from treatment (Stroke Foundation, 2019; Royal College of Physicians, 2016; IHF, 2010).
Intensity of therapy refers to the duration of an episode of physiotherapy, occupational therapy, or speech and language therapy, how often episodes of therapy occur, and how long patients continue to attend therapy. Not all patients with a stroke will require therapy from each discipline (e.g. a patient may have speech difficulties only and will not require physiotherapy or occupational therapy). If a patient was seen by a therapist, the therapist is asked to report if they believe that the patient received sufficient therapy during their hospital stay based on the standard of 45 minutes every day. The therapist can calculate this based on the number of minutes of therapy that the patient received. In 42% (n=680) of physiotherapy cases intensity was calculated in minutes, this was 66% (n=785) in occupational therapy cases and 66% (n=654) in speech and language therapy.
In 2019, physiotherapists reported that 53% (n=850) of patients were not receiving sufficient treatment intensity, occupational therapists reported that 67% (n=801) of patients were not receiving sufficient treatment intensity, and speech and language therapists reported that 57% (n=569) of patients were not receiving sufficient treatment intensity (Figure 8.3). This could suggest a shortage of therapists available to provide sufficient therapy. In 2020, the INAS will undertake an organisational audit to assess the number of therapists available in each stroke team.
Evidence has emerged that has resulted in the need to qualify this target in early stroke rehabilitation. The large international study known as AVERT (A Very Early Rehabilitation Trial) (Bernhardt et al., 2016; The AVERT Trial Collaboration group, 2015) suggested that in the first 2 weeks after stroke, therapy targeted at the recovery of mobility should be redesigned around frequent, short interventions, except for those people who require little or no assistance to mobilise (Stroke Foundation, 2019). Some Irish hospitals are participating in the next phase of the AVERT study, and recommendations may evolve based on future findings.
Figure 8.3 reflects the judgement of each participating professional regarding the amount of therapy their patients received.

NOCA NATIONAL OFFICE OF CLINICAL AUDIT IRISH NATIONAL AUDIT OF STROKE NATIONAL REPORT 2019 109108
CHAPTER 8
FIGURE 8.4: PHYSIOTHERAPY MOBILITY OUTCOMES (n=1443)25
Figure 8.4 Physiotherapy mobility outcomes (n=1443)
47%
75%
15%
17%
17%
5%
8%
2%
8%
1%
6%
0% 10% 20% 30% 40% 50% 60% 70% 80% 90% 100%
On discharge
Pre-admission
PERCENTAGE
Independent, with no aid
Independent, with aid
Supervision or assistance of one person, with or without aid
Transfer only with assistance
Hoist transfer
Died
PHYSIOTHERAPY PT: MOBILITY OUTCOMESIn 2019, the vast majority (75%, n=1077) of patients with a stroke were independent and did not require an aid for mobility prior to their stroke; however, this fell to 47% (n=672) on discharge after stroke. The percentage of patients who required the supervision or the assistance of one person to walk increased from 5% (n=74) pre-admission to 17% (n=247) on discharge. Post-stroke, 8% (n=113) required assistance of another person to transfer from bed to a chair, and 8% (n=112) required a hoist to transfer. Figure 8.4 details patients’ increased level of disability following stroke.
25 Information was not available for 161 cases. These cases were excluded from Figure 8.4.

NOCA NATIONAL OFFICE OF CLINICAL AUDIT IRISH NATIONAL AUDIT OF STROKE NATIONAL REPORT 2019 109108
CHAPTER 8
PT: ASSISTANCE OF MORE THAN ONE THERAPISTFigure 8.5 indicates that more than one-quarter (26%, n=419) of patients with a stroke who were assessed by a PT required the simultaneous assistance of more than one therapist or therapy assistant during therapy sessions. This contextual information is important when planning staffing and designing physiotherapy services for patients with a stroke, and is similar to the proportion of cases in 2018 (23%) (NSP, 2019), reflecting the level of physical dependence in the stroke population.
FIGURE 8.5: PHYSIOTHERAPY CASES REQUIRING THE ASSISTANCE OF MORE THAN ONE THERAPIST/THERAPY ASSISTANT (n=1604)
Figure 8.5 Physiotherapy cases requiring the assistance of more than one therapist/therapy assistant (n=1604)
26%
66%
8%
Yes No Unknown
Figure 8.5 Physiotherapy cases requiring the assistance of more than one therapist/therapy assistant (n=1604)
26%
66%
8%
Yes No Unknown

NOCA NATIONAL OFFICE OF CLINICAL AUDIT IRISH NATIONAL AUDIT OF STROKE NATIONAL REPORT 2019 111110
CHAPTER 8
PT: ONWARD REFERRALFollowing a physiotherapy assessment, almost half (45%, n=717) of patients with a stroke required onward referral for physiotherapy (Figure 8.6). Only 4% (n=70) of patients were referred for ESD. There are currently six ESD teams active across Ireland (see Chapter 7 for additional information).
FIGURE 8.6: PHYSIOTHERAPY ONWARD REFERRAL DESTINATION (n=1604)
Figure 8.6 Physiotherapy onward referral destination (n=1604)
48%
20%
9% 8% 7%
4%3%
2%0%
5%
10%
15%
20%
25%
30%
35%
40%
45%
50%
No follow-uprequired
Inpatientrehabilitation
Community PT Other Unknown ESD Stroke-specificoutpatient
department PT
Day hospital
PERC
ENTA
GE

NOCA NATIONAL OFFICE OF CLINICAL AUDIT IRISH NATIONAL AUDIT OF STROKE NATIONAL REPORT 2019 111110
CHAPTER 8
FIGURE 8.7: OCCUPATIONAL THERAPY ACTIVITIES OF DAILY LIVING PRE- AND POST-STROKE (n=1133)26
OCCUPATIONAL THERAPY OT: ACTIVITIES OF DAILY LIVING PRE- AND POST-STROKEThe term ‘activities of daily living’ (ADLs) collectively describes the fundamental skills that are required to independently care for oneself, such as eating, bathing and mobility. Figure 8.7 displays the distribution of ADLs among patients with a stroke both pre-admission and on discharge. Prior to admission, 80% (n=902) of patients with a stroke were independent in their ability to attend to their ADLs. On discharge, this fell to 43% (n=486). On discharge, 12% (n=141) required supervision or set-up (e.g. help cutting up food), 23% (n=261) required assistance with ADLs, and 10% (n=118) required full care.
26 Information was not available for 61 cases. These cases were excluded from Figure 8.7.
Figure 8.7 Occupational therapy activities of daily living pre- and post-stroke (n=1133)
43%
80%
7%
4%
12%
5%
23%
10%
10%
2%
5%
0% 10% 20% 30% 40% 50% 60% 70% 80% 90% 100%
On discharge
Pre-admission
PERCENTAGEIndependent Indep with cues/aids
Required supervision or set-up Required assistance
Dependent/full care Died

NOCA NATIONAL OFFICE OF CLINICAL AUDIT IRISH NATIONAL AUDIT OF STROKE NATIONAL REPORT 2019 113112
CHAPTER 8
OT: VISUAL FIELD ASSESSMENTStandard: All patients should be screened for cognitive and perceptual deficits using validated and reliable screening tools (Stroke Foundation, 2019; Royal College of Physicians, 2016).
Sixty-seven percent (n=801) of patients with a stroke who were assessed by an OT were screened for cognitive problems; 12% (n=144) were unable to complete the screening due to patient factors.
Three-quarters (75%, n=893) of patients with a stroke had a visual field assessment during their admission, which is an increase from 69% reported in 2018 (NSP, 2019). Figure 8.8 displays the percentage of patients who underwent specific types of visual field assessment.
FIGURE 8.8: OCCUPATIONAL THERAPY VISUAL FIELD ASSESSMENT (n=1194)
Figure 8.8 Occupational therapy visual field assessment (n=1194)
63%
9%
2%
11% 11%
4%
0%
10%
20%
30%
40%
50%
60%
70%
Yes, usingconfrontation
testing
Yes, using bothconfrontationand perimetry
testing
Yes, usingperimetry testing
Attempted, butunable due topatient factors
No Unknown
PERC
ENTA
GE
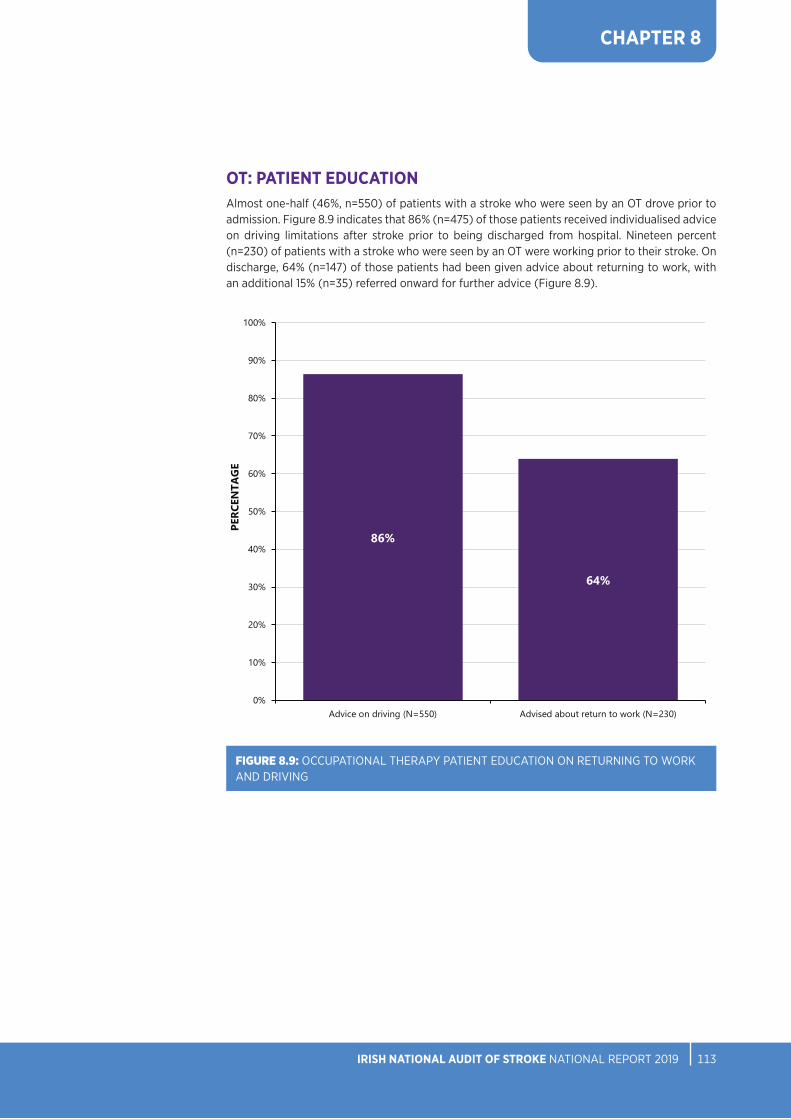
NOCA NATIONAL OFFICE OF CLINICAL AUDIT IRISH NATIONAL AUDIT OF STROKE NATIONAL REPORT 2019 113112
CHAPTER 8
OT: PATIENT EDUCATION Almost one-half (46%, n=550) of patients with a stroke who were seen by an OT drove prior to admission. Figure 8.9 indicates that 86% (n=475) of those patients received individualised advice on driving limitations after stroke prior to being discharged from hospital. Nineteen percent (n=230) of patients with a stroke who were seen by an OT were working prior to their stroke. On discharge, 64% (n=147) of those patients had been given advice about returning to work, with an additional 15% (n=35) referred onward for further advice (Figure 8.9).
FIGURE 8.9: OCCUPATIONAL THERAPY PATIENT EDUCATION ON RETURNING TO WORK AND DRIVING
Figure 8.9 OT patient education on returning to work and driving
86%
64%
0%
10%
20%
30%
40%
50%
60%
70%
80%
90%
100%
Advice on driving (N=550) Advised about return to work (N=230)
PERCEN
TAGE

NOCA NATIONAL OFFICE OF CLINICAL AUDIT IRISH NATIONAL AUDIT OF STROKE NATIONAL REPORT 2019 115114
CHAPTER 8
OT: ASSISTANCE OF MORE THAN ONE THERAPISTFigure 8.10 indicates that almost one-quarter (24%, n=292) of patients with a stroke who were assessed by an OT required the assistance of more than one therapist or therapy assistant during therapy sessions more than half of the time. This is similar to what is reflected in the physiotherapy dataset.
FIGURE 8.10: OCCUPATIONAL THERAPY CASES REQUIRING THE ASSISTANCE OF MORE THAN ONE THERAPIST/THERAPY ASSISTANT (n=1194)
Figure 8.10 Occupational therapy cases requiring the assistance of more than one therapist/therapy assistant (n=1194)
24%
73%
3%
Yes No Unknown
Figure 8.10 Occupational therapy cases requiring the assistance of more than one therapist/therapy assistant (n=1194)
24%
73%
3%
Yes No Unknown

NOCA NATIONAL OFFICE OF CLINICAL AUDIT IRISH NATIONAL AUDIT OF STROKE NATIONAL REPORT 2019 115114
CHAPTER 8
OT: ONWARD REFERRAL More than one-half (51%, n=612) of patients with a stroke who received an occupational therapy assessment were referred for further assessment. Of these, 35% (n=215) of patients were referred to an inpatient rehabilitation service (off-site), 25% (n=152) of patients were referred to community OT, 21% (n=126) of patients were referred for ESD, and 19% (n=119) had other onward referral destinations (Figure 8.11).
FIGURE 8.11: OCCUPATIONAL THERAPY ONWARD REFERRAL DESTINATION (n=612)
Figure 8.11 Occupational therapy onward referral destination (n=612)
35%
25%
21%19%
0%
5%
10%
15%
20%
25%
30%
35%
Inpatient rehabilitation(off-site)
Community OT ESD Other
PERC
ENTA
GE

NOCA NATIONAL OFFICE OF CLINICAL AUDIT IRISH NATIONAL AUDIT OF STROKE NATIONAL REPORT 2019 117116
CHAPTER 8
SPEECH AND LANGUAGE THERAPYIn 2019, data for 993 cases were added to the HSCP stroke audit portal by speech and language therapists.
SLT: COMMUNICATION AND SWALLOW DIFFICULTIES Following initial assessment, a diagnosis of communication and/or swallow difficulties was made in 85% (n=845) of patients with a stroke who were assessed by a SLT, in 15% (n=148) of cases, no difficulties were identified, or the difficulty was unknown. Figure 8.12 displays the difficulties that were identified for the 845 patients who had a diagnosis of communication and/or swallow difficulties.
FIGURE 8.12: COMMUNICATION AND SWALLOW DIFFICULTIES IDENTIFIED BY SPEECH AND LANGUAGE THERAPISTS (n=845)27
Figure 8.12 Communication and swallow difficulties identified by speech and language therapists (n=845)
8%
13%
28%
40%
50%
59%
0% 10% 20% 30% 40% 50% 60%
Dyspraxia
Voice difficulties
Cognitive linguistic communication disorder
Aphasia
Dysarthria
Swallow difficulty
PERCENTAGE
Figure 8.12 Communication and swallow difficulties identified by speech and language therapists (n=845)
8%
13%
28%
40%
50%
59%
0% 10% 20% 30% 40% 50% 60%
Dyspraxia
Voice difficulties
Cognitive linguistic communication disorder
Aphasia
Dysarthria
Swallow difficulty
PERCENTAGE
Figure 8.12 Communication and swallow difficulties identified by speech and language therapists (n=845)
8%
13%
28%
40%
50%
59%
0% 10% 20% 30% 40% 50% 60%
Dyspraxia
Voice difficulties
Cognitive linguistic communication disorder
Aphasia
Dysarthria
Swallow difficulty
PERCENTAGE
27 Figure 8.12 represents patients that had a diagnosis of swallow and/or communication difficulty diagnosed by a speech and language therapist

NOCA NATIONAL OFFICE OF CLINICAL AUDIT IRISH NATIONAL AUDIT OF STROKE NATIONAL REPORT 2019 117116
CHAPTER 8
SLT: PRE- AND POST-STROKE COMMUNICATIONFigure 8.13 displays pre- and post-stroke communication ability. Prior to admission, the vast majority (81%, n=753) of patients with a stroke had no difficulties in their ability to speak and communicate. On discharge, there was an increase in the number of patients who were reported to have communication difficulties. Thirty-four percent (n=318) were reported to have mild communication difficulties, 17% (n=161) had moderate communication difficulties, 10% (n=91) had severe communication difficulties, and 3% (n=25) had profound communication difficulties.
FIGURE 8.13: SPEECH AND LANGUAGE THERAPY PRE- AND POST-STROKE COMMUNICATION ABILITY (n=934)28
28 Information was not available for 59 cases. These cases were excluded from Figure 8.13.
Figure 8.13 Speech and language therapy pre- and post-stroke communication ability (n=934)
28%
81%
34%
13%
17%
5%
10%
1%
3% 8%
0% 20% 40% 60% 80% 100%
On discharge
Pre-admission
PERCENTAGENo difficulties
Mild: >80% effective communication; occasional breakdown in conversation
Moderate: 50–79% effective communication; frequent breakdown in conversation
Severe: Less than half (10–49%) of communication attempts are successful
Profound: No, or occasional (<10%), communication attempts are successful
Died

NOCA NATIONAL OFFICE OF CLINICAL AUDIT IRISH NATIONAL AUDIT OF STROKE NATIONAL REPORT 2019 119118
CHAPTER 8
SLT: SWALLOW INVESTIGATIONS‘Dysphagia’ is a term that is used to describe difficulty in swallowing food or fluids. People with dysphagia may have an unsafe swallow that can lead to food or fluid entering the airway (aspiration), which may cause coughing, gagging or breathing difficulties. The ability to swallow can be affected after a stroke. A SLT will assess a person’s ability to swallow safely through clinical evaluation and sometimes using instrumental assessment, and can recommend a diet that is adjusted with regard to texture or content in order to reduce the risk of aspiration. This is referred to as a ‘texture-modified diet’.
Figure 8.14 displays the percentage of patients who had an instrumental assessment of their swallow completed during hospital admission in 2019. Eleven percent (n=107) of patients had a videofluoroscopy examination and 4% (n=42) had a fiberoptic endoscopic evaluation of swallowing (FEES) performed. These assessments are considered for patients who are suspected of aspiration or who require tube feeding or dietary modification (Royal College of Physicians, 2016).
FIGURE 8.14: SPEECH AND LANGUAGE THERAPY SWALLOW INVESTIGATIONS (n=993)
Figure 8.14 Speech and language therapy swallow investigations (n=993)
4%
11%
93%
87%
1%
1%
2%
2%
0% 10% 20% 30% 40% 50% 60% 70% 80% 90% 100%
FEES
Videofluoroscopy
PERCENTAGE
Yes No Indicated but not available Unknown

NOCA NATIONAL OFFICE OF CLINICAL AUDIT IRISH NATIONAL AUDIT OF STROKE NATIONAL REPORT 2019 119118
CHAPTER 8
SLT: PRE- AND POST-STROKE MODIFIED DIETPrior to admission, only 5% (n=50) of patients with a stroke had been on a recommended modified diet. On discharge, about one-quarter (26%, n=247) of patients with a stroke had a texture-modified diet recommended to them (Figure 8.15).
Figure 8.15 Speech and language therapy pre- and post-stroke modified diet (n=948)
26%
5%
74%
95%
0% 10% 20% 30% 40% 50% 60% 70% 80% 90% 100%
On discharge
Pre-admission
PERCENTAGE
Yes No
FIGURE 8.15: SPEECH AND LANGUAGE THERAPY PRE- AND POST-STROKE MODIFIED DIET (n=948)29
29 Information was not available for 45 cases. These cases were excluded from Figure 8.15.

NOCA NATIONAL OFFICE OF CLINICAL AUDIT IRISH NATIONAL AUDIT OF STROKE NATIONAL REPORT 2019 121120
CHAPTER 8
SLT: PRE- AND POST-STROKE MODIFIED FLUIDSThe percentage of patients with a stroke who were recommended modified fluids (thickened liquids) increased from 2% (n=22) pre-admission to 17% (n=158) on discharge (Figure 8.16).
Figure 8.16 Speech and language therapy pre- and post-stroke modified fluids (n=950)
17%
2%
83%
98%
0% 10% 20% 30% 40% 50% 60% 70% 80% 90% 100%
On discharge
Pre-admission
PERCENTAGE
Yes No
30 Information was not available for 43 cases. These cases were excluded from Figure 8.16.
FIGURE 8.16: SPEECH AND LANGUAGE THERAPY PRE- AND POST-STROKE MODIFIED FLUIDS (n=950)30

NOCA NATIONAL OFFICE OF CLINICAL AUDIT IRISH NATIONAL AUDIT OF STROKE NATIONAL REPORT 2019 121120
CHAPTER 8
SLT: ENTERAL FEEDING ON DISCHARGESeven percent (n=65) of patients with a stroke required enteral feeding on discharge (Figure 8.17).
FIGURE 8.17: SPEECH AND LANGUAGE THERAPY ENTERAL FEEDING ON DISCHARGE (n=993)
Figure 8.17 Speech and language therapy enteral feeding on discharge (n=993)
6%
91%
3%
Yes No Unknown
Figure 8.17 Speech and language therapy enteral feeding on discharge (n=993)
6%
91%
3%
Yes No Unknown

NOCA NATIONAL OFFICE OF CLINICAL AUDIT IRISH NATIONAL AUDIT OF STROKE NATIONAL REPORT 2019 123122
CHAPTER 8
SLT: ONWARD REFERRALFollowing speech and language assessment, 51% (n=509) of patients with a stroke were referred for further speech and language therapy. Twenty-one percent (n=210) of patients were referred to community SLT, 18% (n=174) for inpatient rehabilitation, 4% (n=43) were referred to ESD, and 8% (n=82) had other onward referral destinations. For 6% (n=59) of cases, the onward referral destination was not known.
FIGURE 8.18: SPEECH AND LANGUAGE THERAPY ONWARD REFERRAL DESTINATION (n=993)
Figure 8.18 Speech and language therapy onward referral destination (n=993)
43%
21%
18%
8%
6%4%
0%
5%
10%
15%
20%
25%
30%
35%
40%
45%
No follow-uprequired
Community SLT Inpatientrehabilitation
Other Unknown ESD
PERC
ENTA
GE

NOCA NATIONAL OFFICE OF CLINICAL AUDIT IRISH NATIONAL AUDIT OF STROKE NATIONAL REPORT 2019 123122
CHAPTER 8
KEY FINDINGS FROM CHAPTER 8
• Within the HSCP dataset, almost one-half of patients who were seen by a PT (49%, n=778) or by a SLT (44%, n= 437) were seen on the day of or the day after hospital arrival. One-third of patients who were seen by an OT (32%, n=379) were seen on the day of or the day after hospital arrival.
• Within the HSCP dataset, PTs reported that 53% (n=850) of patients were not receiving sufficient treatment intensity, OTs reported that 67% (n=801) of patients were not receiving sufficient treatment intensity, and SLTs reported that 57% (n=569) of patients were not receiving sufficient treatment intensity (Figure 8.3).
• About one-quarter of patients with a stroke who were assessed by a PT (26%, n=419) (Figure 8.5) or an OT (24%, n=292) (Figure 8.10) within the HSCP dataset were physically dependent following their stroke, requiring the simultaneous assistance of two therapists for rehabilitation.
• Within the HSCP dataset, OTs reported that, almost one-half (46%, n=550) drove prior to admission, and 19% (n=230) were working prior to their stroke.
• Within the HSCP dataset, in 85% (n=845) of stroke cases assessed by a SLT, a swallowing or communication difficulty was diagnosed.
• Within the HSCP dataset, PTs reported that 8% (n=112) of patients with a stroke required a full hoist for transfer on hospital discharge, OTs reported that 10% (n=118) required full care with ADLs on hospital discharge, and SLTs reported that 7% (n=65) required enteral feeding on hospital discharge.
• Within the HSCP dataset, all therapists reported that approximately one-half of their patient groups required follow-up therapy on discharge. There are various follow-up options available across Ireland reflected in the results, including community therapy, inpatient rehabilitation, day hospital, and ESD.


CHAPTER 9AUDIT UPDATE

NOCA NATIONAL OFFICE OF CLINICAL AUDIT IRISH NATIONAL AUDIT OF STROKE NATIONAL REPORT 2019 127126
CHAPTER 9
CHAPTER 9: AUDIT UPDATE
VALUE OF AUDIT2019 has been a defining year for the INAS. The establishment of the National Stroke Register (NSR) in 2012 to monitor the implementation of the stroke care pathway has been a key component of the HSE’s Stroke Model of Care (HSE, 2012). It has taken many years to embed the capture of high-quality data into practice, and 2019 marks the first time that additional clinical information was available on more than 80% (n=4444) of all patients with acute stroke who were admitted to acute stroke services (Table 3.2). The transfer of governance from the National Stroke Programme to NOCA and the renaming of the NSR to the Irish National Audit of Stroke (INAS) represents a commitment to quality improvement and audit in stroke care as a core aspect of service delivery in our health service. The data inform the national stroke KPIs, which in turn inform the HSE National Service Plan. Other KPI results will drive further quality improvement initiatives as we work alongside the NSP to develop the National Stroke Strategy 2020–2025.
Due to the quality of the data, the INAS is in a strong position to monitor the effects of change within the health system. In 2018 and 2019, a national quality improvement project for the care of patients with acute ischaemic stroke, led by Professor John Thornton explored the ‘door to decision’ time for patients with acute ischaemic stroke. The impact of this project can be seen in the results of the 2019 INAS annual report; for example, the median time from arrival at hospital to review by the medical team has decreased from 43 minutes in 2017 to 17 minutes in 2019. If implemented, the recommendations within this audit will lead to improved outcomes for patients by increasing stroke awareness in the population and thereby ensuring that more patients with a stroke attend hospital in time for acute treatments; increasing the availability of stroke unit beds in order to ensure that patients receive high-quality, evidence-based care; and reducing the incidence of stroke through improved primary stroke prevention measures.
In addition, as the INAS can provide validated and published data, it is now in a position to make the anonymised data available for research and service evaluation projects following NOCA policies and procedures.

NOCA NATIONAL OFFICE OF CLINICAL AUDIT IRISH NATIONAL AUDIT OF STROKE NATIONAL REPORT 2019 127126
CHAPTER 9
AUDIT DEVELOPMENTS/IMPROVEMENTSTraining, education and support
The INAS will continue to develop and change. In 2020, we began to implement the use of Data Validation Reports (DVRs) to improve data quality, and increased quarterly reporting will commence in Q4 2020 with the development of an INAS dashboard by the data analytics team. It is important to ensure that all changes and developments are communicated effectively with the audit coordinators and audit users. Actions to improve communication include the following:
• Audit Coordinator meetings with the Audit Manager will occur every 2 months using a virtual platform such as Zoom.
• Hospital visits for training, education and support will be facilitated by the Audit Manager and will follow COVID-19 guidance.
• The INAS training manual will be revised.
Data quality initiatives
The implementation of DVRs along with quarterly coverage reports is a new process, commenced in January 2020, to improve data coverage and completeness. These validation processes will ensure that the development of quarterly reporting of KPIs can be implemented in Q4 2020.
For 2020, it has been agreed that all data will be entered in the stroke audit portal within the quarter following the patients’ discharge from hospital. The data will be processed by NOCA, a DVR will be sent to each hospital, and records will be amended as required within 1 month. Quarterly reports will be sent (released) to hospitals within 2–3 weeks of the end of the reporting quarter, one quarter in arrears. The INAS reporting calendar for 2020 is outlined in Table 9.1. Data entry targets will be reviewed quarterly at each INAS Governance Committee meeting. The final data entry date is linked to the HIPE closure date for the reporting year and is updated annually.
Other data quality initiatives include the following:
• The INAS will engage with the HPO to identify ways to enhance the validation processes within the stroke audit portal at the data input stage.
• The INAS will engage with the HPO on a review of the discharge destination codes available within HIPE in order to ensure that these reflect the most appropriate discharge destination for patients with a stroke in HIPE.
• The INAS will engage with the National Thrombectomy Service to revise variables in the thrombectomy dataset.
• The INAS will work with HSCPs to increase participation in hospitals and within disciplines that are not currently participating in the audit.
Submission dates DVRs sent to hospitals
Data entry target
Data reporting date
Q1: 01/01/2020–31/03/2020 30/06/2020 31/07/2020 01/09/2020
Q2: 01/04/2020–30/06/2020 30/09/2020 31/10/2020 01/12/2020
Q3: 01/07/2020–30/09/2020 31/12/2020 31/01/2021 01/03/2021
Q4: 01/10/2020–31/12/2020 31/03/2021 30/04/2021 01/06/2021
TABLE 9.1: IRISH NATIONAL AUDIT OF STROKE DATA COLLECTION CALENDAR 2020

NOCA NATIONAL OFFICE OF CLINICAL AUDIT IRISH NATIONAL AUDIT OF STROKE NATIONAL REPORT 2019 129128
CHAPTER 9
ORGANISATIONAL AUDITIn 2020, the INAS will undertake an organisational audit of stroke services, and this will be repeated biennially. This audit will examine the organisation of acute stroke services, including the environment, staffing levels, availability of imaging and interventions, and pathway on discharge. A survey will be designed and each stroke service will be asked to complete it in Q4 2020.
As a result of this organisational audit, hospitals will be able to benchmark against national findings and standards. Results of this audit will be published as part of the 2021 INAS annual report.

NOCA NATIONAL OFFICE OF CLINICAL AUDIT IRISH NATIONAL AUDIT OF STROKE NATIONAL REPORT 2019 129128
CHAPTER 10RECOMMENDATIONS
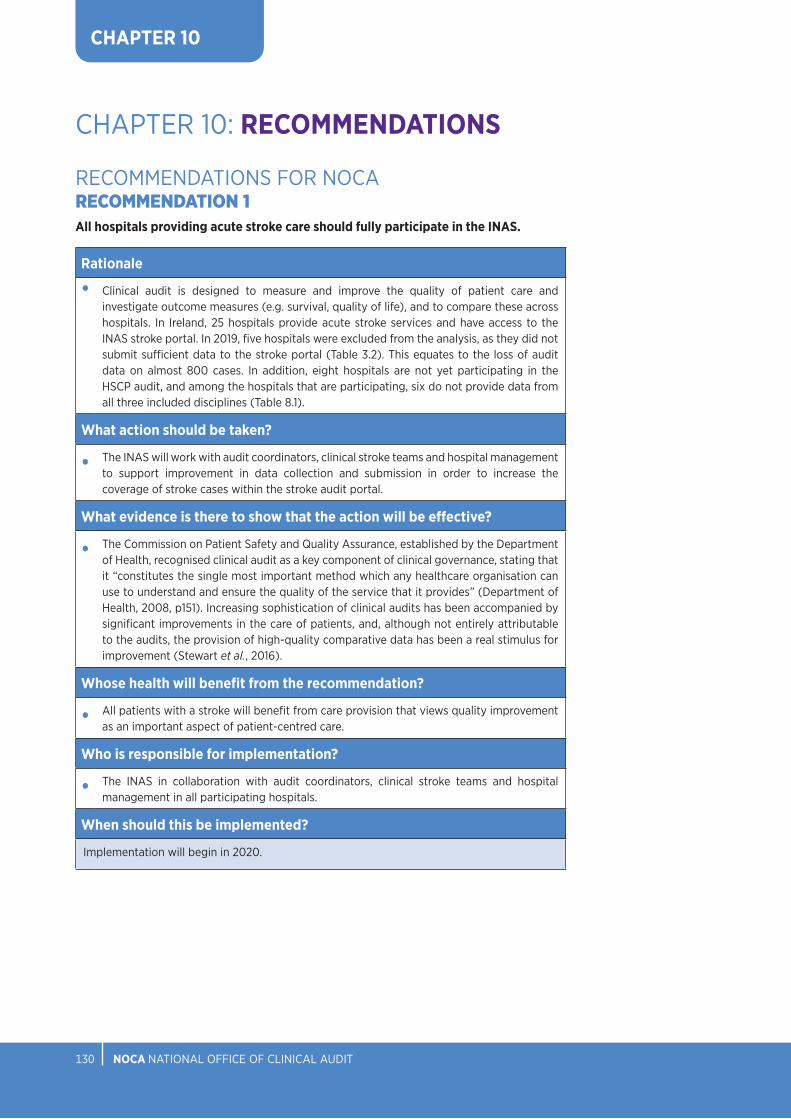
NOCA NATIONAL OFFICE OF CLINICAL AUDIT IRISH NATIONAL AUDIT OF STROKE NATIONAL REPORT 2019 131130
CHAPTER 10
CHAPTER 10: RECOMMENDATIONS
RECOMMENDATIONS FOR NOCA RECOMMENDATION 1All hospitals providing acute stroke care should fully participate in the INAS.
Rationale
• Clinical audit is designed to measure and improve the quality of patient care and investigate outcome measures (e.g. survival, quality of life), and to compare these across hospitals. In Ireland, 25 hospitals provide acute stroke services and have access to the INAS stroke portal. In 2019, five hospitals were excluded from the analysis, as they did not submit sufficient data to the stroke portal (Table 3.2). This equates to the loss of audit data on almost 800 cases. In addition, eight hospitals are not yet participating in the HSCP audit, and among the hospitals that are participating, six do not provide data from all three included disciplines (Table 8.1).
What action should be taken?
• The INAS will work with audit coordinators, clinical stroke teams and hospital management to support improvement in data collection and submission in order to increase the coverage of stroke cases within the stroke audit portal.
What evidence is there to show that the action will be effective?
• The Commission on Patient Safety and Quality Assurance, established by the Department of Health, recognised clinical audit as a key component of clinical governance, stating that it “constitutes the single most important method which any healthcare organisation can use to understand and ensure the quality of the service that it provides” (Department of Health, 2008, p151). Increasing sophistication of clinical audits has been accompanied by significant improvements in the care of patients, and, although not entirely attributable to the audits, the provision of high-quality comparative data has been a real stimulus for improvement (Stewart et al., 2016).
Whose health will benefit from the recommendation?
• All patients with a stroke will benefit from care provision that views quality improvement as an important aspect of patient-centred care.
Who is responsible for implementation?
• The INAS in collaboration with audit coordinators, clinical stroke teams and hospital management in all participating hospitals.
When should this be implemented?
Implementation will begin in 2020.
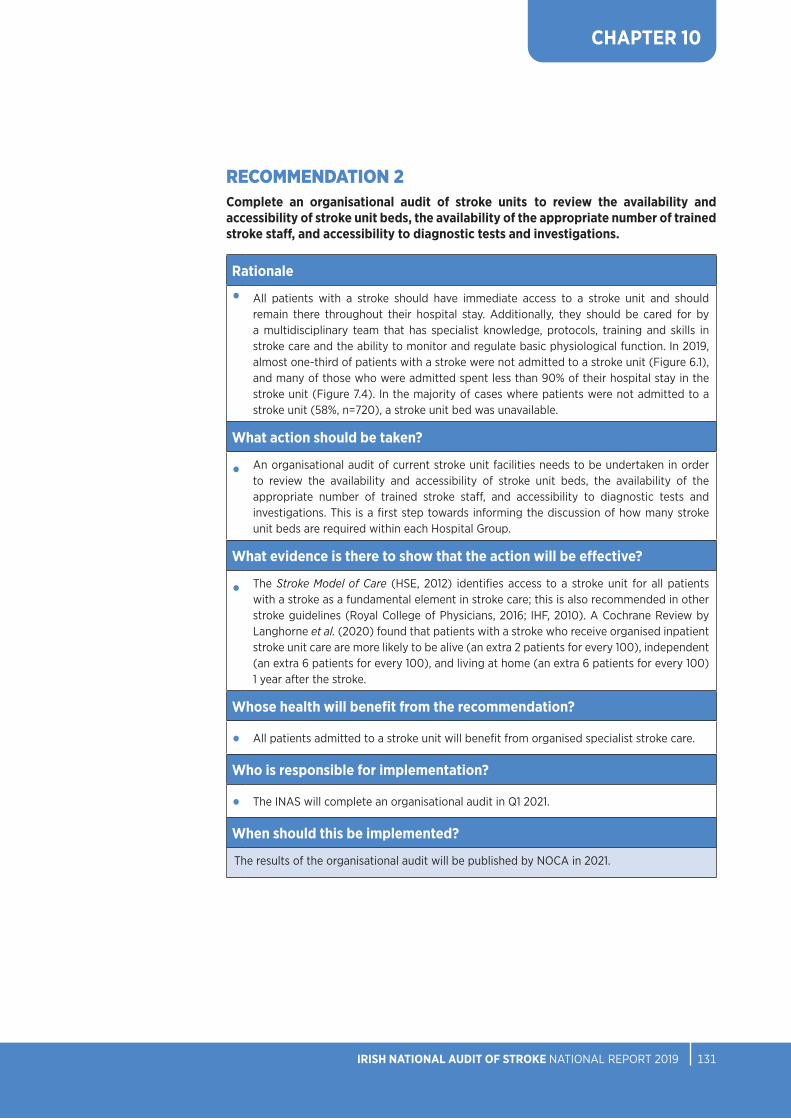
NOCA NATIONAL OFFICE OF CLINICAL AUDIT IRISH NATIONAL AUDIT OF STROKE NATIONAL REPORT 2019 131130
CHAPTER 10
RECOMMENDATION 2Complete an organisational audit of stroke units to review the availability and accessibility of stroke unit beds, the availability of the appropriate number of trained stroke staff, and accessibility to diagnostic tests and investigations.
Rationale
• All patients with a stroke should have immediate access to a stroke unit and should remain there throughout their hospital stay. Additionally, they should be cared for by a multidisciplinary team that has specialist knowledge, protocols, training and skills in stroke care and the ability to monitor and regulate basic physiological function. In 2019, almost one-third of patients with a stroke were not admitted to a stroke unit (Figure 6.1), and many of those who were admitted spent less than 90% of their hospital stay in the stroke unit (Figure 7.4). In the majority of cases where patients were not admitted to a stroke unit (58%, n=720), a stroke unit bed was unavailable.
What action should be taken?
• An organisational audit of current stroke unit facilities needs to be undertaken in order to review the availability and accessibility of stroke unit beds, the availability of the appropriate number of trained stroke staff, and accessibility to diagnostic tests and investigations. This is a first step towards informing the discussion of how many stroke unit beds are required within each Hospital Group.
What evidence is there to show that the action will be effective?
• The Stroke Model of Care (HSE, 2012) identifies access to a stroke unit for all patients with a stroke as a fundamental element in stroke care; this is also recommended in other stroke guidelines (Royal College of Physicians, 2016; IHF, 2010). A Cochrane Review by Langhorne et al. (2020) found that patients with a stroke who receive organised inpatient stroke unit care are more likely to be alive (an extra 2 patients for every 100), independent (an extra 6 patients for every 100), and living at home (an extra 6 patients for every 100) 1 year after the stroke.
Whose health will benefit from the recommendation?
• All patients admitted to a stroke unit will benefit from organised specialist stroke care.
Who is responsible for implementation?
• The INAS will complete an organisational audit in Q1 2021.
When should this be implemented?
The results of the organisational audit will be published by NOCA in 2021.

NOCA NATIONAL OFFICE OF CLINICAL AUDIT IRISH NATIONAL AUDIT OF STROKE NATIONAL REPORT 2019 133132
CHAPTER 10
RECOMMENDATION 3Complete an audit of Early Supported Discharge services nationally.
Rationale
• ESD for stroke is international best practice in providing care for patients with a stroke that improves patient outcomes while facilitating faster discharge home from hospital through the provision of stroke-specific rehabilitation in the home setting (Langhorne et al., 2005). There is limited information on the availability and accessibility of ESD services in 2019. In 2019, five out of six hospitals with ESD teams submitted data on ESD discharges. Ten percent (n=210) of cases from these five hospitals were discharged home with ESD. In the UK, discharge home with ESD is reported in 39% of all stroke cases (Royal College of Physicians, 2019).
What action should be taken?
• An audit of ESD services should be undertaken in order to assess the availability and accessibility of ESD services nationally. This should include an audit of the members of each ESD team.
What evidence is there to show that the action will be effective?
• Sláintecare emphasises the importance of patient-centred care and its delivery ‘as close to home as possible’, and ESD is fully aligned to these principles (Department of Health, 2018). Understanding the limitations of current ESD provision will enable the healthcare system to benchmark against best practice and take steps to increase the availability of ESD in Ireland.
Who will benefit from the recommendation?
• An audit of ESD provision nationally will allow stroke services to benchmark against other services and advocate for increased ESD services locally. If new ESD teams are established, patients and families will benefit from improved outcomes and a reduced length of stay in hospital.
Who is responsible for implementation?
• The INAS will include ESD in the organisational audit.
When should this be implemented?
The organisational audit will be completed in Q1 2021
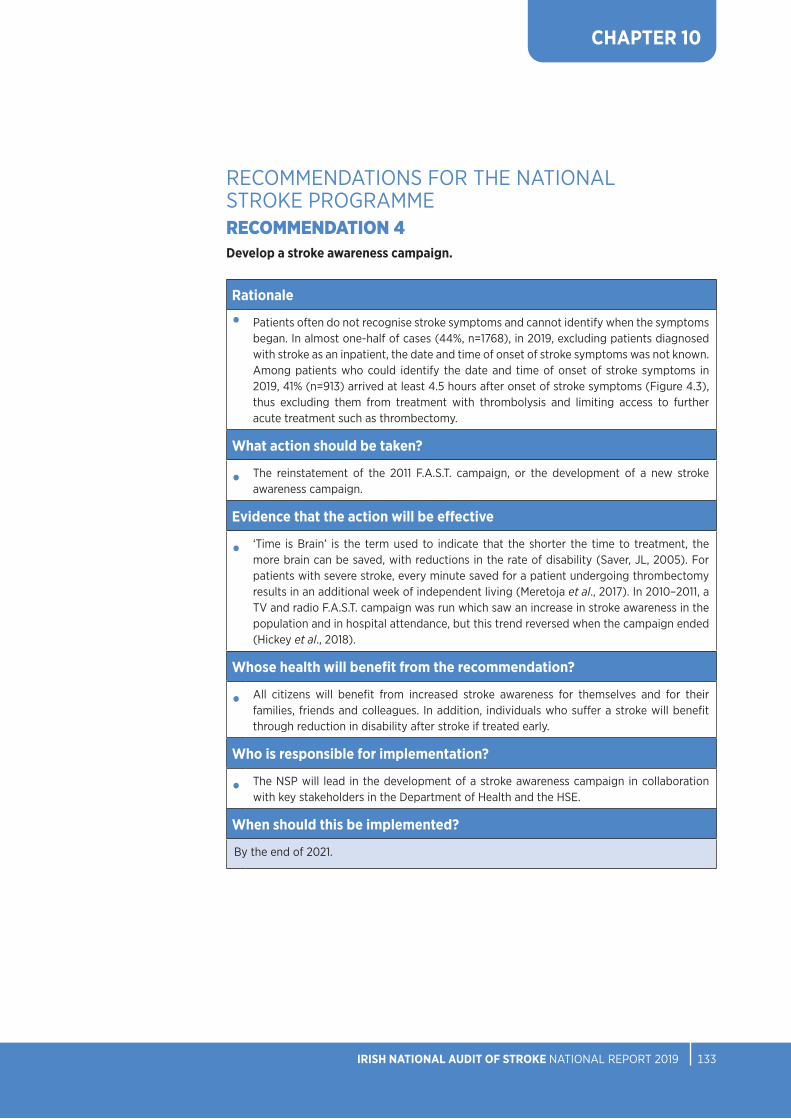
NOCA NATIONAL OFFICE OF CLINICAL AUDIT IRISH NATIONAL AUDIT OF STROKE NATIONAL REPORT 2019 133132
CHAPTER 10
RECOMMENDATIONS FOR THE NATIONAL STROKE PROGRAMME RECOMMENDATION 4Develop a stroke awareness campaign.
Rationale
• Patients often do not recognise stroke symptoms and cannot identify when the symptoms began. In almost one-half of cases (44%, n=1768), in 2019, excluding patients diagnosed with stroke as an inpatient, the date and time of onset of stroke symptoms was not known. Among patients who could identify the date and time of onset of stroke symptoms in 2019, 41% (n=913) arrived at least 4.5 hours after onset of stroke symptoms (Figure 4.3), thus excluding them from treatment with thrombolysis and limiting access to further acute treatment such as thrombectomy.
What action should be taken?
• The reinstatement of the 2011 F.A.S.T. campaign, or the development of a new stroke awareness campaign.
Evidence that the action will be effective
• ‘Time is Brain’ is the term used to indicate that the shorter the time to treatment, the more brain can be saved, with reductions in the rate of disability (Saver, JL, 2005). For patients with severe stroke, every minute saved for a patient undergoing thrombectomy results in an additional week of independent living (Meretoja et al., 2017). In 2010–2011, a TV and radio F.A.S.T. campaign was run which saw an increase in stroke awareness in the population and in hospital attendance, but this trend reversed when the campaign ended (Hickey et al., 2018).
Whose health will benefit from the recommendation?
• All citizens will benefit from increased stroke awareness for themselves and for their families, friends and colleagues. In addition, individuals who suffer a stroke will benefit through reduction in disability after stroke if treated early.
Who is responsible for implementation?
• The NSP will lead in the development of a stroke awareness campaign in collaboration with key stakeholders in the Department of Health and the HSE.
When should this be implemented?
By the end of 2021.

NOCA NATIONAL OFFICE OF CLINICAL AUDIT IRISH NATIONAL AUDIT OF STROKE NATIONAL REPORT 2019 135134
CHAPTER 10
RECOMMENDATION 5Pilot a large vessel occlusion ambulance bypass to the endovascular thrombectomy stroke centres in Dublin and Cork.
Rationale
• In 2019, the majority of thrombectomy cases (81%, n=292) were transferred to an endovascular thrombectomy (EVT) stroke centre from another hospital rather than being admitted directly to an EVT stroke centre (Figure 5.2). The median time from onset of stroke symptoms to arrival at an EVT stroke centre for patients who were admitted directly to an EVT stroke centre was 1 hour and 33 minutes (Figure 5.4A), and 4 hours for those who were transferred from another hospital (Figure 5.4B). Median time from onset of stroke symptoms to recanalisation was shorter for thrombectomy patients who were admitted directly to an EVT stroke centre (3 hours and 32 minutes) than for thrombectomy patients who were transferred from another hospital (4 hours and 39 minutes). At present, all patients are brought to the nearest hospital for initial assessment and are then referred to an EVT stroke centre when thrombectomy is indicated. Early recanalisation is key to recovery from stroke. If patients with large vessel occlusion could be transferred directly to an EVT stroke centre without first going to a primary stroke centre, a considerable amount of time would be saved, which should result in improved outcomes. However, in some cases, it may be better to attend the nearest hospital if other acute treatments can be provided within a certain time frame (Holodinsky et al., 2018).
Identification of patients with a large vessel occlusion could be achieved through the use of a screening tool by trained personnel in the ambulance service. The National Thrombectomy Service, in conjunction with the NSP and the National Ambulance Service, is developing a training programme for ambulance personnel with the aim of piloting a project in the city of Dublin and the Munster region whereby patients who are identified as having a large vessel occlusion are bypassed from their catchment area hospital to the EVT stroke centre in Beaumont Hospital or Cork University Hospital for assessment for thrombectomy.
What action should be taken?
• The piloting of a large vessel occlusion bypass model for patients within the catchment area of specified Dublin and Munster hospitals to bypass their nearest hospital and be sent directly to the EVT stroke centre in Beaumont Hospital or Cork University Hospital.
Evidence that the action will be effective
• Thrombectomy is most commonly indicated for patients who have the most severe kind of stroke. There is a large body of evidence in the literature indicating that early recanalisation is associated with better outcomes (Jahan et al, 2019; HIQA, 2017b; Saver et al., 2016). For patients with severe stroke, the earliest possible intervention with thrombectomy greatly improves their chances of survival and of returning to independent living.
Whose health will benefit from the recommendation?
• All patients with severe stroke who are not severely frail pre-stroke will benefit from earlier intervention at an EVT stroke centre.

NOCA NATIONAL OFFICE OF CLINICAL AUDIT IRISH NATIONAL AUDIT OF STROKE NATIONAL REPORT 2019 135134
CHAPTER 10
Who is responsible for implementation?
• The National Stroke Programme will lead on the implementation of the pilot, facilitated by the Office of the Chief Clinical Officer HSE and in conjunction with the National Thrombectomy Service and the National Ambulance Service.
When should this be implemented?
This should be implemented in 2021.

NOCA NATIONAL OFFICE OF CLINICAL AUDIT IRISH NATIONAL AUDIT OF STROKE NATIONAL REPORT 2019 137136
CHAPTER 10
RECOMMENDATIONS FOR HOSPITAL MANAGERS, CLINICIANS, AND AUDIT COORDINATORSRECOMMENDATION 6Improve the level of swallow screening for patients with a stroke.
Rationale
• All patients with acute stroke should have their swallowing screened by a trained healthcare professional, using a validated screening tool, within 4 hours of arrival at hospital and before any oral intake (NSP, 2017). In 2019, 67% (n=2805) of patients with a stroke had a swallow screen performed (Figure 6.3), with less than one-half (44%, n=1248) of those patients having the swallow screen completed within 4 hours of arrival at hospital.
What action should be taken?
• All stroke services should ensure that there is a swallow screening training programme available for healthcare professionals.
Evidence that the action will be effective
• Swallowing difficulties are common in patients with a stroke, and this can lead to food, fluid, and/or saliva entering the airway. This increases the risk of pneumonia and therefore poor outcomes, including a longer hospital stay and a higher risk of disability and death (Martino et al., 2009). Early swallow screening is recommended in both the Irish Heart Foundation National Clinical Guidelines and Recommendations for the Care of People with Stroke and Transient Ischaemic Attack (2010) and the Royal College of Physicians National clinical guideline for stroke (2016). Bray et al. (2017) found that delays in screening for swallow difficulties after stroke are associated with an increased risk of stroke-related pneumonia.
Whose health will benefit from the recommendation?
• This will benefit all patients with a stroke by ensuring that they are not kept without food or fluids unnecessarily, and by ensuring that swallow assessment by a speech and language therapist can be prioritised for patients who require urgent evaluation.
Who is responsible for implementation?
• Each hospital should implement a swallow screening programme in accordance with the swallow screening guidance.
When should this be implemented?
This is an ongoing process for the improvement of governance at hospital level.
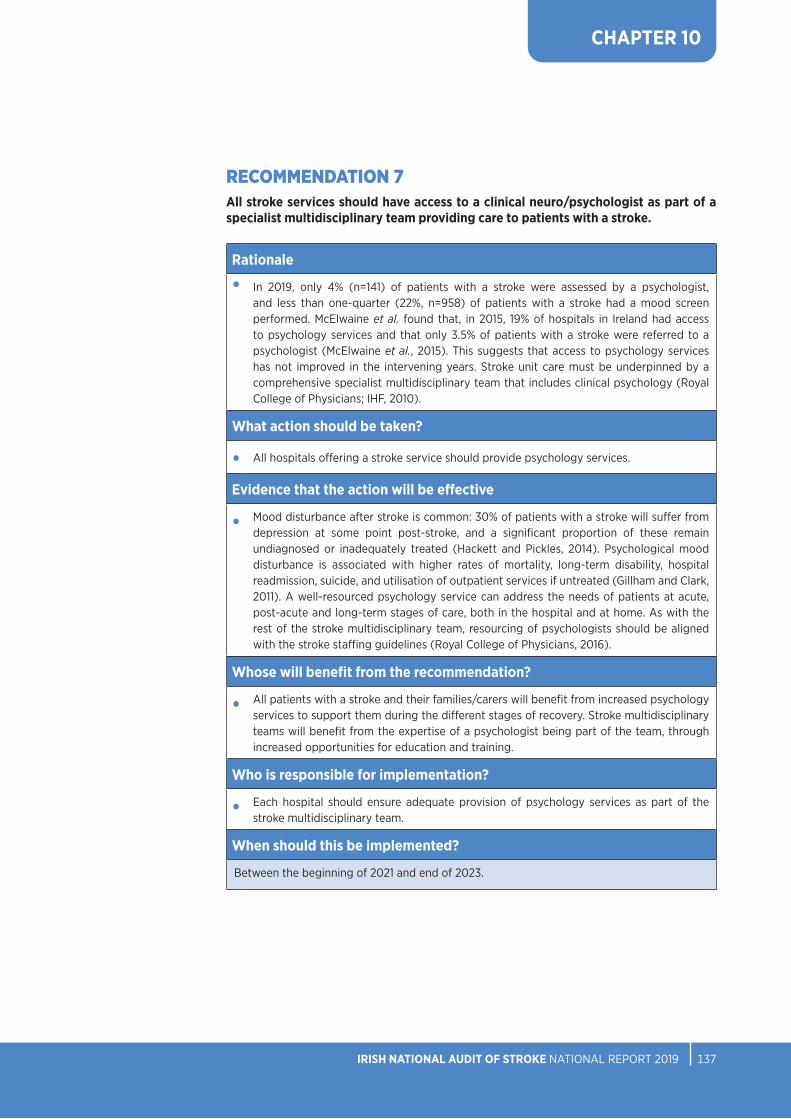
NOCA NATIONAL OFFICE OF CLINICAL AUDIT IRISH NATIONAL AUDIT OF STROKE NATIONAL REPORT 2019 137136
CHAPTER 10
RECOMMENDATION 7All stroke services should have access to a clinical neuro/psychologist as part of a specialist multidisciplinary team providing care to patients with a stroke.
Rationale
• In 2019, only 4% (n=141) of patients with a stroke were assessed by a psychologist, and less than one-quarter (22%, n=958) of patients with a stroke had a mood screen performed. McElwaine et al. found that, in 2015, 19% of hospitals in Ireland had access to psychology services and that only 3.5% of patients with a stroke were referred to a psychologist (McElwaine et al., 2015). This suggests that access to psychology services has not improved in the intervening years. Stroke unit care must be underpinned by a comprehensive specialist multidisciplinary team that includes clinical psychology (Royal College of Physicians; IHF, 2010).
What action should be taken?
• All hospitals offering a stroke service should provide psychology services.
Evidence that the action will be effective
• Mood disturbance after stroke is common: 30% of patients with a stroke will suffer from depression at some point post-stroke, and a significant proportion of these remain undiagnosed or inadequately treated (Hackett and Pickles, 2014). Psychological mood disturbance is associated with higher rates of mortality, long-term disability, hospital readmission, suicide, and utilisation of outpatient services if untreated (Gillham and Clark, 2011). A well-resourced psychology service can address the needs of patients at acute, post-acute and long-term stages of care, both in the hospital and at home. As with the rest of the stroke multidisciplinary team, resourcing of psychologists should be aligned with the stroke staffing guidelines (Royal College of Physicians, 2016).
Whose will benefit from the recommendation?
• All patients with a stroke and their families/carers will benefit from increased psychology services to support them during the different stages of recovery. Stroke multidisciplinary teams will benefit from the expertise of a psychologist being part of the team, through increased opportunities for education and training.
Who is responsible for implementation?
• Each hospital should ensure adequate provision of psychology services as part of the stroke multidisciplinary team.
When should this be implemented?
Between the beginning of 2021 and end of 2023.


CHAPTER 11CONCLUSION

NOCA NATIONAL OFFICE OF CLINICAL AUDIT IRISH NATIONAL AUDIT OF STROKE NATIONAL REPORT 2019 141140
CHAPTER 11
CHAPTER 11: CONCLUSIONThe transfer of governance of the National Stroke Register to NOCA represents a commitment to quality improvement and audit in stroke care as a core aspect of service delivery in our health service.
This first INAS report presents a large volume of data on activity and on outcomes for patients with acute stroke in Ireland. Overall, the INAS highlights the sustained improvements that have been made in caring for patients with a stroke, but it also identifies continued challenges and limitations in specific areas of care, as well as some worrying signs of regression in some areas, such as delays in presentation to hospital after the onset of stroke symptoms.
Thanks to the leadership of the hospital clinical leads and the data collection and dedication of the audit coordinators, we have an increased coverage rate, and we look forward to further increasing the participation of all hospitals in 2020.
It is envisioned that as the INAS matures, it will facilitate change within the health system on both a local and national scale.

NOCA NATIONAL OFFICE OF CLINICAL AUDIT IRISH NATIONAL AUDIT OF STROKE NATIONAL REPORT 2019 141140
REFERENCES

NOCA NATIONAL OFFICE OF CLINICAL AUDIT IRISH NATIONAL AUDIT OF STROKE NATIONAL REPORT 2019 143142
REFERENCES
Aguiar de Sousa, D., von Martial, R., Abilleira, S., Gattringer, T., Kobayashi, A., Gallofré, M., Fazekas, F., Szikora, I., Feigin, V., Caso, V. and Fischer, U. on behalf of the ESO ESMINT EAN SAFE Survey on Stroke Care collaborators (2018) Access to and delivery of acute ischaemic stroke treatments: A survey of national scientific societies and stroke experts in 44 European countries. European Stroke Journal, 4(1), pp. 13-28. Available from: https://doi.org/10.1177%2F2396987318786023 [Accessed 3 September 2020].
Bernhardt, J., Churilov, L., Ellery, F., Collier, J., Chamberlain, J., Langhorne, P., Lindley, R.I., Moodie, M., Dewey, H., Thrift, A.G. and Donnan, G. on behalf of the AVERT Collaboration Group (2016) Prespecified dose-response analysis for A Very Early Rehabilitation Trial (AVERT). Neurology, 86(23), pp. 2138-2145. Available from: https://doi.org/10.1212/WNL.0000000000002459 [Accessed 2 August 2020].
Bray, B.D., Smith, C.J., Cloud, G.C., Enderby, P., James, M., Paley, L., Tyrrell, P.J., Wolfe, C.D.A., Rudd, A.G. and SSNAP Collaboration (2017) The association between delays in screening for and assessing dysphagia after acute stroke, and the risk of stroke-associated pneumonia. Journal of Neurology, Neurosurgery & Psychiatry, 88(1), pp. 25-30.
Callaly, E., Ni Chroinin, D., Hannon, N., Marnane, M., Akijian, L., Sheehan, O., Merwick, A., Hayden, D., Horgan, G., Duggan, J., Murphy, S., O’Rourke, K., Dolan, E., Williams, D., Kyne, L. and Kelly, P.J. (2016) Rates, Predictors, and Outcomes of Early and Late Recurrence after Stroke: The North Dublin Population Stroke Study. Stroke, 47(1), pp. 244-246. Available from: https://doi.org/10.1161/strokeaha.115.011248 [Accessed 12 June 2020].
Department of Health (2008) Building a Culture of Patient Safety – Report of the Commission on Patient Safety and Quality Assurance. Dublin: The Stationery Office. Available from: https://assets.gov.ie/18845/59ff088cfaea4c4f8c93b6b04fae9762.pdf [Accessed 3 August 2020].
Department of Health (2018) Sláintecare Implementation Strategy. Dublin: Department of Health. Available from: http://hdl.handle.net/10147/623830 [Accessed 3 August 2020].
Gillham, S. and Clark, L. (2011) Psychological care after stroke: Improving stroke services for people with cognitive and mood disorders. Leicester: NHS Improvement - Stroke. Available from: https://www.nice.org.uk/media/default/sharedlearning/531_strokepsychologicalsupportfinal.pdf [Accessed 28 September 2020].
Hackett, M.L. and Pickles, K. (2014) Part I: frequency of depression after stroke: an updated systematic review and meta-analysis of observational studies. International Journal of Stroke, 9(8), pp. 1017-1025. Available from: https://doi.org/10.1111%2Fijs.12357 [Accessed 28 September 2020].
Health Information and Quality Authority (2017a) Information management standards for national health and social care data collections. Dublin: Health Information and Quality Authority. Available from: https://www.hiqa.ie/sites/default/files/2017-02/Information-management-standards-for-national-health-and-social-care-data-collections.pdf [Accessed 15 July 2020].
Health Information and Quality Authority (2017b) Health technology assessment of a national emergency endovascular service for mechanical thrombectomy in the management of acute ischaemic stroke. Dublin: Health Information and Quality Authority. Available from: https://www.hiqa.ie/sites/default/files/2017-02/Mechanical-Thrombectomy-technical-report.pdf [Accessed 12 June 2020].
Health Information and Quality Authority (2018) Guidance on a data quality framework for health and social care. Dublin: Health Information and Quality Authority. Available from: https://www.hiqa.ie/sites/default/files/2018-10/Guidance-for-a-data-quality-framework.pdf [Accessed 15 July 2020].

NOCA NATIONAL OFFICE OF CLINICAL AUDIT IRISH NATIONAL AUDIT OF STROKE NATIONAL REPORT 2019 143142
Health Service Executive (2012) Stroke Model of Care. Dublin: Health Service Executive. Available from: https://www.hse.ie/eng/services/publications/clinical-strategy-and-programmes/stroke-model-of-care.pdf [Accessed 3 June 2020].
Health Service Executive (2019) National Service Plan 2020. Dublin: Health Service Executive. Available from: https://www.hse.ie/eng/services/publications/national-service-plan-2020.pdf [Accessed 7 October 2020].
Hickey, A., Mellon, L., Williams, D., Shelley, E. and Conroy, R.M. (2018) Does stroke health promotion increase awareness of appropriate behavioural response? Impact of the face, arm, speech and time (FAST) campaign on population knowledge of stroke risk factors, warning signs and emergency response. European Stroke Journal, 3(2), pp. 117-125.
Holodinsky, J.K., Patel, A.B., Thornton, J., Kamal, N., Jewett, L.R., Kelly, P.J., Murphy, S., Collins, R., Walsh, T., Cronin, S., Power, S., Brennan, P., O’hare, A., McCabe, D.J.H., Moynihan, B., Looby, S., Wyse, G., McCormack, J., Marsden, P., Harbison, J., Hill, M.D. and Williams, D. (2018) Drip and ship versus direct to endovascular thrombectomy: The impact of treatment times on transport decision-making. European Stroke Journal, 3(2), pp. 126-135.
Horgan, F., Hickey, A., O’Neil, D. (2008) Irish Heart Foundation National Audit of Stroke Care. Dublin: Irish Heart Foundation. Available from: https://core.ac.uk/download/pdf/60774271.pdf [Accessed 7 October 2020].
Irish Heart Foundation (2010) National Clinical Guidelines and Recommendations for the Care of People with Stroke and Transient Ischaemic Attack. Dublin: Irish Heart Foundation. Available from: http://irishheart.ie/wp-content/uploads/2017/04/guidelines.pdf [Accessed 12 June 2020].
Irish Heart Foundation (2015) Stroke Thrombolysis Guidelines Version 2.0. Dublin: Irish Heart Foundation. Available from: https://irishheart.ie/publications/stroke-thrombolysis-guidelines/ [Accessed 12 June 2020].
Jahan, R., Saver, J.L., Schwamm, L.H., Fonarow, G.C., Liang, L., Matsouaka, R.A., Xian, Y., Holmes, D.N., Peterson, E.D., Yavagal, D. and Smith, E.E. (2019) Association Between Time to Treatment With Endovascular ReperfusionTherapy and Outcomes in Patients With Acute Ischemic Stroke Treated in Clinical Practice. JAMA. 322(3), pp. 252-263. Available from: https://dx.doi.org/10.1001%2Fjama.2019.8286 [Accessed 28 September 2020].
Katan, M. and Luft, A. (2018) Global Burden of Stroke. Seminars in Neurology, 38(2), pp. 208-211. Available from: https://doi.org/10.1055/s-0038-1649503 [Accessed 12 June 2020].
Langhorne, P., Ramachandra, S. and Stroke Unit Trialists’ Collaboration (2020) Organised inpatient (stroke unit) care for stroke: network meta-analysis. Cochrane Database of Systematic Reviews, 4(4), CD000197. Available from: https://doi.org/10.1002/14651858.cd000197.pub4 [Accessed 23 June 2020].
Langhorne, P., Taylor, G., Murray, G., Dennis, M., Anderson, C., Bautz-Holter, E., Dey, P., Indredavik, B., Mayo, N., Power, M., Rodgers, H., Ronning, O.M., Rudd, A., Suwanwela, N., Widen-Holmqvist, L. and Wolfe, C. (2005) Early supported discharge services for stroke patients: a meta-analysis of individual patients’ data. Lancet, 365(9458), pp. 501-506. Available from: https://doi.org/10.1016/S0140-6736(05)17868-4 [Accessed 2 August 2020].
Martino, R., Silver, F., Teasell, R., Bayley, M., Nicholson, G., Streiner, D.L. and Diamant, N.E. (2009) The Toronto Bedside Swallowing Screening Test (TOR-BSST): development and validation of a dysphagia screening tool for patients with stroke. Stroke, 40(2), pp. 555-561.

NOCA NATIONAL OFFICE OF CLINICAL AUDIT IRISH NATIONAL AUDIT OF STROKE NATIONAL REPORT 2019 145144
McElwaine, P., McCormack, J. and Harbison, J., on behalf of the National Stroke Programme Audit Steering Group (2015) Irish Heart Foundation/HSE National Stroke Audit 2015. Dublin: Irish Heart Foundation. Available from: http://hdl.handle.net/10147/596575 [Accessed 3 June 2020].
Meretoja, A., Keshtkaran, M., Tatlisumak, T., Donnan, G. and Churilov L. (2017) Endovascular therapy for ischemic stroke: Save a minute-save a week. Neurology, 88(22), pp. 2123-2127. Available from: https://doi.org/10.1212/WNL.0000000000003981 [Accessed 15 July 2020].
Mohan, K.M., Wolfe, C.D.A., Rudd, A.G, Heuschmann, P.U. Kolominsky-Rabas, P.L. and Grieve, A.P. (2011) Risk and cumulative risk of stroke recurrence: a systematic review and meta-analysis. Stroke, 42(5), pp. 1489-1494.
Moran, P.S., Telijeur, C., Harrington, P., Smith, S.M., Smyth, B., Harbison, J., Normand, C. and Ryan, M. (2016) Cost-Effectiveness of a National Opportunistic Screening Program for Atrial Fibrillation in Ireland. Value in Health, 19(8), pp. 985-995. Available from: https://doi.org/10.1016/j.jval.2016.07.007 [Accessed 15 July 2020].
National Casemix and Classification Centre (2013) The International Statistical Classification of Diseases and Related Health Problems, Tenth Revision, Australian Modification (ICD-10-AM), Australian Classification of Health Interventions (ACHI) and Australian Coding Standards (ACS) – ICD-10-AM/ACHI/ACS. National Casemix and Classification Centre, Australian Health Services Research Institute, University of Wollongong. Available from: https://scholars.uow.edu.au/display/publication84415 [Accessed 13 October 2020].
National Clinical Effectiveness Committee (2015) Prioritisation and Quality Assurance for National Clinical Audit [Internet] Dublin: NCEC. Available from: https://assets.gov.ie/11676/4ff486bdd7a04780b77f7f951c28b55e.pdf [Accessed 9 October 2018]
National Stroke Programme (2016) Management of Post-stroke Depression. Care Pathway. Dublin: Health Service Executive. Available from: https://www.hse.ie/eng/services/publications/clinical-strategy-and-programmes/management-of-post-stroke-depression-care-pathway.pdf [Accessed 15 July 2020].
National Stroke Programme (2017) National Guidelines for Swallow Screening in Stroke 2017. Dublin: Health Service Executive. Available from: https://www.lenus.ie/bitstream/handle/10147/622832/national-guideline-for-swallow-screening-in-stroke-hse.pdf?sequence=1&isAllowed=y [Accessed 23 June 2020].
National Stroke Programme (2018) National Stroke Register Report 2017. Dublin: Health Service Executive. Available from: http://13.94.105.41/eng/services/publications/clinical-strategy-and-programmes/national-stroke-register-annual-report-2017.pdf [Accessed 12 June 2020].
National Stroke Programme (2019) National Stroke Register Report 2018. Dublin: Health Service Executive. Available from: https://www.hse.ie/eng/about/who/cspd/ncps/stroke/resources/2018-national-stroke-register-report.pdf [Accessed 15 July 2020].
National Thrombectomy Service (2020) National Thrombectomy Service Annual Report 2019. Dublin: National Thrombectomy Service. Available from: https://www.hse.ie/eng/about/who/cspd/ncps/stroke/resources/national-thrombectomy-service-annual-report-2019.pdf [Accessed 30 July 2020].
Royal College of Physicians (2016) National clinical guideline for stroke. London: Royal College of Physicians. Available from: https://www.strokeaudit.org/SupportFiles/Documents/Guidelines/2016-National-Clinical-Guideline-for-Stroke-5t-(1).aspx [Accessed 6 June 2020].

NOCA NATIONAL OFFICE OF CLINICAL AUDIT IRISH NATIONAL AUDIT OF STROKE NATIONAL REPORT 2019 145144
Sentinel Stroke National Audit Programme (2020) Moving the Dial of Stroke Care: The Sixth SSNAP Annual Report. London: Healthcare Quality Improvement Partnership. Available from: https://www.strokeaudit.org/Documents/National/Clinical/Apr2018Mar2019/Apr2018Mar2019-AnnualReport.aspx [Accessed 19 June 2020].
Saver, J.L. (2005) Time Is Brain-Quantified. Stroke, 37(1), pp. 263-266. Available from: https://doi.org/10.1161/01.STR.0000196957.55928.ab [Accessed 23 July 2020].
Saver, J.L., Goyal, M., van der Lugt, A., Menon, B.K., Majoie, C.B.L.M., Dippel, D.W., Campbell, B.C., Nogueira, R.G., Demchuk, A.M., Tomasello, A., Cardona, P., Devlin, T.G., Frei, D.F., du Mesnil de Rochemont, R., Berkhemer, O.A., Jovin, T.G., Siddiqui, A.H., van Zwam, W.H., Davis, S.M., Castaño, C., Sapkota, B.L., Fransen, P.S., Molina, C., van Oostenbrugge, R.J., Chamorro, Á., Lingsma, H., Silver, F.L., Donnan, G.A., Shuaib, A., Brown, S., Stouch, B., Mitchell, P.J., Davalos, A., Roos, Y.B.W.E.M. and Hill, M. for the HERMES Collaborators (2016) Time to Treatment With Endovascular Thrombectomy and Outcomes From Ischemic Stroke: A Meta-analysis. JAMA, 316(12), pp. 1279-1288. Available from: https://doi.org/10.1001/jama.2016.13647 [Accessed 28 September 2020].
Stewart, K., Bray, B., & Buckingham, R. (2016) Improving quality of care through national clinical audit. Future hospital journal, 3(3), 203–206. Available from: https://www.ncbi.nlm.nih.gov/pmc/articles/PMC6465800/ [Accessed on 9 October 2020].
Stroke Foundation (2019) Clinical Guidelines for Stroke Management. Australia: Stroke Foundation. Available from: https://informme.org.au/en/Guidelines/Clinical-Guidelines-for-Stroke-Management [Accessed on 9 October 2020].
The AVERT Trial Collaboration group (2015) Efficacy and safety of very early mobilisation within 24 h of stroke onset (AVERT): a randomised controlled trial. The Lancet, 386(9988), pp. 46-55. Available from: https://doi.org/10.1016/S0140-6736(15)60690-0 [Accessed 2 August 2020].
The Stroke Alliance for Europe (2020) SAFE Annual Report 2019. Brussels: The Stroke Alliance for Europe. Available from: https://www.safestroke.eu/wp-content/uploads/2020/01/SAFE-Annual-Report-2019-03012020-FINAL.pdf [Accessed 3 June 2020].
Wouters, A., Nysten, C., Thijs, V. and Lemmens, R. (2018) Prediction of Outcome in Patients With Acute Ischemic Stroke Based on Initial Severity and Improvement in the First 24 h. Frontiers in Neurology, 9, p. 308. Available from: https://dx.doi.org/10.3389%2Ffneur.2018.00308 [Accessed 30 July 2020].


APPENDICES

NOCA NATIONAL OFFICE OF CLINICAL AUDIT IRISH NATIONAL AUDIT OF STROKE NATIONAL REPORT 2019 149148
APPENDIX 1: INAS GOVERNANCE COMMITTEE
NAME TITLE
Dr Tim Cassidy Chairperson of Irish National Audit of Stroke Governance Committee
Consultant in Medicine for the Elderly and Stroke Physician, St Vincent’s University Hospital
Prof. Joe Harbison Clinical Lead – Irish National Audit of Stroke
Consultant Geriatrician and Stroke Physician, St James’s Hospital
Joan McCormack Cardiovascular Programme Audit Manager, National Office of Clinical Audit
Martin Quinn Public and Patient Interest Representative, Irish National Audit of Stroke Governance Committee
Stroke Survivor and Advocate, Irish Heart Foundation
Dr Marcia Ward Public and Patient Interest Representative, Irish National Audit of Stroke Governance Committee
Senior Clinical Neuropsychologist, Headway
Ann Dalton Deputy CEO/Chief Operations Officer, St. James’s Hospital
Dr Margaret O’Connor Consultant in Geriatric Medicine, University Hospital Limerick
Prof. Rónán Collins Clinical Lead, National Stroke Programme
Consultant in Geriatric and Stroke medicine, Tallaght University Hospital
Prof. John Thornton Consultant Neuroradiologist, Beaumont Hospital
Director, National Thrombectomy Service
Dr Eugene Wallace Consultant in Rehabilitation Medicine, National Rehabilitation Hospital
Una Moffat Advanced Nurse Practitioner in Stroke, Sligo University Hospital
Glen Arrigan Clinical Nurse Specialist in Stroke, Cork University Hospital
Claire Prendergast Senior Physiotherapist, Our Lady of Lourdes Hospital Drogheda
Dr Breda Smyth HSE West Director of Public Health
Paul Gallagher Chief Director of Nursing & Midwifery, Ireland East Hospital Group
Deirdre Murphy Head of Hospital In-Patient Enquiry (HIPE), Healthcare Pricing Office
Edina O’Driscoll Programme Manager, National Stroke Programme

NOCA NATIONAL OFFICE OF CLINICAL AUDIT IRISH NATIONAL AUDIT OF STROKE NATIONAL REPORT 2019 149148
APPENDIX 2: INAS DATASETHIPE stroke audit portal data entry/Stroke
CORE CLINICAL DATASETQuestion Options
1A. Why was the patient transferred? 1) Thrombolysis; 2) Thrombectomy; 3) Neurosurgery; 8) Other
1B. If other transfer reason, please specify. Free text
1C. If other transfer hospital, please specify. Free text
2. Date of onset of stroke symptoms
3. Time of onset of stroke symptoms
3A. If time of onset of stroke symptoms is unknown, what date was the patient last known to be well?
3B. If time of onset of stroke symptoms is unknown, what time was the patient last known to be well?
4. Did the stroke occur while the patient was in hospital for treatment of another condition?
1) Yes; 2) No; 9) Unknown
4A. If no, date of presentation to hospital
4B. If no, time of presentation to hospital
4C. If presentation time is unknown, was presentation to hospital within 4.5 hours of onset of stroke symptoms?
1) Yes; 2) No; 9) Unknown
5. Medical assessment date
5A. Medical assessment time
6. Was brain CT or MRI performed? 1) Yes; 2) No; 3) Performed pre-admission/hospital transfer; 9) Unknown
6A. If yes, first brain imaging date
6B. If yes, first brain imaging time
7. Did the patient receive intravenous (IV) thrombolysis?
1) Yes; 2) No; 5) Contraindicated
7A. If yes, enter date.
7B. If yes, enter time.
7C. If yes, was intracerebral bleed seen on scan within 36 hours?
1) Yes; 2) No; 9) Unknown
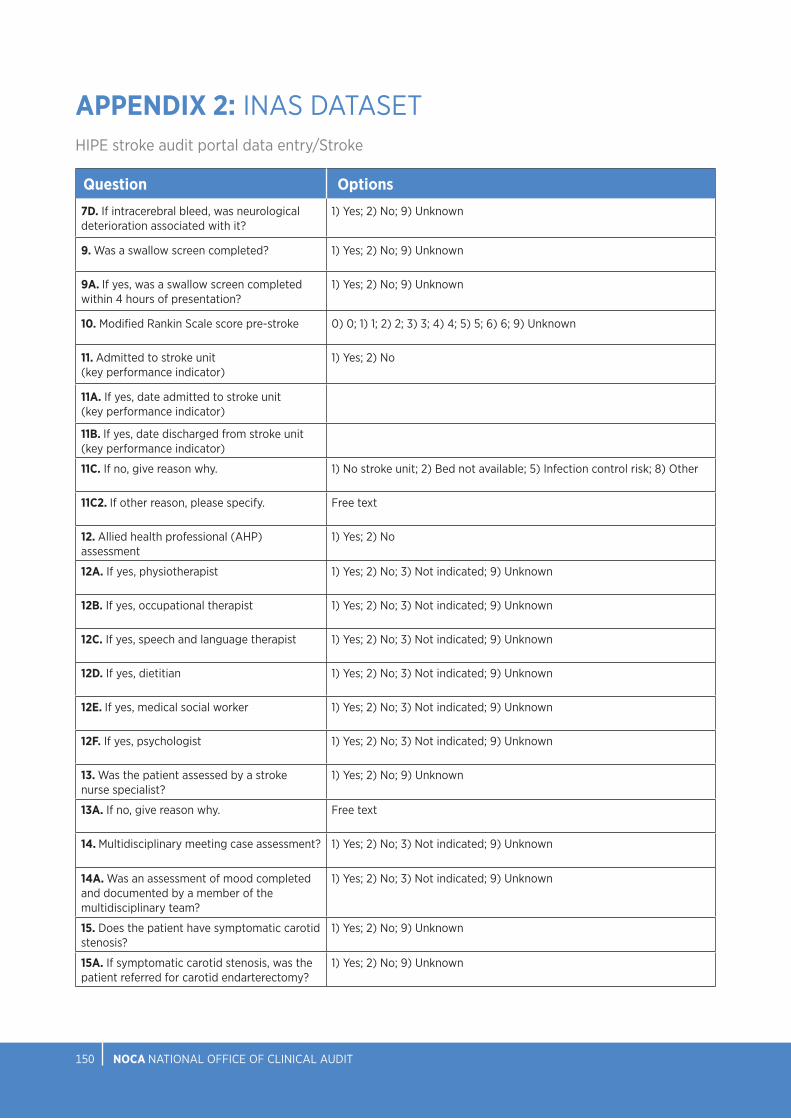
NOCA NATIONAL OFFICE OF CLINICAL AUDIT IRISH NATIONAL AUDIT OF STROKE NATIONAL REPORT 2019 151150
APPENDIX 2: INAS DATASETHIPE stroke audit portal data entry/Stroke
Question Options
7D. If intracerebral bleed, was neurological deterioration associated with it?
1) Yes; 2) No; 9) Unknown
9. Was a swallow screen completed? 1) Yes; 2) No; 9) Unknown
9A. If yes, was a swallow screen completed within 4 hours of presentation?
1) Yes; 2) No; 9) Unknown
10. Modified Rankin Scale score pre-stroke 0) 0; 1) 1; 2) 2; 3) 3; 4) 4; 5) 5; 6) 6; 9) Unknown
11. Admitted to stroke unit (key performance indicator)
1) Yes; 2) No
11A. If yes, date admitted to stroke unit (key performance indicator)
11B. If yes, date discharged from stroke unit (key performance indicator)
11C. If no, give reason why. 1) No stroke unit; 2) Bed not available; 5) Infection control risk; 8) Other
11C2. If other reason, please specify. Free text
12. Allied health professional (AHP) assessment
1) Yes; 2) No
12A. If yes, physiotherapist 1) Yes; 2) No; 3) Not indicated; 9) Unknown
12B. If yes, occupational therapist 1) Yes; 2) No; 3) Not indicated; 9) Unknown
12C. If yes, speech and language therapist 1) Yes; 2) No; 3) Not indicated; 9) Unknown
12D. If yes, dietitian 1) Yes; 2) No; 3) Not indicated; 9) Unknown
12E. If yes, medical social worker 1) Yes; 2) No; 3) Not indicated; 9) Unknown
12F. If yes, psychologist 1) Yes; 2) No; 3) Not indicated; 9) Unknown
13. Was the patient assessed by a stroke nurse specialist?
1) Yes; 2) No; 9) Unknown
13A. If no, give reason why. Free text
14. Multidisciplinary meeting case assessment? 1) Yes; 2) No; 3) Not indicated; 9) Unknown
14A. Was an assessment of mood completed and documented by a member of the multidisciplinary team?
1) Yes; 2) No; 3) Not indicated; 9) Unknown
15. Does the patient have symptomatic carotid stenosis?
1) Yes; 2) No; 9) Unknown
15A. If symptomatic carotid stenosis, was the patient referred for carotid endarterectomy?
1) Yes; 2) No; 9) Unknown

NOCA NATIONAL OFFICE OF CLINICAL AUDIT IRISH NATIONAL AUDIT OF STROKE NATIONAL REPORT 2019 151150
APPENDIX 2: INAS DATASETHIPE stroke audit portal data entry/Stroke
Question Options15B. If symptomatic carotid stenosis, was the patient referred for carotid stenting?
1) Yes; 2) No; 9) Unknown
16. Was new or altered antithrombotic therapy prescribed for acute treatment?
1) Yes; 2) No; 3) Contraindicated; 9) Unknown
16A. If yes, give antiplatelet or anticoagulant (for acute treatment) start date
17. Does the patient have atrial fibrillation? 1) Yes; 2) No; 4) Results pending; 9) Unknown
17A. If atrial fibrillation, was atrial fibrillation known prior to stroke onset?
1) Yes; 2) No; 9) Unknown
17B. If atrial fibrillation known prior to stroke onset, was antiplatelet and/or anticoagulant prescribed prior to stroke onset?
1) Yes; 2) No; 9) Unknown
17B(I). If yes, please specify antiplatelet/anticoagulant prior to stroke
0) NOAC; 1) Warfarin; 5) Aspirin; 6) Clopidogrel; 7) Other antiplatelet; 8) Dual antiplatelet therapy; 9) Antiplatelet and anticoagulant
17C. If atrial fibrillation known prior to stroke onset, and on warfarin, was the INR (international normalised ratio) 2–3 at stroke onset?
1) Yes; 2) No; 9) Unknown
17D. If atrial fibrillation, was anticoagulation prescribed for secondary prevention?
1) Yes; 2) No; 9) Unknown
17D(I). If yes, please specify antiplatelet/anticoagulant on discharge.
0) NOAC; 1) Warfarin; 5) Aspirin; 6) Clopidogrel; 7) Other antiplatelet; 8) Dual antiplatelet therapy; 9) Antiplatelet and anticoagulant
17D(II). If no, please enter reason documented.
1) No reason documented; 2) Major bleeding (prior history); 3) Severe illness (e.g. cancer, dementia); 4) Poor compliance (known or suspected); 5) Patient refused anticoagulant; 6) Alcohol excess; 7) Falls; 8) Extreme frailty; 9) Liver disease
18. Modified Rankin Scale score on discharge 0) 0; 1) 1; 2) 2; 3) 3; 4) 4; 5) 5; 6) 6; 9) Unknown
19. Discharge destination 1) Home; 2) Patient died; 3) Discharge to long-term care; 4) Discharge to off-site rehabilitation; 5) Transfer to referring hospital; 6) Transfer to other hospital for ongoing stroke care; 7) Home with ESD; 8) Other; 9) Unknown
20. Case complete 1) Yes; 2) No; 9) Unknown

NOCA NATIONAL OFFICE OF CLINICAL AUDIT IRISH NATIONAL AUDIT OF STROKE NATIONAL REPORT 2019 153152
APPENDIX 2: INAS DATASETHIPE stroke audit portal data entry/Stroke
THROMBECTOMY DATASETQuestion Options8. Did the patient have thrombectomy in this hospital (Beaumont/Cork University Hospital only)?
1) Yes; 2) No
8A. NIHSS pre-thrombectomy
8B(I). Date of performance of non-contrast CT scan
8B(II). Time of performance of non-contrast CT scan
8C(I). Date of performance of non-contrast CTA
8C(II). Time of performance of non-contrast CTA
8D(II). Date of contact with the endovascular stroke centre
8D(II). Time of contact with the endovascular stroke centre
8E(I). Date of decision to transfer patient
8E(II). Time of decision to transfer patient
8F(I). Date of arrival at the endovascular stroke centre
8F(II). Time of arrival at the endovascular stroke centre
8G(I). Did the patient have repeat non-invasive imaging in the endovascular stroke centre?
1) Yes; 2) No; 9) Unknown
8G(II). If yes, please specify 1) Non-contrast CT scan; 2) CTA; 3) Perfusion CT scan; 4) MRI
8H. Site of most proximal occlusion 1) MCA 1; 2) MCA 2; 3) Basilar; 4) ICA carotid T/L; 5) ICA cervical segment; 6) PCA; 7) Vertebrobasilar
8J. Second occlusion site
8K. Associated carotid stenosis greater than 50%
1) Yes; 2) No; 9) Unknown
8L(II). Thrombolysis in cerebral infarction (TICI) pre-thrombectomy
8L(III). TICI post-thrombectomy
8M(I). Date of groin puncture

NOCA NATIONAL OFFICE OF CLINICAL AUDIT IRISH NATIONAL AUDIT OF STROKE NATIONAL REPORT 2019 153152
APPENDIX 2: INAS DATASETHIPE stroke audit portal data entry/Stroke
Question Options8M(II). Time of groin puncture
8N(I). Date of first pass
8N(II). Time of first pass
8P(I). Date of first reperfusion
8P(II). Time of first reperfusion
8Q(I). Date of final angiogram
8Q(II). Time of final angiogram
8R.Immediate complications 0) n/a; 1) Haemorrhage; 2) Embolus into separate vascular territory; 3) Dissection; 8) Other; 9) Unknown
8S.National Institutes of Health Stroke Scale (NIHSS) score 24 hours post-thrombectomy
8T(II). Following the procedure, was the patient transferred immediately back to primary receiving hospital?
1) Yes; 2) No; 9) Unknown
8T(II). If no, when was the patient admitted to the endovascular stroke centre?
1) 0–3 hours; 2) 3–12 hours; 3) 12–24 hours; 4) 24+ hours

NOCA NATIONAL OFFICE OF CLINICAL AUDIT IRISH NATIONAL AUDIT OF STROKE NATIONAL REPORT 2019 155154
APPENDIX 2: INAS DATASETHIPE stroke audit portal data entry/Stroke
HEALTH AND SOCIAL CARE PROFESSIONAL DATASETQuestion Options21. Was the patient referred to physiotherapist?
1) Yes; 2) No; 3) Unknown
21A. If yes, please provide date of referral
22. Was the patient seen by physiotherapist? 1) Yes; 2) No; 3) Discharged before seen; 9) Unknown
22A. If yes, date of initial contact by physiotherapist
23. Indoor mobility pre-admission 1) Independent, no aid; 2) Independent, with an aid; 3) Supervision or assistance of one person +/- aid; 4) Transfer only with assistance +/- aid; 5) Hoist transfer; 9) Unknown
24. Were standardised outcome measures used?
1) Yes; 2) No; 3) Unknown
25. Was the intensity of physiotherapy sufficient?
1) Yes 80–100%; 2) Moderate 50–79%; 3) No 0–49%; 9) Unknown
25A. Was intensity calculated on minutes of therapy?
1) Yes; 2) No; 3) Unknown
26. Did the patient require more than one therapist/physiotherapist assistant for more than half of their treatment sessions?
1 Yes; 2 No; 3 Unknown
27. Indoor mobility on discharge 0) n/a Died 1) Independent no aid; 2) Independent, with an aid; 3) Supervision or assistance of one person +/- aid; 4) Transfer only with assistance +/- aid; 5) Hoist transfer; 9) Unknown
28. Onward physiotherapy referral to 0) n/a Died; 1) Inpatient rehabilitation; 2) Community physiotherapy; 3) ESD PT; 4) Stroke-specific outpatient physiotherapy; 5) Day hospital; 8) Other; 9) Unknown
29. Was the patient referred to an occupational therapist?
1) Yes; 2) No; 3) Unknown
29A. If yes, please provide date of referral
30. Was the patient seen by an occupational therapist?
1) Yes; 2) No; 3) Discharged before seen; 9) Unknown
30A. If yes, date of initial assessment by an occupational therapist
31. Prior to admission, which would best describe the patient’s ability to attend to their personal activities of daily living?
1) Independent; 2) Independent, with cues/aids; 3) Required supervision or set-up; 4) Required assistance; 5) Dependent/full care; 6) Unknown
32. Was the patient a driver prior to admission?
1) Yes; 2) No; 3) Unknown
32A. If yes, was the patient advised prior to discharge about driving limitations post-stroke?
1) Yes; 2) No; 3) Unknown
33. Did the patient work in paid employment prior to admission?
1) Yes; 2) No; 3) Unknown

NOCA NATIONAL OFFICE OF CLINICAL AUDIT IRISH NATIONAL AUDIT OF STROKE NATIONAL REPORT 2019 155154
APPENDIX 2: INAS DATASETHIPE stroke audit portal data entry/Stroke
Question Options33A. If yes, was the person advised about return to work prior to discharge?
1) Yes; 2) No; 3) Onward referral made; 4) Unknown
34. Was the intensity of occupational therapy input sufficient?
1) Yes 80–100%; 2) Moderate 50–79%; 3) No 0–49%; 9) Unknown
34A. Was intensity calculated on minutes of therapy?
1) Yes; 2) No; 3) Unknown
35. Did the patient require more than one therapist/therapy assistant for more than half of their treatment sessions?
1) Yes; 2) No; 3) Unknown
36. Were visual fields assessed during the admission?
1) Yes, using confrontation testing; 2) Yes, using perimetry testing; 3) Yes, using both confrontation and perimetry testing; 4) Attempted, but unable due to patient factors; 5) No; 6) Unknown
37. Was screening for cognitive impairment completed, using a valid screening measure?
1) Yes; 2) No; 3) Unable to complete due to patient factors; 4) Unknown
38. On discharge, which would best describe the patient’s ability to attend to their personal activities of daily living?
0) n/a Died; 1) Independent; 2) Independent, with cues/aids; 3) Required supervision or set-up; 4) Required assistance; 5) Dependent/full care; 9) Unknown
39. Was an onward referral made for further occupational therapy intervention?
0) n/a Died 1) Yes; 2) No; 9) Unknown
39A. If yes, to what service? 1) Inpatient rehabilitation (off-site); 2) Community occupational therapy; 3) ESD occupational therapy; 4) Other
40. Was the patient referred to a speech and language therapist?
1) Yes; 2) No; 3) Unknown
40A. If yes, please provide date of referral
41. Was the patient seen by a speech and language therapist?
1) Yes; 2) No; 3) Discharged before seen; 9) Unknown
41A. If yes, date of initial contact by speech and language therapist
42. Functional communication ability prior to admission
1) No difficulties; 2) Mild: effective communication >80% – occasional breakdown in conversation; 3) Moderate: effective communication 50–79% – frequent breakdown in conversation; 4) Severe: less than half (10–49%) of communication attempts are successful; 5) Profound: no, or occasional (<10%) communication attempts are successful; 9) Unknown
43. Modified diet recommended prior to admission
1) Yes; 2) No; 3) Unknown
44. Modified fluids recommended prior to admission
1) Yes; 2) No; 3) Unknown
45. Speech and language therapist initial assessment diagnosis
1) Difficulties identified; 2) No issues identified
45A. Does the patient have swallowing difficulty?
1) Yes; 2) No; 3) Unknown
45B. Does the patient have dysarthria? 1) Yes; 2) No; 3) Unknown
45C. Does the patient have dyspraxia? 1) Yes; 2) No; 3) Unknown
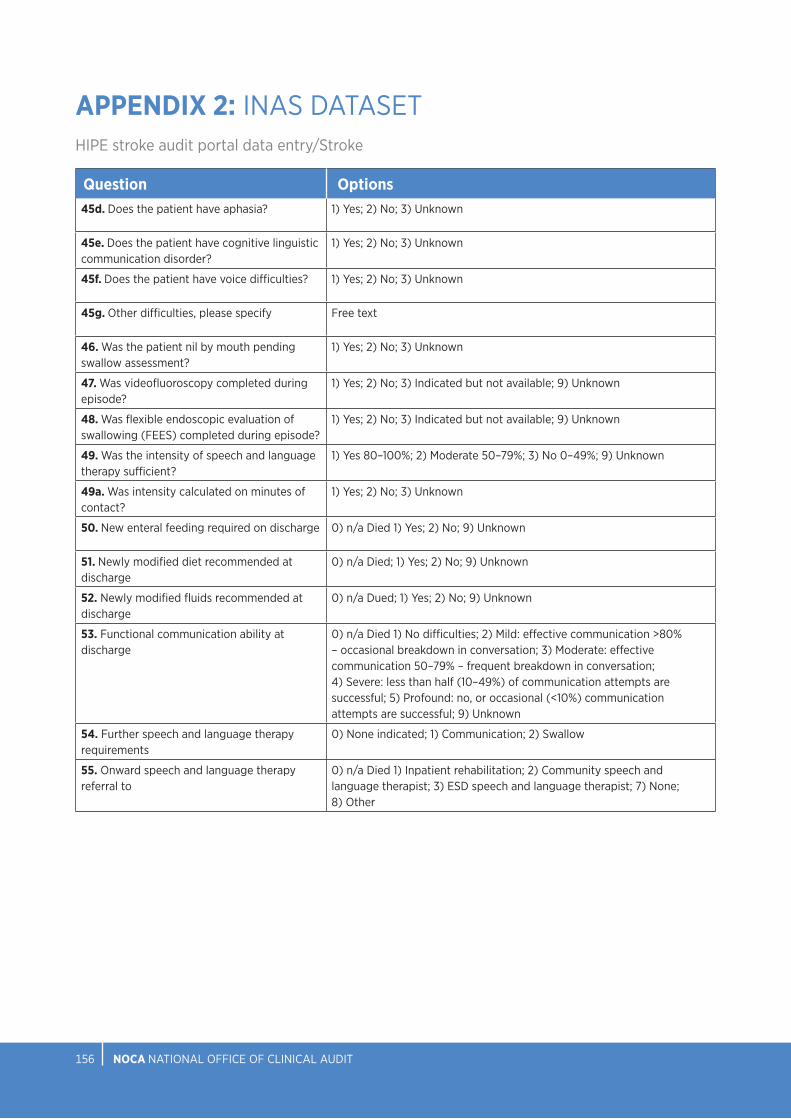
NOCA NATIONAL OFFICE OF CLINICAL AUDIT IRISH NATIONAL AUDIT OF STROKE NATIONAL REPORT 2019 157156
APPENDIX 2: INAS DATASETHIPE stroke audit portal data entry/Stroke
Question Options45d. Does the patient have aphasia? 1) Yes; 2) No; 3) Unknown
45e. Does the patient have cognitive linguistic communication disorder?
1) Yes; 2) No; 3) Unknown
45f. Does the patient have voice difficulties? 1) Yes; 2) No; 3) Unknown
45g. Other difficulties, please specify Free text
46. Was the patient nil by mouth pending swallow assessment?
1) Yes; 2) No; 3) Unknown
47. Was videofluoroscopy completed during episode?
1) Yes; 2) No; 3) Indicated but not available; 9) Unknown
48. Was flexible endoscopic evaluation of swallowing (FEES) completed during episode?
1) Yes; 2) No; 3) Indicated but not available; 9) Unknown
49. Was the intensity of speech and language therapy sufficient?
1) Yes 80–100%; 2) Moderate 50–79%; 3) No 0–49%; 9) Unknown
49a. Was intensity calculated on minutes of contact?
1) Yes; 2) No; 3) Unknown
50. New enteral feeding required on discharge 0) n/a Died 1) Yes; 2) No; 9) Unknown
51. Newly modified diet recommended at discharge
0) n/a Died; 1) Yes; 2) No; 9) Unknown
52. Newly modified fluids recommended at discharge
0) n/a Dued; 1) Yes; 2) No; 9) Unknown
53. Functional communication ability at discharge
0) n/a Died 1) No difficulties; 2) Mild: effective communication >80% – occasional breakdown in conversation; 3) Moderate: effective communication 50–79% – frequent breakdown in conversation; 4) Severe: less than half (10–49%) of communication attempts are successful; 5) Profound: no, or occasional (<10%) communication attempts are successful; 9) Unknown
54. Further speech and language therapy requirements
0) None indicated; 1) Communication; 2) Swallow
55. Onward speech and language therapy referral to
0) n/a Died 1) Inpatient rehabilitation; 2) Community speech and language therapist; 3) ESD speech and language therapist; 7) None; 8) Other

NOCA NATIONAL OFFICE OF CLINICAL AUDIT IRISH NATIONAL AUDIT OF STROKE NATIONAL REPORT 2019 157156
APPENDIX 3: FREQUENCY TABLES
FIGURE 4.1: PERCENTAGE OF IRISH NATIONAL AUDIT OF STROKE CASES, BY GENDER AND AGE GROUP (N=4275)
Male Female TotalN % N % N %
17–64 712 68.2% 332 31.8% 1044 100.0%
65–79 1083 60.8% 698 39.2% 1781 100.0%
80+ 615 42.4% 835 57.6% 1450 100.0%
Total 2410 56.4% 1865 43.6% 4275 100.0%
FIGURE 4.2: ADMISSION SOURCE (N=4275)
N %Home 3746 87.6%
Transfer of admitted patient from acute hospital 159 3.7%
Transfer from nursing home/convalescent home or other long-stay accommodation
339 7.9%
Other 31 0.7%
Total 4275 100.0%
FIGURE 4.3: DISTRIBUTION OF TIME FROM ONSET OF STROKE SYMPTOMS TO HOSPITAL ARRIVAL (n=2246)
N %Between 0 and 3 hours 1103 49.1%
Between 3 hours and 4 hours, 30 minutes 230 10.2%
Between 4 hours, 30 minutes and 12 hours 441 19.6%
More than 12 hours 472 21.0%
Total 2246 100.0%
FIGURE 4.4: DISTRIBUTION OF DAY AND TIME OF HOSPITAL ARRIVAL (n=4013)
00.00–08.59 09.00–16.59 17.00–23.59 TotalN % N % N % N %
Sunday 64 13.6% 263 56.1% 142 30.3% 469 100.0%
Monday 69 10.5% 373 56.9% 214 32.6% 656 100.0%
Tuesday 83 12.6% 392 59.7% 182 27.7% 657 100.0%
Wednesday 68 12.0% 330 58.4% 167 29.6% 565 100.0%
Thursday 66 11.2% 347 58.9% 176 29.9% 589 100.0%
Friday 77 13.8% 329 58.9% 153 27.4% 559 100.0%
Saturday 67 12.9% 282 54.4% 169 32.6% 518 100.0%
Total 494 12.3% 2316 57.7% 1203 30.0% 4013 100.0%

NOCA NATIONAL OFFICE OF CLINICAL AUDIT IRISH NATIONAL AUDIT OF STROKE NATIONAL REPORT 2019 159158
APPENDIX 3: FREQUENCY TABLES
FIGURE 4.5: TIME BETWEEN HOSPITAL ARRIVAL AND TIME REVIEWED BY MEDICAL TEAM (n=3019)
N %Less than 10 minutes 1334 44.2%
11 to 30 minutes 400 13.2%
31 minutes to 1 hour 255 8.4%
More than 1 hour to 3 hours 336 11.1%
More than 3 hours to 24 hours 599 19.8%
More than 24 hours 95 3.1%
Total 3019 100.0%
FIGURE 4.6: DOOR TO IMAGING TIME, MEDIAN AND INTERQUARTILE RANGE, BY HOSPITAL, IN MINUTES (n=3640)
Number of cases with DTI recorded
Median (mins)
Percentile 25(mins)
Percentile 75 (mins)
Cases within 60 minutes
N N %Bantry General Hospital 86 53.5 20.0 109.0 45 52.3%
Beaumont Hospital 320 48.0 22.0 241.0 178 55.6%
Cavan General Hospital 41 53.0 36.0 244.0 22 53.7%
Connolly Hospital 169 186.0 37.0 905.0 54 32.0%
Cork University Hospital 421 47.0 25.0 174.0 234 55.6%
Letterkenny University Hospital 157 142.0 53.0 953.0 48 30.6%
Mater Misericordiae University Hospital 264 37.0 18.0 140.0 161 61.0%
Mayo University Hospital 170 149.0 64.0 692.0 41 24.1%
Mercy University Hospital 91 115.0 39.5 254.5 33 36.3%
Naas General Hospital 145 43.0 15.0 437.0 76 52.4%
Our Lady of Lourdes Hospital Drogheda 156 107.0 39.0 287.0 62 39.7%
Our Lady’s Hospital, Navan 69 61.0 42.0 168.0 34 49.3%
Sligo University Hospital 170 94.0 42.0 232.0 63 37.1%
South Tipperary General Hospital 100 103.5 44.5 828.0 36 36.0%
St James’s Hospital 219 73.0 30.0 205.5 103 47.0%
St Vincent’s University Hospital 320 104.5 27.5 260.5 135 42.2%
Tallaght University Hospital 230 79.0 21.0 307.0 105 45.7%
University Hospital Limerick 253 107.0 49.0 825.0 84 33.2%
University Hospital Waterford 125 96.0 32.0 253.0 54 43.2%
Wexford General Hospital 134 818.5 71.0 1337.0 32 23.9%
Total 3640 80.0 31.0 307.0 1600 44.0%

NOCA NATIONAL OFFICE OF CLINICAL AUDIT IRISH NATIONAL AUDIT OF STROKE NATIONAL REPORT 2019 159158
APPENDIX 3: FREQUENCY TABLES
FIGURE 4.7: PERCENTAGE OF IRISH NATIONAL AUDIT OF STROKE CASES, BY STROKE TYPE (N=4275)
N %Ischaemic stroke 3659 85.6%
Haemorrhagic stroke 616 14.4%
Total 4275 100.0%
FIGURE 4.8: PERCENTAGE OF THROMBOLYSIS IN ISCHAEMIC STROKE CASES, BY HOSPITAL (n=3659)
Yes No Contraindicated Unknown TotalN % N % N % N % N %
Bantry General Hospital 13 15.1% 51 59.3% 22 25.6% 0 0.0% 86 100.0%
Beaumont Hospital 38 9.1% 22 5.3% 358 85.6% 0 0.0% 418 100.0%
Cavan General Hospital 13 12.1% 91 85.0% ~ 2.8% 0 0.0% * *
Connolly Hospital 14 7.8% ~ * 163 91.1% 0 0.0% * *
Cork University Hospital 39 9.9% 12 3.0% 342 86.8% ~ * * *
Letterkenny University Hospital 14 9.7% 0 0.0% 129 89.0% ~ * * *
Mater Misericordiae University Hospital 56 22.0% 76 29.9% 122 48.0% 0 0.0% 254 100.0%
Mayo University Hospital 9 5.1% ~ * 160 91.4% ~ * 175 100.0%
Mercy University Hospital 10 12.2% ~ * 69 84.1% 0 0.0% * *
Naas General Hospital 14 8.8% 141 88.1% 0 0.0% 5 3.1% 160 100.0%
Our Lady of Lourdes Hospital Drogheda 11 6.4% 46 26.6% 112 64.7% ~ * * *
Our Lady’s Hospital, Navan 12 18.5% 53 81.5% 0 0.0% 0 0.0% 65 100.0%
Sligo University Hospital 14 8.7% ~ * 145 90.1% 0 0.0% * *
South Tipperary General Hospital 8 8.4% 83 87.4% ~ * 0 0.0% * *
St James’s Hospital 23 11.4% 37 18.4% 140 69.7% ~ * * *
St Vincent’s University Hospital 26 8.8% ~ * 267 90.2% 0 0.0% * *
Tallaght University Hospital 29 14.1% 0 0.0% 177 85.9% 0 0.0% 206 100.0%
University Hospital Limerick 24 10.3% 94 40.5% 113 48.7% ~ * * *
University Hospital Waterford 12 10.0% ~ * 106 88.3% 0 0.0% * *
Wexford General Hospital 10 9.1% 34 30.9% 65 59.1% ~ * * *
Total 389 10.6% 754 20.6% 2497 68.2% 19 0.5% 3659 100.0%
~ Denotes 5 or fewer cases* Further suppression required to prevent disclosure of five cases or fewer

NOCA NATIONAL OFFICE OF CLINICAL AUDIT IRISH NATIONAL AUDIT OF STROKE NATIONAL REPORT 2019 161160
APPENDIX 3: FREQUENCY TABLES
FIGURE 4.9: DOOR TO NEEDLE TIME, MEDIAN AND INTERQUARTILE RANGE, BY HOSPITAL, IN MINUTES (n=353)
N Median (minutes)
Percentile 25 (minutes)
Percentile 75 (minutes)
Bantry General Hospital 13 46.0 25.0 68.0
Beaumont Hospital 37 42.0 25.0 60.0
Cavan General Hospital 12 99.5 80.5 128.5
Connolly Hospital 12 27.5 21.5 55.5
Cork University Hospital 35 66.0 43.5 92.0
Letterkenny University Hospital 11 66.0 42.0 87.0
Mater Misericordiae University Hospital 46 58.0 41.0 75.0
Mayo University Hospital 8 110.5 90.0 130.5
Mercy University Hospital 9 56.0 48.0 65.0
Naas General Hospital 14 35.0 29.0 51.0
Our Lady of Lourdes Hospital Drogheda 7 54.0 35.0 72.5
Our Lady’s Hospital, Navan 10 104.0 64.0 128.0
Sligo University Hospital 13 54.0 39.0 82.0
South Tipperary General Hospital 8 93.5 69.5 109.5
St James’s Hospital 22 67.5 47.0 86.0
St Vincent’s University Hospital 25 38.0 32.0 54.0
Tallaght University Hospital 29 63.0 23.0 101.0
University Hospital Limerick 24 57.0 39.0 80.0
University Hospital Waterford 9 43.0 34.0 59.0
Wexford General Hospital 9 63.0 44.0 81.0
Total 353 56.0 35.0 87.0
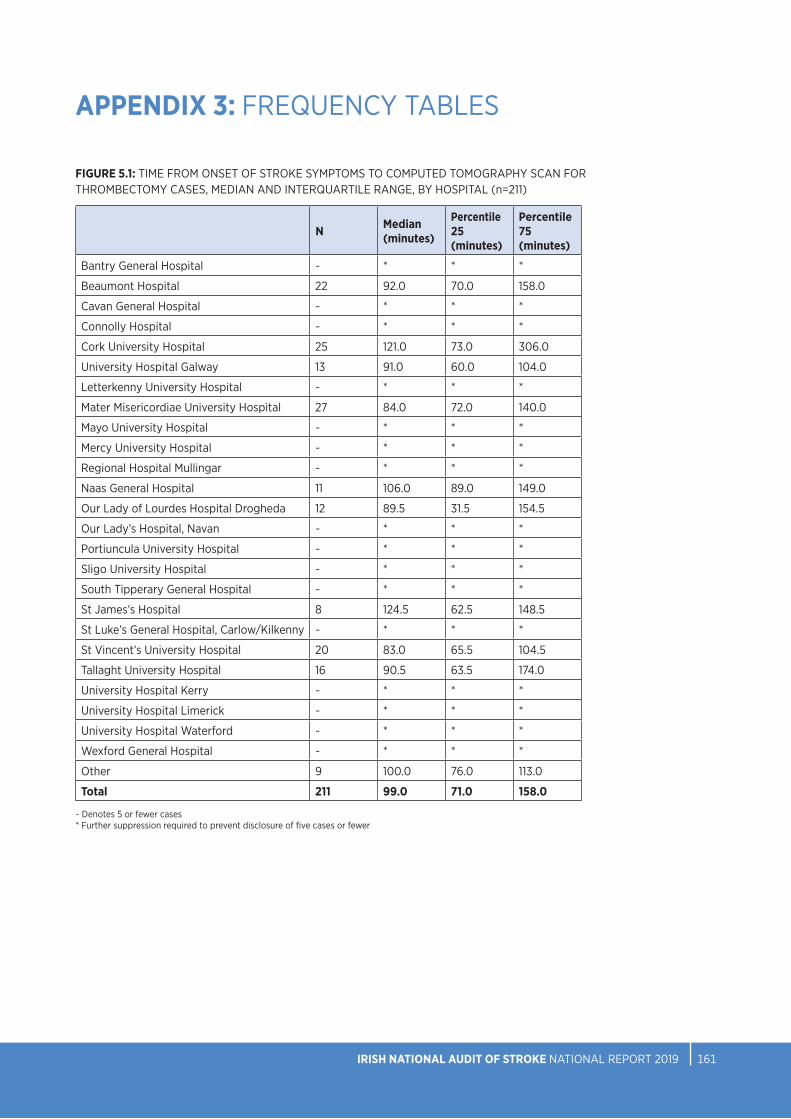
NOCA NATIONAL OFFICE OF CLINICAL AUDIT IRISH NATIONAL AUDIT OF STROKE NATIONAL REPORT 2019 161160
APPENDIX 3: FREQUENCY TABLES
FIGURE 5.1: TIME FROM ONSET OF STROKE SYMPTOMS TO COMPUTED TOMOGRAPHY SCAN FOR THROMBECTOMY CASES, MEDIAN AND INTERQUARTILE RANGE, BY HOSPITAL (n=211)
N Median (minutes)
Percentile 25 (minutes)
Percentile 75 (minutes)
Bantry General Hospital ~ * * *
Beaumont Hospital 22 92.0 70.0 158.0
Cavan General Hospital ~ * * *
Connolly Hospital ~ * * *
Cork University Hospital 25 121.0 73.0 306.0
University Hospital Galway 13 91.0 60.0 104.0
Letterkenny University Hospital ~ * * *
Mater Misericordiae University Hospital 27 84.0 72.0 140.0
Mayo University Hospital ~ * * *
Mercy University Hospital ~ * * *
Regional Hospital Mullingar ~ * * *
Naas General Hospital 11 106.0 89.0 149.0
Our Lady of Lourdes Hospital Drogheda 12 89.5 31.5 154.5
Our Lady’s Hospital, Navan ~ * * *
Portiuncula University Hospital ~ * * *
Sligo University Hospital ~ * * *
South Tipperary General Hospital ~ * * *
St James’s Hospital 8 124.5 62.5 148.5
St Luke’s General Hospital, Carlow/Kilkenny ~ * * *
St Vincent’s University Hospital 20 83.0 65.5 104.5
Tallaght University Hospital 16 90.5 63.5 174.0
University Hospital Kerry ~ * * *
University Hospital Limerick ~ * * *
University Hospital Waterford ~ * * *
Wexford General Hospital ~ * * *
Other 9 100.0 76.0 113.0
Total 211 99.0 71.0 158.0
~ Denotes 5 or fewer cases* Further suppression required to prevent disclosure of five cases or fewer

NOCA NATIONAL OFFICE OF CLINICAL AUDIT IRISH NATIONAL AUDIT OF STROKE NATIONAL REPORT 2019 163162
APPENDIX 3: FREQUENCY TABLES
FIGURE 5.3: TIME FROM COMPUTED TOMOGRAPHY ANGIOGRAM TO DECISION TO TRANSFER PATIENT TO EVT STROKE CENTRE FOR THROMBECTOMY CASES, MEDIAN AND INTERQUARTILE RANGE, BY HOSPITAL (n=235)
FIGURE 5.2: PERCENTAGE OF PATIENTS TRANSFERRED TO ENDOVASCULAR STROKE CENTRE (n=361)
N %Admitted directly to an EVT stroke centre 69 19.1%
Transferred to an EVT stroke centre 292 80.9%
Total 361 100.0%
N Median (minutes)
Percentile 25 (minutes)
Percentile 75 (minutes)
Bantry General Hospital ~ * * *
Cavan General Hospital ~ * * *
Connolly Hospital ~ * * *
University Hospital Galway 17 44.0 26.0 65.0
Letterkenny University Hospital ~ * * *
Mater Misericordiae University Hospital 40 20.0 13.5 35.5
Mayo University Hospital 9 25.0 17.0 28.0
Mercy University Hospital ~ * * *
Regional Hospital Mullingar 9 20.0 18.0 40.0
Naas General Hospital 19 15.0 12.5 22.0
Our Lady of Lourdes Hospital Drogheda 16 21.5 15.5 39.0
Our Lady’s Hospital, Navan ~ * * *
Portiuncula University Hospital ~ * * *
Sligo University Hospital ~ * * *
South Tipperary General Hospital ~ * * *
St James’s Hospital 17 34.0 22.0 44.0
St Luke’s General Hospital, Carlow/Kilkenny 9 13.0 8.0 30.0
St Vincent’s University Hospital 25 43.0 27.0 50.0
Tallaght University Hospital 21 30.0 17.0 58.0
University Hospital Kerry ~ * * *
University Hospital Limerick ~ * * *
University Hospital Waterford 8 43.0 26.5 54.5
Wexford General Hospital 6 16.0 14.0 31.0
Other 7 37.0 21.5 61.5
Total 235 26.0 16.0 47.0
~ Denotes 5 or fewer cases* Further suppression required to prevent disclosure of five cases or fewer

NOCA NATIONAL OFFICE OF CLINICAL AUDIT IRISH NATIONAL AUDIT OF STROKE NATIONAL REPORT 2019 163162
APPENDIX 3: FREQUENCY TABLES
FIGURE 5.4B: TIME FROM ONSET OF STROKE SYMPTOMS TO EVT STROKE CENTRE ARRIVAL, MEDIAN AND INTERQUARTILE RANGE, FOR THROMBECTOMY CASES WHO WERE TRANSFERRED TO THE EVT STROKE CENTRE (n=165)
N Median (minutes)
Percentile 25 (minutes)
Percentile 75 (minutes)
Bantry General Hospital ~ * * *
Cavan General Hospital ~ * * *
Connolly Hospital ~ * * *
University Hospital Galway 13 298.0 263.0 350.0
Letterkenny University Hospital ~ * * *
Mater Misericordiae University Hospital 24 185.5 132.5 251.0
Mayo University Hospital ~ * * *
Mercy University Hospital ~ * * *
Regional Hospital Mullingar ~ * * *
Naas General Hospital 8 215.0 172.5 271.5
Our Lady of Lourdes Hospital Drogheda 12 209.0 147.0 295.0
Our Lady’s Hospital, Navan ~ * * *
Portiuncula University Hospital ~ * * *
Sligo University Hospital ~ * * *
South Tipperary General Hospital ~ * * *
St James’s Hospital 8 236.0 134.0 336.0
St Luke’s General Hospital, Carlow/Kilkenny ~ * * *
St Vincent’s University Hospital 21 180.0 145.0 200.0
Tallaght University Hospital 16 198.5 148.0 330.5
University Hospital Kerry 6 362.5 275.0 402.0
University Hospital Limerick ~ * * *
University Hospital Waterford 6 370.5 327.0 445.0
Wexford General Hospital ~ * * *
Other 8 274.5 179.0 377.5
Total 165 240.0 160.0 338.0
~ Denotes 5 or fewer cases* Further suppression required to prevent disclosure of five cases or fewer
FIGURE 5.4A: TIME FROM ONSET OF STROKE SYMPTOMS TO EVT STROKE CENTRE ARRIVAL, MEDIAN AND INTERQUARTILE RANGE, FOR THROMBECTOMY CASES WHO WERE ADMITTED DIRECTLY TO THE EVT STROKE CENTRE (n=42)
N Median (minutes)
Percentile 25 (minutes)
Percentile 75 (minutes)
Beaumont Hospital 20 82.0 46.5 138.0
Cork University Hospital 22 121.5 78.0 277.0
Total 42 93.5 69.0 184.0

NOCA NATIONAL OFFICE OF CLINICAL AUDIT IRISH NATIONAL AUDIT OF STROKE NATIONAL REPORT 2019 165164
APPENDIX 3: FREQUENCY TABLES
FIGURE 5.5: PROXIMAL OCCLUSION SITE (n=361)
N %Middle cerebral artery 1 199 55.1%
Middle cerebral artery 2 60 16.6%
Internal carotid artery terminus 49 13.6%
Internal carotid artery cervical segment 24 6.6%
Basilar 15 4.2%
Vertebrobasilar 9 2.5%
Unknown ~ *
Posterior cerebral artery ~ *
Total 361 100.0%
~ Denotes 5 or fewer cases* Further suppression required to prevent disclosure of five cases or fewer
FIGURE 5.6A: TIME FROM ONSET OF STROKE SYMPTOMS TO RECANALISATION, MEDIAN AND INTERQUARTILE RANGE, FOR PATIENTS ADMITTED DIRECTLY TO THE EVT STROKE CENTRE (n=42)
N Median (minutes)
Percentile 25 (minutes)
Percentile 75 (minutes)
Beaumont Hospital 20 163.5 131.5 262.0
Cork University Hospital 22 248.0 197.0 461.0
Total 42 212.0 136.0 351.0

NOCA NATIONAL OFFICE OF CLINICAL AUDIT IRISH NATIONAL AUDIT OF STROKE NATIONAL REPORT 2019 165164
FIGURE 5.6B: TIME FROM ONSET OF STROKE SYMPTOMS TO RECANALISATION, MEDIAN AND INTERQUARTILE RANGE, FOR PATIENTS TRANSFERRED FROM ANOTHER HOSPITAL TO THE EVT STROKE CENTRE (n=160)
APPENDIX 3: FREQUENCY TABLES
N Median (minutes)
Percentile 25 (minutes)
Percentile 75 (minutes)
Bantry General Hospital ~ * * *
Cavan General Hospital ~ * * *
Connolly Hospital ~ * * *
University Hospital Galway 12 370.5 329.0 405.0
Letterkenny University Hospital ~ - - -
Mater Misericordiae University Hospital 23 207.0 159.0 232.0
Mayo University Hospital ~ * * *
Mercy University Hospital ~ * * *
Regional Hospital Mullingar ~ * * *
Naas General Hospital 11 240.0 199.0 263.5
Our Lady of Lourdes Hospital Drogheda 9 259.0 225.0 280.0
Our Lady’s Hospital, Navan ~ * * *
Portiuncula University Hospital ~ * * *
Sligo University Hospital ~ * * *
South Tipperary General Hospital ~ * * *
St James’s Hospital 8 276.0 166.5 386.0
St Luke’s General Hospital, Carlow/Kilkenny ~ * * *
St Vincent’s University Hospital 20 213.0 190.5 239.0
Tallaght University Hospital 14 243.5 182.0 378.0
University Hospital Kerry 6 421.0 386.0 481.0
University Hospital Limerick ~ * * *
University Hospital Waterford ~ * * *
Wexford General Hospital ~ * * *
Other 11 330.0 185.0 441.0
Total 160 279.0 200.0 393.0
~ Denotes 5 or fewer cases* Further suppression required to prevent disclosure of five cases or fewer
FIGURE 5.7: INTERVENTION OUTCOMES – NATIONAL INSTITUTES OF HEALTH STROKE SCALE SCORES (n=328)
Pre-thrombectomy 24 hrs post-thrombectomy
N % N %No stroke symptoms 0 0.0% 19 5.8%
Minor stroke (1–4) 9 2.7% 105 32.0%
Moderate stroke (5–15) 159 48.5% 126 38.4%
Moderate to severe stroke (16–20) 100 30.5% 46 14.0%
Severe stroke (21–42) 60 18.3% 32 9.8%
Total 328 100.0% 328 100.0%

NOCA NATIONAL OFFICE OF CLINICAL AUDIT IRISH NATIONAL AUDIT OF STROKE NATIONAL REPORT 2019 167166
APPENDIX 3: FREQUENCY TABLES
FIGURE 5.8: PERCENTAGE OF CASES TRANSFERRED IMMEDIATELY BACK TO REFERRING HOSPITAL (n=292)
N %Yes 188 64.4%
No 99 33.9%
Unknown 5 1.7%
Total 292 100.0%
FIGURE 5.9: DISCHARGE DESTINATION FOR PATIENTS ADMITTED DIRECTLY TO THE EVT STROKE CENTRE (n=69)
Cork University Hospital
Beaumont Hospital Total
N % N % N %Home 15 42.9% 17 50.0% 32 46.4%
Nursing home, convalescent home or long-stay accommodation ~ * 7 20.6% * *
Transfer to acute hospital 8 22.9% ~ * * *
Died 9 25.7% 7 20.6% 16 23.2%
Transfer to non-acute hospital ~ * 0 0.0% ~ *
Hospice (not in HIPE hospital listing) 0 0.0% ~ * ~ *
Total 35 100.0% 34 100.0% 69 100.0%
~ Denotes five cases or fewer* Further suppression required to prevent disclosure of five cases or fewer

NOCA NATIONAL OFFICE OF CLINICAL AUDIT IRISH NATIONAL AUDIT OF STROKE NATIONAL REPORT 2019 167166
APPENDIX 3: FREQUENCY TABLES
FIGURE 6.1: ADMISSION TO STROKE UNIT, BY HOSPITAL (N=4275)
Yes No Total
N % N % N %
Bantry General Hospital 78 85.7% 13 14.3% 91 100.0%
Beaumont Hospital 391 83.2% 79 16.8% 470 100.0%
Cavan General Hospital 92 70.8% 38 29.2% 130 100.0%
Connolly Hospital 136 69.4% 60 30.6% 196 100.0%
Cork University Hospital 340 70.4% 143 29.6% 483 100.0%
Letterkenny University Hospital 0 0.0% 173 100.0% 173 100.0%
Mater Misericordiae University Hospital 215 70.3% 91 29.7% 306 100.0%
Mayo University Hospital 183 92.4% 15 7.6% 198 100.0%
Mercy University Hospital 67 69.8% 29 30.2% 96 100.0%
Naas General Hospital 134 73.2% 49 26.8% 183 100.0%
Our Lady of Lourdes Hospital Drogheda 137 71.4% 55 28.6% 192 100.0%
Our Lady’s Hospital, Navan 0 0.0% 76 100.0% 76 100.0%
Sligo University Hospital 166 93.8% 11 6.2% 177 100.0%
South Tipperary General Hospital 71 65.1% 38 34.9% 109 100.0%
St James’s Hospital 211 86.1% 34 13.9% 245 100.0%
St Vincent’s University Hospital 271 74.9% 91 25.1% 362 100.0%
Tallaght University Hospital 201 83.8% 39 16.3% 240 100.0%
University Hospital Limerick 192 71.1% 78 28.9% 270 100.0%
University Hospital Waterford 97 71.3% 39 28.7% 136 100.0%
Wexford General Hospital 58 40.8% 84 59.2% 142 100.0%
National 3040 71.1% 1235 28.9% 4275 100.0%
FIGURE 6.2A: REASON FOR NON-ADMISSION TO A STROKE UNIT (N=1235) ATRIAL FIBRILLATION
N %
Bed not available 471 38.1%
Other 456 36.9%
No stroke unit 249 20.2%
Infection control risk 34 2.8%
Unknown 25 2.0%
Total 1235 100.0%

NOCA NATIONAL OFFICE OF CLINICAL AUDIT IRISH NATIONAL AUDIT OF STROKE NATIONAL REPORT 2019 169168
APPENDIX 3: FREQUENCY TABLES
FIGURE 6.2B: OTHER REASONS FOR NON-ADMISSION TO A STROKE UNIT (n=456)
N %
Too unwell 125 27.4%
Unknown 77 16.9%
Not referred to stroke service 72 15.8%
Too well 59 12.9%
End-of-life care 50 11.0%
Bed management decision 41 9.0%
Transferred to other hospital 22 4.8%
Patient choice 10 2.2%
Total 456 100.0%
FIGURE 6.3: SWALLOW SCREENING, BY HOSPITAL (N=4275)
Yes No Unknown Total
N % N % N % N %
Bantry General Hospital 65 71.4% 26 28.6% 0 0.0% 91 100.0%
Beaumont Hospital 344 73.2% 124 26.4% ~ * * *
Cavan General Hospital ~ * 83 63.8% 42 32.3% * *
Connolly Hospital 196 100.0% 0 0.0% 0 0.0% 196 100.0%
Cork University Hospital 399 82.6% 84 17.4% 0 0.0% 483 100.0%
Letterkenny University Hospital 69 39.9% 102 59.0% ~ * * *
Mater Misericordiae University Hospital 240 78.4% 29 9.5% 37 12.1% 306 100.0%
Mayo University Hospital 37 18.7% 68 34.3% 93 47.0% 198 100.0%
Mercy University Hospital 48 50.0% 43 44.8% 5 5.2% 96 100.0%
Naas General Hospital 26 14.2% 125 68.3% 32 17.5% 183 100.0%
Our Lady of Lourdes Hospital Drogheda 97 50.5% 82 42.7% 13 6.8% 192 100.0%
Our Lady’s Hospital, Navan 19 25.0% 51 67.1% 6 7.9% 76 100.0%
Sligo University Hospital 161 91.0% 15 8.5% ~ * * *
South Tipperary General Hospital 102 93.6% 7 6.4% 0 0.0% 109 100.0%
St James’s Hospital 207 84.5% 32 13.1% 6 2.4% 245 100.0%
St Vincent’s University Hospital 215 59.4% 146 40.3% ~ * * *
Tallaght University Hospital 217 90.4% 23 9.6% 0 0.0% 240 100.0%
University Hospital Limerick 227 84.1% 42 15.6% ~ * * *
University Hospital Waterford 90 66.2% 46 33.8% 0 0.0% 136 100.0%
Wexford General Hospital 86 60.6% 56 39.4% 0 0.0% 142 100.0%
National 2850 66.7% 1184 27.7% 241 5.6% 4275 100.0%
~ Denotes five cases or fewer* Further suppression required to prevent disclosure of five cases or fewer

NOCA NATIONAL OFFICE OF CLINICAL AUDIT IRISH NATIONAL AUDIT OF STROKE NATIONAL REPORT 2019 169168
FIGURE 6.4: MOOD SCREENING (N=4275)
N %
Yes 958 22.4%
No 1152 26.9%
Not indicated 1348 31.5%
Unknown 817 19.1%
Total 4275 100.0%
FIGURE 6.5A: HEALTH AND SOCIAL CARE PROFESSIONAL ASSESSMENT (n=3741)
N %
Physiotherapist
Yes 3426 91.6%
No 139 3.7%
Not indicated 143 3.8%
Unknown 33 0.9%
Total 3741 100.0%
Occupational therapist
Yes 3107 83.1%
No 294 7.9%
Not indicated 283 7.6%
Unknown 57 1.5%
Total 3741 100.0%
Speech and language therapist
Yes 2473 66.1%
No 444 11.9%
Not indicated 679 18.2%
Unknown 145 3.9%
Total 3741 100.0%
Dietitian
Yes 1228 32.8%
No 895 23.9%
Not indicated 1213 32.4%
Unknown 405 10.8%
Total 3741 100.0%
Medical social worker
Yes 969 25.9%
No 1171 31.3%
Not indicated 1180 31.5%
Unknown 421 11.3%
Total 3741 100.0%
Psychologist
Yes 141 3.8%
No 1752 46.8%
Not indicated 1209 32.3%
Unknown 639 17.1%
Total 3741 100.0%
APPENDIX 3: FREQUENCY TABLES

NOCA NATIONAL OFFICE OF CLINICAL AUDIT IRISH NATIONAL AUDIT OF STROKE NATIONAL REPORT 2019 171170
FIGURE 6.5B: ASSESSED BY CLINICAL NURSE SPECIALIST (N=4275)
N %
Yes 3593 84.0%
No 622 14.5%
Unknown 60 1.4%
Total 4275 100.0%
FIGURE 6.6: START TIMES FOR ANTITHROMBOTICS (n=3026)
N %
Same day 1752 57.9%
Next day 927 30.6%
2–7 days 287 9.5%
More than 8 days 60 2.0%
Total 3026 100.0%
FIGURE 6.7: BREAKDOWN OF PRE-STROKE ATRIAL FIBRILLATION DATA FOR PATIENTS WITH ISCHAEMIC AND HAEMORRHAGIC STROKE
Atrial fibrillation (AF)
Atrial fibrillation known prior to stroke of total atrial fibrillation cases
On anti-coagulation of total atrial fibrillation known prior to stroke
Prescribed NOACs for AF prior to stroke
Prescribed warfarin for AF prior to stroke
On warfarin for AF prior tostroke, with INR 2–3 on admission
N % N % N % N % N % N %
Ischaemic (n=3659) 1109 30.3% 703 63.4% 572 81.4% 366 64.0% 96 16.8% 25 26.0%
Haemorrhagic (n=616) 148 24.0% 129 87.2% 122 94.6% 86 70.5% 20 16.4% 6 30.0%
FIGURE 6.8: SECONDARY PREVENTION TREATMENT FOR ATRIAL FIBRILLATION IN PATIENTS WITH ISCHAEMIC STROKE (n=1109)
N %
Yes 823 74.2%
No 188 17.0%
Unknown 98 8.8%
Total 1109 100.0%
FIGURE 6.9: PATIENTS WITH A STROKE DIAGNOSED WITH CAROTID STENOSIS (N=4275)
N %
Yes 325 7.6%
No 3482 81.5%
Unknown 468 10.9%
Total 4275 100.0%
APPENDIX 3: FREQUENCY TABLES
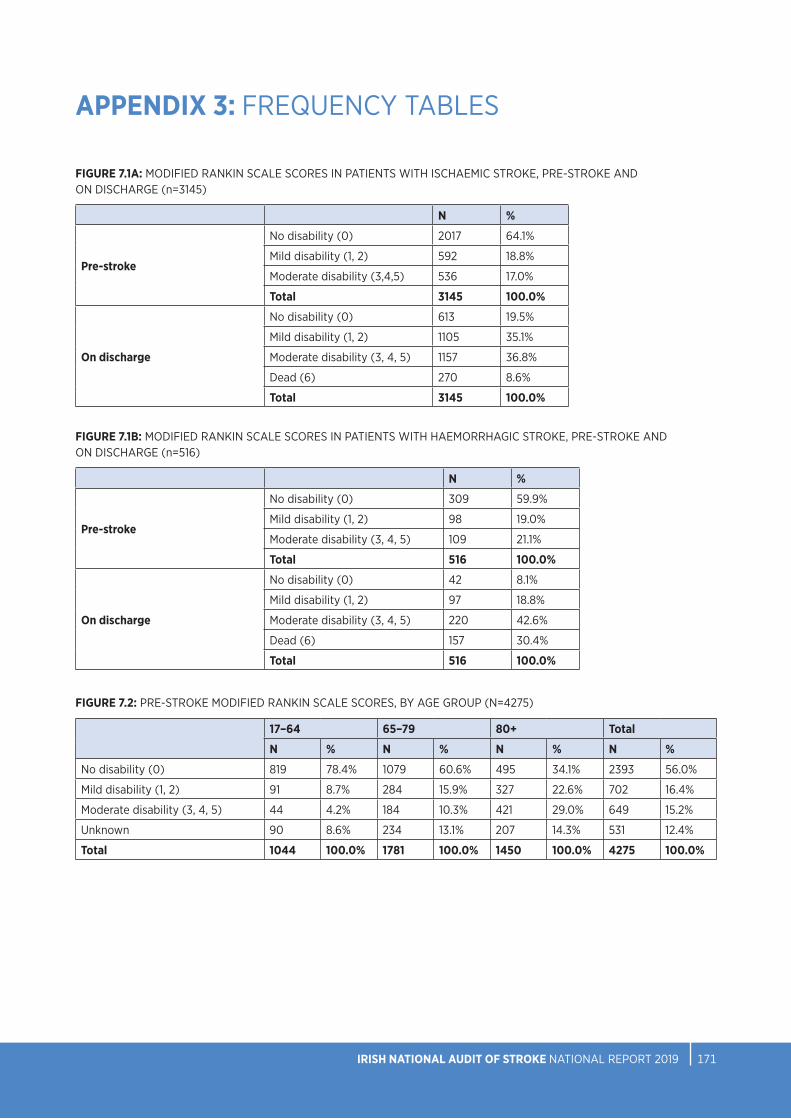
NOCA NATIONAL OFFICE OF CLINICAL AUDIT IRISH NATIONAL AUDIT OF STROKE NATIONAL REPORT 2019 171170
FIGURE 7.1A: MODIFIED RANKIN SCALE SCORES IN PATIENTS WITH ISCHAEMIC STROKE, PRE-STROKE AND ON DISCHARGE (n=3145)
N %
Pre-stroke
No disability (0) 2017 64.1%
Mild disability (1, 2) 592 18.8%
Moderate disability (3,4,5) 536 17.0%
Total 3145 100.0%
On discharge
No disability (0) 613 19.5%
Mild disability (1, 2) 1105 35.1%
Moderate disability (3, 4, 5) 1157 36.8%
Dead (6) 270 8.6%
Total 3145 100.0%
FIGURE 7.1B: MODIFIED RANKIN SCALE SCORES IN PATIENTS WITH HAEMORRHAGIC STROKE, PRE-STROKE AND ON DISCHARGE (n=516)
N %
Pre-stroke
No disability (0) 309 59.9%
Mild disability (1, 2) 98 19.0%
Moderate disability (3, 4, 5) 109 21.1%
Total 516 100.0%
On discharge
No disability (0) 42 8.1%
Mild disability (1, 2) 97 18.8%
Moderate disability (3, 4, 5) 220 42.6%
Dead (6) 157 30.4%
Total 516 100.0%
FIGURE 7.2: PRE-STROKE MODIFIED RANKIN SCALE SCORES, BY AGE GROUP (N=4275)
17–64 65–79 80+ Total
N % N % N % N %
No disability (0) 819 78.4% 1079 60.6% 495 34.1% 2393 56.0%
Mild disability (1, 2) 91 8.7% 284 15.9% 327 22.6% 702 16.4%
Moderate disability (3, 4, 5) 44 4.2% 184 10.3% 421 29.0% 649 15.2%
Unknown 90 8.6% 234 13.1% 207 14.3% 531 12.4%
Total 1044 100.0% 1781 100.0% 1450 100.0% 4275 100.0%
APPENDIX 3: FREQUENCY TABLES

NOCA NATIONAL OFFICE OF CLINICAL AUDIT IRISH NATIONAL AUDIT OF STROKE NATIONAL REPORT 2019 173172
APPENDIX 3: FREQUENCY TABLES
FIGURE 7.3: MEDIAN BED DAYS IN STROKE UNIT, BY HOSPITAL (n=3003)
N Median (days)
Percentile 25 (days)
Percentile 75 (days)
Bantry General Hospital 78 8 4 23
Beaumont Hospital 385 7 3 13
Cavan General Hospital 91 10 6 14
Connolly Hospital 133 6 4 15
Cork University Hospital 339 8 4 19
Mater Misericordiae University Hospital 212 7 4 15
Mayo University Hospital 183 11 6 19
Mercy University Hospital 67 7 3 13
Naas General Hospital 133 13 7 26
Our Lady of Lourdes Hospital Drogheda 132 11 5 21
Sligo University Hospital 166 8 4 14
South Tipperary General Hospital 70 16 7 33
St James’s Hospital 208 5 3 7
St Vincent’s University Hospital 269 13 7 23
Tallaght University Hospital 196 6 4 11
University Hospital Limerick 189 9 6 16
University Hospital Waterford 95 7 5 14
Wexford General Hospital 57 8 4 21
National 3003 8 4 16

NOCA NATIONAL OFFICE OF CLINICAL AUDIT IRISH NATIONAL AUDIT OF STROKE NATIONAL REPORT 2019 173172
APPENDIX 3: FREQUENCY TABLES
FIGURE 7.4: PERCENTAGE OF BED DAYS SPENT IN STROKE UNIT, BY HOSPITAL (N=57515)
Hospital stay (days) Stroke unit stay (days)
N N %
Bantry General Hospital 1675 1634 97.6%
Beaumont Hospital 7357 4986 67.8%
Cavan General Hospital 1187 1036 87.3%
Connolly Hospital 3445 2079 60.3%
Cork University Hospital 7154 6771 94.6%
Mater Misericordiae University Hospital 4371 2961 67.7%
Mayo University Hospital 3168 3002 94.8%
Mercy University Hospital 963 669 69.5%
Naas General Hospital 3488 2851 81.7%
Our Lady of Lourdes Hospital Drogheda 2376 2100 88.4%
Sligo University Hospital 1995 1893 94.9%
South Tipperary General Hospital 1638 1532 93.5%
St James’s Hospital 2535 1063 41.9%
St Vincent’s University Hospital 6273 5008 79.8%
Tallaght University Hospital 3236 1644 50.8%
University Hospital Limerick 3269 2638 80.7%
University Hospital Waterford 1899 1178 62.0%
Wexford General Hospital 1486 862 58.0%
National 57515 43907 76.3%
FIGURE 7.5: DISCHARGE DESTINATION OF PATIENTS WITH A STROKE (N=4275)
N %
Home 2192 51.3%
Discharge to off-site rehabilitation 591 13.8%
Patient died 508 11.9%
Discharge to long-term care 335 7.8%
Home with ESD 210 4.9%
Transfer to other hospital for ongoing stroke care 187 4.4%
Transfer to referring hospital 154 3.6%
Other 72 1.7%
Unknown 26 0.6%
Total 4275 100.0%

NOCA NATIONAL OFFICE OF CLINICAL AUDIT IRISH NATIONAL AUDIT OF STROKE NATIONAL REPORT 2019 175174
APPENDIX 3: FREQUENCY TABLES
FIGURE 7.6: CASES DISCHARGED HOME WITH EARLY SUPPORTED DISCHARGE, BY HOSPITAL (n=2110)
Number of cases
Early Supported Discharge
%
Beaumont Hospital 470 28 6.0%
Cork University Hospital/ Mercy University Hospital 579 56 9.7%
Mater Misericordiae University Hospital 306 50 16.3%
Tallaght University Hospital/ St James’s Hospital 485 36 7.4%
University Hospital Limerick 270 40 14.8%
Total 2110 210 10.0%
FIGURE 8.2: TIME FROM HOSPITAL ARRIVAL TO THERAPY ASSESSMENT, BY DISCIPLINE
Physiotherapy Occupational therapy Speech and language therapy
N % N % N %
Same day 256 16.0% 86 7.2% 164 16.5%
Next day 522 32.5% 293 24.5% 273 27.5%
2 days 181 11.3% 180 15.1% 109 11.0%
3–7 days 267 16.6% 322 27.0% 138 13.9%
8 days or more 30 1.9% 41 3.4% 24 2.4%
Unknown 348 21.7% 272 22.8% 285 28.7%
Total 1604 100.0% 1194 100.0% 993 100.0%
FIGURE 8.3: INTENSITY OF THERAPY, BY DISCIPLINE
Physiotherapy Occupational therapy Speech and language therapy
N % N % N %
Sufficient amount of therapy (80–100% ) 754 47.0% 393 32.9% 424 42.7%
Moderate amount of therapy (50–79%) 579 36.1% 519 43.5% 331 33.3%
Insufficient amount of therapy (<49%) 122 7.6% 237 19.8% 212 21.3%
Unknown 149 9.3% 45 3.8% 26 2.6%
Total 1604 100.0% 1194 100.0% 993 100.0%

NOCA NATIONAL OFFICE OF CLINICAL AUDIT IRISH NATIONAL AUDIT OF STROKE NATIONAL REPORT 2019 175174
APPENDIX 3: FREQUENCY TABLES
FIGURE 8.4: PHYSIOTHERAPY MOBILITY OUTCOMES (n=1443)
Pre-admission On discharge
N % N %
Independent, with no aid 1077 74.6% 672 46.6%
Independent, with aid 247 17.1% 211 14.6%
Supervision or assistance of one person, with or without aid
74 5.1% 247 17.1%
Transfer only with assistance 27 1.9% 113 7.8%
Hoist transfer 18 1.2% 112 7.8%
Died 88 6.1%
Total 1443 100.0% 1443 100.0%
FIGURE 8.5: PHYSIOTHERAPY CASES REQUIRING THE ASSISTANCE OF MORE THAN ONE THERAPIST/ THERAPY ASSISTANT (n=1604)
N %
Yes 419 26.1%
No 1062 66.2%
Unknown 123 7.7%
Total 1604 100.0%
FIGURE 8.6: PHYSIOTHERAPY ONWARD REFERRAL DESTINATION (n=1604)
N %
None 770 48.0%
Inpatient rehabilitation 313 19.5%
Community PT 145 9.0%
Other 122 7.6%
Unknown 117 7.3%
ESD 70 4.4%
Stroke-specific outpatient physiotherapy 41 2.6%
Day hospital 26 1.6%
Total 1604 100.0%

NOCA NATIONAL OFFICE OF CLINICAL AUDIT IRISH NATIONAL AUDIT OF STROKE NATIONAL REPORT 2019 177176
APPENDIX 3: FREQUENCY TABLES
FIGURE 8.7: OCCUPATIONAL THERAPY ACTIVITIES OF DAILY LIVING PRE- AND POST-STROKE (n=1133)
Pre-admission On discharge
N % N %
Independent 902 79.6% 486 42.9%
Indep with cues/aids 40 3.5% 75 6.6%
Required supervision or set-up 56 4.9% 141 12.4%
Required assistance 117 10.3% 261 23.0%
Dependent/full care 18 1.6% 118 10.4%
Died 52 4.6%
Total 1133 100.0% 1133 100.0%
FIGURE 8.8: OCCUPATIONAL THERAPY VISUAL FIELD ASSESSMENT (n=1194)
N %
Yes, using confrontation testing 754 63.1%
Yes, using both confrontation and perimetry testing 112 9.4%
Yes, using perimetry testing 27 2.3%
Attempted, but unable due to patient factors 129 10.8%
No 129 10.8%
Unknown 43 3.6%
Total 1194 100.0%
FIGURE 8.9: OCCUPATIONAL THERAPY PATIENT EDUCATION ON RETURNING TO WORK AND DRIVING
N %
Advice on driving
Yes 475 86.4%
No 43 7.8%
Unknown 32 5.8%
Total 550 100.0%
Advised about return to work
Yes 147 63.9%
No 28 12.2%
Onward referral made 35 15.2%
Unknown 20 8.7%
Total 230 100.0%

NOCA NATIONAL OFFICE OF CLINICAL AUDIT IRISH NATIONAL AUDIT OF STROKE NATIONAL REPORT 2019 177176
APPENDIX 3: FREQUENCY TABLES
FIGURE 8.10: OCCUPATIONAL THERAPY CASES REQUIRING THE ASSISTANCE OF MORE THAN ONE THERAPIST/THERAPY ASSISTANT (n=1194)
N %
Yes 292 24.5%
No 870 72.9%
Unknown 32 2.7%
Total 1194 100.0%
FIGURE 8.11: OCCUPATIONAL THERAPY ONWARD REFERRAL DESTINATION (n=612)
N %
Inpatient rehabilitation (off-site) 215 35.1%
Community OT 152 24.8%
ESD 126 20.6%
Other 119 19.4%
Total 612 100.0%
FIGURE 8.12: COMMUNICATION AND SWALLOW DIFFICULTIES IDENTIFIED BY SPEECH AND LANGUAGE THERAPISTS (n=845)
N %
Swallow difficulty
Yes 502 59.4%
No 321 38.0%
Unknown 22 2.6%
Total 845 100.0%
Dysarthria
Yes 426 50.4%
No 358 42.4%
Unknown 61 7.2%
Total 845 100.0%
Dyspraxia
Yes 67 7.9%
No 689 81.5%
Unknown 89 10.5%
Total 845 100.0%
Aphasia
Yes 342 40.5%
No 440 52.1%
Unknown 63 7.5%
Total 845 100.0%
Cognitive linguistic communication disorder
Yes 235 27.8%
No 491 58.1%
Unknown 119 14.1%
Total 845 100.0%
Voice difficulties
Yes 106 12.5%
No 661 78.2%
Unknown 78 9.2%
Total 845 100.0%

NOCA NATIONAL OFFICE OF CLINICAL AUDIT IRISH NATIONAL AUDIT OF STROKE NATIONAL REPORT 2019 179178
APPENDIX 3: FREQUENCY TABLES
FIGURE 8.13: SPEECH AND LANGUAGE THERAPY PRE- AND POST-STROKE COMMUNICATION ABILITY (n=934)
Pre-admission On discharge
N % N %
No difficulties 753 80.6% 265 28.4%
Mild: >80% effective communication; occasional breakdown in conversation 121 13.0% 318 34.0%
Moderate: 50–79% effective communication; frequent breakdown in conversation 46 4.9% 161 17.2%
Severe: Less than half (10–49%) of communication attempts are successful 13 1.4% 91 9.7%
Profound: No, or occasional (<10%), communication attempts are successful ~ * 25 2.7%
Died 74 7.9%
Total * * 934 100.0%
~ Denotes five cases or fewer* Further suppression required to prevent disclosure of five cases or fewer
FIGURE 8.14: SPEECH AND LANGUAGE THERAPY SWALLOW INVESTIGATIONS (n=993)
N %
Videofluoroscopy
Yes 107 10.8%
No 865 87.1%
Indicated but not available 5 0.5%
Unknown 16 1.6%
Total 993 100.0%
FEES
Yes 42 4.2%
No 926 93.3%
Indicated but not available 8 0.8%
Unknown 17 1.7%
Total 993 100.0%
FIGURE 8.15: SPEECH AND LANGUAGE THERAPY PRE- AND POST-STROKE MODIFIED DIET (n=948)
N %
Pre-admission
Yes 50 5.3%
No 898 94.7%
Total 948 100.0%
On discharge
Yes 247 26.1%
No 701 73.9%
Total 948 100.0%
~
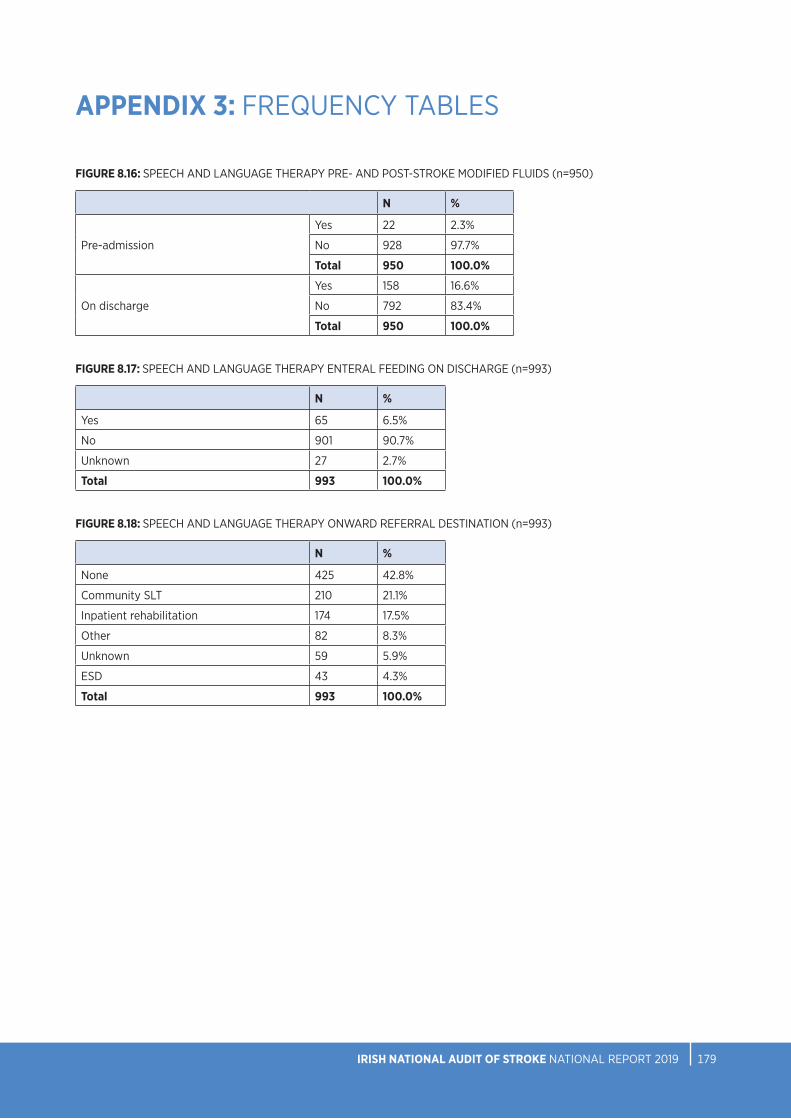
NOCA NATIONAL OFFICE OF CLINICAL AUDIT IRISH NATIONAL AUDIT OF STROKE NATIONAL REPORT 2019 179178
APPENDIX 3: FREQUENCY TABLES
FIGURE 8.16: SPEECH AND LANGUAGE THERAPY PRE- AND POST-STROKE MODIFIED FLUIDS (n=950)
N %
Pre-admission
Yes 22 2.3%
No 928 97.7%
Total 950 100.0%
On discharge
Yes 158 16.6%
No 792 83.4%
Total 950 100.0%
FIGURE 8.17: SPEECH AND LANGUAGE THERAPY ENTERAL FEEDING ON DISCHARGE (n=993)
N %
Yes 65 6.5%
No 901 90.7%
Unknown 27 2.7%
Total 993 100.0%
FIGURE 8.18: SPEECH AND LANGUAGE THERAPY ONWARD REFERRAL DESTINATION (n=993)
N %
None 425 42.8%
Community SLT 210 21.1%
Inpatient rehabilitation 174 17.5%
Other 82 8.3%
Unknown 59 5.9%
ESD 43 4.3%
Total 993 100.0%

NOCA NATIONAL OFFICE OF CLINICAL AUDIT IRISH NATIONAL AUDIT OF STROKE NATIONAL REPORT 2019 181180
NOTES

NOCA NATIONAL OFFICE OF CLINICAL AUDIT IRISH NATIONAL AUDIT OF STROKE NATIONAL REPORT 2019 181180
NOTES