irish national early warning system - assets.gov.ie
TRANSCRIPT

Irish National Early Warning System National Clinical Guideline No. 1 (Version 2)
Annex 1: Clinical & cost effectiveness of NEWS, A systematic review update

Published by:The Department of HealthBlock 1, Miesian Plaza, 50-58 Lower Baggott Street, Dublin 2, D02 XW14, Irelandwww.health.gov.ieISSN 2009-6259© Department of Health

This research was funded by the Health Research Board HRB-CICER-2016-1871.
Clinical and Cost-effectiveness of the National Early Warning System (NEWS): a Systematic Review Update The Irish National Early Warning System (NEWS) National Clinical Guideline No. 1
August 2019

Clinical & Cost-effectiveness of the National Early Warning System (NEWS): Systematic Review Update
Health Research Board – Collaboration in Ireland for Clinical Effectiveness Reviews
2
About HRB-CICER
In 2016, the Department of Health requested the Health Research Board (HRB) to fund a
dedicated multidisciplinary research group to support the activities of the Ministerial
appointed National Clinical Effectiveness Committee (NCEC). Called HRB-CICER
(Collaboration in Ireland for Clinical Effectiveness Reviews), a five-year contract (2017 to
2022) was awarded following a competitive process to the Health Information and Quality
Authority (HIQA). The HRB-CICER team comprises a dedicated multidisciplinary research
team (including expertise in health economics, qualitative and quantitative research
methods and epidemiology) supported by staff from the Health Technology Assessment
(HTA) team in HIQA and the HRB Centre for Primary Care Research at the Royal College of
Surgeons in Ireland (RCSI), as well as national and international clinical and methodological
experts.
Guideline development groups submit clinical guidelines for appraisal and endorsement by
the NCEC as National Clinical Guidelines. HRB-CICER provides independent scientific support
to guideline development groups tailored according to their specific needs. The main role of
the HRB-CICER team is to undertake systematic reviews of the clinical effectiveness and
cost-effectiveness of interventions included in the guidelines and to estimate the budget
impact of implementing the guidelines. Additional support can be provided by HRB-CICER to
guideline development groups including; providing tailored training sessions and working
closely with the guideline development groups to develop clinical questions and search
strategies; performing systematic reviews of international clinical guidelines; supporting the
assessment of their suitability for adaption to Ireland and assisting in the development of
evidence-based recommendations.

Clinical & Cost-effectiveness of the National Early Warning System (NEWS): Systematic Review Update
Health Research Board – Collaboration in Ireland for Clinical Effectiveness Reviews
3
Acknowledgements
The Health Research Board-Collaboration in Ireland for Clinical Effectiveness Reviews (HRB-
CICER) would like to thank all of the individuals who provided their time, advice and
information in supporting the development of this systematic review update.
Particular thanks are due to the following members of the Guideline Development Group
(GDG) below who provided advice and information.
The members of the GDG who provided support in the development of this report are:
Dr Miriam Bell Project Lead, National Early Warning System (NEWS) Guideline
Development, National Deteriorating Patient Improvement Programme
(DPIP), Clinical Design & Innovation, Health Service Executive (HSE)
Ms Avilene Casey National Lead, DPIP, Clinical Design & Innovation, HSE
Mr Brendan Leen Regional Librarian, HSE South.
Mr Richard Walsh Director of Nursing, National Acute Medicine Programme, Office of the
Nursing and Midwifery Services Director (ONMSD), Clinical Design &
Innovation, HSE
Membership of the evaluation team
Members of the HRB-CICER Evaluation Team were Dr Sinéad O’Neill (Project Lead), Dr
Barbara Clyne, Ms Michelle O’Neill, Ms Karen Jordan, Mr Paul Carty, Mr Barrie Tyner, Ms
Mahdiye Phillips, Mr James Larkin, Prof Susan Smith and Dr Máirín Ryan.

Clinical & Cost-effectiveness of the National Early Warning System (NEWS): Systematic Review Update
Health Research Board – Collaboration in Ireland for Clinical Effectiveness Reviews
4
Table of Contents
ABOUT HRB-CICER ........................................................................................................................................... 2
ACKNOWLEDGEMENTS .................................................................................................................................... 3
MEMBERSHIP OF THE EVALUATION TEAM ....................................................................................................... 3
LIST OF TABLES .............................................................................................................................................. 12
LIST OF ABBREVIATIONS ................................................................................................................................ 16
EXECUTIVE SUMMARY ................................................................................................................................... 18
1 INTRODUCTION ..................................................................................................................................... 26
1.1 DESCRIPTION OF THE CONDITION ................................................................................................................. 26
1.2 DESCRIPTION OF THE INTERVENTION ............................................................................................................ 26
1.3 THE PURPOSE OF THIS REVIEW .................................................................................................................... 28
2 METHODS .............................................................................................................................................. 32
2.1 CRITERIA FOR INCLUDING STUDIES WITHIN THIS REVIEW ................................................................................... 32
2.1.1 Search Process ................................................................................................................................ 32
2.1.2 Types of participants, interventions, comparisons, outcomes and study design ............................ 33
2.1.3 Types of setting ............................................................................................................................... 36
2.2 SEARCH METHODS FOR IDENTIFICATION OF STUDIES ........................................................................................ 36
2.2.1 Clinical and economic literature ..................................................................................................... 36
2.2.2 Other sources .................................................................................................................................. 37
2.3 INCLUSION AND EXCLUSION CRITERIA ............................................................................................................ 38
2.4 DATA COLLECTION AND ANALYSIS ................................................................................................................ 40
2.4.1 Selection of studies ......................................................................................................................... 40
2.4.2 Data extraction and management .................................................................................................. 40
2.4.3 Assessment of methodological limitations and risk of bias ............................................................ 41
2.5 DATA SYNTHESIS ...................................................................................................................................... 43
2.6 ASSESSING THE CERTAINTY OF THE BODY OF EVIDENCE USING THE GRADE APPROACH ........................................... 44
3 RESULTS ................................................................................................................................................ 46
3.1 SEARCH RESULTS FOR ALL REVIEW QUESTIONS ................................................................................................ 46
3.2 PRESENTATION OF RESULTS ACCORDING TO REVIEW QUESTION .......................................................................... 47

Clinical & Cost-effectiveness of the National Early Warning System (NEWS): Systematic Review Update
Health Research Board – Collaboration in Ireland for Clinical Effectiveness Reviews
5
4 RESULTS: A DESCRIPTION OF EARLY WARNING SYSTEMS CURRENTLY IN USE FOR THE DETECTION OF
PHYSIOLOGICAL DETERIORATION IN ADULT (NON-PREGNANT) PATIENTS IN ACUTE HEALTH CARE SETTINGS
………………………………………………………………………………………………………………………………………………..49
4.1 CHAPTER OVERVIEW ................................................................................................................................. 49
4.2 CHARACTERISTICS OF INCLUDED STUDIES ....................................................................................................... 49
4.2.1 Study Country .................................................................................................................................. 49
4.2.2 Early Warning Systems ................................................................................................................... 49
4.2.3 Early Warning System Chart Design ............................................................................................... 52
4.2.4 Number and type of vital sign parameters reported ...................................................................... 52
4.2.5 Paper-based or electronic EWSs ..................................................................................................... 52
4.2.6 Frequency of recording of vital signs .............................................................................................. 53
4.2.7 Aggregate EWSs ............................................................................................................................. 53
4.3 SUMMARY .............................................................................................................................................. 71
5 RESULTS: THE IMPACT ON PATIENT OUTCOMES AND RESOURCE UTILISATION OF EARLY WARNING
SYSTEMS INTERVENTIONS FOR THE DETECTION OF PHYSIOLOGICAL DETERIORATION IN ADULT (NON-
PREGNANT) PATIENTS IN ACUTE HEALTH CARE SETTINGS ............................................................................. 72
5.1 CHAPTER OVERVIEW ................................................................................................................................. 72
5.2 OVERVIEW OF STUDIES FOCUSING ON THE EFFECTIVENESS OF EWSS ................................................................... 72
5.3 OVERVIEW OF THE EARLY WARNING SYSTEMS INTERVENTIONS ........................................................................... 72
5.4 PRIMARY OUTCOMES ................................................................................................................................ 73
5.4.1 Mortality ......................................................................................................................................... 73
5.4.2 Cardiac arrest .................................................................................................................................. 76
5.4.3 Length of Stay (LOS) ........................................................................................................................ 77
5.4.4 Transfer or admission to the intensive care unit (ICU) .................................................................... 78
5.5 SECONDARY OUTCOMES ............................................................................................................................ 80
5.5.1 Clinical deterioration in sub-populations ........................................................................................ 80
5.5.2 Patient reported outcome measures (PROMS) ............................................................................... 80
5.5.3 Post-hoc identified outcomes .......................................................................................................... 80
5.5.3.1 Serious adverse events (SAEs)................................................................................................................ 81
5.5.3.2 Compliance with Early Warning Systems ............................................................................................... 82
5.5.3.3 Resource utilisation................................................................................................................................ 83
5.5.3.4 Survival to discharge .............................................................................................................................. 84
5.5.3.5 Deterioration (EWS ≥2) at 24 hours ....................................................................................................... 85
Clinical & Cost-effectiveness of the National Early Warning System (NEWS): Systematic Review Update
Health Research Board – Collaboration in Ireland for Clinical Effectiveness Reviews
6
5.5.3.6 Palliative care measures ........................................................................................................................ 85
5.6 METHODOLOGICAL QUALITY ....................................................................................................................... 97
5.6.1 RCTs ................................................................................................................................................ 97
5.6.2 Non-RCTs ......................................................................................................................................... 99
5.6.2.1 nRCT studies ......................................................................................................................................... 100
5.6.3 Observational (uncontrolled) studies ............................................................................................ 102
5.6.4 Interupted time series studies ....................................................................................................... 103
5.6.4.1 Before-after observational studies ...................................................................................................... 105
5.7 CERTAINTY OF THE EVIDENCE .................................................................................................................... 110
5.8 DISCUSSION .......................................................................................................................................... 112
5.9 CONCLUSION ......................................................................................................................................... 113
6 THE EFFECTIVENESS OF DIFFERENT EWS CHART DESIGNS (Q2) ............................................................ 114
6.1 CHAPTER OVERVIEW ............................................................................................................................... 114
6.2 EARLY WARNING SYSTEM CHART DESIGN ................................................................................................... 114
6.3 RESULTS FOR STUDIES FOCUSSING ON CHART DESIGN ..................................................................................... 114
6.3.1 ADDS-based chart design to measure novices ability to recognise clinical deterioration through
percentage errors and response time ........................................................................................................ 114
6.3.2 ADDS-based chart designs based on scoring rows ........................................................................ 115
6.3.3 ADDS-based chart design to measure HCPs ability to recognise clinical deterioration through
percentage errors and response time ........................................................................................................ 116
6.3.4 Chart designs for BP and HR ......................................................................................................... 117
6.3.5 Comparison of old chart (graphic depiction of observations) and new chart (EWS numerically
depicted observations) ............................................................................................................................... 119
6.4 METHODOLOGICAL QUALITY ..................................................................................................................... 125
6.4.1 RCTs .............................................................................................................................................. 125
6.4.2 Non-RCTs ....................................................................................................................................... 127
6.4.3 Observational studies ................................................................................................................... 130
6.5 DISCUSSION AND CONCLUSION .................................................................................................................. 132
7 RESULTS: THE PREDICTIVE VALUE IN TERMS OF PATIENT OUTCOMES AND RESOURCE UTILISATION OF
EWS INTERVENTIONS FOR THE DETECTION OF PHYSIOLOGICAL DETERIORATION IN ADULT (NON-PREGNANT)
PATIENTS IN ACUTE HEALTH CARE SETTINGS ............................................................................................... 134
7.1 CHAPTER OVERVIEW ............................................................................................................................... 134
7.2 OVERVIEW OF STUDIES FOCUSSING ON THE PREDICTIVE ABILITY OF EWSS .......................................................... 134
Clinical & Cost-effectiveness of the National Early Warning System (NEWS): Systematic Review Update
Health Research Board – Collaboration in Ireland for Clinical Effectiveness Reviews
7
7.3 OVERVIEW OF EWSS INCLUDED ................................................................................................................ 134
7.4 PRIMARY OUTCOMES .............................................................................................................................. 135
7.4.1 Mortality ....................................................................................................................................... 135
7.4.2 Cardiac arrest ................................................................................................................................ 144
7.4.3 LOS ................................................................................................................................................ 148
7.4.4 Transfer or admission to the ICU .................................................................................................. 148
7.5 SECONDARY OUTCOMES .......................................................................................................................... 153
7.5.1 Clinical deterioration in sub-populations ...................................................................................... 153
7.5.2 PROMS .......................................................................................................................................... 157
7.5.3 Post-hoc identified outcomes ........................................................................................................ 157
7.5.3.1 Composite outcome of SAEs ................................................................................................................ 157
7.5.3.2 Acute heart failure ............................................................................................................................... 163
7.5.3.3 Hospital-acquired Acute Kidney Injury (AKI) ........................................................................................ 163
7.5.3.4 Total number of responses and interventions (including infusion prescription, change in medication
and ICU consultation) .............................................................................................................................................. 164
7.6 METHODOLOGICAL QUALITY ..................................................................................................................... 203
7.7 CERTAINTY OF THE EVIDENCE .................................................................................................................... 208
7.8 DISCUSSION .......................................................................................................................................... 210
7.9 CONCLUSION ......................................................................................................................................... 211
8 RESULTS: THE IMPACT OF EMERGENCY RESPONSE SYSTEM INTERVENTIONS ON PATIENT OUTCOMES
AND RESOURCE UTILISATION FOR THE DETECTION OF PHYSIOLOGICAL DETERIORATION IN ADULT (NON-
PREGNANT) PATIENTS IN ACUTE HEALTH CARE SETTINGS. .......................................................................... 213
8.1 CHAPTER OVERVIEW ............................................................................................................................... 213
8.2 OVERVIEW OF STUDIES FOCUSSING ON THE EFFECTIVENESS OF EMERGENCY RESPONSE SYSTEMS ............................. 213
8.3 OVERVIEW OF EMERGENCY RESPONSE SYSTEMS INCLUDED .............................................................................. 214
8.3.1 Doctor-led emergency response systems ...................................................................................... 214
8.3.2 Nurse-led emergency response system ......................................................................................... 217
8.3.3 Composite of emergency response systems ................................................................................. 220
8.4 PRIMARY OUTCOMES .............................................................................................................................. 221
8.4.1 Mortality ....................................................................................................................................... 221
8.4.2 Cardiac arrest ................................................................................................................................ 225
8.4.3 Length of stay (LOS) ...................................................................................................................... 227
8.4.4 Transfer or admission to the ICU .................................................................................................. 229
8.5 SECONDARY OUTCOMES .......................................................................................................................... 231

Clinical & Cost-effectiveness of the National Early Warning System (NEWS): Systematic Review Update
Health Research Board – Collaboration in Ireland for Clinical Effectiveness Reviews
8
8.5.1 Clinical deterioration in sub-populations ...................................................................................... 231
8.5.2 Patient Reported Outcome Measures (PROMs) ............................................................................ 232
8.5.3 Post-hoc identified outcomes ........................................................................................................ 232
8.5.3.1 Composite Outcomes ........................................................................................................................... 232
8.5.3.2 Resource utilisation (number of code blue calls or RRT calls) .............................................................. 233
8.5.3.3 Other objective patient-related positive and negative outcomes ....................................................... 235
8.6 METHODOLOGICAL QUALITY ..................................................................................................................... 253
8.6.1 Interrupted time series studies ..................................................................................................... 253
8.6.2 Before-after studies ...................................................................................................................... 255
8.7 CERTAINTY OF THE EVIDENCE .................................................................................................................... 261
8.8 DISCUSSION .......................................................................................................................................... 263
8.9 CONCLUSION ......................................................................................................................................... 263
9 RESULTS: EFFECTIVENESS OF EWS EDUCATIONAL INTERVENTIONS FOR THE IDENTIFICATION OF
PHYSIOLOGICAL DETERIORATION IN ADULT (NON-PREGNANT) PATIENTS IN ACUTE HEALTH CARE SETTINGS
(Q3) ………………………………………………………………………………………………………………………………………………..265
9.1 CHAPTER OVERVIEW ............................................................................................................................... 265
9.2 CHARACTERISTICS OF INCLUDED STUDIES ..................................................................................................... 265
9.3 FINDINGS.............................................................................................................................................. 272
9.3.1 Primary outcomes ......................................................................................................................... 272
9.3.1.1 Increase in knowledge and performance ............................................................................................. 272
9.3.1.1.1 Knowledge ....................................................................................................................................... 272
9.3.1.1.2 Performance and confidence .......................................................................................................... 273
9.3.1.2 Effect on patient outcomes .................................................................................................................. 274
9.3.1.3 Improved patient rescue strategies ..................................................................................................... 276
9.3.2 Secondary outcomes ..................................................................................................................... 277
9.3.2.1 Improved documentation of patient observations .............................................................................. 277
9.3.2.2 Improved compliance .......................................................................................................................... 279
9.3.3 Other post-hoc identified outcomes ............................................................................................. 280
9.3.3.1 Communication, collaboration and perception ................................................................................... 280
9.4 METHODOLOGICAL QUALITY ..................................................................................................................... 282
9.4.1 RCTs .............................................................................................................................................. 282
9.4.1.1 Allocation ............................................................................................................................................. 283
9.4.1.2 Blinding participants and personnel (performance bias) ..................................................................... 283
9.4.1.3 Detection bias ...................................................................................................................................... 284
9.4.1.4 Incomplete outcome data .................................................................................................................... 284

Clinical & Cost-effectiveness of the National Early Warning System (NEWS): Systematic Review Update
Health Research Board – Collaboration in Ireland for Clinical Effectiveness Reviews
9
9.4.1.5 Selective reporting ............................................................................................................................... 284
9.4.1.6 Other potential sources of bias ............................................................................................................ 284
9.4.2 Non-RCTs and Interrupted Time Series Studies ............................................................................. 285
9.4.2.1 nRCT study ........................................................................................................................................... 285
9.4.2.2 ITS study ............................................................................................................................................... 286
9.4.3 Observational studies uncontrolled before and after studies ....................................................... 288
9.5 CERTAINTY OF THE EVIDENCE .................................................................................................................... 291
9.6 DISCUSSION .......................................................................................................................................... 293
9.7 CONCLUSION ......................................................................................................................................... 294
10 FINDINGS FROM THE ECONOMIC LITERATURE ON THE IMPLEMENTATION OF EWSS OR TRACK AND
TRIGGER SYSTEMS FOR THE DETECTION OF ACUTE PHYSIOLOGICAL DETERIORATION IN ADULT (NON-
PREGNANT) PATIENTS IN ACUTE HEALTH CARE SETTINGS. .......................................................................... 295
10.1 CHAPTER OVERVIEW ............................................................................................................................... 295
10.2 CHARACTERISTICS OF THE ECONOMIC STUDIES INCLUDED IN THE REVIEW ........................................................... 295
10.3 RESULTS ............................................................................................................................................... 296
10.3.1 HIQA 2015 Health Technology Assessment of the implementation of an electronic EWS ....... 296
10.3.2 NCEC 2013 NEWS NCG No.1 ..................................................................................................... 297
10.3.3 Simmes 2014 Implementation of a RRS .................................................................................... 298
10.4 METHODOLOGICAL QUALITY AND TRANSFERABILITY ....................................................................................... 301
10.4.1 CHEC-list quality appraisal........................................................................................................ 301
10.4.2 ISPOR transferability tool ......................................................................................................... 301
10.5 DISCUSSION .......................................................................................................................................... 305
10.6 CONCLUSION ......................................................................................................................................... 305
11 COMPARISON OF THE EFFECTIVENESS OF MODIFIED EWSS (E.G. CREWS) TO THE NEWS FOR THE
DETECTION OF ACUTE PHYSIOLOGICAL DETERIORATION IN SPECIFIC ADULT SUBPOPULATIONS IN ACUTE
HEALTH CARE SETTINGS ............................................................................................................................... 306
11.1 CHAPTER OVERVIEW ............................................................................................................................... 306
11.2 CHARACTERISTICS OF INCLUDED STUDIES ..................................................................................................... 306
11.3 PRIMARY OUTCOMES .............................................................................................................................. 311
11.3.1 Mortality ................................................................................................................................... 311
11.3.2 Cardiac arrest ........................................................................................................................... 312
11.3.3 Length of stay ........................................................................................................................... 312
11.3.4 Transfer or admission to the intensive care unit ...................................................................... 312

Clinical & Cost-effectiveness of the National Early Warning System (NEWS): Systematic Review Update
Health Research Board – Collaboration in Ireland for Clinical Effectiveness Reviews
10
11.4 SECONDARY OUTCOMES .......................................................................................................................... 312
11.4.1 Clinical deterioration in a sub-population ................................................................................ 312
11.4.2 Patient reported outcome measures ........................................................................................ 312
11.4.3 Post-hoc identified outcomes ................................................................................................... 313
11.4.3.1 Serious adverse events (SAEs).............................................................................................................. 313
11.5 METHODOLOGICAL QUALITY ..................................................................................................................... 313
11.6 CERTAINTY OF THE EVIDENCE .................................................................................................................... 315
11.7 DISCUSSION .......................................................................................................................................... 317
11.8 CONCLUSION ......................................................................................................................................... 317
12 WHY DO HEALTH CARE PROFESSIONALS FAIL TO ESCALATE AS PER THE NEWS PROTOCOL: A THEMATIC
ANALYSIS ..................................................................................................................................................... 318
12.1 CHAPTER OVERVIEW ............................................................................................................................... 318
12.2 CHARACTERISTICS OF INCLUDED STUDIES ..................................................................................................... 318
12.3 METHODOLOGY ..................................................................................................................................... 325
12.4 RESULTS ............................................................................................................................................... 325
12.5 SYNTHESIS OF RESULTS ............................................................................................................................ 327
12.5.1 Barriers to escalation ................................................................................................................ 327
12.5.2 Facilitators to escalation .......................................................................................................... 335
12.6 QUALITY APPRAISAL ................................................................................................................................ 343
12.7 CERTAINTY OF THE EVIDENCE .................................................................................................................... 346
12.8 DISCUSSION .......................................................................................................................................... 350
12.9 CONCLUSION ......................................................................................................................................... 351
13 OVERALL REVIEW DISCUSSION ............................................................................................................ 352
13.1 DISCUSSION .......................................................................................................................................... 352
13.2 STRENGTHS AND LIMITATIONS OF THIS SYSTEMATIC REVIEW ............................................................................ 354
13.3 RECOMMENDATIONS FOR FUTURE RESEARCH ............................................................................................... 355
13.4 CONCLUSION ......................................................................................................................................... 355
REFERENCES ................................................................................................................................................. 357
14 APPENDICES ........................................................................................................................................ 383
14.1 APPENDIX 1 NATIONAL EARLY WARNING SCORE (NEWS) PATIENT OBSERVATION CHART ................................... 383
14.2 APPENDIX 2 SEARCH STRATEGY FOR SYSTEMATIC REVIEW .............................................................................. 386
14.3 APPENDIX 3 GREY LITERATURE DATABASES SEARCHED .................................................................................. 389

Clinical & Cost-effectiveness of the National Early Warning System (NEWS): Systematic Review Update
Health Research Board – Collaboration in Ireland for Clinical Effectiveness Reviews
11
14.4 APPENDIX 4 STUDIES EXCLUDED AFTER FULL TEXT REVIEW .............................................................................. 392
14.5 APPENDIX 5 EWS WEIGHTINGS AND SCORES ACCORDING TO STUDY ................................................................. 393
14.6 APPENDIX 6: FINDINGS OF THE STUDIES INCLUDED IN Q3 (EDUCATIONAL INTERVENTIONS) ................................... 402
14.7 APPENDIX 7 GRADE CERQUAL QUALITATIVE EVIDENCE PROFILE ................................................................... 410
14.8 APPENDIX 8 DEVIATIONS FROM THE SYSTEMATIC REVIEW PROTOCOL ................................................................ 413

Clinical & Cost-effectiveness of the National Early Warning System (NEWS): Systematic Review Update
Health Research Board – Collaboration in Ireland for Clinical Effectiveness Reviews
12
List of Tables
Table 2.1 Specific PICOS for Review Question 1 .................................................................... 33
Table 2.2 Specific PICOS for Review Question 2 .................................................................... 34
Table 2.3 Specific PICOS for Review Question 3 .................................................................... 34
Table 2.4 Specific PICOS for Review Question 4 .................................................................... 35
Table 2.5 Specific PICOS for Review Question 5 .................................................................... 35
Table 2.6 Specific PICOS for Review Question 6 .................................................................... 36
Table 2.7 Inclusion and exclusion criteria according to review question ............................. 39
Table 2.8 Critical Appraisal Instruments ................................................................................ 42
Table 4.1 Characteristics of EWSs currently in use for the detection of acute physiological
deterioration in adult (non-pregnant) patients in acute health care settings – one EWS
only studies .............................................................................................................................. 54
Table 4.2 Characteristics of EWSs currently in use for the detection of acute physiological
deterioration in adult (non-pregnant) patients in acute health care settings – two or more
EWSs ........................................................................................................................................ 61
Table 4.3 Characteristics of EWSs currently in use for the detection of acute physiological
deterioration in adult (non-pregnant) patients in acute health care settings – EWS chart
design-based interventions .................................................................................................... 68
Table 5.1 Studies of the impact of EWSs interventions on patient outcomes and resource
utilisation (Q2 Effectiveness of EWSs interventions) ............................................................ 86
Table 5.2 Quality assessment of interrupted time series studies on the effectiveness of
EWS interventions ................................................................................................................. 104
Table 5.3 Quality Assessment of before-and-after observational cohort studies on the
effectiveness of EWS interventions ...................................................................................... 106
Table 5.4 Summary of findings table for primary outcomes in the effectiveness of EWS
interventions (Q2) ................................................................................................................. 111
Table 6.1 The impact of EWS chart design-based interventions on patient outcomes (Q2
Effectiveness of EWS interventions) ..................................................................................... 120

Clinical & Cost-effectiveness of the National Early Warning System (NEWS): Systematic Review Update
Health Research Board – Collaboration in Ireland for Clinical Effectiveness Reviews
13
Table 7.1 Studies of the predictive value of EWSs scores (Q2 Effectiveness of EWSs
interventions) ........................................................................................................................ 165
Table 7.2 Summary of findings table for key outcomes in the predictive ability of EWS
interventions (Q2) ................................................................................................................. 209
Table 8.1 Studies of the impact of emergency response system interventions on patient
outcomes and resource utilisation ....................................................................................... 236
Table 8.2 Summary of findings table for key outcomes in the effectiveness of emergency
response systems .................................................................................................................. 262
Table 9.1 Characteristics of studies included in Q3 (Educational interventions) ............... 267
Table 9.2 Summary of finding table for the quality of the evidence .................................. 292
Table 10.1 Characteristics of studies included in the economic systematic review ........... 296
Table 10.2 Results of the economic studies included in the review ................................... 299
Table 10.3 CHEC-list quality appraisal of included economic studies ................................. 303
Table 10.4 ISPOR Transferability assessment of included economic studies ..................... 304
Table 11.1 Characteristics of EWSs (modified EWSs versus the NEWS) for the detection of
acute physiological deterioration in adults with chronic respiratory conditions in acute
health care settings ............................................................................................................... 307
Table 11.2 Comparison of the effectiveness of modified EWSs to the NEWS in adults with
chronic respiratory conditions sub-populations .................................................................. 308
Table 11.3 Summary of findings table for the comparison of the effectiveness of modified
EWSs to the NEWS in adults with chronic respiratory conditions ...................................... 316
Table 12.1 Characteristics of included qualitative studies on why healthcare professionals
fail to escalate as per the protocol ....................................................................................... 319
Table 12.2 Key themes of the barriers of escalation amongst healthcare professionals .. 331
Table 12.3 Key themes of the facilitators of escalation amongst healthcare professionals
................................................................................................................................................ 339
Table 12.4 Methodological quality of the included qualitative studies ............................. 345
Table 12.5 GRADE CERQual Summary of Qualitative Findings Table .................................. 348
Clinical & Cost-effectiveness of the National Early Warning System (NEWS): Systematic Review Update
Health Research Board – Collaboration in Ireland for Clinical Effectiveness Reviews
14
List of Figures
Figure 3.1 Study flow diagram for all six questions in the systematic review ...................... 48
Figure 5.1 Risk of bias summary for RCTs of EWS interventions and deterioration in adults
in acute health care ................................................................................................................. 97
Figure 5.2 Risk of bias graph for included RCTs of EWS interventions and deterioration in
adults in acute health care settings ........................................................................................ 99
Figure 5.3 Risk of bias summary for nRCTs of EWS interventions and deterioration in adults
in acute health care settings ................................................................................................. 100
Figure 5.4 Risk of bias graph for included nRCTs of EWS interventions and deterioration in
adults in acute health care settings ...................................................................................... 102
Figure 6.6.1. Risk of bias summary for RCTs of EWS chart design-based interventions .... 125
Figure 6.1.2 Risk of bias graphy for RCTs of EWS chart design-based interventions ......... 127
Figure 6.1.3 Risk of bias summary of nRCTs of EWS chart-based interventions ................ 127
Figure 6.1.4 Risk of bias graph of nRCTs of EWS chart-based interventions ...................... 130
Figure 7.1 Risk of bias summary of the predictive studies .................................................. 203
Figure 7.2 Risk of bias graph for studies of EWS interventions and deterioration in adults in
acute health care settings ..................................................................................................... 207
Figure 8.1 Risk of bias summary for ITS studies of EWS interventions and deterioration in
adults in acute health care settings ...................................................................................... 253
Figure 8.2 Risk of bias graph for included ITS studies of EWS interventions and
deterioration in adults in acute health care settings ........................................................... 255
Figure 9.1 Risk of bias summary for RCTs of educational interventions and deterioration in
adults in acute health care settings ...................................................................................... 282
Figure 9.2 Risk of bias graph for included RCTs of educational interventions and
deterioration in adults in acute health care settings ........................................................... 283
Figure 9.3 Risk of bias summary for nRCTs of educational interventions and deterioration
in adults in acute health care settings .................................................................................. 286
Clinical & Cost-effectiveness of the National Early Warning System (NEWS): Systematic Review Update
Health Research Board – Collaboration in Ireland for Clinical Effectiveness Reviews
15
Figure 9.4 Risk of bias graph for included nRCTs of educational interventions and
deterioration in adults in acute health care settings ........................................................... 286
Figure 9.5 Risk of bias summary for ITS studies of educational interventions and
deterioration in adults in acute health care settings ........................................................... 287
Figure 9.6 Risk of bias graph for included ITS studies of educational interventions and
deterioration in adults in acute health care settings ........................................................... 288
Figure 11.1 Risk of bias graph for the comparison of the effectiveness of modified EWSs to
the NEWS for detecting physiological deterioration in adults with chronic respiratory
conditions .............................................................................................................................. 313
Figure 11.2 Risk of bias summary for the comparison of the effectiveness of modified
EWSs to the NEWS for detecting physiological deterioration in adults with chronic
respiratory conditions ........................................................................................................... 315
Figure 12.1 Schematic representation of barriers and faciliatators to escalation associated
with each overarching theme and sub-theme ..................................................................... 326

Clinical & Cost-effectiveness of the National Early Warning System (NEWS): Systematic Review Update
Health Research Board – Collaboration in Ireland for Clinical Effectiveness Reviews
16
List of abbreviations ABCDE Airway, Breathing, Circulation, Disability, and Exposure AGREE Appraisal of Guidelines for Research and Evaluation ALERT Acute Life Threatening Early Recognition and Treatment AMSTAR A Measurement Tool to Assess Systematic Reviews
ASSIA Applied Social Sciences Index and Abstracts AUC Area under the receiver operating curve
AVPU Alert, Voice, Pain, Unconscious BP Blood Pressure CADTH Canadian Agency for Drugs and Technologies in Health CASP Critical Appraisal Skills Programme CBA Controlled Before and After Study CCCT Communication, Collaboration and Critical Thinking Quality Patient Outcomes Survey Tool CERQual Confidence in the Evidence from Reviews of Qualitative research CHEC-list The Consensus Health Economic Criteria - list CI Confidence Interval CINAHL Cumulative Index to Nursing and Allied Health Literature
COPD Chronic Obstructive Pulmonary Disorder
CREWS Chronic Respiratory Early Warning System
DNR Do Not Resuscitate
ED Emergency Department
eMEWS Electronic Modified Early Warning System
EMBASE Exerptamedica Database
EMEWS Emergency Medicine Early Warning System
ENTREQ Enhancing transparency in reporting the synthesis of qualitative research
EWS Early Warning System FIRST2ACT Feedback Incorporating Review and Simulation Techniques to Act on Clinical Trends GDG Guideline Development Group GIN Guidelines International Network HCP Health Care Professional HDI Human Development Index HDU High Dependency Unit HIQA Health Information and Quality Authority HMIC Health Management Information Center HR Heart Rate HRB Health Research Board HRB-CICER Health Research Board Collaboration in Ireland for Clinical Effectiveness Reviews HSE Health Service Executive HTA Health Technology Assessment
HYE Health Years Gained

Clinical & Cost-effectiveness of the National Early Warning System (NEWS): Systematic Review Update
Health Research Board – Collaboration in Ireland for Clinical Effectiveness Reviews
17
IMEWS Irish Maternity Early Warning System ISBAR Identify, Situation, Background, Assessment, Request ICER Incremental Cost Effectiveness Ratio
ICU Intensive Care Unit
ISPOR International Society for Pharmacoeconomics and Outcomes Research
ITS Interrupted Time Series design
LOS Length of Stay
LYG Life Years Gained
MCQ Multiple Choice Questionnaire
MEDLINE Medical Literature Analysis and Retrieval System Online
MET Medical Emergency Team
MEWS Modified Early Warning System
NCEC National Clinical Effectiveness Committee
NCG National Clinical Guideline
NEWS National Early Warning Score
NICE National Institute for Health and Clinical Excellence
nRCT Non Randomised Controlled Trial
PDSA Plan, Do, Study, Act Framework
PEWS Paediatric Early Warning System
PICOS Population Intervention Comparison Outcome Study Design
PRISMA Preferred Reporting Items for Systematic Reviews and Meta-Analyses
PROSPERO Prospective Register for Systematic Reviews Database
QALY Quality Adjusted Life Years
QIP Quality Improvement Project
QUADAS Quality Assessment of Diagnostic Accuracy
RAPIDS Rescuing a Patient in Deteriorating Situations
RCSI Royal College of Surgeons in Ireland
RCT Randomised Controlled Trials
RR Respiratory Rate
RRR Relative Risk Reduction
RRT Rapid Response Team
SAE Serious Adverse Event
SBAR Situation, Background, Assessment and Recommendation
SD Standard Deviation
SOF Summary of Findings
SpO2 Oxygen saturation
UCC University College Cork
VIEWS VitalPAC Early Warning Score

Clinical & Cost-effectiveness of the National Early Warning System (NEWS): Systematic Review Update
Health Research Board – Collaboration in Ireland for Clinical Effectiveness Reviews
18
Executive Summary
Background and objectives
The National Early Warning System (NEWS) is a bedside tool used for monitoring the
condition of adult (non-pregnant) patients in acute health care settings, to facilitate the
timely identification of physiological deterioration and prevent adverse patient outcomes
including death. The NEWS facilitates the timely assessment of, and response to the
deterioration of acutely ill patients by classifying the severity of a patient’s illness, providing
prompts and structured communications tools to escalate care following a definitive
escalation plan and appropriate response model. Detection is achieved through the use of a
colour-coded observation chart and the routine measurement of patient’s vital signs (blood
pressure, pulse, respirations etc.). With the NEWS, each vital sign is allocated a numerical
score from 0 to 3, plotted on a colour coded observation chart (a score of ‘0’ represents the
least risk and a score of ‘3’ represents the highest risk), the scores are then combined to
give the patient’s NEWS score. If a patient’s aggregate score exceeds the pre-defined NEWS
thresholds, an escalation of care should be initiated.
The NEWS was the first National Clinical Effectiveness Committee (NCEC) National Clinical
Guideline (NCG No. 1) introduced in 2013.(1) It was subsequently updated to include
additional practical guidance specific to sepsis management in 2014. An updated systematic
search of the clinical and cost-effectiveness literature specific to early warning systems
(EWSs) in adult patients was completed in 2015 by a team from University College Cork
(UCC).(2)
The aim of this current systematic review was to systematically search the literature to
inform the update of NCG No 1 based on six specific review questions. Four questions were
included in the previous review. There were two new questions, one focussed on modified
EWSs for use in specific sub-populations, and a qualitative question exploring why health
care professionals fail to escalate as per the NEWS protocol.

Clinical & Cost-effectiveness of the National Early Warning System (NEWS): Systematic Review Update
Health Research Board – Collaboration in Ireland for Clinical Effectiveness Reviews
19
Methods
A systematic review of the published and grey literature was conducted in February 2018
using a comprehensive list of search terms based on the specific population, intervention,
comparison and outcome (PICO) approach for each of the review’s six questions. The search
included 11 electronic databases, five grey literature databases and over 30 websites
relevant to clinical guidelines. Two review team members screened the titles and abstracts
in EndNote Reference Manager applying pre-defined inclusion exclusion criteria as well as
the full texts of any potentially eligible studies. Data extraction and quality appraisal using
various tools dependent on study design was also conducted by two review team members.
The certainty of the evidence overall was assessed using the GRADE approach. The findings
for each of the six review questions are presented in a narrative summary:
Review questions:
Q1: What EWSs and or track and trigger systems are currently in use? [Chapter 4]
Q2: How effective are the different EWSs in terms of improving key patient outcomes?
A: Effectiveness of EWSs (the afferent limb) [Chapter 5, Chapter 6]
B: Predictive ability of EWSs [Chapter 7]
C: Effectiveness of emergency response systems (the efferent limb) [Chapter 8]
Q3: What education programmes have been established to train healthcare professionals (HCPs) relating to the
implementation of EWSs or track and trigger systems and how effective are these? [Chapter 9]
Q4: What are the findings from the economic literature on cost-effectiveness, cost impact and resources involved
with the implementation of EWSs or track and trigger systems? [Chapter 10]
Q5: Are modified EWSs (e.g. CREWS) more effective than the NEWS in specific adult sub-populations? [Chapter
11]
Q6: Why do HCPs fail to escalate as per the NEWS escalation protocol? [Chapter 12]

Clinical & Cost-effectiveness of the National Early Warning System (NEWS): Systematic Review Update
Health Research Board – Collaboration in Ireland for Clinical Effectiveness Reviews
20
Results
Systematic search summary:
From 335 full texts assessed for eligibility, 154 studies were included in the review overall
(n=123 studies for Q1, n=26 for Q2a n=68 for Q2b, n=32 for Q2c, n=23 for Q3, n=3 for Q4,
n=4 for Q5 and n=18 for Q6). Note that some studies were included in more than one
review question.
Q1: Descriptive overview of early warning systems (EWSs) currently in use in adult non-
pregnant populations:
In total, 123 studies conducted across 22 different countries were eligible for inclusion in
this descriptive overview of EWSs. The EWSs varied with 47 different named EWSs included
(e.g. the NEWS, ViEWS, etc.), 13 unnamed EWSs, 23 studies which only include a single
criterion for activating the emergency response system and two studies which did not
provide details on the EWS included. The number and type of vital sign parameters included
varied with some EWSs having as little as two and one algorithm-based EWS including 398
parameters. The majority of the 123 studies included electronic rather than paper-based
EWSs, however in 44 studies it was not reported or it was not clear. Importantly, the
majority of the 123 studies did not report how often parameters were measured (n=83)
which can effect performance of an EWS, and where they did, it varied from study to study.
There were 71 studies which included one or more EWSs which consisted of aggregated
scores from vital signs where the weighting of these varied from study to study. The large
number of EWSs in the literature varied in many ways, making it difficult to compare the
systems.

Clinical & Cost-effectiveness of the National Early Warning System (NEWS): Systematic Review Update
Health Research Board – Collaboration in Ireland for Clinical Effectiveness Reviews
21
Q2: The effectiveness of early warning systems currently in use in adult non-pregnant
populations:
A: Effectiveness of EWSs (the afferent limb – recognition and escalation)
Twenty-one studies in total investigated the effectiveness of EWSs (afferent limb)
interventions. Of these, 13 studies (three RCTs, one nRCT, one ITS study and eight
observational studies) included the primary outcome mortality. Of the 13 studies, six studies
including 244,340 patients, found no reduction in mortality rates; one study reported an
increase in mortality; and seven studies reported a decrease in mortality as a result of use of
the EWSs. Seven studies (no RCTs identified) including 89,767 patients reported on cardiac
arrests. Of the seven studies four showed no change in the occurrence of cardiac arrest,
while three studies showed a significant reduction in cardiac arrest rates as a result of use of
the EWSs. In terms of length of stay (LOS), four out of the five studies (three RCTs, two
observational studies) including 24,146 patients in total, showed no change in mean or
median LOS as a result of EWSs. For the fourth primary outcome, ICU transfers or admission
rates, the findings were mixed. Ten studies (three RCTs, one nRCT, one ITS study and five
observational studies), including 79,893 patients reported this outcome. Of these, three
studies showed an improvement in ICU transfers or admission rates; six studies showed no
change; and one study reported a worsening in rates. The certainty of the evidence was
graded as very low overall across the primary outcomes.
B: Predictive ability of EWSs
In total, 68 studies measured the predictive ability of EWSs for a range of outcomes
including mortality, cardiac arrest, LOS and ICU transfers or admission. Thirty-three studies
examined predictive ability for mortality in 1,732,733 patients. AUCs ranged from 0.52
(Shock Index EWS) to 0.97 (NEWS EWS minus temperature). For cardiac arrest, 15 studies
including 1,605,574 patients in total compared the predictive ability of different EWSs. AUCs
ranged from 0.48 (MEWS) to 0.88 (newly developed 17-item cardiac arrest model including
vital signs and laboratory results). One study including 752 patients reported LOS and the

Clinical & Cost-effectiveness of the National Early Warning System (NEWS): Systematic Review Update
Health Research Board – Collaboration in Ireland for Clinical Effectiveness Reviews
22
AUC was 0.70 (for the Simple Clinical Score EWS). Twenty studies including 1,435,957
patients reported on predictive ability for ICU transfers or admission. AUCs ranged from
0.62 (SOFA) to 0.89 (MEWS with blood lactate added). The certainty of the evidence was
graded as very low overall across the primary outcomes.
Five studies focussed on the effectiveness of different paper based EWSs chart designs on
specific outcomes including response time (of study participants to recognise physiological
deterioration) and accuracy (of documentation and recognition of deterioration). These
studies looked at different components of EWSs chart design and found that even where a
significant effect was reported (in particular for response time), the difference was not
clinically significant. The included studies were of poor quality.
C: Effectiveness of emergency response systems (the efferent limb - response)
There were 32 studies which investigated the effectiveness of emergency response systems
(efferent limb) on mortality, cardiac arrest, LOS and ICU transfer or admission. Twenty-five
studies including 2,617,122 patients investigated the effect of various emergency response
systems on mortality. Fourteen out of the 25 studies showed a significant effect on
mortality after the emergency response system was introduced (13 showed a reduction and
one showed an increase in mortality). However, 11 studies showed no change in mortality
rates as a result of the emergency response system. Eighteen studies including 1,878,003
patients examined the effectiveness of EWSs on cardiac arrest. Twelve out the 18 studies
showed a significant reduction in cardiac arrests while six studies showed no change as a
result of the emergency response systems. LOS was included in seven studies with a total of
576,504 patients. Four out of seven studies found no reduction in the LOS and three out of
seven reported a significant reduction in mean or median LOS as a result of the emergency
response system. Fourteen studies including 1,284,311 patients examined the effectiveness
of EWSs on ICU transfer or admission. Five studies showed a significant effect on ICU
transfers or admissions (two showed a reduction and three showed an increase in ICU

Clinical & Cost-effectiveness of the National Early Warning System (NEWS): Systematic Review Update
Health Research Board – Collaboration in Ireland for Clinical Effectiveness Reviews
23
transfers or admissions). The certainty of the evidence overall was deemed to be very low
for these review primary outcomes.
Q3: The effectiveness of early warning system-based educational interventions in use in
adult non-pregnant populations:
Twenty-three studies investigated the effectiveness of EWS-based educational interventions
to improve the detection of physiological deterioration in adult (non-pregnant) patients.
These included seven RCTs, one non randomised control trial, fourteen before-and-after
studies, and one interrupted time series study. Evidence from the review suggests that at
least in the short term educational interventions (including mannequin- or virtual-based
simulation, validated programmes such as COMPASS® or FIRST2ACT, or hospital specific
programmes) succeed in increasing health care staff (predominantly nursing staff)
knowledge (eight studies with 755 participants), clinical performance and self-confidence to
recognise and manage a deteriorating patient (ten studies with 789 participants). The
evidence also shows improvements in the documentation of vital signs and the use of EWSs
post-educational intervention, but was mixed for the effect on patient outcomes including
ICU admission, length of stay and cardiac arrest. Communication (through the use of
standardised tools such as ISBAR, SBAR and ABCDE) between nurses and doctors in relaying
a deteriorating patient and escalation improved post-training in the majority of the 23
studies in the short term at least (i.e. immediately post-intervention). The certainty of the
evidence however was graded very low overall for the review’s primary outcomes.
Q4: The cost-effectiveness of early warning system-based interventions in use in adult
non-pregnant populations:
Three studies investigated the cost-effectiveness of EWSs interventions, which included one
health technology assessment (HTA) on the implementation of an electronic NEWS, one
budget impact analysis (BIA) as part of National Clinical Guideline (NCG) No. 1 (NEWS 2013)
and one costing study. Two studies were conducted in Ireland, and one in the Netherlands.
Clinical & Cost-effectiveness of the National Early Warning System (NEWS): Systematic Review Update
Health Research Board – Collaboration in Ireland for Clinical Effectiveness Reviews
24
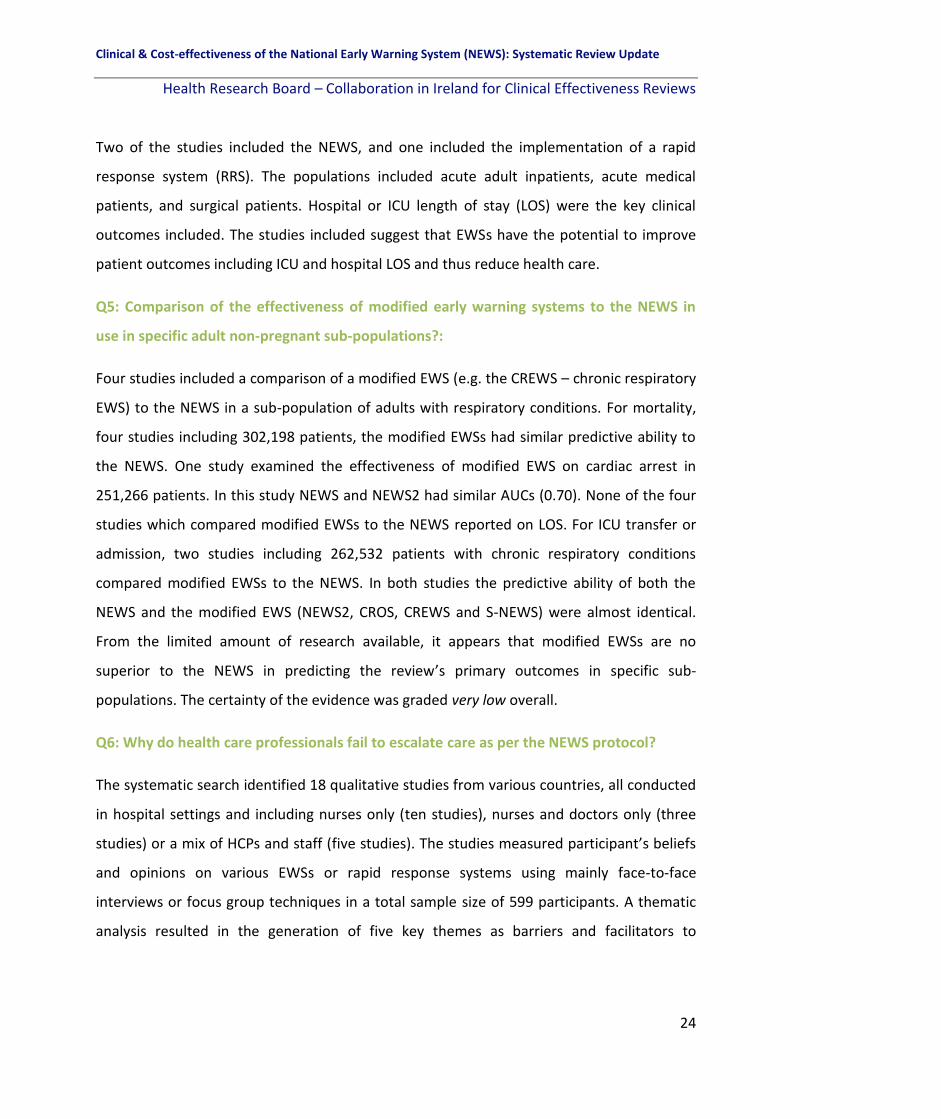
Two of the studies included the NEWS, and one included the implementation of a rapid
response system (RRS). The populations included acute adult inpatients, acute medical
patients, and surgical patients. Hospital or ICU length of stay (LOS) were the key clinical
outcomes included. The studies included suggest that EWSs have the potential to improve
patient outcomes including ICU and hospital LOS and thus reduce health care.
Q5: Comparison of the effectiveness of modified early warning systems to the NEWS in
use in specific adult non-pregnant sub-populations?:
Four studies included a comparison of a modified EWS (e.g. the CREWS – chronic respiratory
EWS) to the NEWS in a sub-population of adults with respiratory conditions. For mortality,
four studies including 302,198 patients, the modified EWSs had similar predictive ability to
the NEWS. One study examined the effectiveness of modified EWS on cardiac arrest in
251,266 patients. In this study NEWS and NEWS2 had similar AUCs (0.70). None of the four
studies which compared modified EWSs to the NEWS reported on LOS. For ICU transfer or
admission, two studies including 262,532 patients with chronic respiratory conditions
compared modified EWSs to the NEWS. In both studies the predictive ability of both the
NEWS and the modified EWS (NEWS2, CROS, CREWS and S-NEWS) were almost identical.
From the limited amount of research available, it appears that modified EWSs are no
superior to the NEWS in predicting the review’s primary outcomes in specific sub-
populations. The certainty of the evidence was graded very low overall.
Q6: Why do health care professionals fail to escalate care as per the NEWS protocol?
The systematic search identified 18 qualitative studies from various countries, all conducted
in hospital settings and including nurses only (ten studies), nurses and doctors only (three
studies) or a mix of HCPs and staff (five studies). The studies measured participant’s beliefs
and opinions on various EWSs or rapid response systems using mainly face-to-face
interviews or focus group techniques in a total sample size of 599 participants. A thematic
analysis resulted in the generation of five key themes as barriers and facilitators to

Clinical & Cost-effectiveness of the National Early Warning System (NEWS): Systematic Review Update
Health Research Board – Collaboration in Ireland for Clinical Effectiveness Reviews
25
escalation: Governance, RRT Response, Professional Boundaries, Clinical Experience and
Early Warning Systems Parameters. Within these five themes, 22 sub-themes with multiple
interdependencies were identified. The certainty of the evidence using the GRADE CERQual
approach was judged to be moderate overall.
Conclusions:
A large number of EWSs have been developed internationally and are currently in use in
adult (non-pregnant) populations to assist in the detection of physiological deterioration at
the bedside. This review included 154 studies with 47 different named EWSs, which
investigated the clinical and cost-effectiveness of EWSs on patient outcomes, the predictive
performance of EWSs as well as qualitative studies on why health care professionals fail to
escalate.
The methodological quality of these studies overall was poor and there was a high risk of
bias, owing to significant heterogeneity in the interventions and populations studied. There
was very low certainty in the evidence overall across the review’s primary outcomes. While
studies included in this review demonstrate considerable heterogeneity a clear trend and
direction of findings is evident which supports the use of EWSs for the early recognition,
escalation and response to clinical deterioration in adult patients in the acute hospital
setting. Further research is warranted of a high methodological quality using standardised
definitions of primary outcomes, assessing similar interventions in similar populations in
order to measure the impact of the NEWS on patient outcomes. Research in the Irish setting
is imperative.

Clinical & Cost-effectiveness of the National Early Warning System (NEWS): Systematic Review Update
Health Research Board – Collaboration in Ireland for Clinical Effectiveness Reviews
26
1 Introduction
1.1 Description of the condition
Acute physiological deterioration is a time-crucial medical emergency and failure to detect
and treat patient deterioration in a timely manner poses a threat to patient safety, which
may lead to adverse patient outcomes.(6) Deterioration of a patient’s condition in hospital is
frequently preceded by measurable physiological abnormalities. Regular measurement and
documentation of physiological parameters is an essential requirement for recognising
clinical deterioration.(7) Early recognition of clinical deterioration, followed by prompt and
effective action, can minimise the occurrence of adverse events such as cardiac arrest,(8) and
may mean that a lower level of intervention is required to stabilise a patient.
Health care organisations adopt a multi-faceted approach including four main categories of
interventions to detect and manage deteriorating patients more effectively (rapid response
teams [RRTs]/medical emergency teams [METs], early warning scores [EWS], education
programmes for health care staff, and standardised approaches to patient handover).(9) The
overarching aim of these interventions is to facilitate early detection of deterioration by
categorising an adult patient’s severity of illness and prompting escalation of care as
appropriate.
1.2 Description of the intervention
Traditionally, early warning systems have come in two primary configurations: single
parameter criteria and aggregated weighted scores. The former originated in Australia over
two decades ago as a set of equally weighted abnormal physiologic thresholds (e.g.,
respiratory rate >36), the presence of any of which would trigger the system. In contrast,
aggregated weighted scoring systems, involve summing up points from multiple parameters
based on the degree of derangement (e.g., two points for a respiratory rate of 21–29 and
three points for ≥30).(10)
Clinical & Cost-effectiveness of the National Early Warning System (NEWS): Systematic Review Update
Health Research Board – Collaboration in Ireland for Clinical Effectiveness Reviews
27
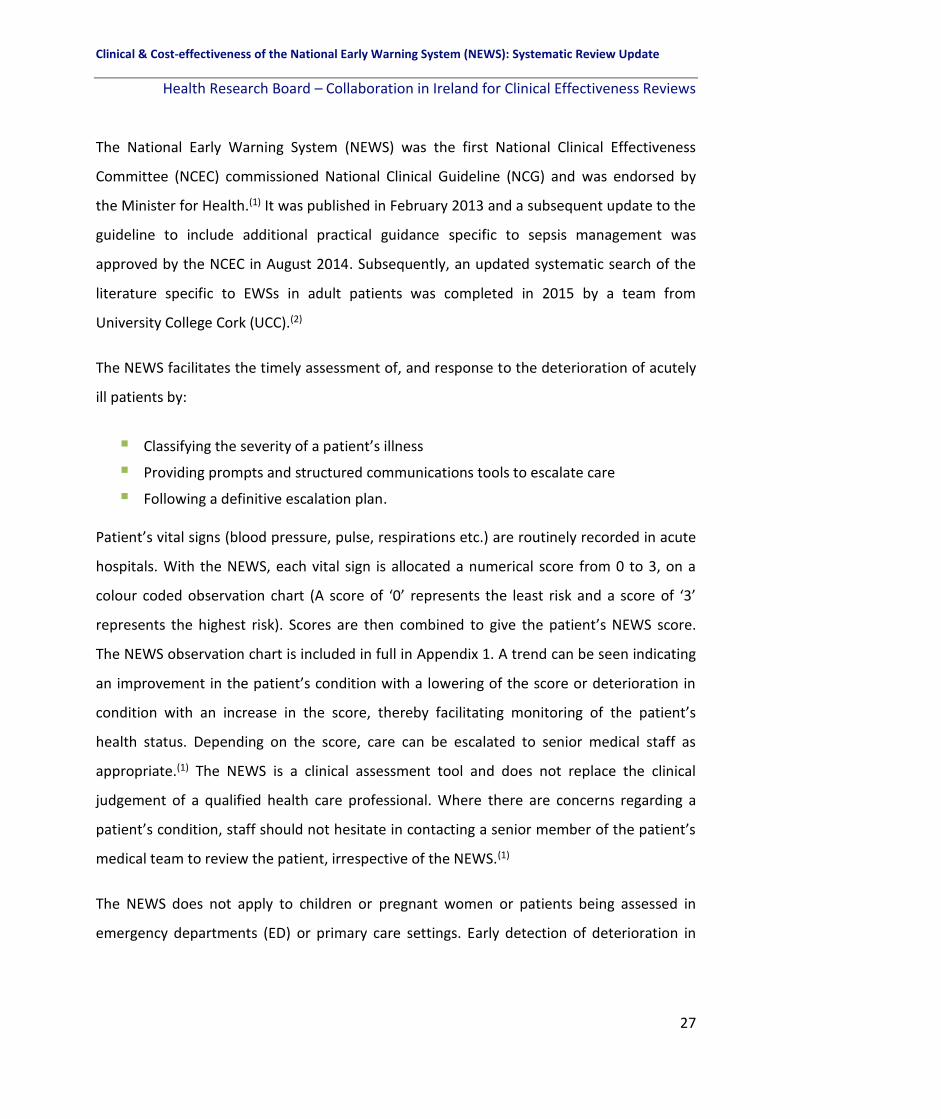
The National Early Warning System (NEWS) was the first National Clinical Effectiveness
Committee (NCEC) commissioned National Clinical Guideline (NCG) and was endorsed by
the Minister for Health.(1) It was published in February 2013 and a subsequent update to the
guideline to include additional practical guidance specific to sepsis management was
approved by the NCEC in August 2014. Subsequently, an updated systematic search of the
literature specific to EWSs in adult patients was completed in 2015 by a team from
University College Cork (UCC).(2)
The NEWS facilitates the timely assessment of, and response to the deterioration of acutely
ill patients by:
▪ Classifying the severity of a patient’s illness
▪ Providing prompts and structured communications tools to escalate care
▪ Following a definitive escalation plan.
Patient’s vital signs (blood pressure, pulse, respirations etc.) are routinely recorded in acute
hospitals. With the NEWS, each vital sign is allocated a numerical score from 0 to 3, on a
colour coded observation chart (A score of ‘0’ represents the least risk and a score of ‘3’
represents the highest risk). Scores are then combined to give the patient’s NEWS score.
The NEWS observation chart is included in full in Appendix 1. A trend can be seen indicating
an improvement in the patient’s condition with a lowering of the score or deterioration in
condition with an increase in the score, thereby facilitating monitoring of the patient’s
health status. Depending on the score, care can be escalated to senior medical staff as
appropriate.(1) The NEWS is a clinical assessment tool and does not replace the clinical
judgement of a qualified health care professional. Where there are concerns regarding a
patient’s condition, staff should not hesitate in contacting a senior member of the patient’s
medical team to review the patient, irrespective of the NEWS.(1)
The NEWS does not apply to children or pregnant women or patients being assessed in
emergency departments (ED) or primary care settings. Early detection of deterioration in

Clinical & Cost-effectiveness of the National Early Warning System (NEWS): Systematic Review Update
Health Research Board – Collaboration in Ireland for Clinical Effectiveness Reviews
28
these groups of patients is identified by different physiological parameters and signs to
those of adult patients admitted to acute hospitals. For example, the Paediatric Early
Warning System (PEWS)(11) and the Irish Maternity Early Warning System (IMEWS)(12) were
developed for these specific clinical groups and the Emergency Medicine Early Warning
System (EMEWS) for use in EDs is currently in development.
1.3 The purpose of this review
The NEWS NCG (No. 1) relates to the situation in an acute health care setting, where an
adult patient’s physiological condition is deteriorating. The NCG focuses on ensuring that a
‘track and trigger’ system is in place for adult patients whose condition is deteriorating, and
outlines the clinical processes and organisational supports required to implement this
guideline. The aim of this review is to update a systematic review of the clinical and
economic literature on EWSs (also known as track and trigger systems) used in adult (non-
pregnant) patients in acute health care settings for the detection or timely identification of
clinical deterioration, with a particular focus on the NEWS. Any changes in the totality of the
evidence on the NEWS for use in the assessment of adult patients in the acute health care
setting will be used to inform the update to this NCG.
The proposed review questions for this update fall under the remit of two overarching
categories as per the NCG:(1)
1. CLINICAL PROCESSES
▪ Measurement and documentation of observations
▪ Escalation of care
▪ Emergency Response Systems
▪ Clinical communication
2. ORGANISATIONAL PROCESSES
▪ Organisational supports
▪ Education

Clinical & Cost-effectiveness of the National Early Warning System (NEWS): Systematic Review Update
Health Research Board – Collaboration in Ireland for Clinical Effectiveness Reviews
29
▪ Evaluation, audit and feedback
The review questions are as follows:
Q1. What EWSs or track and trigger systems are currently in use for the detection or timely
identification of physiological deterioration in adult (non-pregnant) patients in acute health
care settings? In line with the previous review update, studies investigating the
development and efficacy of various EWSs will be compared under the following
categorisations:
▪ Type of EWS
▪ General acute patients or specific sub-populations
▪ Vital sign parameters recorded and weightings given to each vital sign
▪ Single-parameter EWS compared to aggregate EWS
▪ Evaluation of chart design (paper-based EWS compared to electronic EWS)
▪ Implementation of EWSs and/or RRTs
Q2. How effective are the different EWSs in terms of improving key outcomes in adult (non-
pregnant) patients in acute health care settings?
Primary Outcomes:
▪ Mortality
▪ Cardiac Arrest
▪ Length of stay (LOS)
▪ Transfer/admission to the Intensive Care Unit (ICU)
Secondary outcomes:
▪ Clinical deterioration in sub-populations
▪ Any other outcomes identified post-hoc

Clinical & Cost-effectiveness of the National Early Warning System (NEWS): Systematic Review Update
Health Research Board – Collaboration in Ireland for Clinical Effectiveness Reviews
30
Q3. What education programmes (e.g. COMPASS©, other) have been established to train
health care professionals (HCPs) relating to the implementation of EWSs or track and trigger
systems for the detection or timely identification of physiological deterioration in adult
(non-pregnant) patients in acute health care settings?
3.1 How effective were the various education programmes?
Primary outcomes:
▪ Increase in knowledge and performance
▪ Effect on patient outcomes
▪ Improved patient rescue strategies
Secondary outcomes:
▪ Improved documentation of patient observations
▪ Improved compliance
▪ Any other outcomes identified post-hoc
Q4. What are the findings from the economic literature on cost-effectiveness, cost impact
and resources involved with the implementation of EWSs or track and trigger systems for
the detection or timely identification of physiological deterioration in adult (non-pregnant)
patients in acute health care settings?
The new review questions are as follows:
Q5. Are modified EWSs (e.g. the Chronic Respiratory Early Warning Score [CREWS]) more
effective than the NEWS for the detection or timely identification of physiological
deterioration in the following adult sub-populations in acute health care settings?
▪ Frail older adults
▪ Patients with chronic respiratory conditions (including chronic hypoxia, chronic
physiological abnormalities and chronic obstructive pulmonary disease [COPD])

Clinical & Cost-effectiveness of the National Early Warning System (NEWS): Systematic Review Update
Health Research Board – Collaboration in Ireland for Clinical Effectiveness Reviews
31
The NEWS is based on an EWS designed to maximise both sensitivity (the ability to detect
patients at risk of dying) and specificity (the minimisation of false alarms) for unselected
patients admitted to acute settings. The aim of question 5 is to investigate whether
modified EWSs (such as CREWS) can improve specificity and maintain sensitivity in specific
sub-populations where NEWS has been shown to trigger false alarms.(13)
Q6. Why do HCPs fail to escalate as per the NEWS escalation protocol? The previous
systematic review update conducted by UCC (2) highlighted that HCPs were failing to
escalate as per protocol and identified a number of barriers based on suggestions extracted
from the literature. However, an in-depth understanding as to ‘why’ this is happening
requires a qualitative approach to be included in this review update.
Review questions 1-4 are consistent with those set out in the previous searches which
informed the NEWS guideline(1) published in 2013, and a subsequent systematic review
update in 2016.(2) The purpose of this systematic review is to update the evidence for these
four questions. A new search will be conducted for the two additional new questions (5 and
6).

Clinical & Cost-effectiveness of the National Early Warning System (NEWS): Systematic Review Update
Health Research Board – Collaboration in Ireland for Clinical Effectiveness Reviews
32
2 Methods
This systematic review update presents the available evidence to estimate the clinical
effectiveness and cost-effectiveness of the NEWS in Ireland. In reporting this systematic
review we have adhered to the Preferred Reporting Items for Systematic Reviews and Meta-
Analyses (PRISMA) criteria.(14) For the qualitative review question, we have adhered to the
ENTREQ (Enhancing transparency in reporting the synthesis of qualitative research)
guidelines.(15) The protocol for this systematic review has been registered on the PROSPERO
database of systematic reviews and meta-analyses and was agreed on by the NEWS GDG in
January 2018 at a guideline development meeting (Link:
http://www.crd.york.ac.uk/PROSPERO/display_record.php?ID=CRD42018088048).
2.1 Criteria for including studies within this review
2.1.1 Search Process
Searches were conducted consistent with the search strategy developed by the research
team involved in the previous review.(2) Key terms and their variations were associated with
the PICOS (Population/Patient/Problem, Intervention, Comparison, Outcome and Study
design) framework which is applicable when addressing a clearly defined clinical question
relevant to a defined population group and clinical context.(16) Key terms included a
combination of terms associated with “early warning scoring systems”. The search strategy
is detailed in Appendix 2. The economic literature search was based on the clinical literature
search strategy with the addition of an economic filter for the Medline and EMBASE
search.(17)

Clinical & Cost-effectiveness of the National Early Warning System (NEWS): Systematic Review Update
Health Research Board – Collaboration in Ireland for Clinical Effectiveness Reviews
33
2.1.2 Types of participants, interventions, comparisons, outcomes and study
design
The PICOS (or modified PICOS) for each review question (1-6) are presented separately in
Table 2.1,
Table 2.2, Table 2.3, Table 2.4, Table 2.5 and Table 2.6.
Table 2.1 Specific PICOS for Review Question 1
Q1: What EWSs and or track and trigger systems are currently in use for the detection or timely identification of
physiological deterioration in adult (non-pregnant) patients in acute health care settings?
Population -Adult (non-pregnant) patients in acute (hospital) health care settings admitted to an
adult ward.
-In Irish hospitals, patients aged 16 years or older are classified as adults.
-More often, adult refers to patients aged 18 years or older.
Description/ Objective/Aims Description of EWS:
-EWS, e.g. NEWS
-Modified EWS
-VitalPAC™ EWS (ViEWS)
-Track and Trigger System
Outcome(s) -Type of EWS (NEWS, MEWS, comparisons of EWS)
-Details of vital sign parameters recorded and weightings given to each vital sign
-Single-parameter EWS compared to aggregate EWS
-General acute patients or specific sub-populations
-Evaluation of chart design (paper-based EWS compared to electronic EWS)
-Implementation of EWSs and/or RRS or METs
Study design Effectiveness studies, development and validation studies
Key: NEWS: National Early Warning System, MEWS: Modified Early Warning System, RRS: Rapid Response Systems, MET: Medical
Emergency Team.

Clinical & Cost-effectiveness of the National Early Warning System (NEWS): Systematic Review Update
Health Research Board – Collaboration in Ireland for Clinical Effectiveness Reviews
34
Table 2.2 Specific PICOS for Review Question 2
Q2: How effective are the different EWSs in terms of improving key patient outcomes in adult (non-pregnant) patients
in acute health care settings?
Population -Adult (non-pregnant) patients in acute (hospital) health care settings admitted to an
adult ward
-In Irish hospitals, patients aged 16 years or older are classified as adults
-More often, adult refers to patients aged 18 years or older
Intervention Early warning scoring systems (EWS): EWS, Modified EWS, VitalPAC™ EWS (ViEWS),
Track and Trigger System
Comparison Usual care, other EWS
Outcome(s) Primary:
-Mortality
-Cardiac arrest
-Length of stay
-Transfer/admission to the ICU or HDU
Secondary:
-Clinical deterioration in sub-populations
-PROMs (validated tools)
-Any other outcomes identified post-hoc
Study design Effectiveness studies, development and validation studies
Key: ICU: Intensive Care Unit, HDU: High Dependency Unit, PROMS: Patient Reported Outcome Measures.
Table 2.3 Specific PICOS for Review Question 3
Q3: What education programmes have been established to train healthcare professionals (HCPs) relating to the
implementation of EWSs or track and trigger systems for the detection/timely identification of physiological deterioration
in adult (non-pregnant) patients in acute health care settings?
Population Stakeholders including HCPs and their managers
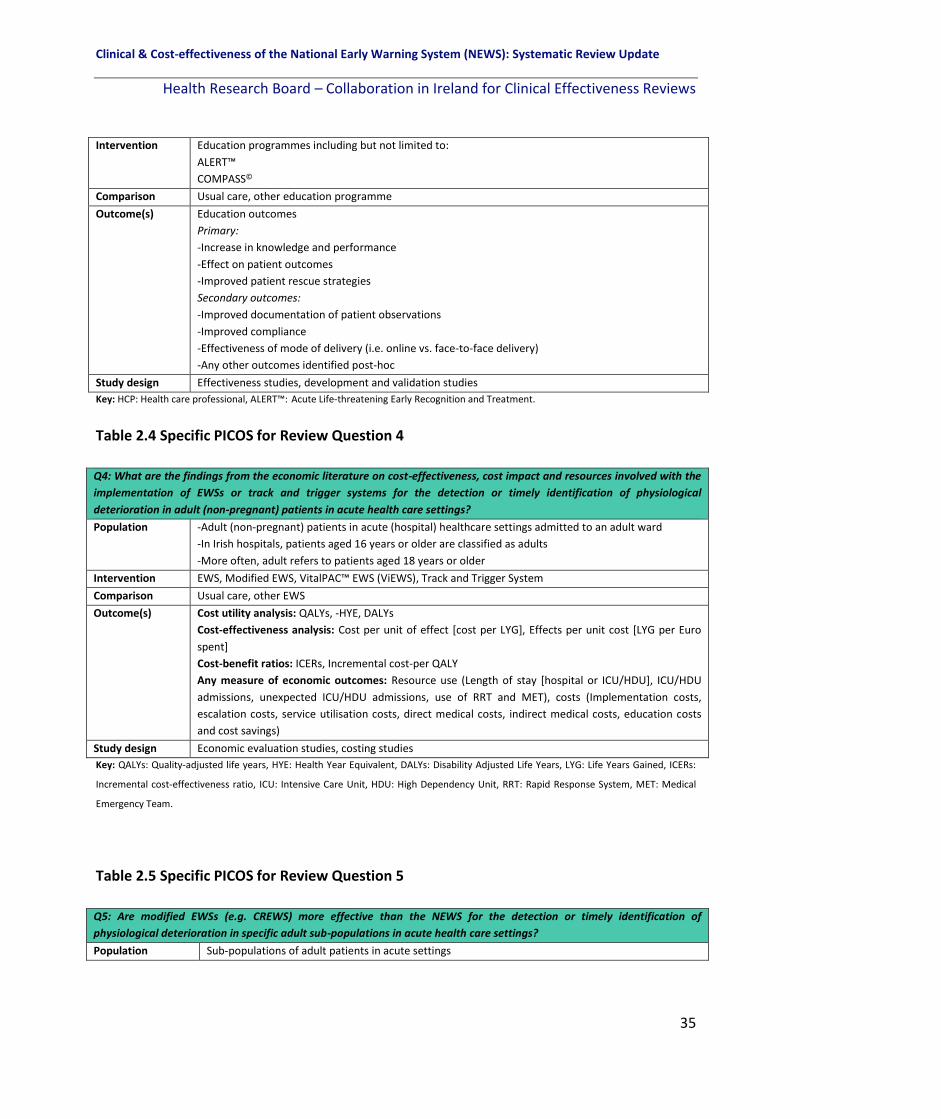
Clinical & Cost-effectiveness of the National Early Warning System (NEWS): Systematic Review Update
Health Research Board – Collaboration in Ireland for Clinical Effectiveness Reviews
35
Intervention
Education programmes including but not limited to:
ALERT™
COMPASS©
Comparison Usual care, other education programme
Outcome(s) Education outcomes
Primary:
-Increase in knowledge and performance
-Effect on patient outcomes
-Improved patient rescue strategies
Secondary outcomes:
-Improved documentation of patient observations
-Improved compliance
-Effectiveness of mode of delivery (i.e. online vs. face-to-face delivery)
-Any other outcomes identified post-hoc
Study design Effectiveness studies, development and validation studies
Key: HCP: Health care professional, ALERT™: Acute Life-threatening Early Recognition and Treatment.
Table 2.4 Specific PICOS for Review Question 4
Q4: What are the findings from the economic literature on cost-effectiveness, cost impact and resources involved with the
implementation of EWSs or track and trigger systems for the detection or timely identification of physiological
deterioration in adult (non-pregnant) patients in acute health care settings?
Population -Adult (non-pregnant) patients in acute (hospital) healthcare settings admitted to an adult ward
-In Irish hospitals, patients aged 16 years or older are classified as adults
-More often, adult refers to patients aged 18 years or older
Intervention EWS, Modified EWS, VitalPAC™ EWS (ViEWS), Track and Trigger System
Comparison Usual care, other EWS
Outcome(s) Cost utility analysis: QALYs, -HYE, DALYs
Cost-effectiveness analysis: Cost per unit of effect [cost per LYG], Effects per unit cost [LYG per Euro
spent]
Cost-benefit ratios: ICERs, Incremental cost-per QALY
Any measure of economic outcomes: Resource use (Length of stay [hospital or ICU/HDU], ICU/HDU
admissions, unexpected ICU/HDU admissions, use of RRT and MET), costs (Implementation costs,
escalation costs, service utilisation costs, direct medical costs, indirect medical costs, education costs
and cost savings)
Study design Economic evaluation studies, costing studies
Key: QALYs: Quality-adjusted life years, HYE: Health Year Equivalent, DALYs: Disability Adjusted Life Years, LYG: Life Years Gained, ICERs:
Incremental cost-effectiveness ratio, ICU: Intensive Care Unit, HDU: High Dependency Unit, RRT: Rapid Response System, MET: Medical
Emergency Team.
Table 2.5 Specific PICOS for Review Question 5
Q5: Are modified EWSs (e.g. CREWS) more effective than the NEWS for the detection or timely identification of
physiological deterioration in specific adult sub-populations in acute health care settings?
Population Sub-populations of adult patients in acute settings

Clinical & Cost-effectiveness of the National Early Warning System (NEWS): Systematic Review Update
Health Research Board – Collaboration in Ireland for Clinical Effectiveness Reviews
36
1) Frail older adults
-Must be defined with a validated frailty scale for inclusion
2) Adults with chronic respiratory conditions including (chronic hypoxia, chronic
hypoxaemia/hypoxemia, chronic physiological abnormalities, pulmonary fibrosis or COPD)
-Chronic hypoxaemia will be defined based on target oxygen saturations levels of 86-92%
and target oxygen saturations levels of 94-98% for others(13, 18)
Intervention
Modified EWS (e.g. CREWS)
Comparison NEWS (Studies comparing CREWS to usual care will not be relevant to this question)
Outcome(s) -Type of EWS (Name of modified EWS or NEWS)
-Vital sign parameters recorded and weightings given to each vital sign
-Single-parameter EWS compared to NEWS
-Clinical deterioration and outcomes including mortality, cardiac arrest, LOS, transfer/admission to
the ICU or HDU
Study design Effectiveness studies, development and validation studies
Key: COPD: Chronic Obstructive Pulmonary Disorder, CREWS: Chronic Respiratory Early Warning System, NEWS: National Early Warning
System, LOS: Length of stay, ICU: Intensive Care Unit, HDU: High Dependency Unit.
Table 2.6 Specific PICOS for Review Question 6
Q6: Why do HCPs fail to escalate as per the NEWS escalation protocol?
Population Stakeholders including HCPs and their managers
Phenomenon/Study
aims
Evidence to identify the range of factors, including barriers and facilitators, in very high and high-
income settings that influence why HCPs fail to escalate as per the NEWS protocol
Outcome(s) Qualitative outcomes:
Barriers and facilitators, which will be categorised as follows:
-Management/organisational/setting specific issues
-Education/training issues
-EWS specific issues
Study design Qualitative studies including focus group interviews, individual interviews, observation, document
analysis with qualitative methods of analysis (i.e. thematic analysis, framework analysis, grounded
theory)
Key: HCP: Health Care Professional, NEWS: National Early Warning Score.
2.1.3 Types of setting
Studies conducted in the acute hospital setting in countries classified as either very high or
high human development countries on the Human Development Index were considered for
inclusion in this review in order to maximise the transferability of the research findings to
the Irish context.(19)

Clinical & Cost-effectiveness of the National Early Warning System (NEWS): Systematic Review Update
Health Research Board – Collaboration in Ireland for Clinical Effectiveness Reviews
37
2.2 Search methods for identification of studies
2.2.1 Clinical and economic literature
The following electronic databases were searched for published literature for review
questions 1-4 from November 2015 until February 19th 2018. In addition, the same
databases were searched for the two new additional questions (question 5 on parameter
adjustments in specific sub-populations including frail older adults and adults with chronic
respiratory conditions, and question 6 on why HCPs fail to escalate as per protocol) from
January 2011 in line with the previous review update search criteria until February 19th
2018.
Academic Search Complete
Cumulative Index to Nursing and Allied Health Literature (CINAHL)
Applied Social Sciences Index and Abstracts (ASSIA)
Medical Literature Analysis and Retrieval System Online (MEDLINE)
PsycARTICLES
PsycINFO
Psychology and Behavioral Sciences Collection
SocINDEX
Exerptamedica Database (EMBASE)
Health Management Information Consortium (HMIC)
The Cochrane Library (www.cochranelibrary.com) which includes: The
Cochrane Database of Systematic Reviews, The Cochrane Methodology
Register (CMR) [ceased updating in 2012, archived in the Cochrane Library],
The Cochrane Central Register of Controlled Trials (CENTRAL), Database of
Abstracts of Reviews of Effects (DARE) [ceased updating in 2015, archived in
the Cochrane Library], The Health Technology Assessment Database (HTA)
[last update October 2016], and The National Health Service Economic
Evaluation Database (NHS EED)[ceased updating in 2015, archived in the
Cochrane Library] via MEDLINE
(https://www.nlm.nih.gov/bsd/pmresources.html).

Clinical & Cost-effectiveness of the National Early Warning System (NEWS): Systematic Review Update
Health Research Board – Collaboration in Ireland for Clinical Effectiveness Reviews
38
2.2.2 Other sources
This grey literature search was guided by the handbook produced by the Canadian Agency
for Drugs and Technology in Health (CADTH)(20) to supplement the electronic database
searches to find relevant clinical evaluations, economic evaluations, validation studies and
guidelines. A detailed list of the grey literature databases and websites for guidelines on the
use of early warning or track and trigger systems in adult (non-pregnant) patients in the
acute health care setting which were searched on February 20th 2018 can be found in
Appendix 3.
In addition, clinical trial registers were searched (e.g., WHO Clinical Trials Search Portal:
http://apps.who.int/trialsearch/, which allows for searching multiple databases
simultaneously) for completed but unpublished and on-going clinical trials on February 21st
2018. The search for economic evaluations was supplemented with searches of the
following websites on February 21st 2018:
▪ Open Grey (http://www.opengrey.eu/)
▪ New York Academy of Medicine (https://nyam.org/)
▪ National Institutes of Health (NIH) (https://www.nih.gov/)
▪ Health Service Executive (HSE) (https://www.hse.ie/eng/)
▪ Health Information and Quality Authority (HIQA) (https://www.hiqa.ie/)
▪ Health Research Board (HRB) Ireland (http://www.hrb.ie/home/)
▪ Lenus (http://www.lenus.ie/hse/)
▪ World Health Organization (WHO) (http://www.who.int/en/)
▪ National Institute for Health and Care Excellence (NICE) (https://www.nice.org.uk/)
▪ Centre for Health Economics and Policy Analysis (CHEPA) (http://www.chepa.org/)
▪ Institute of Health Economics (Alberta Canada) (https://www.ihe.ca/)
▪ Department of Health UK
(https://www.gov.uk/government/organisations/department-of-health-and-social-
care)
▪ National Health Service UK (NHS) (https://www.england.nhs.uk/)
▪ Public Health Agency of Canada (https://www.canada.ca/en/public-health.html)

Clinical & Cost-effectiveness of the National Early Warning System (NEWS): Systematic Review Update
Health Research Board – Collaboration in Ireland for Clinical Effectiveness Reviews
39
▪ Google Scholar and Google (https://scholar.google.com/, https://www.google.ie)
▪ National Coordinating Centre for Health Technology Assessment (NCCHTA)
(https://www.nihr.ac.uk/funding-and-support/funding-for-research-studies/funding-
programmes/health-technology-assessment/).
Finally, manual searching of the reference lists of any included study was conducted.
2.3 Inclusion and exclusion criteria
Inclusion and exclusion criteria for each review question (1-6) are outlined in Table 2.7.

Clinical & Cost-effectiveness of the National Early Warning System (NEWS): Systematic Review Update
Health Research Board – Collaboration in Ireland for Clinical Effectiveness Reviews
40
Table 2.7 Inclusion and exclusion criteria according to review question
Inclusion criteria Question 1
(EWS)
Question 2
(Outcomes)
Question 3
(Education)
Question 4
(Economics)
Question 5
(Sub-populations)
Question 6
(Qualitative)
Adult acute setting patients (16 years or older)
(Excluding paediatric, obstetric, ED patients and DNR patients)
X X X X X X
Investigated the implementation and or effectiveness of EWSs and or track and trigger
systems developed to facilitate the early detection of deterioration and escalation of care
X X X X X
Investigated the effectiveness of education programmes used to train registered HCPs in
relation to EWSs and or track & trigger systems (Excluding EWS not suitable for bedside
monitoring)
X
Acute hospital setting in countries categorised as either very high or high HDI(19) X X X X X X
Data were pre- and post-critical adverse clinical event(s) or pre-post EWS intervention or
pre-post education intervention
X X X X X X
Comparison of modified EWSs (e.g. CREWS) to the NEWS only in specific sub-populations
(frail older adults, patients with severe respiratory conditions)
X
Qualitative study design X
Quantitative study designs of a randomised and non-randomised nature including
effectiveness studies, development studies and economic studies
(Excluding study designs with no intervention or outcome data, i.e. case reports or
vignettes, early development studies, literature reviews, conference abstracts and letters)
X X X X X
Grey literature X X X X X X
English language X X X X X X
*Published since November 2015 (Update) X X X X
**Published since January 2011 (New review questions) X X
Key: An ‘X’ denotes that the specific inclusion criteria apply to the particular review question. ED: Emergency Department, DNR: Do Not Resuscitate, EWS: Early Warning System, HCP: Health care Professional, HDI: Human Development Index, CREWS: Chronic Respiratory Early Warning System, NEWS: National Early Warning System. *Questions 1-4 are consistent with the previous review update which searched the literature until November 2015. **Questions 5 and 6 are new questions and the search began from the starting date of the last review update (January 2011).

Clinical & Cost-effectiveness of the National Early Warning System (NEWS): Systematic Review Update
Health Research Board – Collaboration in Ireland for Clinical Effectiveness Reviews
41
2.4 Data collection and analysis
2.4.1 Selection of studies
All potentially eligible papers identified in the searches were exported to EndNote (Version
7) where duplicates were identified and removed. The titles and abstracts of the remaining
citations were each reviewed independently by two people as per the inclusion and
exclusion criteria to determine whether the papers merited a full text review. The full texts
were obtained and independently evaluated by two members of the team. Any
disagreements were resolved by discussion, or if necessary, a third reviewer (members of
the GDG with clinical and subject matter expertise).
2.4.2 Data extraction and management
Data were extracted from clinical literature pertaining to the evaluation of EWSs or track
and trigger systems under the following headings:
▪ Authors
▪ Year and country of publication
▪ Study design
▪ Aim of study
▪ Description of the intervention
▪ Study outcomes
The economic review data were extracted in relation to the following elements, in line with
the HIQA guidelines for the retrieval and interpretation of economic evaluations of health
technologies in Ireland:(21)
▪ Study question, population, intervention and type of EWS, comparator and setting
▪ Modelling methods
▪ Sources and quality of clinical data
▪ Sources and quality of cost data
▪ Cost data
▪ Resource usage
▪ Study outcomes, and methods used in synthesis

Clinical & Cost-effectiveness of the National Early Warning System (NEWS): Systematic Review Update
Health Research Board – Collaboration in Ireland for Clinical Effectiveness Reviews
42
▪ Outcomes and benefits
▪ Methods for dealing with uncertainty.
Separate data extraction tables were used according to the review question:
▪ Empirical clinical papers relating to use of EWSs or track & trigger systems used in adult (non-pregnant) patients
▪ Evaluation of education programs involving the education or training of HCPs relating to EWSs or track & trigger systems used in adult (non-pregnant) patients
▪ Empirical economic literature relating to EWSs or track & trigger systems used in adult (non-pregnant) patients
▪ Empirical clinical papers relating to EWSs or track and trigger systems in frail, older
adults or patients with severe respiratory conditions and whether it is appropriate to
adjust physiological parameter cut-off values, and which parameters should be
adjusted, in order to maximise the predictive ability of the NEWS
▪ Empirical qualitative papers relating to EWSs or track and trigger systems and why
HCPs fail to escalate as per the NEWS protocol.
Data extraction was performed by two members of the review team independently using
the agreed data extraction form to ensure consistency. Any discrepancies were resolved
through discussion, or if required, consultation with a third reviewer.
2.4.3 Assessment of methodological limitations and risk of bias
Two reviewers independently assessed the methodological quality or risk of bias of
included studies, using standardised critical appraisal instruments, with any
disagreements resolved through discussion. Different study designs warrant different
tools to assess methodological quality, thus the following instruments were used as
appropriate (see Table 2.8). In this review a number of different types of non-
randomised and observational studies are included, these are defined below:(22)
▪ Non-randomised controlled trial - An experimental study in which people are
allocated to different interventions using methods that are not random.
▪ Controlled before-and-after study - A study in which observations are made before
and after the implementation of an intervention, both in a group that receives the
intervention and in a control group that does not.

Clinical & Cost-effectiveness of the National Early Warning System (NEWS): Systematic Review Update
Health Research Board – Collaboration in Ireland for Clinical Effectiveness Reviews
43
▪ Interrupted-time-series study - A study that uses observations at multiple time
points before and after an intervention (the ‘interruption’). The design attempts to
detect whether the intervention has had an effect significantly greater than any
underlying trend over time.
▪ Cohort study - study in which a defined group of people (the cohort) is followed over
time, to examine associations between different interventions received and
subsequent outcomes. A ‘prospective’ cohort study recruits participants before any
intervention and follows them into the future. A ‘retrospective’ cohort study
identifies subjects from past records describing the interventions received and
follows them from the time of those records.
Table 2.8 Critical Appraisal Instruments
Study category Critical appraisal instrument
RCTs Cochrane Risk of bias tool(23)
NRCTs, CBA studies, ITS studies Risk of bias criteria for Cochrane EPOC reviews(24)
Clinical practice guideline AGREE II tool, ‘rigour of development’ domain (National Quality Assurance Criteria for Clinical
Guidelines(25)
Observational designs Newcastle Ottawa Scale(26)
Economic evaluations 1. CHEC-list for quality assessment(27), 2. ISPOR to assess transferability(28)
Development & validation
studies
The QUADAS 2 Tool(29)
Qualitative studies CASP(30) Qualitative Checklist
Key: RCT: Randomised Controlled Trial, NRCT: Non-Randomised Controlled Trial, CBA: Controlled Before-After study, ITS:
Interrupted Time Series study, EPOC: Effective Practice and Organisation of Care, AGREE: Appraisal Of Guidelines For
Research & Evaluation, CHEC-list: The Consensus Health Economic Criteria LIST, ISPOR: International Society for
Pharmacoeconomics and Outcomes Research, QUADAS: Quality Assessment of Diagnostic Accuracy Studies, CASP: Critical
Appraisal Skills Programme.
The Newcastle Ottawa Scale quality appraisal tool(26) was used for observational studies. We
rated the quality of the studies (good, fair and poor) by awarding stars in each domain
following the guidelines of the Newcastle–Ottawa Scale. A “good” quality score required 3
or 4 stars in ‘selection’, 1 or 2 stars in ‘comparability’, and 2 or 3 stars in ‘outcomes’. A “fair”
quality score required 2 stars in selection, 1 or 2 stars in comparability, and 2 or 3 stars in
outcomes. A “poor” quality score reflected 0 or 1 star(s) in selection, or 0 stars in
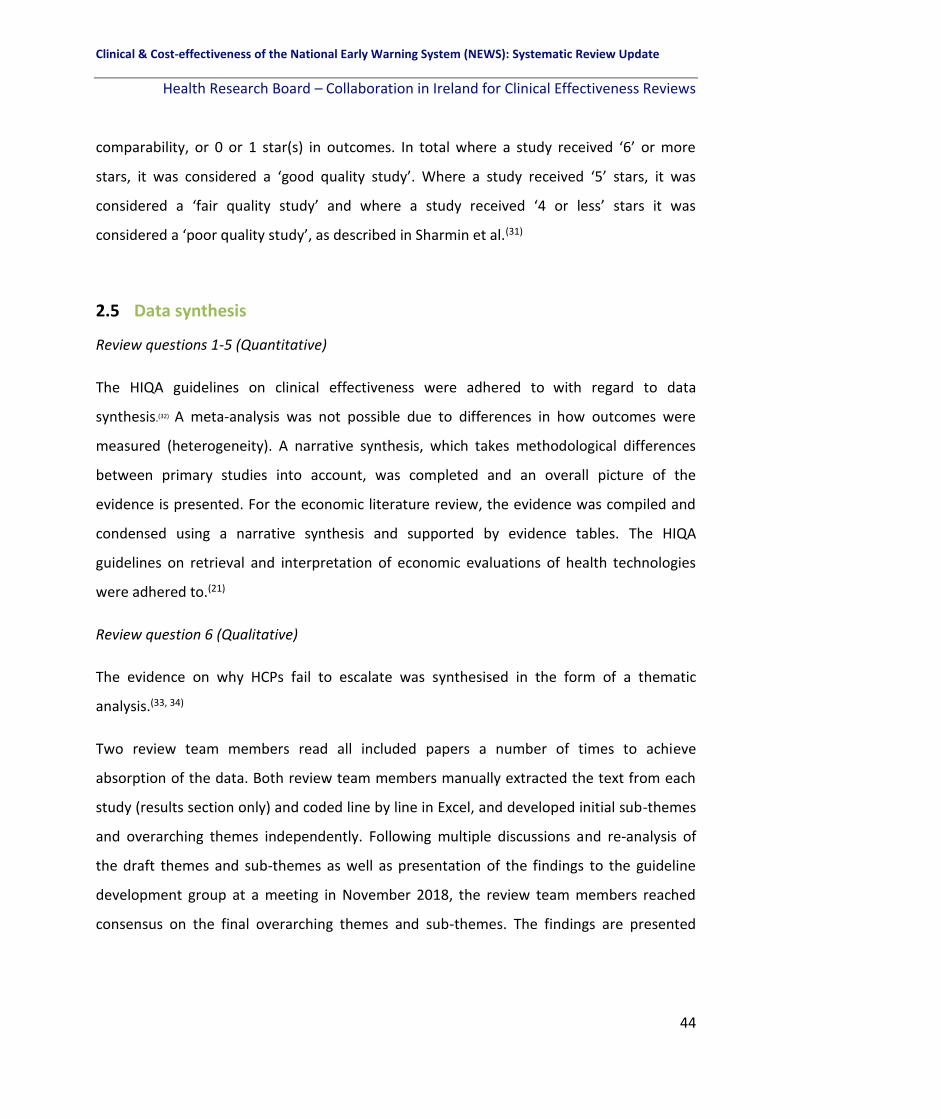
Clinical & Cost-effectiveness of the National Early Warning System (NEWS): Systematic Review Update
Health Research Board – Collaboration in Ireland for Clinical Effectiveness Reviews
44
comparability, or 0 or 1 star(s) in outcomes. In total where a study received ‘6’ or more
stars, it was considered a ‘good quality study’. Where a study received ‘5’ stars, it was
considered a ‘fair quality study’ and where a study received ‘4 or less’ stars it was
considered a ‘poor quality study’, as described in Sharmin et al.(31)
2.5 Data synthesis
Review questions 1-5 (Quantitative)
The HIQA guidelines on clinical effectiveness were adhered to with regard to data
synthesis.(32) A meta-analysis was not possible due to differences in how outcomes were
measured (heterogeneity). A narrative synthesis, which takes methodological differences
between primary studies into account, was completed and an overall picture of the
evidence is presented. For the economic literature review, the evidence was compiled and
condensed using a narrative synthesis and supported by evidence tables. The HIQA
guidelines on retrieval and interpretation of economic evaluations of health technologies
were adhered to.(21)
Review question 6 (Qualitative)
The evidence on why HCPs fail to escalate was synthesised in the form of a thematic
analysis.(33, 34)
Two review team members read all included papers a number of times to achieve
absorption of the data. Both review team members manually extracted the text from each
study (results section only) and coded line by line in Excel, and developed initial sub-themes
and overarching themes independently. Following multiple discussions and re-analysis of
the draft themes and sub-themes as well as presentation of the findings to the guideline
development group at a meeting in November 2018, the review team members reached
consensus on the final overarching themes and sub-themes. The findings are presented

Clinical & Cost-effectiveness of the National Early Warning System (NEWS): Systematic Review Update
Health Research Board – Collaboration in Ireland for Clinical Effectiveness Reviews
45
according to themes generated which were coded for each included study. Themes
including barriers and facilitators to NEWS were sub-categorised as follows where possible:
• Management/organisational/setting specific issues
• Education/training issues
• EWS or Track and Trigger System specific issues
• Other
2.6 Assessing the certainty of the body of evidence using the GRADE
approach
Review Questions 1-5
Where appropriate, 'Summary of findings' (SOF) tables using the GRADEpro software were
generated for the primary outcomes of each review question.(35) The certainty of the
evidence for each outcome was assessed using the GRADE approach as outlined in the
GRADE handbook where appropriate.(36) We downgraded the evidence from high quality by
one level for serious (or by two levels for very serious) limitations, depending on the
assessments of the risk of bias, indirectness of evidence, serious inconsistency, imprecision
of effect estimates, or potential publication bias. Evidence was graded as high, moderate,
low or very low.(36)
Review question 6
For qualitative studies, the GRADE-CERQual (Confidence in the Evidence from Reviews of
Qualitative research) approach was used to summarise confidence in the evidence.(37) Four
components contribute to an assessment of confidence in the evidence for an individual
review finding: methodological limitations, relevance, coherence, and adequacy of data. The
CERQual components reflect similar concerns to the elements included in the GRADE
approach for assessing the certainty of evidence on the effectiveness of interventions.

Clinical & Cost-effectiveness of the National Early Warning System (NEWS): Systematic Review Update
Health Research Board – Collaboration in Ireland for Clinical Effectiveness Reviews
46
However, CERQual considers these issues from a qualitative perspective. Confidence in the
evidence was graded as high, moderate, low, or very low for each key finding.

Clinical & Cost-effectiveness of the National Early Warning System (NEWS): Systematic Review Update
Health Research Board – Collaboration in Ireland for Clinical Effectiveness Reviews
47
3 Results
3.1 Search results for all review questions
The search strategy for all review questions identified 54,271 potentially relevant records
through searching the listed electronic databases and grey literature sources. After
removing duplicates, 36,445 records were screened independently by two reviewers, with a
further 36,110 references excluded based on titles and abstracts. A total of 335 full-text
articles were assessed for eligibility. Of these, 203 references were excluded according to
the inclusion and exclusion criteria (section 14.4). This resulted in 132 studies being included
in the review. Manual checking of the reference lists of included studies identified a further
22 eligible studies, bringing the total number of studies included in this review to 1541. The
breakdown of eligible studies for each review question is:
▪ N=123 studies for questions 1 and 2 (a description of EWSs and their effectiveness
on patient outcomes)
▪ N=23 studies for question 3 (the effectiveness of different EWS-based educational
interventions)
▪ N=3 studies for question 4 (an economic evaluation of the cost-effectiveness of
EWSs)
▪ N=4 study for question 5 (the effectiveness of EWSs in specific sub-populations, i.e.
frail elderly adults and patients with COPD or respiratory conditions).
▪ N=18 studies for question 6 (qualitative focus on why HCPs fail to escalate as per the
NEWS protocol).
This process is depicted in Figure 3.1.
1 Note some studies are eligible for inclusion in more than one review question and therefore the total number
of studies across all six questions will not sum to n=154.

Clinical & Cost-effectiveness of the National Early Warning System (NEWS): Systematic Review Update
Health Research Board – Collaboration in Ireland for Clinical Effectiveness Reviews
48
3.2 Presentation of results according to review question
The overall results, quality appraisal and the summary of the evidence for each review
question (1-6) are presented in chapters 4-12.

Clinical & Cost-effectiveness of the National Early Warning System (NEWS): Systematic Review Update
Health Research Board – Collaboration in Ireland for Clinical Effectiveness Reviews
49
Figure 3.1 Study flow diagram for all six questions in the systematic review
*Note some studies are eligible for inclusion in more than one review question and therefore the total number of studies across all six
questions will not sum to n=154.

Clinical & Cost-effectiveness of the National Early Warning System (NEWS): Systematic Review Update
Health Research Board – Collaboration in Ireland for Clinical Effectiveness Reviews
50
4 Results: A description of Early Warning Systems currently in use for the detection of physiological deterioration in adult (non-pregnant) patients in acute health care settings
4.1 Chapter overview
This chapter focusses on the literature pertinent to question 1 of the review. “What early
warning systems (EWSs) or track and trigger systems are currently in use for the detection of
or timely identification of physiological deterioration in adult (non-pregnant) patients in
acute health care settings?” The characteristics of the different EWSs are described
according to whether the study included one EWS or a multiple EWSs or focussed on EWS
chart design, whether the system was paper-based or electronic, the frequency of recording
of vital sign observations and whether it was an aggregate EWS or a single item EWS.
4.2 Characteristics of included studies
4.2.1 Study Country
In total, there were 123 studies eligible for inclusion. These studies were conducted across
22 different countries including Australia,(38-47) Belgium,(48, 49) Brazil,(50) Canada,(51-53)
China,(54-56) Denmark,(57-60) France,(61, 62) Iran,(63) Israel,(64, 65) Italy,(66, 67) Japan,(68) New
Zealand,(69) Portugal,(70) Saudi Arabia,(71) South Korea,(72-74) Sweden,(75) Switzerland, (76)
Thailand,(77) The Netherlands,(78-86) Turkey,(87) the UK,(8, 13, 88-113) the USA,(114-157) and one
study was conducted across two countries, the UK and the USA,(158) (Table 4.1, Table 4.2)
4.2.2 Early Warning Systems
In total there were 47 different named EWSs (described in 80 studies which included one
EWS, in 38 studies with two or more EWSs included, and in five studies focussed on chart
design).
These included the following:
▪ NEWS(13, 59, 60, 70, 77, 90, 93, 94, 101-105, 107, 109-113, 120, 149, 155, 156)

Clinical & Cost-effectiveness of the National Early Warning System (NEWS): Systematic Review Update
Health Research Board – Collaboration in Ireland for Clinical Effectiveness Reviews
51
▪ *MEWS(39, 48, 49, 54-57, 65-68, 74, 75, 78-80, 83, 87, 90, 95-98, 100, 103, 117, 122, 123, 127, 128, 131, 137, 138, 140-144,
146-155)
▪ ViEWS(58, 73, 89, 142, 144, 145, 149, 151)
▪ The Acute Physiology and Chronic Health Evaluation (APACHE II) EWS(56, 73, 140, 148, 151)
▪ SOFA(56, 75, 140, 151)
▪ The Chronic Respiratory EWS (CREWS)(13, 60, 107, 111)
▪ The Simplified Acute Physiology Score (SAPS) II(73, 148, 151)
▪ The Simple Clinical Score (SCS)(40, 65, 151)
▪ The Cardiac Arrest Triage Score (CART) EWS(143-145)
▪ The Rothman Index(140, 150, 152)
▪ SAPS III(49, 73, 75)
▪ The Rapid Emergency Medicine Score (REMS) EWS(65, 148, 151)
▪ The Worthing Physiological Scoring System (PSS)(104, 149)
▪ The Adult Deterioration Detection System (ADDS) EWS(47, 69)
▪ The Dutch Early Nurse Worry Indicator Score (DENWIS)(85, 86)
▪ The Systemic Inflammatory Response Syndrome (SIRS) EWS(41, 155)
▪ The quick Sequential Organ Failure Assessment (qSOFA) EWS(41, 155)
▪ electronic CART (eCART)(146, 156)
▪ The Mortality in Emergency Department Sepsis (MEDS) EWS(65, 151)
▪ APACHE III(148, 150)
▪ The Standardised EWS (SEWS)(144, 149)
▪ NEWS2(112)
▪ The Queensland ADDS (Q-ADDS) EWS(45)
▪ The Salford-NEWS(111{Pedersen, 2018 #7546)
▪ The Capital Region of Denmark NEWS Override System (CROS) EWS(60)
▪ The Vital Sign Score (VSS)(76)
▪ The Laboratory Decision Tree (LDT-EWS)(92)
▪ The Vital Sign Alert (VSA) EWS(114)
▪ The Patientrack EWS(88)
▪ The Electronic Physiological Surveillance System (EPSS) EWS(99)
▪ The Dutch Leakage (DULK) EWS(61)

Clinical & Cost-effectiveness of the National Early Warning System (NEWS): Systematic Review Update
Health Research Board – Collaboration in Ireland for Clinical Effectiveness Reviews
52
▪ The Patient at Risk Score (PARS)(101)
▪ The Decision Tree EWS (DTEWS)(102)
▪ The Super Score EWS(54)
▪ The Adult Fever State Score (AFSS)(55)
▪ The Critical Vital Sign EWS(142)
▪ Binary NEWS(105)
▪ Short NEWS(70)
▪ Palliative NEWS(107)
▪ The ViEWS-L (includes lactate)(73)
▪ The Hypotension, Oxygen saturation, low Temperature, ECG change and Loss of
independence (HOTEL) EWS(73)
▪ The Prince of Wales Emergency Department Score (PEDS)(148)
▪ The Global Modified EWS (GMEWS)(149)
▪ The single parameter Medical Early Response Intervention and Therapy (MERIT)
EWS(144)
▪ The modified-MERIT EWS(144)
▪ The Sepsis Early Warning and Response System (EWRS)(139)
▪ The Predisposition/Infection/Response/Organ Dysfunction Score (PIRO) EWS(151)
*It should be noted that the MEWS does not refer to one singular EWS, and instead refers to
a number of distinct EWSs.
Two studies compared 30 or more EWSs each.(8, 106)
There were also 13 other EWSs including: unnamed EWSs;(38, 84, 118, 121, 126, 140, 141, 144, 147, 148)
Algorithm-based EWSs;(64, 132) and a centile-based EWSs.(144, 158) In addition, 23 studies used
single items as criteria to activate emergency response systems.(46, 50-53, 62, 63, 71, 72, 81, 82, 115, 116,
119, 124, 125, 130, 133-136, 149, 157) One study reported using an EWS as part of a 5-item care bundle
(known as the Emergency Laparotomy Pathway Quality Improvement Care [ELPQuiC]), but
provided no details on the specific vital sign parameters recorded or the type of EWS.(91)
Another study focusing on emergency response systems provided no details on the EWS
component,(129) (Table 4.1,Table 4.2).

Clinical & Cost-effectiveness of the National Early Warning System (NEWS): Systematic Review Update
Health Research Board – Collaboration in Ireland for Clinical Effectiveness Reviews
53
4.2.3 Early Warning System Chart Design
Five of the 123 included studies focussed on EWSs chart design.(42-44, 47, 108) All used paper-
based EWSs only. Six different chart designs based on the ADDS EWS were assessed in one
study and three different chart designs based on the same EWS in another study.(42, 44) The
third study compared four different chart designs for BP and HR only.(43) The fourth study
compared 12 different chart designs based on the PARS EWS used in six clinical
scenarios.(108) The fifth study using an ADDS-based design compared data recording format,
scoring system integration and scoring row placement.(47) The number and type of vital sign
parameters varied across studies (Table 4.3).
4.2.4 Number and type of vital sign parameters reported
The number and type of parameters included varied from study to study. The number of
parameters ranged from two (respiratory rate [RR] and heart rate [HR]) in Zimlichman et
al.(64) to 398 in an algorithm-based EWS in Hackmann et al.,(116) and was not reported for
some of the EWSs included in 25 studies.(8, 41, 48, 56, 73, 75, 80, 91, 96, 99, 104, 111, 127, 129, 134, 137, 140, 142,
144-147, 149, 150, 156) Some of the other most frequently reported parameters, beyond those
included in the NEWS were: urine output, level of consciousness using the Glasgow coma
scale (GCS), white blood cell (WBC) count, staff/family concern, age, and diastolic blood
pressure (DBP) (Table 4.1, Table 4.2).
4.2.5 Paper-based or electronic EWSs
There were 60 electronic EWSs (8, 39, 41, 55, 59, 60, 64, 65, 68, 70-72, 78, 84-86, 88, 90, 92-94, 99, 102, 104-107, 111-114,
116-118, 120-123, 126, 127, 131, 132, 137, 139-142, 144-150, 152, 154-156, 158) and 19 paper-based EWSs.(13, 42-45, 47-
49, 54, 57, 69, 79, 87, 98, 101, 108-110, 128) Forty-four studies did not report whether it was electronic or
paper-based and it was not clear from the text.(38, 40, 46, 50-53, 56, 58, 61-63, 66, 67, 73-77, 80-83, 89, 91, 95-97,
100, 103, 115, 119, 124, 125, 129, 130, 133-136, 138, 151, 153, 157) (Table 4.1, Table 4.2)

Clinical & Cost-effectiveness of the National Early Warning System (NEWS): Systematic Review Update
Health Research Board – Collaboration in Ireland for Clinical Effectiveness Reviews
54
4.2.6 Frequency of recording of vital signs
The frequency of recording of vital signs was not reported in the majority of included studies
(n=83).(8, 13, 38-44, 46-48, 50-53, 55, 56, 62, 63, 65-70, 72-74, 76, 77, 80, 81, 84, 89-93, 96-99, 102-106, 108-111, 113, 115-121, 124-
127, 129-137, 143-149, 151, 152, 157, 158) Where the frequency of recording of vital signs or parameters
was recorded it varied from study to study. It was hourly in two studies,(54, 75) 4-hourly in
nine studies,(71, 87, 88, 95, 114, 123, 128, 150, 153) 6-hourly in one study,(100) 6-7 hours on average in
one study,(94) 8-hourly in eight studies,(57, 79, 82, 83, 85, 86, 122, 154) 4-8 hourly in one study,(156) 12-
hourly in four studies,(49, 58, 59, 107) on admission and 4-hourly thereafter in one study,(87)
admission and throughout in one study,(101) once a day in three studies,(61, 78, 138) according
to physician orders in two studies,(45, 142) and continuous using real-time or near real-time
data in seven studies.(60, 64, 112, 139-141, 155) (Table 4.1, Table 4.2, Table 4.3)
4.2.7 Aggregate EWSs
There were 71 studies which included one or more aggregated EWSs.(8, 13, 39-41, 45, 48, 49, 54-61, 65,
66, 68-70, 73, 75, 77-80, 83-90, 92-98, 100-107, 109, 110, 112-114, 117, 120, 122, 123, 128, 131, 138, 142-144, 146, 147, 149, 150, 152,
153) The scores and weighting assigned to vital signs varied from study to study (Table 4.1,
Table 4.2). For an overview of the scores and weightings, where reported in the relevant
studies, please see Appendix 5.

Clinical & Cost-effectiveness of the National Early Warning System (NEWS): Systematic Review Update
Health Research Board – Collaboration in Ireland for Clinical Effectiveness Reviews
55
Table 4.1 Characteristics of EWSs currently in use for the detection of acute physiological deterioration in adult (non-pregnant) patients in
acute health care settings – one EWS only studies
Author,
Country
No of parameters,
Name of EWS
Parameters included in EWS Paper-based
or electronic
Recording of
parameters
Aggregate
EWS, score RR SpO2 FiO2 SBP HR AVPU Temp Other - specify (110)Abbott (2016),
UK
10-item NEWS x X x x x x x Lactate, glucose, base excess Paper-based Not reported Yes (0-3)
(117)Albert (2011),
USA
12-item MEWS x X x x X x Urine output, level of consciousness, WBC, difficulty
breathing, new focal weakness, staff or family concern.
Electronic Not reported Yes (0-3)
(71)Al-Qahtani
(2013), Saudi
Arabia
Single items, not
combined
x X x X Urine output, level of consciousness using GCS, staff
concern about the patient
Electronic 4-hourly No
(118)Bailey (2013),
USA
7-item EWS with
real-time
automated alerts
generated 24/7.
x X x X Shock index, anticoagulation use, DBP Electronic
(algorithm-
based)
Not reported No
(119)Beitler (2011),
USA
Single items, not
combined
x X x X Clinical judgement/concern Not reported Not reported No
(57)Bunkenborg
(2014), Denmark
6-item MEWS x X x X x x Paper-based 8-hourly Yes (0-3)
(120)Capan (2015),
USA
7-item NEWS x X x x X x x Electronic
(algorithm-
based)
Not reported Yes (0-3)
(121)Churpek
(2013a), USA
8-item EWS x X x x X x x DBP Electronic
(algorithm-
based)
Not reported No
(122)Churpek
(2012), USA
5-item MEWS x x X x x Electronic 8-hourly Yes (0-3)
(123)Churpek
(2015), USA
8-item MEWS x X x X x DBP, pulse pressure index (=SBP-DBP/SBP), shock
index(=SBP/HR)
Electronic 4-hourly Yes (0-3)

Clinical & Cost-effectiveness of the National Early Warning System (NEWS): Systematic Review Update
Health Research Board – Collaboration in Ireland for Clinical Effectiveness Reviews
56
Table 4.1 Characteristics of EWSs currently in use for the detection of acute physiological deterioration in adult (non-pregnant) patients in
acute health care settings – one EWS only studies (continued) Author, Country
No of parameters, Name of EWS
Parameters included in EWS Paper-based or electronic
Recording of parameters
Aggregate EWS, score RR SpO2 FiO2 SBP HR AVPU Temp Other - specify
(124)Davis (2015), USA Single items, no
specific EWS –criteria
for activating RRT.
x x x X x x Chest pain, acute blood loss, Arterial
Blood Gas test obtained, PetCO2 rise;
laboured breathing, persistent apneas,
staff concern, family concern.
Not reported. Not reported. No
(48)DeMeester (2013b), Belgium
6-item MEWS X x x x X x Paper-based Not reported. Yes (0-3)
(85, 86)Douw (2016, 2017), The Netherlands
16-item DENWIS X x x x x x LOC, change in breathing, in circulation, rigors, change in mentation, agitation, pain, no progress, patient indicates feeling unwell, subjective nurse observation
Electronic 8-hourly Yes (0-4)
(69)Drower (2013), New Zealand
8-item ADDS EWS X x x x x X x Urine output. Paper-based Not reported. Yes (0-3)
(87)Durusu Tanriover (2016), Turkey
5-item MEWS X x x X x Paper-based On admission and 4-hourly thereafter
Yes (0-3)
(76)Etter (2014), Switzerland
6-item VSS EWS X x x x GCS, peripheral perfusion Not reported. Not reported. No
(90)Faisal (2018), UK 6-item NEWS X x x x x DBP Electronic Not reported Yes (0-3) (109)Fareneden (2017), UK
7-item NEWS X x x x x X Staff concern Paper-based Not reported Yes (0-3)
(50)Gonçales (2012), Brazil
Single items, no specific EWS –criteria for activating RRT.
X x x x Not reported. Not reported. No
(116)Hackmann (2011), USA
Single item electronic medical record EWS
X x x x Electronic medical record included 398 variables. Highest-weighted variables from the training set included shock index, coagulation modifiers, DBP
Electronic (algorithm-based)
Not reported. No
(51)Hayani (2011), Canada
Single items for activating RRS team
X x x x GCS, urine output. Not reported. Not reported. Not reported.
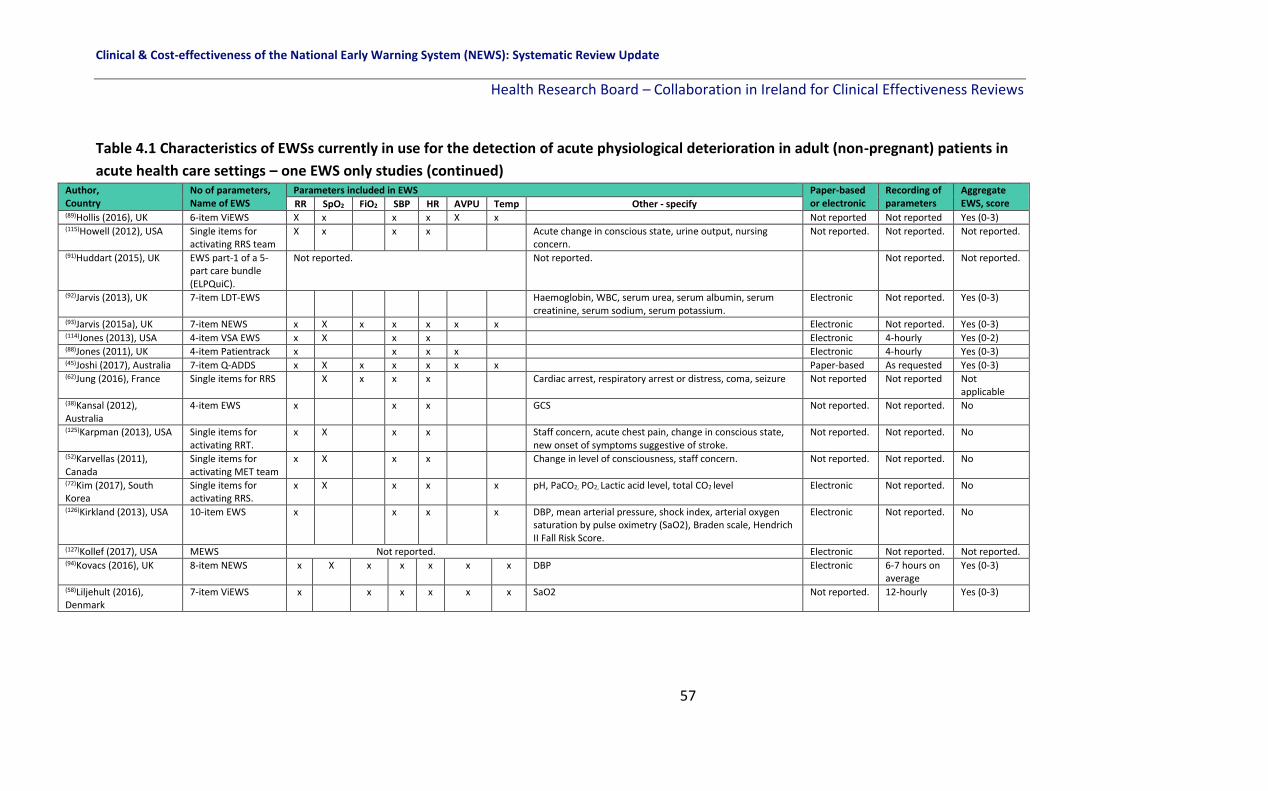
Clinical & Cost-effectiveness of the National Early Warning System (NEWS): Systematic Review Update
Health Research Board – Collaboration in Ireland for Clinical Effectiveness Reviews
57
Table 4.1 Characteristics of EWSs currently in use for the detection of acute physiological deterioration in adult (non-pregnant) patients in
acute health care settings – one EWS only studies (continued) Author, Country
No of parameters, Name of EWS
Parameters included in EWS Paper-based or electronic
Recording of parameters
Aggregate EWS, score RR SpO2 FiO2 SBP HR AVPU Temp Other - specify
(89)Hollis (2016), UK 6-item ViEWS X x x x X x Not reported Not reported Yes (0-3) (115)Howell (2012), USA Single items for
activating RRS team X x x x Acute change in conscious state, urine output, nursing
concern. Not reported. Not reported. Not reported.
(91)Huddart (2015), UK
EWS part-1 of a 5-part care bundle (ELPQuiC).
Not reported. Not reported. Not reported. Not reported.
(92)Jarvis (2013), UK 7-item LDT-EWS Haemoglobin, WBC, serum urea, serum albumin, serum creatinine, serum sodium, serum potassium.
Electronic Not reported. Yes (0-3)
(93)Jarvis (2015a), UK 7-item NEWS x X x x x x x Electronic Not reported. Yes (0-3) (114)Jones (2013), USA 4-item VSA EWS x X x x Electronic 4-hourly Yes (0-2) (88)Jones (2011), UK 4-item Patientrack x x x x Electronic 4-hourly Yes (0-3) (45)Joshi (2017), Australia 7-item Q-ADDS x X x x x x x Paper-based As requested Yes (0-3) (62)Jung (2016), France Single items for RRS X x x x Cardiac arrest, respiratory arrest or distress, coma, seizure Not reported Not reported Not
applicable (38)Kansal (2012), Australia
4-item EWS x x x GCS Not reported. Not reported. No
(125)Karpman (2013), USA Single items for activating RRT.
x X x x Staff concern, acute chest pain, change in conscious state, new onset of symptoms suggestive of stroke.
Not reported. Not reported. No
(52)Karvellas (2011), Canada
Single items for activating MET team
x X x x Change in level of consciousness, staff concern. Not reported. Not reported. No
(72)Kim (2017), South Korea
Single items for activating RRS.
x X x x x pH, PaCO2, PO2, Lactic acid level, total CO2 level Electronic Not reported. No
(126)Kirkland (2013), USA 10-item EWS x x x x DBP, mean arterial pressure, shock index, arterial oxygen saturation by pulse oximetry (SaO2), Braden scale, Hendrich II Fall Risk Score.
Electronic Not reported. No
(127)Kollef (2017), USA MEWS Not reported. Electronic Not reported. Not reported. (94)Kovacs (2016), UK 8-item NEWS x X x x x x x DBP Electronic 6-7 hours on
average Yes (0-3)
(58)Liljehult (2016), Denmark
7-item ViEWS x x x x x x SaO2 Not reported. 12-hourly Yes (0-3)

Clinical & Cost-effectiveness of the National Early Warning System (NEWS): Systematic Review Update
Health Research Board – Collaboration in Ireland for Clinical Effectiveness Reviews
58
Table 4.1 Characteristics of EWSs currently in use for the detection of acute physiological deterioration in adult (non-pregnant) patients in
acute health care settings – one EWS only studies (continued)
Author,
Country
No of parameters,
Name of EWS
Parameters included in EWS Paper-based
or electronic
Recording of
parameters
Aggregate
EWS, score RR SpO2 FiO2 SBP HR AVPU Temp Other - specify (78)Van Galen (2016), The Netherlands
8-items MEWS x X x x x x Urine output, staff concern Electronic Once a day (morning)
Yes (0-3)
(79)Ludikhuize (2014), The Netherlands
8-items MEWS x X x x x x Urine output, staff concern Paper-based 8-hourly Yes (0-3)
(80)Ludikhuize (2015), The Netherlands
MEWS Not reported. Not reported. Not reported. Yes (0-3)
(128)Mathukia (2015), USA 5-item MEWS x x x x x Paper-based 4-hourly Yes (0-3) (95)Moon (2011), UK 7-item MEWS x X x x x x Urine output Not reported. 4-hourly Yes (0-3) (129)Moriarty (2014), USA Not reported –
focus on RRT
Not reported. Not reported. Not reported. Not reported.
(46)Massey (2015)
Australia
Single items for
activating RRT
x X x x x GCS, urine output Not reported Not reported Not
applicable (130)Moroseos (2014),
USA
Single items for
activating RRT
x X x x x Conscious state, stridor-noisy airway, ABG orders for
respiratory concerns, chest pain, transfusion >4U PRBC in
last 24 hrs, decrease in HCT by > 6 points in last 24 hrs.
Not reported. Not reported. Not reported.
(96)Morris (2013), UK Modified MEWS Not reported. Not reported Not reported. Yes (0-3) (39)Mullany (2016),
Australia
4-item MEWS x X x x Electronic Not reported. Yes (0-3)
(61)Martin (2015), France 13-item DULK EWS x x x Oliguria (diuresis < 700 mL/d), agitation or lethargy, clinical
deterioration, Ileus, gastroparesia, evisceration, abdominal
or parietal pain, elevated WBC count, elevation blood
creatinine or urea >5%, enteral nutrition tube or parenteral
nutrition.
Not reported. Minimum
once a day.
Yes (0-2)
(40)Nguyen (2015),
Australia
11-item SCS EWS x X x x x Age, ECG, diabetic (insulin oral glycaemic meds), BP, mental
status, stand unaided.
Not reported. Not reported. Yes (not
reported) (68)Nishijima (2016),
Japan
6-item MEWS x x x x x Staff concern Electronic Not reported. Yes (0-3)

Clinical & Cost-effectiveness of the National Early Warning System (NEWS): Systematic Review Update
Health Research Board – Collaboration in Ireland for Clinical Effectiveness Reviews
59
Table 4.1 Characteristics of EWSs currently in use for the detection of acute physiological deterioration in adult (non-pregnant) patients in acute health care settings – one EWS only studies (continued)
Author, Country
No of parameters, Name of EWS
Parameters included in EWS Paper-based or electronic
Recording of parameters
Aggregate EWS, score RR SpO2 FiO2 SBP HR AVPU Temp Other - specify
(131)Parrish (2017), USA
7-item MEWS x X x x x x O2 delivery methods Electronic Not reported. Yes (0-3)
(97)Patel (2011), UK
7-item MEWS x x x x BP, urine catheterised, non-catheterised Not reported. Not reported. Yes (0-3)
(98)Pattison (2012), UK
15-item MEWS x x x BP, urine output, potassium, magnesium, GCS, fluid assessment, chest exam, procalcitonin, cap refill, bowel assessment, ECG, DNAR order.
Paper-based Not reported. Yes (0-3)
(66)Peris (2012), Italy
5-item MEWS x x x x x Not reported. Not reported. Yes (0-3)
(59)Petersen (2016), Denmark
7-item NEWS x X x x x x x Electronic 12-hourly Yes (0-3)
(132)Picker (2017), USA
36-item algorithm-based EWS x X x x x Age, alanine aminotransferase, alternative medicines, anion gap, anti-infectives, antieoplastics, aspartate aminotransferase, biologicals, DBP, serum calcium, serum calcium ionized, cardiovascular agents, CNS agents, Charlson index, coagulation modifiers, estimated creatinine clearance, GI agents, genitourinary tract agents, hormones, immunologic agents, serum magnesium, metabolic agents, miscellaneous agents, nutritional products, serum phosphate, serum potassium, psychotherapeutic agents, radiologic agents, respiratory agents, shock index, topical agents.
Electronic Not reported. No.
(133)Rothberg (2012), USA
Single items for activating MET x X x x x Staff concern Not reported. Not reported. No.
(63)Sabahi (2012), Iran
Single items for activating RRT x X x x Respiratory distress including wheezing and congestion, significant bleeding, changes in consciousness or seizures, chest pain, uncontrolled pain, restlessness
Not reported. Not reported. No.
(134)Salvatierria (2014), USA
Single items for activating RRT in 10 different hospitals.
Not reported. Not reported. Not reported. Not reported.

Clinical & Cost-effectiveness of the National Early Warning System (NEWS): Systematic Review Update
Health Research Board – Collaboration in Ireland for Clinical Effectiveness Reviews
60
Table 4.1 Characteristics of EWSs currently in use for the detection of acute physiological deterioration in adult (non-pregnant) patients in
acute health care settings – one EWS only studies (continued) Author, Country
No of parameters, Name of EWS
Parameters included in NEWS Paper-based or electronic
Recording of parameters
Aggregate EWS, score RR SpO2 FiO2 SBP HR AVPU Temp Other - specify
(53)Scherr (2012), Canada
Single items for activating RRT in 2 different hospitals.
x x x x Staff concern, airway concerns. Not reported. Not reported. No.
(99)Schmidt (2014), UK
EPSS – VitalPac EWS Not reported.
Electronic
Not reported.
Not reported.
(157)Sebat (2018), USA
Single items for activating RRT
x X x x x x Pain, mental status, capillary refill, urine output, base deficit, lactic acid
Not reported Not reported Not applicable
(135)Segon (2014), USA
Single items for activating RRT
x X x x Change in breathing pattern, urine output, seizures, change in mental status, staff concern, family concern.
Not reported. Not reported. No.
(136)Shah (2011), USA
Single items for activating RRT
x X x x x Change in mental status, staff concern, threatened airway. Not reported. Not reported. No.
(81)Simmes (2012), The Netherlands
Single parameter track and trigger system for activating MET.
x X x x Eye, motor verbal (EMV) score, staff concern. Not reported. Not reported. No.
(82)Simmes (2013), The Netherlands
Single parameter track and trigger system for activating MET.
x X x x Eye, motor verbal (EMV) score, GCS. Not reported. 8-hourly No.
(83)Smith (2012), The Netherlands
8-item MEWS x X x x x x Urine output, staff concern. Not reported. 8-hourly Yes (0-3)
(137)Stewart (2014), USA
MEWS Not reported. Electronic Not reported. Not reported.
(138)Stark (2015), USA
5-item MEWS x x x x x Not reported. 24-hourly Yes (0-3)
(100)Suppiah (2014), UK
8-item MEWS x X x x x x x Urine output Not reported. 6-hourly Yes (0-3)
(158)Tarassenko (2011), UK and USA
4-item centile-based EWS x X x x Electronic Not reported. No.
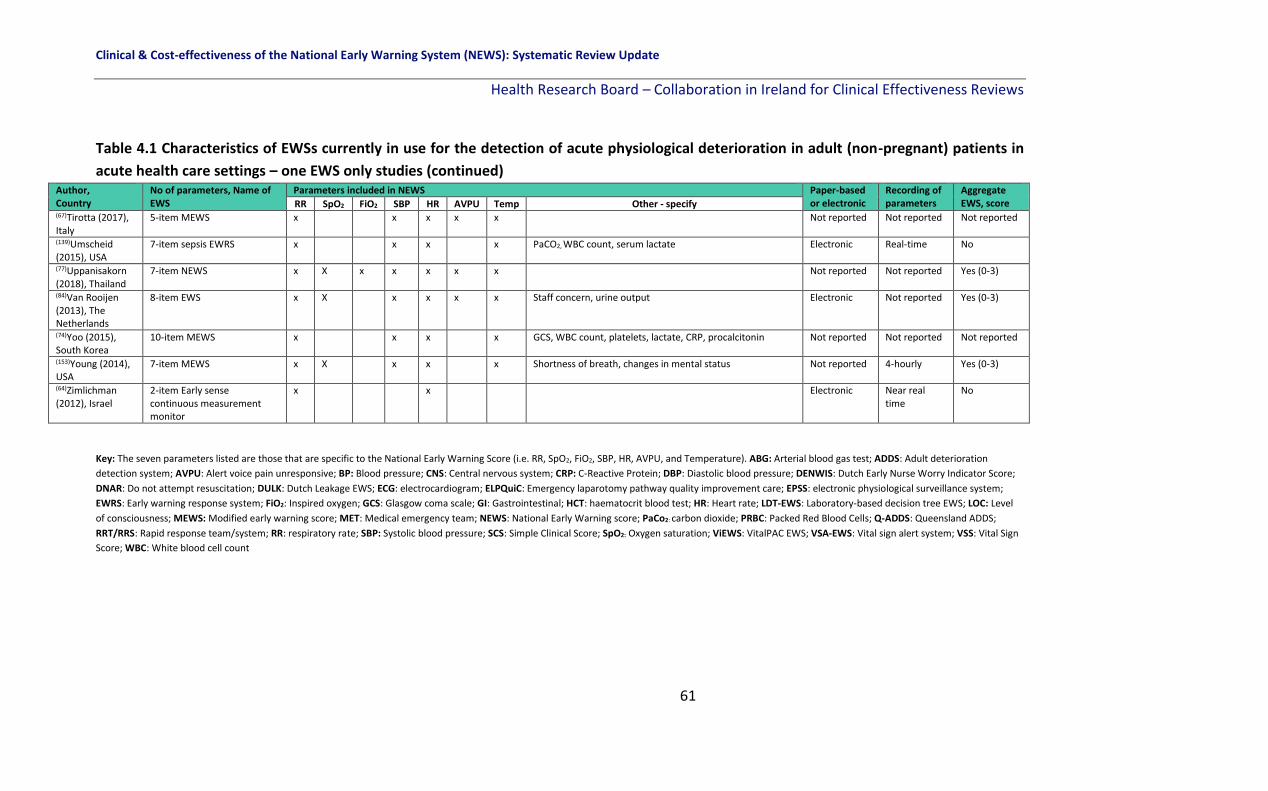
Clinical & Cost-effectiveness of the National Early Warning System (NEWS): Systematic Review Update
Health Research Board – Collaboration in Ireland for Clinical Effectiveness Reviews
61
Table 4.1 Characteristics of EWSs currently in use for the detection of acute physiological deterioration in adult (non-pregnant) patients in
acute health care settings – one EWS only studies (continued) Author, Country
No of parameters, Name of EWS
Parameters included in NEWS Paper-based or electronic
Recording of parameters
Aggregate EWS, score RR SpO2 FiO2 SBP HR AVPU Temp Other - specify
(67)Tirotta (2017), Italy
5-item MEWS x x x x x Not reported Not reported Not reported
(139)Umscheid (2015), USA
7-item sepsis EWRS x x x x PaCO2, WBC count, serum lactate Electronic Real-time No
(77)Uppanisakorn (2018), Thailand
7-item NEWS x X x x x x x Not reported Not reported Yes (0-3)
(84)Van Rooijen (2013), The Netherlands
8-item EWS x X x x x x Staff concern, urine output Electronic Not reported Yes (0-3)
(74)Yoo (2015), South Korea
10-item MEWS x x x x GCS, WBC count, platelets, lactate, CRP, procalcitonin Not reported Not reported Not reported
(153)Young (2014), USA
7-item MEWS x X x x x Shortness of breath, changes in mental status Not reported 4-hourly Yes (0-3)
(64)Zimlichman (2012), Israel
2-item Early sense continuous measurement monitor
x x Electronic Near real time
No
Key: The seven parameters listed are those that are specific to the National Early Warning Score (i.e. RR, SpO2, FiO2, SBP, HR, AVPU, and Temperature). ABG: Arterial blood gas test; ADDS: Adult deterioration
detection system; AVPU: Alert voice pain unresponsive; BP: Blood pressure; CNS: Central nervous system; CRP: C-Reactive Protein; DBP: Diastolic blood pressure; DENWIS: Dutch Early Nurse Worry Indicator Score;
DNAR: Do not attempt resuscitation; DULK: Dutch Leakage EWS; ECG: electrocardiogram; ELPQuiC: Emergency laparotomy pathway quality improvement care; EPSS: electronic physiological surveillance system;
EWRS: Early warning response system; FiO2: Inspired oxygen; GCS: Glasgow coma scale; GI: Gastrointestinal; HCT: haematocrit blood test; HR: Heart rate; LDT-EWS: Laboratory-based decision tree EWS; LOC: Level
of consciousness; MEWS: Modified early warning score; MET: Medical emergency team; NEWS: National Early Warning score; PaCo2: carbon dioxide; PRBC: Packed Red Blood Cells; Q-ADDS: Queensland ADDS;
RRT/RRS: Rapid response team/system; RR: respiratory rate; SBP: Systolic blood pressure; SCS: Simple Clinical Score; SpO2: Oxygen saturation; ViEWS: VitalPAC EWS; VSA-EWS: Vital sign alert system; VSS: Vital Sign
Score; WBC: White blood cell count

Clinical & Cost-effectiveness of the National Early Warning System (NEWS): Systematic Review Update
Health Research Board – Collaboration in Ireland for Clinical Effectiveness Reviews
62
Table 4.2 Characteristics of EWSs currently in use for the detection of acute physiological deterioration in adult (non-pregnant) patients in acute health care settings – two or more EWSs
Author, Country
No of parameters, Name of EWSs
Parameters included in EWS Paper-based or electronic
Recording of parameters
Aggregate EWS, score RR SpO2 FiO2 SBP HR AVPU Temp Other - specify
(101)Abbott (2015), UK
7-item NEWS vs. 7-item PARS.
x x x x x x x Paper-based Admission & throughout
Yes (0-3)
x x x x x x Urine output Yes (0-3) (140)Alaa (2018), USA
10-item EWS vs. MEWS, APACHE II, the Rothman Index and SOFA EWS.
x x x x DBP, eye opening, GCS, WBC, glucose, urea nitrogen. Electronic (algorithm-based)
Real-time data
No
Parameters not reported for MEWS, APACHE II, the Rothman Index and SOFA EWS.
Parameters not reported for MEWS, APACHE II, the Rothman Index and SOFA EWS.
(141)Alvarez (2013), USA
14-item EWS vs. 6-item MEWS
x Demographic (Age), vital signs (DBP) lab tests (aspartate aminotransferase [AST], PCO2 <22, PCO2>70, WBC >11, platelets <100, Potassium >51), physician orders (arterial blood gas, ECG, stat physician order) and summary variables (high risk floor assignment, MEWS)
Electronic (algorithm-based)
Near-real time data
No
x x x x x Diastolic BP
(102)Badriyah (2014), UK
7-item DTEWS vs. 7-item NEWS
x x x x x x x Electronic (algorithm-based)
Not reported Yes (0-3)
x x x x x x x
(54)Bian (2015), China
5-item Super Score EWS vs. 5-item MEWS
x x x x urine volume, emotional state Paper-based Hourly Yes (0-2)
x x x x x
(142)Bleyer (2011), USA
7-item Critical Vital Sign EWS vs. ViEWS and MEWS
x x x x x x Age Electronic According to physician orders
Yes (0-3)
Not reported in paper.
(41)Boulos (2017), Australia
SIRS EWS vs. qSOFA Not reported in paper. Electronic Not reported Yes (0-4)
Yes (0-3) (154)Churpek (2016), USA
9 machine learning techniques compared to the MEWS
x x x x x x Age, time since ward admission, No. previous ICU stays, electrolytes, creatinine, liver function tests, WBC count; glucose; BUN; platelet count; Hemoglobin; DBP; pulse pressure Index; calcium; bicarbonate; chloride; potassium; anion gap; sodium; alkaline phosphatase; serum glutamic oxaloacetic transaminase; total protein; total bilirubin; albumin
Electronic (algorithm-based)
8-hourly No
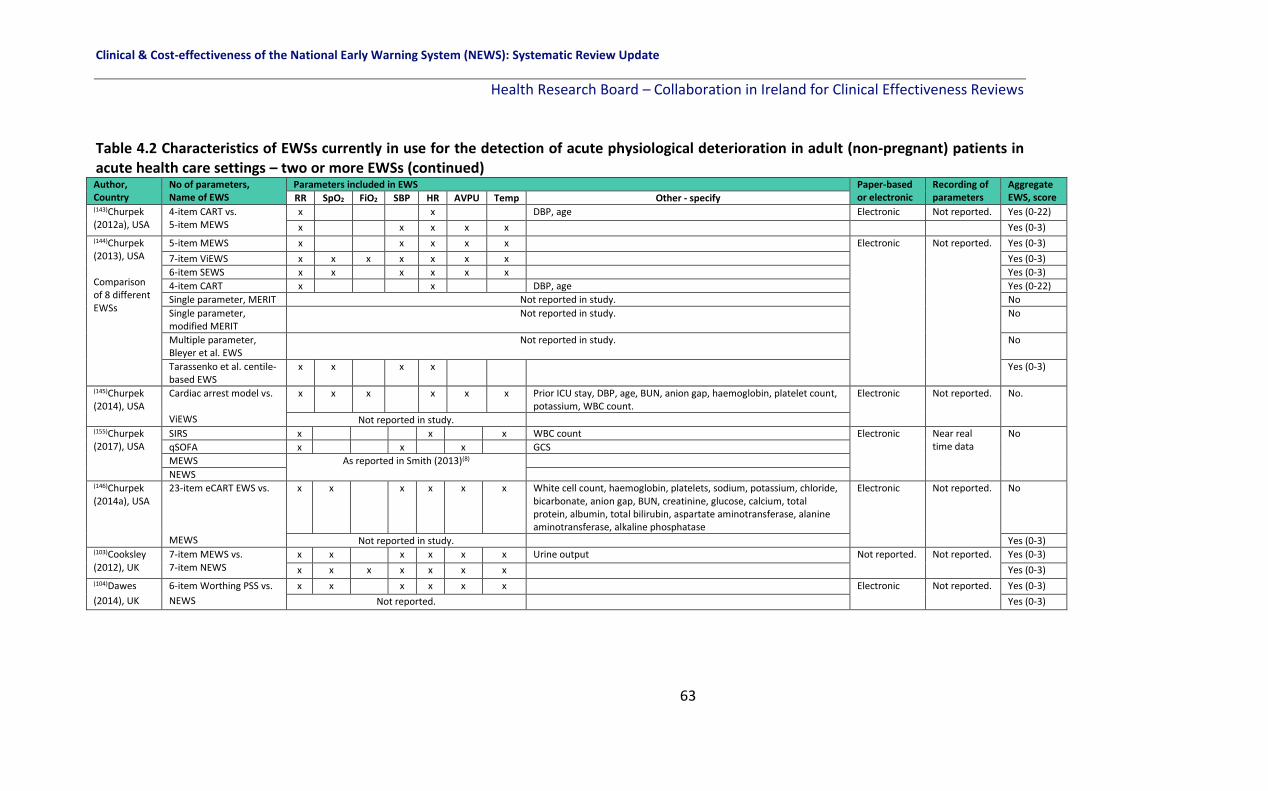
Clinical & Cost-effectiveness of the National Early Warning System (NEWS): Systematic Review Update
Health Research Board – Collaboration in Ireland for Clinical Effectiveness Reviews
63
Table 4.2 Characteristics of EWSs currently in use for the detection of acute physiological deterioration in adult (non-pregnant) patients in acute health care settings – two or more EWSs (continued) Author, Country
No of parameters, Name of EWS
Parameters included in EWS Paper-based or electronic
Recording of parameters
Aggregate EWS, score RR SpO2 FiO2 SBP HR AVPU Temp Other - specify
(143)Churpek (2012a), USA
4-item CART vs. 5-item MEWS
x x DBP, age Electronic Not reported. Yes (0-22)
x x x x x Yes (0-3) (144)Churpek (2013), USA Comparison of 8 different EWSs
5-item MEWS x x x x x Electronic Not reported. Yes (0-3)
7-item ViEWS x x x x x x x Yes (0-3)
6-item SEWS x x x x x x Yes (0-3)
4-item CART x x DBP, age Yes (0-22)
Single parameter, MERIT Not reported in study. No
Single parameter, modified MERIT
Not reported in study. No
Multiple parameter, Bleyer et al. EWS
Not reported in study. No
Tarassenko et al. centile-based EWS
x x x x Yes (0-3)
(145)Churpek (2014), USA
Cardiac arrest model vs. ViEWS
x x x x x x Prior ICU stay, DBP, age, BUN, anion gap, haemoglobin, platelet count, potassium, WBC count.
Electronic Not reported. No.
Not reported in study. (155)Churpek (2017), USA
SIRS x x x WBC count Electronic Near real time data
No
qSOFA x x x GCS
MEWS As reported in Smith (2013)(8)
NEWS (146)Churpek (2014a), USA
23-item eCART EWS vs. MEWS
x x x x x x White cell count, haemoglobin, platelets, sodium, potassium, chloride, bicarbonate, anion gap, BUN, creatinine, glucose, calcium, total protein, albumin, total bilirubin, aspartate aminotransferase, alanine aminotransferase, alkaline phosphatase
Electronic Not reported. No
Not reported in study. Yes (0-3) (103)Cooksley (2012), UK
7-item MEWS vs. 7-item NEWS
x x x x x x Urine output Not reported. Not reported. Yes (0-3)
x x x x x x x Yes (0-3) (104)Dawes
(2014), UK
6-item Worthing PSS vs.
NEWS
x x x x x x Electronic Not reported. Yes (0-3)
Not reported. Yes (0-3)

Clinical & Cost-effectiveness of the National Early Warning System (NEWS): Systematic Review Update
Health Research Board – Collaboration in Ireland for Clinical Effectiveness Reviews
64
Table 4.2 Characteristics of EWSs currently in use for the detection of acute physiological deterioration in adult (non-pregnant) patients in acute health care settings – two or more EWSs (continued) Author,
Country
No of parameters,
Name of EWS
Parameters included in EWS Paper-based
or electronic
Recording of
parameters
Aggregate
EWS, score RR SpO2 FiO2 SB
P
HR AVPU Temp Other - specify
(49)DeMeester
(2013a),
Belgium
6-item MEWS vs. SAPS 3 x x x x x x Paper 12-hourly Yes (0-3)
Not reported.
(13)Eccles
(2014), UK
7-item CREWS vs.
7-item NEWS
x x x x x x x Paper Not reported. Yes (0-3)
x x x x x x x Yes (0-3) (147)Escobar
(2012), USA
14-item electronic EWS
vs.
MEWS
x x x x x x Directive status; LAPS; COPS; COPS status; LOS; time of day; DBP;
lab tests
Electronic Not reported. No
Not reported. Yes (0-3)
(152)Finlay (2014), USA
26-item RI vs. 5-item MEWS
x x x x x DBP, creatinine, BUN, serum chloride, serum potassium, serum sodium, WBC count, haemoglobin, Braden scale, neurological, genitourinary, respiratory, food, skin, GI, musculoskeletal, cardiac, psychosocial, safety, sinus rhythm
Electronic Not reported. No
x x x x x Yes (0-3) (65)Ghanem-
Zoubi (2011),
Israel
5-item MEWS vs.
14-item SCS vs.
10-item MEDS vs.
7-item REMS
x x x x x
Electronic
Not reported.
Yes (0-3)
x x x x x Age, nursing home resident, mental status, functional status,
diabetes (1 or 2), new stroke on presentation, coma without
intoxication or overdose, breathless on presentation, abnormal
ECG
Not
reported
x x Age, nursing home resident, mental status, terminal illness, lower
RTI, septic shock, platelet count, percent bands in differential
count.
Not
reported
x x x x Age, MAP, GCS Not
reported. (111)Hodgson
(2017), UK
NEWS vs. CREWS vs.
S-NEWS
Not reported Electronic Not reported Not
reported

Clinical & Cost-effectiveness of the National Early Warning System (NEWS): Systematic Review Update
Health Research Board – Collaboration in Ireland for Clinical Effectiveness Reviews
65
Table 4.2 Characteristics of EWSs currently in use for the detection of acute physiological deterioration in adult (non-pregnant) patients in
acute health care settings – two or more EWSs (continued)
Author, Country
No of parameters, Name of EWSs
Parameters included in EWSs Paper-based or electronic
Recording of parameters
Aggregate EWS, score RR SpO2 FiO2 SBP HR AVPU Temp Other - specify
(105)Jarvis (2015b), UK
7-item binary NEWS vs. x x x x x x x Electronic Not reported. Yes (0-1)
7-item NEWS x x x x x x x
(106)Jarvis (2015c), UK
Compared 35 published EWS—33 previously compared by Smith et al(8) the CART model and the centiles EWS.
x x x x x x x DBP, age Electronic Not reported. Varies – 35 different EWSs
(73)Jo (2013), South Korea
VIEWS-L compared to HOTEL, APACHE II, SAPS II, SAPS III and VIEWS EWS
x x x x x x x Lactate level (using arterial blood or venous blood lactate levels)
Not reported. Not reported. Yes (0-3)
Not reported. Not reported.
(156)Kipnis (2016) USA
AAM model compared to the NEWS and eCART
x x x x x DBP, neurological status, shock index, lab tests (anion gap, bicarbonate, glucose, hematocrit, lactate, BUN, creatinine, sodium, troponin, WBC count) LAPS2, COPS2, LOS, age, sex, care directive, season, time of day, admission category, hospital
Electronic (algorithm-based)
4-8 hourly No
Not reported (70)Luís (2017), Portugal
‘Short NEWS’ vs. 7-item NEWS
x x x x x x Electronic Not reported Yes (0-3)
x x x x x x x Yes (0-3)

Clinical & Cost-effectiveness of the National Early Warning System (NEWS): Systematic Review Update
Health Research Board – Collaboration in Ireland for Clinical Effectiveness Reviews
66
Table 4.2 Characteristics of EWSs currently in use for the detection of acute physiological deterioration in adult (non-pregnant) patients in
acute health care settings – two or more EWSs (continued) Author, Country
No of parameters, Name of EWSs
Parameters included in NEWS Paper-based or electronic
Recording of parameters
Aggregate EWS, score RR SpO2 FiO2 SBP HR AVPU Temp Other - specify
(148)Moseson (2014), USA
Compared 7-item REMS, 7-item MEWS, 6-item Seymour EWS and 6-item PEDS (ED-based EWSs) to 18-item SAPS II, 18-item APACHE II, and 31-item APACHE III (ICU-based EWS)
x x x MAP, pulse oximetry, GCS total, age. Electronic Not reported. Not reported.
x x x x GCS visual, GCS motor, GCS speech.
x x x Pulse oximetry, GCS total, age
x GCS total, metastatic cancer, serum glucose, serum bicarbonate, WBC
x x x x GCS total, age, metastatic cancer, hematologic malignancy, AIDS, medical admission, unplanned surgery, serum bicarbonate, WBC, 24-hr urine, serum BUN, serum potassium, serum sodium, serum bilirubin
x x x x MAP, GCS total, age, chronic disease and elective post-op, chronic disease and emergency post-op, chronic disease and non-operative, immunosuppressed, WBC, hematocrit, serum Cr, serum potassium, serum sodium, A-a gradient, pH on ABG, acute renal failure.
x x x MAP, GCS, visual, motor and speech, age, chronic disease and elective post-op, chronic disease and non-operative, metastatic cancer, hematologic malignancy, Immunosuppressed, AIDS, hepatic failure/cirrhosis, serum glucose, WBC, hematocrit, urine output, serum Cr, serum BUN, serum potassium, serum sodium, serum bilirubin, PaO2/FiO2, A-a gradient, pH on ABG, pCO2 on ABG, renal failure.
(60)Pedersen (2018), Denmark
7-item NEWS vs. x x x x x x x Electronic Near-real time
Yes (0-3)
7-item CROS vs. x x x x x x x Option for doctors to apply acceptable chronic value limits to all parameters except temperature for individual patients. NEWS variable values within the acceptable chronic value limits do not generate points. NEWS variable values outside the acceptable chronic limits generate the full NEWS points for that variable value.
7-item CREWS vs. x x x x x x x Points as in NEWS, except modified score for arterial oxygen saturation in patients with chronic hypoxaemia
7-item S-NEWS x x x x x x x Points as in NEWS, except modified score for arterial oxygen saturation based on an individual target range in patients with chronic hypoxaemia (usually 88-92%)
(112)Pimentel (2018), UK
7-item NEWS x x x x x x x Electronic Real-time Yes (0-3)
7-item NEWS2 x x x x x x x Differs in weights assigned to SpO2 only (below 88%) Yes (0-3)

Clinical & Cost-effectiveness of the National Early Warning System (NEWS): Systematic Review Update
Health Research Board – Collaboration in Ireland for Clinical Effectiveness Reviews
67
Table 4.2 Characteristics of EWSs currently in use for the detection of acute physiological deterioration in adult (non-pregnant) patients in
acute health care settings – two or more EWSs (continued) Author, Country
No of parameters, Name of EWSs
Parameters included in EWSs Paper-based or electronic
Recording of parameters
Aggregate EWS, score RR SpO2 FiO2 SBP HR AVPU Temp Other – specify
(56) Qin (2017), China
APACHE II vs. Not reported Not reported
Not reported
Not reported
Shock index vs. HR/SBP
SOFA vs. Not reported
7-item MEWS x x x x x Age, consciousness Yes (0-3) (75)Reini (2012), Sweden
5-item MEWS vs. SOFA and SAPS III
x x x x x Not reported.
Hourly Yes (0-3)
Not reported. Not reported.
Not reported. Not reported. (149)Romero-Brufau (2014), USA
Single item RRT calling criteria compared to MEWS, SEWS, GMEWS, Worthing, ViEWS and NEWS EWS
x x x x Electronic Not reported.
No
Not reported for comparison EWSs. Yes (0-3)
(150)Rothman (2013), USA
26-item RI compared to MEWS and APACHE III. MEWS and APACHE III.
x x x x x DBP, nursing assessments (cardiac, respiratory, GI, genitourinary, neurological, skin, safety, peripheral vascular, food/nutrition, psychosocial, musculoskeletal, Braden score), lab(creatinine, sodium, chloride, potassium, BUN, WBC, haemoglobin), cardiac rhythm.
Electronic 4-hourly No
Not reported for comparison EWSs. Yes (0-3) (113)Smith (2016), UK
NEWS vs. 44 different MET criteria
x x x x x x x DBP, date and time of observation set Electronic Not reported
Yes (0-3)
x x x x x x x Threatened airway, respiratory/cardiac arrest, GCS, seizure, concern
No
(8)Smith (2013), UK
7-item NEWS compared to 33 other EWSs.
x x x x x x x Electronic Not reported.
Yes (0-3)
Not reported. (107)Subbe (2017), UK
NEWS, CREWS or palliative NEWS (without a trigger) as appropriate
x x x x x x x Electronic 12-hourly Yes (0-3)
(55)Xiao (2012), China
8-item AFSS EWS vs. MEWS x x x MAP, age, past medical history, fever course, WBC count. Electronic Not reported.
Yes (0-3)
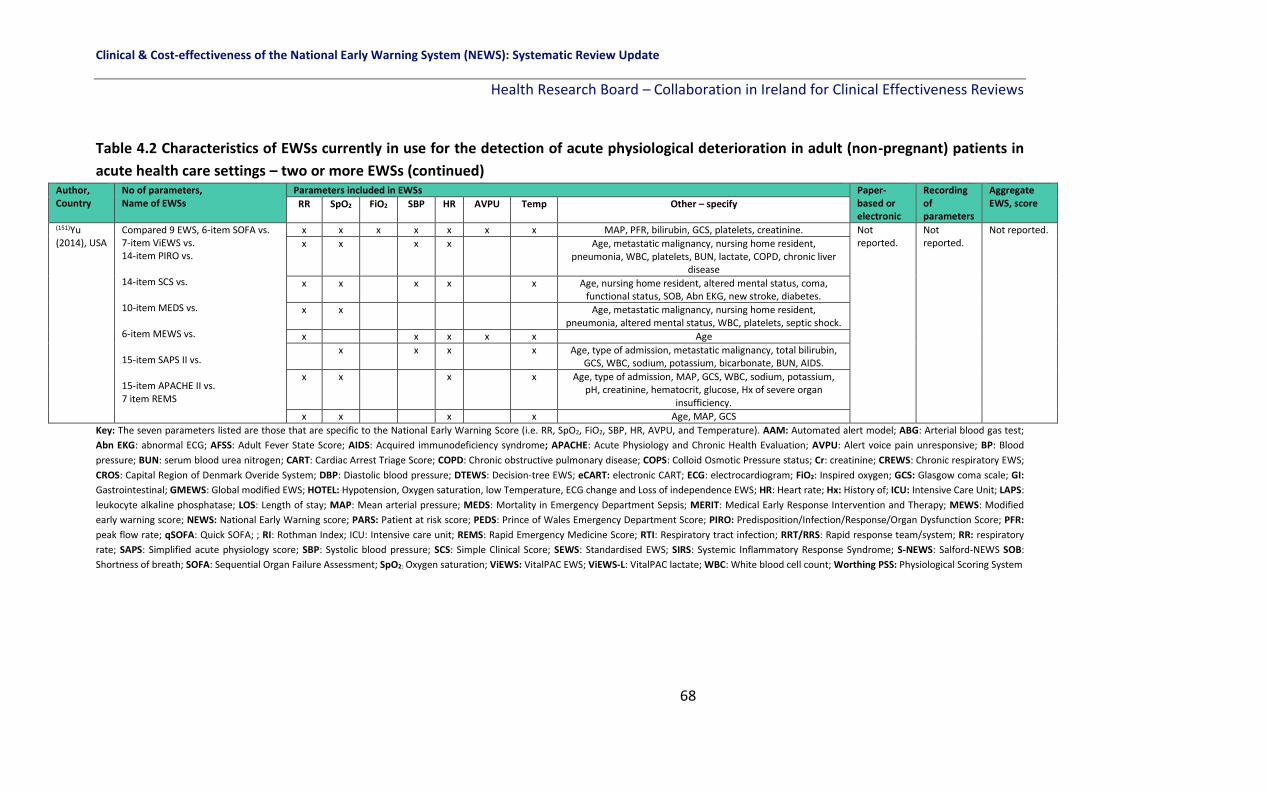
Clinical & Cost-effectiveness of the National Early Warning System (NEWS): Systematic Review Update
Health Research Board – Collaboration in Ireland for Clinical Effectiveness Reviews
68
Table 4.2 Characteristics of EWSs currently in use for the detection of acute physiological deterioration in adult (non-pregnant) patients in
acute health care settings – two or more EWSs (continued) Author, Country
No of parameters, Name of EWSs
Parameters included in EWSs Paper-based or electronic
Recording of parameters
Aggregate EWS, score RR SpO2 FiO2 SBP HR AVPU Temp Other – specify
(151)Yu (2014), USA
Compared 9 EWS, 6-item SOFA vs. 7-item ViEWS vs. 14-item PIRO vs. 14-item SCS vs. 10-item MEDS vs. 6-item MEWS vs. 15-item SAPS II vs. 15-item APACHE II vs. 7 item REMS
x x x x x x x MAP, PFR, bilirubin, GCS, platelets, creatinine. Not reported.
Not reported.
Not reported.
x x x x Age, metastatic malignancy, nursing home resident, pneumonia, WBC, platelets, BUN, lactate, COPD, chronic liver
disease
x x x x x Age, nursing home resident, altered mental status, coma, functional status, SOB, Abn EKG, new stroke, diabetes.
x x Age, metastatic malignancy, nursing home resident, pneumonia, altered mental status, WBC, platelets, septic shock.
x x x x x Age
x x x x Age, type of admission, metastatic malignancy, total bilirubin, GCS, WBC, sodium, potassium, bicarbonate, BUN, AIDS.
x x x x Age, type of admission, MAP, GCS, WBC, sodium, potassium, pH, creatinine, hematocrit, glucose, Hx of severe organ
insufficiency.
x x x x Age, MAP, GCS
Key: The seven parameters listed are those that are specific to the National Early Warning Score (i.e. RR, SpO2, FiO2, SBP, HR, AVPU, and Temperature). AAM: Automated alert model; ABG: Arterial blood gas test;
Abn EKG: abnormal ECG; AFSS: Adult Fever State Score; AIDS: Acquired immunodeficiency syndrome; APACHE: Acute Physiology and Chronic Health Evaluation; AVPU: Alert voice pain unresponsive; BP: Blood
pressure; BUN: serum blood urea nitrogen; CART: Cardiac Arrest Triage Score; COPD: Chronic obstructive pulmonary disease; COPS: Colloid Osmotic Pressure status; Cr: creatinine; CREWS: Chronic respiratory EWS;
CROS: Capital Region of Denmark Overide System; DBP: Diastolic blood pressure; DTEWS: Decision-tree EWS; eCART: electronic CART; ECG: electrocardiogram; FiO2: Inspired oxygen; GCS: Glasgow coma scale; GI:
Gastrointestinal; GMEWS: Global modified EWS; HOTEL: Hypotension, Oxygen saturation, low Temperature, ECG change and Loss of independence EWS; HR: Heart rate; Hx: History of; ICU: Intensive Care Unit; LAPS:
leukocyte alkaline phosphatase; LOS: Length of stay; MAP: Mean arterial pressure; MEDS: Mortality in Emergency Department Sepsis; MERIT: Medical Early Response Intervention and Therapy; MEWS: Modified
early warning score; NEWS: National Early Warning score; PARS: Patient at risk score; PEDS: Prince of Wales Emergency Department Score; PIRO: Predisposition/Infection/Response/Organ Dysfunction Score; PFR:
peak flow rate; qSOFA: Quick SOFA; ; RI: Rothman Index; ICU: Intensive care unit; REMS: Rapid Emergency Medicine Score; RTI: Respiratory tract infection; RRT/RRS: Rapid response team/system; RR: respiratory
rate; SAPS: Simplified acute physiology score; SBP: Systolic blood pressure; SCS: Simple Clinical Score; SEWS: Standardised EWS; SIRS: Systemic Inflammatory Response Syndrome; S-NEWS: Salford-NEWS SOB:
Shortness of breath; SOFA: Sequential Organ Failure Assessment; SpO2: Oxygen saturation; ViEWS: VitalPAC EWS; ViEWS-L: VitalPAC lactate; WBC: White blood cell count; Worthing PSS: Physiological Scoring System

Clinical & Cost-effectiveness of the National Early Warning System (NEWS): Systematic Review Update
Health Research Board – Collaboration in Ireland for Clinical Effectiveness Reviews
69
Table 4.3 Characteristics of EWSs currently in use for the detection of acute physiological deterioration in adult (non-pregnant) patients in
acute health care settings – EWS chart design-based interventions
Author,
Country
Study design, Setting Sample size, Study
duration
Paper-based or
electronic chart
Intervention Data collection Parameters
recorded on
chart, Frequency (42)Christofidis
(2013),
Australia
Quasi-experimental (mixed-
design with chart experience
group[between subjects] and
chart-type [within subjects] as
independent variables);
two hospitals in Queensland
N=64 doctors and nurses
with prior track and
trigger EWS chart
experience and N=37
participants with
experience of EWS
charts (without a track
and trigger component)
recruited between Sept
2010 and Apr 2011.
Paper-based The study focuses on chart design. 6
different chart designs based on the adult
deterioration detection system (ADDS) EWS
were compared. Across 48 trials,
participants viewed each set of patient data
once. The 6 chart designs were each used
on 8 trials, 4 times with abnormal patient
data and 4 times with normal patient data in
a random order and participants judged
whether data observations were abnormal
or normal. Responses and response times
recorded in computerised programme.
Participants completed baseline
questionnaire assessing clinical
background. Training video presented
in a random order to each participant
was then viewed. Participant’s
knowledge of normal parameter
ranges tested in 10-item MCQ.
RR, SpO2, FiO2,
SBP, DBP, HR,
temperature,
urine output and
level of
consciousness.
Not reported.
(43)Christofidis
(2014),
Australia
3x2x2 mixed design quasi
experimental trial with 3
independent variables
(participant group, graph
format (separate versus
overlapping) and alert system
(track and trigger present
versus absent)); Brisbane
University and tertiary
hospital.
N=41 nurses purposively
sampled and N=113
novice chart users
conveniently sampled
from undergraduate
psychology programme,
recruited Jan and May
2011.
Paper-based Comparison of 4 chart designs for BP and HR
compared.
1) separate graphs for BP, HR
2) overlapping graphs for BP, HR
3) Integrated colour-based track and trigger
system present
4) No track and trigger system present.
Two groups: all nurses and a random
selection of novices were assigned to watch
a video on the ‘Seagull method’. Remaining
novices were ‘untrained’. The seagull sign
equates to a shock index score (e.g. heart
rate) physiologically.
N=64 cases of genuine de-identified
patient data, collected from several
Australian hospitals used. Each case
spanned 13 consecutive time points
and included data for the 3 vital signs
relevant to the ‘Seagull Sign’: SBP,
DBP and HR. Four chart design
extracts, based on observation chart
designs currently used in Australia
were created for use in this study.
BP, HR
Not reported.

Clinical & Cost-effectiveness of the National Early Warning System (NEWS): Systematic Review Update
Health Research Board – Collaboration in Ireland for Clinical Effectiveness Reviews
70
Table 4.3 Characteristics of EWSs currently in use for the detection of acute physiological deterioration in adult (non-pregnant) patients in acute health care settings – EWS chart design-based interventions (continued)
Author,
Country
Study design, Setting Sample size, Study
duration
Paper-based or
electronic chart
Intervention Data collection Parameters
recorded on
chart, Frequency (44)Christofidis
(2015),
Australia
Quasi-experimental factorial
design (within-subjects, with
scoring system design as the
independent variable);
University of Queensland
N=47 novice chart users
who received course
credit for participation
Dec 2012 and Jan 2013.
Paper-based The different ADDS based chart designs
used in the experiment, varied only in
relation to the arrangement of the rows for
recording individual vital sign scores. These
scoring-rows were either:
1. grouped together beneath all of the vital
sign data (‘grouped rows’);
2. separated, with each row presented
immediately below the corresponding vital
sign data (‘separate rows’) or
3. excluded altogether (‘no rows’).
All 3 chart designs included a row for
recording overall early-warning scores at
the bottom of the page
Novice chart-users were presented with realistic vital sign observations recorded on charts with 3 different scoring-system designs. Participants’ response times and error rates for determining the overall scores were measured for 54 time-points per design. Each chart design was used on 3 blocks of trials (i.e. 54 trials per design) and the 9 cases were randomly assigned to the 3 chart designs for each participant. To prevent order effects, the blocks were presented in a different random order for each participant.
RR, SpO2, FiO2,
SBP, DBP, HR,
Temperature,
urine output,
level of
consciousness.
Not reported.
(108)Fung (2014),
UK
Observational cohort study;
Department of Surgery,
Basildon and Thurrock
University Hospitals, UK.
N=100 HCPs including
n=53 foundation year
physicians, n=8 senior
house officers, n=7
specialist registrars, n=6
ward sisters and n=26
registered nurses; Study
dates not reported.
Paper-based PARS implemented as part of the Leading
Improvements in Patient Safety Programme
(LIPS) within hospital. This revised chart
aimed to improve the detection and
management of deteriorating patients by
incorporating early warning scores with
routine observations. 6 clinical scenarios
(low-grade temperature, spiking
temperature, tachypnea, Cushing’s
response, hypovolemic shock and normal
observations) were identically depicted on
old and new charts, creating 12 charts.
100 health care professionals were asked to study each of the charts, and the time taken to give a diagnosis was recorded. Time taken and accuracy of response were compared between the 2 charts. Old chart: graphic depiction of observations; New chart: EWS numerically depicted
observations
RR, SpO2, SBP, HR,
AVPU,
Temperature,
Urine output.
Not reported.
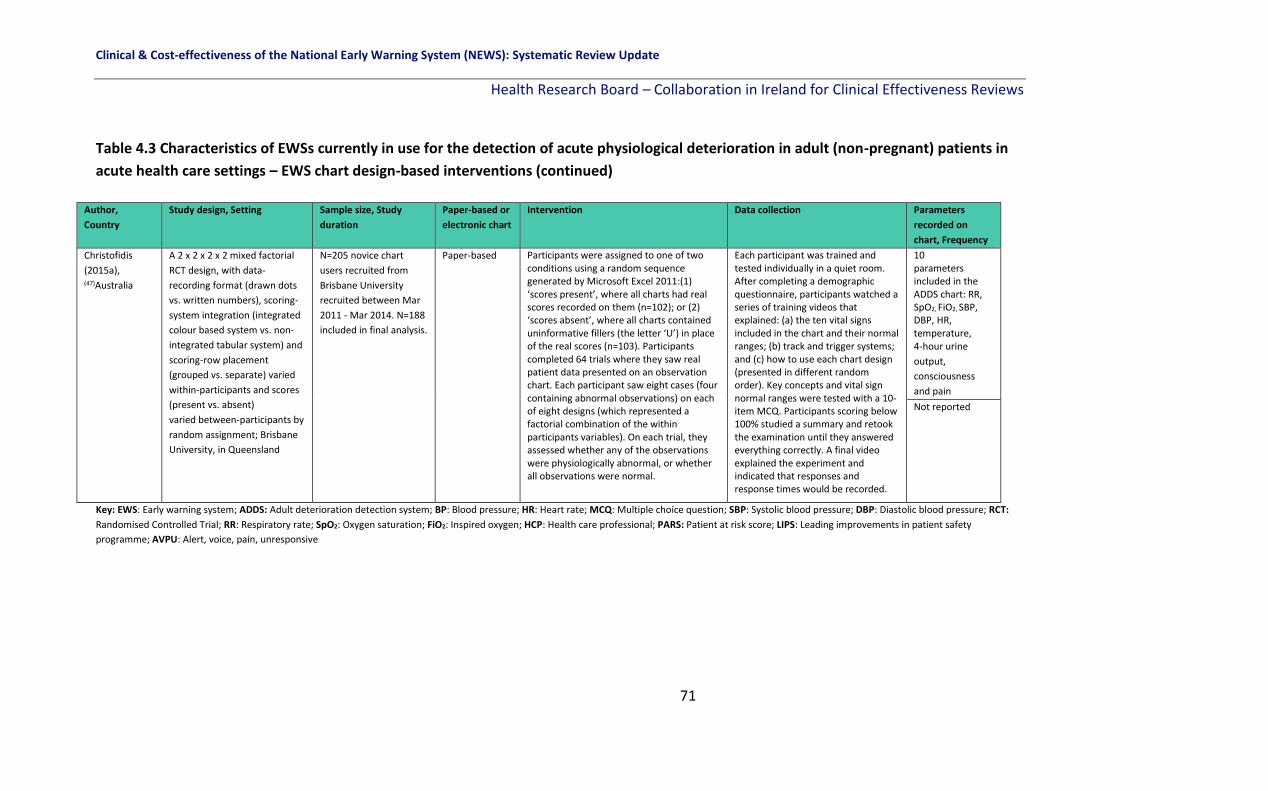
Clinical & Cost-effectiveness of the National Early Warning System (NEWS): Systematic Review Update
Health Research Board – Collaboration in Ireland for Clinical Effectiveness Reviews
71
Table 4.3 Characteristics of EWSs currently in use for the detection of acute physiological deterioration in adult (non-pregnant) patients in
acute health care settings – EWS chart design-based interventions (continued)
Author,
Country
Study design, Setting Sample size, Study
duration
Paper-based or
electronic chart
Intervention Data collection Parameters
recorded on
chart, Frequency
Christofidis
(2015a), (47)Australia
A 2 x 2 x 2 x 2 mixed factorial
RCT design, with data-
recording format (drawn dots
vs. written numbers), scoring-
system integration (integrated
colour based system vs. non-
integrated tabular system) and
scoring-row placement
(grouped vs. separate) varied
within-participants and scores
(present vs. absent)
varied between-participants by
random assignment; Brisbane
University, in Queensland
N=205 novice chart
users recruited from
Brisbane University
recruited between Mar
2011 - Mar 2014. N=188
included in final analysis.
Paper-based Participants were assigned to one of two conditions using a random sequence generated by Microsoft Excel 2011:(1) ‘scores present’, where all charts had real scores recorded on them (n=102); or (2) ‘scores absent’, where all charts contained uninformative fillers (the letter ‘U’) in place of the real scores (n=103). Participants completed 64 trials where they saw real patient data presented on an observation chart. Each participant saw eight cases (four containing abnormal observations) on each of eight designs (which represented a factorial combination of the within participants variables). On each trial, they assessed whether any of the observations were physiologically abnormal, or whether all observations were normal.
Each participant was trained and tested individually in a quiet room. After completing a demographic questionnaire, participants watched a series of training videos that explained: (a) the ten vital signs included in the chart and their normal ranges; (b) track and trigger systems; and (c) how to use each chart design (presented in different random order). Key concepts and vital sign normal ranges were tested with a 10-item MCQ. Participants scoring below 100% studied a summary and retook the examination until they answered everything correctly. A final video explained the experiment and indicated that responses and response times would be recorded.
10 parameters included in the ADDS chart: RR, SpO2, FiO2, SBP, DBP, HR, temperature, 4-hour urine
output,
consciousness
and pain
Not reported
Key: EWS: Early warning system; ADDS: Adult deterioration detection system; BP: Blood pressure; HR: Heart rate; MCQ: Multiple choice question; SBP: Systolic blood pressure; DBP: Diastolic blood pressure; RCT:
Randomised Controlled Trial; RR: Respiratory rate; SpO2: Oxygen saturation; FiO2: Inspired oxygen; HCP: Health care professional; PARS: Patient at risk score; LIPS: Leading improvements in patient safety
programme; AVPU: Alert, voice, pain, unresponsive

Clinical & Cost-effectiveness of the National Early Warning System (NEWS): Systematic Review Update
Health Research Board – Collaboration in Ireland for Clinical Effectiveness Reviews
72
4.3 Summary
In total, 123 studies conducted across 22 different countries were eligible for inclusion in
this descriptive overview of EWSs in adult (non-pregnant) populations. The EWSs varied
with 47 different named EWSs included (for example the NEWS, ViEWS, etc.), 13 unnamed
EWSs, 23 studies which only included a single criterion for activating the emergency
response system and two studies which did not provide details on the EWSs included. In
addition, not only did the EWSs vary, but the number, type and frequency of measurement
of vital sign parameters included varied with some studies having as little as two and one
algorithm-based EWS including almost 400 parameters. The majority of the 79 studies,
where it was reported, included electronic rather than paper based EWSs and 44 studies did
not report or it was not clear, what type of EWS it was. Importantly, the majority of the 123
studies did not report how often parameters were measured (n=83) which can effect
performance of an EWS, and where they did, it varied from study to study. There were 71
studies which included one or more aggregated EWSs and the weighting varied across
studies.
Overall, a large number of EWSs have been described in the literature and reported in this
descriptive overview. However these vary in many ways, making it difficult to compare the
systems.

Clinical & Cost-effectiveness of the National Early Warning System (NEWS): Systematic Review Update
Health Research Board – Collaboration in Ireland for Clinical Effectiveness Reviews
73
5 Results: The impact on patient outcomes and resource utilisation of early warning systems interventions for the detection of physiological deterioration in adult (non-pregnant) patients in acute health care settings
5.1 Chapter overview
This chapter in the systematic review focusses on the literature pertinent to question two of
the review. “How effective are the different EWSs in terms of improving key patient
outcomes in adult (non-pregnant) patients in acute health care settings?” This specific
chapter reports on the afferent limb (i.e. recognition and escalation based-early warning
systems) and their effectiveness in terms of the primary outcomes (mortality, cardiac arrest,
length of stay, transfer or admission to the ICU), and secondary outcomes (clinical
deterioration in sub-populations, PROMs [validated tools] and any other outcomes
identified post-hoc).
5.2 Overview of studies focusing on the effectiveness of EWSs
There were 21 studies which focussed on the effectiveness of EWSs on various patient
outcomes and resource utilisation.(48, 49, 57, 59, 66, 68, 69, 78, 79, 88, 91, 97, 99, 107, 109, 114, 118, 131, 132, 137,
153) These included three RCTs,(59, 118, 132) two nRCTs,(79, 107) one interrupted time series(57)and
15 observational studies (including before-after studies and cohort studies).(48, 49, 66, 68, 69, 78,
88, 91, 97, 99, 109, 114, 131, 137, 153) Sample size ranged from 39 patients in one study(131) to 105,647
in another(99) and was not reported in one study(114) (Table 5.1).
5.3 Overview of the early warning systems interventions
The type of EWS intervention varied from study to study. Ten of the 21 studies implemented
some form of a MEWS intervention, including MEWS with a colour graphic observation
chart;(49) MEWS with SBAR and ABCDE;(48) MEWS with a detailed protocol for escalation;(78,
153) MEWS (measured a minimum of three times daily) compared with as clinically
indicated;(79) electronic calculation of MEWS using the patient medical record;(68, 137) a

Clinical & Cost-effectiveness of the National Early Warning System (NEWS): Systematic Review Update
Health Research Board – Collaboration in Ireland for Clinical Effectiveness Reviews
74
Quality Improvement Project (QIP) study launched a framework for evaluating the impact of
an electronic MEWS;(131) MEWS introduced with the existing Critical Care Outreach Service
(CCOS);(97) and MEWS calculated by the anaesthetist to select the correct level of care (HDU
or ICU) following surgery(66) (Table 5.1).
Of the remaining 11 studies, two studies used real-time or near real-time alerts, based on an
algorithm, that were sent to nurses when patients had abnormal vital sign
measurements.(114, 118) The NEWS was implemented in one study by means of a user friendly
vital signs chart and a detailed protocol for action based on different NEWS scores.(109)
Another study incorporated the systematic use of a validated EWS (unnamed) by doctors
and nurses, a new colour-coded observation chart and a protocol for bedside action when
abnormal vital sign scores were present.(57) One study introduced ADDS with a protocol for
action.(69) One study incorporated the ELPQuiC bundle, a five part QIP bundle, one part of
which was the use of an EWS (with no other details provided).(91) Another study used
‘Patientrack’, an electronic EWS with automated electronic alerts to the doctor.(88) One
study introduced the EPSS EWS using VitalPAC handheld devices.(99) One study used
electronic automated monitoring of patients applying NEWS, CREWS or palliative NEWS as
appropriate.(107) Another study looked at whether EWS measurements at 8 hour intervals
are associated with better outcomes than 12 hour intervals.(59) A further study focused on
whether an EWS could identify patients wishing to focus on palliative care measures using
scripted recommendations(132) (Table 5.1).
5.4 Primary outcomes
5.4.1 Mortality
Thirteen of the 21 studies examined the effectiveness of EWSs on mortality with no overall
clear effect on this outcome.(48, 57, 59, 66, 68, 88, 91, 97, 99, 107, 109, 118, 132)
Mortality was considered in all three RCTs, one of which reported a statistically significant
effect. Bailey et al.,(118) investigated the effect of introducing real-time algorithm-based

Clinical & Cost-effectiveness of the National Early Warning System (NEWS): Systematic Review Update
Health Research Board – Collaboration in Ireland for Clinical Effectiveness Reviews
75
alerts (intervention group) compared to no alert (control group) on general medical ward
patient mortality. This intervention notifying the nurse of the patient at risk did not improve
outcomes (Patients with alerts were at 8.9-fold greater risk of death [95% CI: 7.4%-10.7%]
than those without alerts [244 of 2,353 (10.4%; 95% CI: 9.2%-11.7%) vs 206 of 17,678 (1.2%;
95% CI: 1.0%-1.3%)], respectively; P<0.0001). Petersen et al.,(59) aimed to explore whether
EWS measurements at 8 hour intervals (intervention group) were associated with better
outcomes than 12 hour intervals (control). There was no significant difference in 72-hour
mortality between groups (one patient died within each group) or in 30-day mortality where
1.1% and 1.8% (p=0.36) in the 8 hour group and 12 hour group died, respectively. Picker et
al.,(132) conducted a pilot study to determine whether an EWS could identify patients wishing
to focus on palliative care measures. Scripted recommendations were given by the primary
medical team to patients in the intervention group. Control group patients received no such
recommendations. No significant difference in-hospital mortality was found between the
intervention (n=11, 12.4%) and control group (n=12, 10.3%), (p=0.64) (Table 5.1).
One nRCT examined the effectiveness of an EWS on mortality and reported a significant
reduction. Subbe et al.,(107) investigated the mortality rate in the intervention group (an
electronic automated vital sign monitoring system which sent alerts to the RRT) and control
group (no alert sent to the RRT). In the intervention group there was a 6.5% mortality rate
compared to an 8.1% mortality rate in the control group (difference 1.59%, 95% CI 0.05–
3.13%, p=0.04). Reduced mortality was maintained in stepwise binary logistic regression
analysis including age, gender and acuity (measured by type of ward) at step 1: there was
reduced mortality for patients admitted during the intervention period (OR = 0.79, 95% CI
0.63–0.99; p=0.043). The same was true for the rate of patients with cardiopulmonary arrest
(OR = 0.15, 95% CI 0.03–0.64; p = 0.011) (Table 5.1).
One interrupted time series considered mortality, the study, where the systematic use of an
EWS was implemented along with a colour-coded observation chart and a protocol for
bedside action, investigated the effect on unexpected mortality in patients with mainly

Clinical & Cost-effectiveness of the National Early Warning System (NEWS): Systematic Review Update
Health Research Board – Collaboration in Ireland for Clinical Effectiveness Reviews
76
gastro-intestinal (GI) disorders.(57) Pre-intervention the unexpected mortality rate was 61
per 100 patient admission years. One year post-intervention, this had reduced to 25 per 100
patient admission years (p=0.053) and two years post-intervention this has reduced
significantly to 17 per 100 patient years (p=0.013).
Eight before and after observational studies considered mortality and four found a
significant effect. A retrospective QIP study by Huddart et al.(91) investigated the effect of
implementing a five-part bundle (ELPQuiC), which included the use of an EWS on 30-day
mortality. Before the implementation of ELPQuiC bundle, the case-mix adjusted risk of 30-
day mortality was 15.6 per 100 patients treated. After implementation it was 9.6 per 100
(p=0.003). A study by Jones et al.,(88) where the Patientrack EWS which sent automated
alerts was introduced, investigated the effect on hospital mortality. Before Patientrack was
introduced there were 67 hospital deaths (9.5%) compared to afterwards when there were
59 hospital deaths (7.6%), p=0.19.
A retrospective study where a system was introduced to calculate a MEWS automatically
using electronic medical health records examined in-hospital deaths.(68) Before the system
was introduced the in-hospital death rate was 36.3 per 1,000 admissions. After the
automatic system was introduced the in-hospital death rate was 35.4 per 1,000 (p>0.05).
Another retrospective study where a MEWS was introduced alongside the pre-existing CCOS
investigated the mortality rate.(97) Pre-MEWs the rate was 3.22 per 1,000 admissions. Post-
MEWS it was 2.29 per 1,000 admissions, p=0.09. A study by Peris et al.,(66) investigated
whether calculating MEWS before and after-surgery by an anaesthetist would improve
mortality. In the intervention group in whom MEWS was calculated there were 32 deaths
(7%) compared to the control group, where MEWS was not calculated, where 48 patients
died (8%) (reported as not significant). A study by Meester et al.(48) considering a MEWS,
SBAR and ABCDE intervention investigated the effect on unexpected death rates (death
without DNR). Before the intervention the rate of unexpected death was 0.99 per 1,000
admissions. After the intervention this reduced to 0.34 per 1,000 admissions (p<0.001).

Clinical & Cost-effectiveness of the National Early Warning System (NEWS): Systematic Review Update
Health Research Board – Collaboration in Ireland for Clinical Effectiveness Reviews
77
A retrospective study compared mortality in two different hospitals before and after the
introduction of the EPSS EWS, an electronic EWS utilising handheld devices and the VitalPAC
software.(99) In the Queen Alexandra hospital (QAH), the mortality rate was 7.75% before
and 6.42% after (p<0.0001) equating to 397 fewer deaths. In the University Hospital
Coventry (UHC), the mortality rate was 7.57% before and 6.15% after (p<0.0001), equating
to 372 fewer deaths. A retrospective before-after study based in a London University
hospital using the NEWS reported a non-significant increase in mortality (Before: n=190,
After: n=234, described as not significant – no statistical estimate provided), (Table 5.1).(109)
5.4.2 Cardiac arrest
Seven of the 21 studies examined the effectiveness of EWSs on cardiac arrest with no clear
effect on this outcome.(57, 68, 69, 88, 107, 114, 137)
One nRCT examined the effectiveness of an EWS on cardiac arrest reporting a significant
reduction. Subbe et al.,(107) investigated the cardiac arrest rate in the intervention group (an
electronic automated vital sign monitoring system which sent alerts to the RRT) and control
group (no alert sent to the RRT). In the intervention group there was 0.8 cardiac arrests per
1,000 discharges compared to 6.5 per 1,000 discharges in the control group (p=0.002).
Reduced cardiac arrest rates were maintained in stepwise binary logistic regression analysis
including age, gender and acuity (measured by type of ward) at step 1: there were reduced
rates for patients admitted during the intervention period (OR = 0.15, 95% CI 0.03–0.64; p =
0.011), (Table 5.1).
One interrupted time series study investigated cardiac arrests. A study where the systematic
use of an EWS was implemented along with a colour-coded observation chart and a protocol
for bedside action investigated the effect on cardiac arrest rates before and after
implementation in patients with mainly gastro-intestinal (GI) disorders.(57) Pre-intervention
seven patients suffered a cardiac arrest after which five died. Post-intervention three
suffered a cardiac arrest after which two died (no statistical tests reported), (Table 5.1).

Clinical & Cost-effectiveness of the National Early Warning System (NEWS): Systematic Review Update
Health Research Board – Collaboration in Ireland for Clinical Effectiveness Reviews
78
Five before and after observational studies investigated cardiac arrests with two showing a
significant effect. Drower et al.(69) investigated cardiac arrest rates before and after the
implementation of the ADDS chart with a protocol for action. Pre-ADDs there were 4.67
cardiac arrests per 1,000 admissions. Post-ADDS there were 2.91 cardiac arrests per 1,000, a
38% reduction, p=0.005. A retrospective study before and after the implementation of the
VSA EWS investigated the effect of this automated electronic medical record based EWS on
cardiac arrests.(114) Before the VSA was implemented there were 16 cardiac arrests. After
the VSA was implemented there were three cardiac arrests (no statistical test reported). A
study by Jones et al.,(88) where the Patientrack EWS which sent automated alerts was
introduced, investigated the effect on cardiac arrests. Before Patientrack was introduced
there were three cardiac arrests (0.4%) compared to afterwards where there were no
cardiac arrests, p=0.21. A study where a system was introduced to calculate a MEWS
automatically using electronic medical health records examined in-hospital cardiac arrest
rate.(68) Before the system was introduced the in-hospital cardiac arrest rate was 5.21 per
1,000 admissions. After the automatic system was introduced the in-hospital cardiac arrest
rate was 2.39 per 1,000 (p<0.01). A study by Stewart et al.,(137) investigated the number of
cardiopulmonary arrests (CPAs) before and after the implementation of a MEWS into the
electronic health record system. There were 14 CPAs before and 11 CPAs after
implementation (p=0.88), (Table 5.1).
5.4.3 Length of Stay (LOS)
Five of the 21 studies examined the effectiveness of EWSs on LOS, with one study reporting
a significant reduction in LOS.(59, 66, 88, 118, 132)
All three RCTs investigated the effect of EWSs on length of stay with none finding a
significant reduction. Bailey et al.(118) investigated the effect of introducing real-time
algorithm-based alerts (intervention group) compared to no alert (control group) on general
ward patient LOS. This intervention notifying the nurse of the patient at risk did not reduce
the LOS in the intervention group, in fact it was associated with a significantly longer LOS

Clinical & Cost-effectiveness of the National Early Warning System (NEWS): Systematic Review Update
Health Research Board – Collaboration in Ireland for Clinical Effectiveness Reviews
79
(intervention group: 7.01 days; control group: 2.94 days, p<0.001). Petersen et al.,(59) aimed
to explore whether EWS measurements at 8 hour intervals (intervention group) were
associated with better outcomes than 12 hour intervals (control). There was no difference in
LOS between the two groups (intervention median 1.0 days, IQR 0.6-2.3; control median 1.0
days, IQR 0.6-2.2 days, p=0.89). A prospective randomised pilot study to determine whether
an EWS could identify patients wishing to focus on palliative care measures was conducted
by Picker et al.(132) Scripted recommendations were given by the primary medical team to
patients in the intervention group. Control group patients received no such
recommendations. No significant difference in the median hospital LOS was found between
the intervention (median=4 days, IQR 3-11 days) and control group (median 5 days, IQR 3-10
days), (p=0.60), (Table 5.1).
Two before-after observational studies investigated the effect of EWSs on LOS, with one
finding a significant reduction. A study by Jones et al.,(88) where the Patientrack EWS which
sent automated alerts was introduced, investigated the effect on LOS. Before Patientrack
was introduced LOS was 9.7 days (95% CI 4.7-19.8) compared to afterwards where LOS was
6.9 days (95% CI 3.3-13.9), p<0.001). A study by Peris et al.,(66) investigated whether
calculating a MEWS before and after-surgery by an anaesthetist would improve LOS. In the
intervention group where MEWS was calculated hospital mean LOS was 7 ± 10 days. In the
control group the LOS was 8 ± 11 days (no statistical test reported), (Table 5.1).
5.4.4 Transfer or admission to the intensive care unit (ICU)
Ten of the 21 studies examined the effectiveness of EWSs on ICU admission or transfer with
three reporting a significant effect.(48, 57, 59, 66, 88, 107, 109, 118, 132, 153)
Three RCTs investigated the effect of EWSs on ICU admission or transfer and one found a
reduction in ICU rates and one found an increase. Bailey et al.(118) investigated the effect of
introducing real-time algorithm-based alerts (intervention group) compared to no alert
(control group) on ICU transfer for a general ward patient. This intervention notifying the

Clinical & Cost-effectiveness of the National Early Warning System (NEWS): Systematic Review Update
Health Research Board – Collaboration in Ireland for Clinical Effectiveness Reviews
80
nurse of the patient at risk did not improve the transfer rate. Patients meeting the alert
threshold were at nearly 5.3-fold greater risk of ICU transfer (95% CI: 4.6-6.0) than those not
satisfying the alert threshold (358 of 2,353 [15.2%; 95% CI: 13.8%-16.7%] vs 512 of 17,678
[2.9%; 95% CI: 2.7%-3.2%], respectively; p<0.0001). Petersen et al.,(59) aimed to explore
whether EWS measurements at 8 hour intervals (intervention group) were associated with
better outcomes than 12 hour intervals (control). There was no difference in ICU admission
rates between the two groups (p=0.49). A prospective randomised pilot study to determine
whether an EWS could identify patients wishing to focus on palliative care measures was
conducted by Picker et al.(132) Scripted recommendations were given by the primary medical
team to patients in the intervention group. Control group patients received no such
recommendations. A significant difference in ICU transfer was found between the
intervention (n=11, 12.4%) and control group (n=32, 27.4%), (p=0.009), (Table 5.1).
One nRCT examined the effectiveness of EWSs on ICU admission or transfer. A study by
Subbe et al.,(107) investigated the ICU admission rate in the intervention group (an electronic
automated vital sign monitoring system which sent alerts to the RRT) and control group (no
alert sent to the RRT). In the intervention group the ICU admission rate was 9 per 1,000
discharges compared to 12 per 1,000 in the control group (p=0.16), (Table 5.1).
One interrupted time series study investigated the effect of EWSs on ICU admission or
transfer, where the systematic use of an EWS was implemented along with a colour-coded
observation chart and a protocol for bedside action investigated the effect on ICU admission
in patients with mainly GI disorders.(57) Pre intervention 17 patients were admitted to the
ICU, with the same number admitted post-intervention (no statistical test reported).
Five before and after observational studies investigated the effect on ICU admission or
transfer. A study by Jones et al.,(88) where the Patientrack EWS which sent automated alerts
was introduced investigated the effect on critical care utilisation. Before Patientrack was
introduced there were 14 patients admitted (totalling 51 bed days) compared to afterwards
when there were 5 patients admitted (totalling 26 bed days), p=0.04. A study by Farenden

Clinical & Cost-effectiveness of the National Early Warning System (NEWS): Systematic Review Update
Health Research Board – Collaboration in Ireland for Clinical Effectiveness Reviews
81
et al.,(109) where the NEWS was introduced, reported an insignificant increase in ICU
admissions (before: n=44, after: n=54 [not significant – no statistical estimate provided]). A
MEWS, SBAR and ABCDE study investigated the effect on unplanned ICU admissions.(48)
Before intervention the unplanned ICU rate was 13.1 per 1,000 admissions. After
intervention this increased to 14.8 per 1,000 admissions (p=0.001). A study by Peris et al.,(66)
investigated whether calculating a MEWS before and after surgery by an anaesthetist would
improve identification of those in need of transfer to the HDU. In the intervention group
where MEWS was calculated, 102 patients (21%) were admitted to the HDU compared to
the control group where MEWS was not calculated, where 82 patients were admitted to the
HDU (14%) (p=0.0008). The authors also reported the number of patients admitted to the
ICU (n=26, 11% in the intervention group and n=67, 5% in the control group, p=0.001). A
retrospective QIP study,(153) where a protocol employing a lower MEWS score to trigger
escalation was implemented for nurses and a recommendation to check serum lactate level
if infection was suspected, reported that ICU transfer rates ‘remained stable’ (no statistical
estimates or numbers provided), (Table 5.1).
5.5 Secondary outcomes
5.5.1 Clinical deterioration in sub-populations
No study reported on clinical deterioration in specific sub-populations.
5.5.2 Patient reported outcome measures (PROMS)
No study examined the effectivenss of EWSs on PROMS.
5.5.3 Post-hoc identified outcomes
Six post-hoc outcomes including serious adverse events, compliance with EWSs, resource
utilisation, survival to discharge, deterioration at 24 hours and palliative care measures
were identified. These are reported in section 5.5.3.1 to section 5.5.3.6.

Clinical & Cost-effectiveness of the National Early Warning System (NEWS): Systematic Review Update
Health Research Board – Collaboration in Ireland for Clinical Effectiveness Reviews
82
5.5.3.1 Serious adverse events (SAEs)
Serious adverse events (SAEs) were reported in five of the 21 studies with one finding a
significant effect.(48, 49, 57, 79, 109) The definition varied and usually included a composite of
outcomes.
A nRCT by Ludikhuize et al.,(79) where the intervention group measured a MEWS a minimum
of three times daily and the control group measured a MEWS as clinically indicated
investigated the effect on adverse events (defined as unplanned ICU admission and
cardiopulmonary arrests (CPA)). The rate of adverse events in the intervention ward (MEWS
protocol) was 13.4 per 1,000 hospital admissions before and 8.5 per 1,000 hospital
admissions after (difference of 4.9/1000, 95% CI -0.004 to 0.014). In the control group
(MEWS as clinically indicated), the rate of adverse events before was 9.1 per 1,000 and 6.5
per 1,000 after (difference of 2.6/1000, 95% CI -0.006 to 0.012).
Bunkenborg et al.(57) was an interrupted time series study and reported a composite
outcome of unexpected mortality, ICU admission and cardiac arrest as SAEs. Pre-
intervention (introduction of an EWS, observation chart and a protocol for bedside action)
the number of SAEs was 31. Post-intervention this dropped to 21 (no statistical test
reported).
A before-after MEWS observational study by DeMeester et al.(49) defined SAEs as “an
unexpected occurrence involving death or serious physical or psychological injury, or the
risk thereof up to five days post discharge”. Pre-intervention the rate of SAEs was 5.7%.
Post-intervention this reduced to 3.5% (p>0.05). Another before-after MEWS, SBAR and
ABCDE study by DeMeester et al.,(48) defined SAEs as unexpected death (no DNR order),
unplanned ICU admission or cardiac arrest team (CAT) calls. Before the rate of SAEs was 4.4
per 1,000 admissions. After intervention this increased to 6.7 per 1,000 admissions (p<0.05).
A before-after observational study by Farenden et al.,(109) where the NEWS was
implemented, defined SAEs as sepsis or septic shock and found an insignificant increase

Clinical & Cost-effectiveness of the National Early Warning System (NEWS): Systematic Review Update
Health Research Board – Collaboration in Ireland for Clinical Effectiveness Reviews
83
after the NEWS (before: n=69, after: n=98, reported as ‘not significant’ – no statistical
estimates provided), (Table 5.1).
5.5.3.2 Compliance with Early Warning Systems
Compliance with EWSs (including documentation of vital sign parameters, accuracy of
reporting and clinical response) was reported in four of the 21 studies with two showing a
significant effect between those implementing a MEWS compared to those not doing so.(49,
78, 79, 88)
A before-after MEWS observational study by DeMeester et al.,(49) measured the mean
patient observation frequency per nursing shift. The mean patient observation frequency
per nursing shift pre-intervention was 0.999 (95% CI 0.964 – 1.035). Post-intervention the
mean patient observation frequency per nursing shift was 1.073 (95% CI 1.036 – 1.110),
p=0.005. A before-after observational study by Jones et al.,(88) where the Patientrack EWS
which sent automated alerts was introduced, investigated the compliance with EWS
protocol in terms of accuracy of documentation, documentation of clinical response (to a
patient with an EWS of 3, 4 or 5 on recheck as per the EWS protocol) and clinical response
for EWS greater than five (trigger score for escalation and response necessary). Before, the
accuracy of EWS reporting was 27%, compared to 22% after, p=0.07. Documentation of
clinical response was present in 29% before and 78% after (p<0.001). There was a clinical
response to EWS greater than five in 67% of instances before the intervention and in 96% of
instances after the intervention (p<0.003), (Table 5.1).
A prospective cohort study where a MEWS was implemented with a detailed protocol for
escalation reported on the compliance of HCPs with the system.(78) In total, 89% of patients
had their vital sign parameters recorded as per the protocol and 71% were calculated
correctly. A nRCT by Ludikhuize et al.,(79) where the intervention group measured a MEWS a
minimum of three times daily and the control group measured MEWS as clinically indicated,
investigated compliance with the MEWS and RRS protocol. Nurses calculated a MEWS in

Clinical & Cost-effectiveness of the National Early Warning System (NEWS): Systematic Review Update
Health Research Board – Collaboration in Ireland for Clinical Effectiveness Reviews
84
70% (2,513/3,585) of the measurements on protocol wards (intervention) and in 2%
(65/3,013) on control wards (p<0.001). A critical MEWS (≥3) was recorded by nurses in 9%
(338/3,585) on the protocolised compared with 1% (35/3,013) on the control wards.
Comparing the actually documented MEWS with the retrospective MEWS calculations, a
critical MEWS was identified in 11% (381/3,585) on the protocolised compared with 7%
(217/3,013) on the control wards indicating the presence of calculation errors. In 43%
(1,552/3,585) of measurements on protocol wards, the complete set of vital signs including
MEWS was measured compared with 1% (31/3,013) on control wards. A “perfect”
measurement of all vital signs including MEWS without calculation errors was present in
14% (483/3,585) of protocolised measurements compared with 0.3% (8/3,013) of control
measurements. When critical MEWS were measured by nurses on protocolised wards, a
delay of 20 hours (IQR 5.5–54.0) was observed between the first registered critical MEWS
and the notification of the physician, compared with 44 hours on control wards (p=0.79),
(Table 5.1).
5.5.3.3 Resource utilisation
Eight of the 21 studies included outcomes reporting on resource utilisation with mixed
results.(48, 69, 79, 107, 109, 131, 137, 153)
A nRCT by Ludikhuize et al.,(79) where the intervention group measured a MEWS a minimum
of three times daily and the control group measured MEWS as clinically indicated
investigated the effect on RRT calls. In the intervention group there were 11.8 RRT calls per
1,000 admissions pre and 19.6 RRT calls per 1,000 admissions post. In the control group
there were 8.0 RRT calls per 1,000 admissions pre and 6.5 RRT calls per 1,000 admissions
post.
A before-after MEWS, SBAR and ABCDE study investigated the effect on cardiac arrest team
(CAT) calls.(48) Before the rate was 3.15 per 1,000 admissions and after intervention this
reduced to 2.97 per 1,000 admissions (non-significant). A prospective before-after
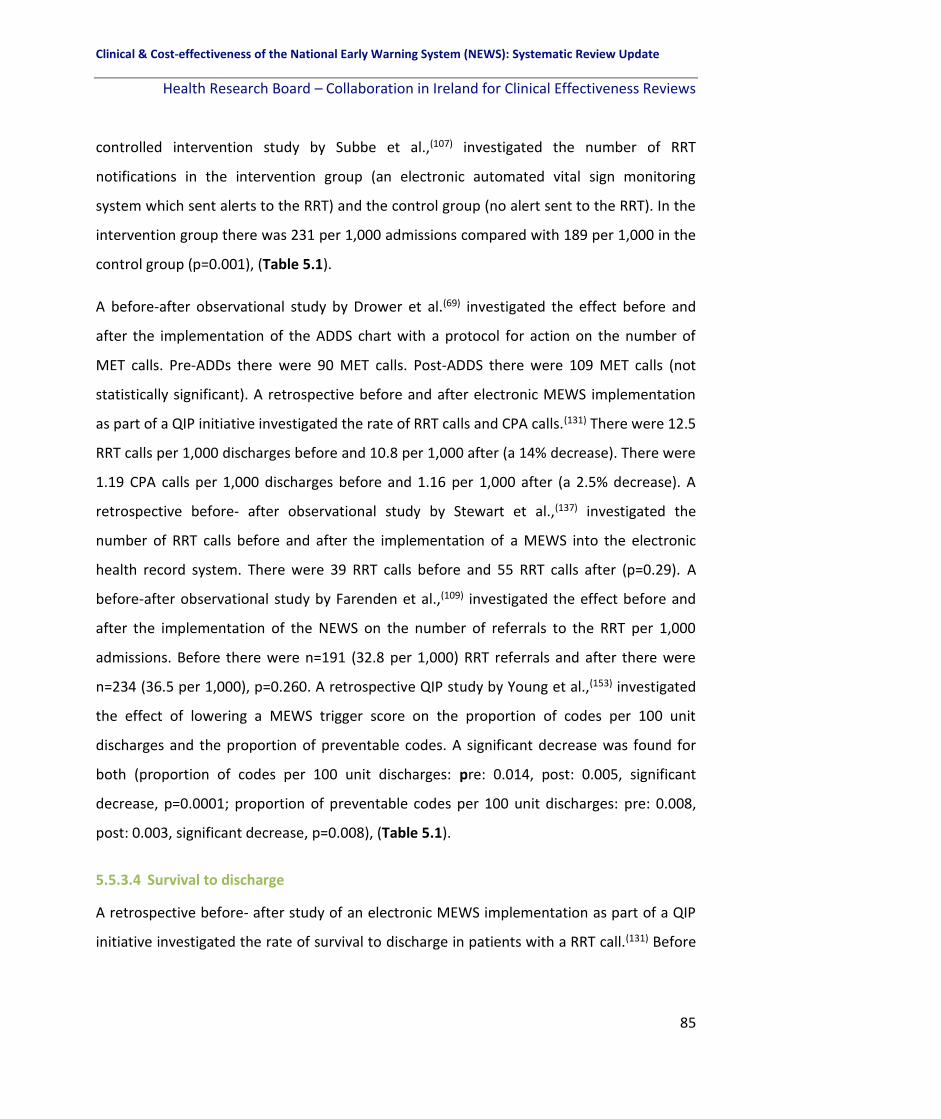
Clinical & Cost-effectiveness of the National Early Warning System (NEWS): Systematic Review Update
Health Research Board – Collaboration in Ireland for Clinical Effectiveness Reviews
85
controlled intervention study by Subbe et al.,(107) investigated the number of RRT
notifications in the intervention group (an electronic automated vital sign monitoring
system which sent alerts to the RRT) and the control group (no alert sent to the RRT). In the
intervention group there was 231 per 1,000 admissions compared with 189 per 1,000 in the
control group (p=0.001), (Table 5.1).
A before-after observational study by Drower et al.(69) investigated the effect before and
after the implementation of the ADDS chart with a protocol for action on the number of
MET calls. Pre-ADDs there were 90 MET calls. Post-ADDS there were 109 MET calls (not
statistically significant). A retrospective before and after electronic MEWS implementation
as part of a QIP initiative investigated the rate of RRT calls and CPA calls.(131) There were 12.5
RRT calls per 1,000 discharges before and 10.8 per 1,000 after (a 14% decrease). There were
1.19 CPA calls per 1,000 discharges before and 1.16 per 1,000 after (a 2.5% decrease). A
retrospective before- after observational study by Stewart et al.,(137) investigated the
number of RRT calls before and after the implementation of a MEWS into the electronic
health record system. There were 39 RRT calls before and 55 RRT calls after (p=0.29). A
before-after observational study by Farenden et al.,(109) investigated the effect before and
after the implementation of the NEWS on the number of referrals to the RRT per 1,000
admissions. Before there were n=191 (32.8 per 1,000) RRT referrals and after there were
n=234 (36.5 per 1,000), p=0.260. A retrospective QIP study by Young et al.,(153) investigated
the effect of lowering a MEWS trigger score on the proportion of codes per 100 unit
discharges and the proportion of preventable codes. A significant decrease was found for
both (proportion of codes per 100 unit discharges: pre: 0.014, post: 0.005, significant
decrease, p=0.0001; proportion of preventable codes per 100 unit discharges: pre: 0.008,
post: 0.003, significant decrease, p=0.008), (Table 5.1).
5.5.3.4 Survival to discharge
A retrospective before- after study of an electronic MEWS implementation as part of a QIP
initiative investigated the rate of survival to discharge in patients with a RRT call.(131) Before

Clinical & Cost-effectiveness of the National Early Warning System (NEWS): Systematic Review Update
Health Research Board – Collaboration in Ireland for Clinical Effectiveness Reviews
86
implementation, 95% survived (19/20) and after 82% survived (14/17). This study also
looked at survival to discharge in patients with a CPA call. Equal numbers survived before
and after the introduction of an electronic MEWS (1/2, 50%), (Table 5.1).
5.5.3.5 Deterioration (EWS ≥2) at 24 hours
One study, an RCT by Petersen et al.,(59) aimed to explore whether EWS measurements at 8
hour intervals (intervention group) were associated with better outcomes than 12 hour
intervals (control). There was no difference in deterioration rates at 24 hours between the
two groups (p=0.44), (Table 5.1).
5.5.3.6 Palliative care measures
A prospective randomised pilot study to determine whether an EWS could identify patients
wishing to focus on palliative care measures was conducted by Picker et al.(132) Scripted
recommendations were given by the primary medical team to patients in the intervention
group. Control group patients received no such recommendations. Advance directives (a
way of making your voice heard when you can no longer communicate) were documented
in 37.1% of the intervention group and 15.4% of the control group, (p<0.001). In the
intervention group 36.0% has a resuscitation status documented compared with 23.1% in
the control group (p=0.043). There was a palliative care consultation in 7.9% of the
intervention group and 6.0% of the control group (p=0.60), (Table 5.1).

Clinical & Cost-effectiveness of the National Early Warning System (NEWS): Systematic Review Update
Health Research Board – Collaboration in Ireland for Clinical Effectiveness Reviews
87
Table 5.1 Studies of the impact of EWSs interventions on patient outcomes and resource utilisation (Q2 Effectiveness of EWSs interventions)
Author,
Study design
Setting,
Country
Sample size,
Type of patient
Study
duration
Description of intervention Outcomes
RCTs (118)Bailey
(2013),
Randomised
controlled
crossover
design
8 general
wards, 1,250-
bed hospital,
USA
N=19,116,
General ward
patients
(intervention
n=9,911;
control 10,120)
July 2007
- Dec
2011
Real-time alerts generated by an algorithm designed to predict
ICU transfer were sent via pager to charge nurses on the
intervention ward only. Control ward charge nurses did not
receive an alert.
Primary outcome: Mortality
Intervention group (alert): 244/2,353 (10.4%, 95% CI 7.4% - 10.7%)
Control group (no alert): 206/17,678 (1.2%, 95% CI 1.0%-1.3%, p<0.0001)
Primary outcome: ICU transfer
Intervention group (alert): 358/2,353 (15.2%, 95% CI 13.8%-16.7%)
Control group (no alert): 512/17,678 (2.9%, 95% CI 2.7%-3.2%, p<0.0001)
Primary outcome: LOS
Intervention group (alert): 7.01 days
Control group (no alert): 2.94 days, p<0.001 (59)Petersen
(2016), RCT
(pragmatic,
ward-level,
un-blinded).
Bispebjerg University Hospital, 700-bed, Copenhagen, Denmark.
N=1,346
surgical or
medical ward
patients
included.
N=690 allocated
to the 12h
group (control)
and n=656 to
the 8h group
(intervention).
Two
phases
(Sept –
Oct, and
Nov –Dec
2014).
To explore whether EWS measurements at 8h intervals
(intervention) is associated with better outcomes than 12h
intervals (control). Phase 1 (weeks 1–7) surgical patients were
allocated to the intervention arm and medical patients to the
control arm. In phase 2 (weeks 8–15) monitoring frequencies
were crossed over, and the medical patients allocated to the
intervention arm and surgical patients to the control arm.
Primary outcome: mortality 30-day, mortality 72 hours One patient in each group died within 72 h of admission, 30-day mortality was 1.1% vs. 1.8% (p = 0.36) in the 8 h group and the 12 h-group, respectively. Primary outcome: LOS LOS median 1.0 (IQR 0.6–2.3) and 1.0 (0.6–2.2) days (p = 0.89) in 8h and 12 h group, respectively. Primary outcome: ICU admission No significant difference (p=0.49). Secondary outcome post hoc: Deterioration (EWS>2) at 24 hours Intention-to-treat analysis showed no differences between the 8 h (9.3%) and 12 h group (8.1%)
for the primary outcome (EWS>2 at 24 h), p = 0.44.
(132)Picker
(2017),
Prospective,
randomised
pilot study.
1,250-bed
Barnes-
Jewish
Hospital,
Missouri,
USA.
N=206 patients;
89 intervention
(43.2%) and 117
controls
(56.8%)
admitted to 8
general medical
wards.
Jan-Dec
2015
To determine whether an EWS could identify patients wishing
to focus on palliative care measures, for patients assigned to
the intervention arm specific study tasks were carried out as
scripted recommendations to the primary medical team in
order to not usurp the team’s relationship with the patient.
Scripted discussions and tasks were developed by the
investigators the palliative care team and communicated to all
patient care teams by one investigator to maintain consistency.
Primary outcome: Hospital mortality: Intervention: 11 (12.4%); Control: 12 (10.3%); p=0.64. Primary outcome: LOS: Intervention: median 4 (IQR3, 11); Control: median 5 (IQR 3, 10); p=0.60 Primary outcome ICU transfer: Intervention: 11 (12.4%), Control: 32 (27.4%), p=0.009. Secondary outcome post-hoc: Advance directives documented: Intervention: 33 (37.1%); Control: 18 (15.4%); p<0.001 Secondary outcome post-hoc: Resuscitation status documented: Intervention: 32 (36.0%); Control: 27 (23.1%); p=0.043. Secondary outcomes: post-hoc: Palliative care consultation: Intervention: 7 (7.9%); Control: 7 (6.0%); p=0.60.

Clinical & Cost-effectiveness of the National Early Warning System (NEWS): Systematic Review Update
Health Research Board – Collaboration in Ireland for Clinical Effectiveness Reviews
88
Table 5.1 Studies of the impact of EWSs interventions on patient outcomes and resource utilisation [continued]
Author,
Study design
Setting,
Country
Sample size,
Type of patient
Study duration Description of intervention Outcomes
nRCTs (79)Ludikhuize
(2014), nRCT
1,000-bed
University
Hospital,
Amsterdam,
the
Netherlands.
N=373 patients in
the intervention
ward
(protocolised, 8-
hourly MEWS)
and N=432
patients in the
control wards
(MEWS as
clinically
indicated), in
medical or
surgical wards
between Sept and
Nov 2011.
Sept-Nov 2011
(2 months).
10 wards were randomized to the
protocolised arm to measure the MEWS a
minimum of three times daily and eight wards
to the control arm, i.e. MEWS measurements
when clinically indicated. Randomization
performed after stratification according to
surgical or medical ward. Patients were
excluded when thresholds were uncertain
(specific vital signs and/or MEWS) or if the
physician raised the threshold for calling, e.g.
MEWS of 5 instead of 3. Intention to treat
analysis used.
Secondary: Post hoc: SAEs (including unplanned ICU admission and CPAs): Intervention group (protocol wards): Before 13.4/1,000 AEs; After 8.5/1,000 (95% CI: −0.004 to 0.014). Control group (MEWS as required): Before: 9.1/1,000; After 6.5/1,000 (95% CI: −0.006 to 0.012). Secondary outcome: post-hoc: No of RRT activations: Intervention group (protocol wards): Before 11.8/1,000; After 19.6/1,000 Control group (MEWS as required): Before 8.0/1,000; After: 6.5/1,000. Secondary outcome: Post-hoc: Compliance with the MEWS and RRS protocol: Nurses calculated a MEWS in 70% (2,513/3,585) of the measurements on protocol wards (intervention) and in 2% (65/3,013) on control wards. (p<0.001). Compliance of vital sign measurements 3 times per day on the protocol wards achieved in 68% (819/1,205). On control wards, retrospective review of vital signs indicated abnormal observations warranting the need for calculation of a MEWS according to the protocol in 41% (1,232/2,977) of all measurements. In 4% (47/1,232) of the measurements, the score was actually determined. A “perfect” measurement of all vital signs including MEWS without calculation errors was present in 14% (483/3,585) of protocolised measurements compared with 0.3% (8/3,013) A critical MEWS (≥3) was recorded by nurses in 9% (338/3,585) on the protocolised versus 1% (35/3,013) on the control wards. Comparing the actually documented MEWS with the retrospective MEWS calculations, a critical MEWS was identified in 11% (381/3,585) on the protocolised versus 7% (217/3,013) on the control wards indicating the presence of calculation errors. In 43% (1,552/3,585) of measurements on protocol wards, the complete set of vital signs including MEWS was measured compared with 1% (31/3,013) on control wards. Delay in notification of the physician: The presence of delay was analysed in 99 patients. In 49% (28/57) of the patients in the protocol arm and 50% (2/4) in the control arm, delays were present in identifying deterioration. When critical MEWS were measured by nurses on protocolised wards, a delay of 20 h (IQR
5.5–54.0) was observed between the first registered critical MEWS and the notification of
the physician, versus 44 h on control wards (p = 0.79).

Clinical & Cost-effectiveness of the National Early Warning System (NEWS): Systematic Review Update
Health Research Board – Collaboration in Ireland for Clinical Effectiveness Reviews
89
Table 5.1 Studies of the impact of EWSs interventions on patient outcomes and resource utilisation [continued] Author,
Study design
Setting,
Country
Sample size,
Type of patient
Study duration Description of intervention Outcomes
nRCTs (107)Subbe
(2017),
Prospective
before-after
controlled
intervention
study.
University-
affiliated
hospital, UK.
N=2,139 patients
before (control
wards 1 and 2,
Oct 2012- Oct
2013) and
n=2,263 after the
intervention (Feb
2014 – Apr 2015,
intervention
wards 1 and 2),
admitted to the
general medical
ward.
Patient data were collected from
15 Oct 2012 to 16 Oct 2013 for the
control period in ward 1 and from 1
Oct 2012 to 2 Oct 2013 for the
control period in ward 2. Data were
collected in the intervention phase
from 17 Feb 2014 in ward 1 and 28
Apr 2014 in ward 2 until all the
interventions ceased in both wards
on 17 Apr 2015. Additional control
data were collected in ward 2 from
17 Feb 2014 to 17 Apr 2014 to run
parallel with the intervention start
period in ward 1 for 2 months.
Hypothesised that the application of monitoring technology with automated notification of the RRT would improve the reliability of escalation of care for clinically deteriorating patients on general wards, and result in improved patient outcomes. NEWS, CREWS or palliative (NEWS without a trigger) EWS were used as appropriate. For the intervention, an electronic automated advisory
vital signs monitoring system (Intelivue Guardian
Solution (IGS) with cableless sensors and MP5SC spot-
check monitors, Philips Healthcare, Boeblingen,
Germany) was deployed to each study ward. The
monitoring system electronically transfers and displays
data obtained by the bedside nurses using spot-check
monitors or by cableless sensor devices, automatically
calculating EWS.
Primary outcome: Mortality: Intervention: 147/2,263 (6.5%) Control: 173/2,139 patients (8.1%), p = 0.04. Primary outcome: Cardiac arrest: Intervention: N=2 (0.8/1,000 discharges, 0.4% of RRT notifications), Control: N=14, 6.5/1,000 discharges, 3.5% of RRT notifications, p=0.002. Primary outcome: ICU admission Intervention: N=21 (9/1,000 discharges) Control: N=26, (12/1,000 discharges), p=0.16. Secondary outcome: Post-hoc: RRT notifications: Intervention: 1.43 per patient, 231/1,000 admissions (23.1%), Control: 1.33 per patient, 189/1,000 admissions (18.9%), p=0.001

Clinical & Cost-effectiveness of the National Early Warning System (NEWS): Systematic Review Update
Health Research Board – Collaboration in Ireland for Clinical Effectiveness Reviews
90
Table 5.1 Studies of the impact of EWSs interventions on patient outcomes and resource utilisation [continued]
Author,
Study design
Setting,
Country
Sample size,
Type of patient
Study
duration
Description of intervention Outcomes
Interrupted time series studies (57)Bunkenborg
(2014), interrupted
times series
intervention study
4 medical and
surgical wards
of a 750-bed
university
hospital,
Denmark
N=1,870 adult
patients with
mainly GI
disorders pre-
intervention
(2009); N=2,079
post-intervention
(2010, 4 months)
and N=2,234 post-
intervention
(2011, 4 months)
3 x 4-month
study periods
between
2009 and
2011.
Three components: 1) a new monitoring practice –
systematic use of a validated EWS by nurses and
physicians; 2) an observation chart with scoring
severity colour-coded; 3) algorithm for bedside
action which was colour coded with instructions on
who to call and when to call and how often to re-
evaluate. Green coding for EWS score of 0 and red
for scores ≥5 for urgent action. A 4-hour training
session provided for all nurses and nursing assistants
pre-intervention and 45-minutes of training for
physicians. Feedback sessions also incorporated by
main investigator.
Primary outcome: unexpected mortality (per 100 patient admission years)
Pre-intervention: 61
Post-intervention1 (2010): 25 (p=0.053)
Post-intervention2 (2011): 17 (p=0.013)
Primary outcome: ICU admission
Pre-intervention: 17
Post intervention (2011): 17 (no p-values provided)
Primary outcome: survival after cardiac arrest
Pre-intervention: 2/7 survived
Post intervention (2011): 1/3 survived (no p-values provided)
Secondary: Post hoc: SAES:
Pre-intervention: 31
Post intervention (2011): 21 (no p-values provided)
Before-after observational studies (uncontrolled) (48)DeMeester
(2013b), before-
(Jul 2010 – Apr
2011), after (May
2011-Mar 2012)
study.
Antwerp
University
Hospital,
tertiary referral,
Belgium.
N=210,074
inpatient days
and 37,239
admissions
between July
2010 and Mar
2012, medical and
surgical ward
patients.
10 months
pre-
intervention
and 10
months post-
intervention.
Following introduction of MEWS in Nov 2009, an
educational intervention of SBAR and ABCDE training
was implemented for all nurses. The intervention
was step 2 of the introduction of the afferent limb of
a RRS. This included patient observation,
measurement of vital signs, patient assessment,
recognition of clinical deterioration, call criteria for
triggering a response and policy to communicate
with the health care workers of the efferent limb of
the RRS.
Primary: unexpected deaths (deaths without a DNR)
Pre-intervention: 16 (0.99/1,000 admissions)
Post-intervention: 5 (0.34/1,000 admissions), p<0.001.
Primary: Unplanned ICU admissions
Pre-intervention: 51 (13.1/1,000 admissions)
Post-intervention: 105 (14.8/1,000 admissions), p=0.001
Secondary: Post hoc: SAEs (unexpected deaths, unplanned ICU admissions,
CAT calls)
Pre-intervention: 81 (4.4/1,000 admissions)
Post-intervention: 126 (6.7/1,000 admissions), p<0.05
Secondary: Post hoc: CAT calls
Pre-intervention: 3.15/1,000 admissions
Post-intervention: 2.97/1,000 admissions, non-significant.

Clinical & Cost-effectiveness of the National Early Warning System (NEWS): Systematic Review Update
Health Research Board – Collaboration in Ireland for Clinical Effectiveness Reviews
91
Table 5.1 Studies of the impact of EWSs interventions on patient outcomes and resource utilisation [continued]
Author,
Study design
Setting,
Country
Sample size,
Type of patient
Study
duration
Description of intervention Outcomes
Before-after observational studies (uncontrolled) (114)Jones (2013),
Retrospective
before-after
observational
study.
525-bed
teaching
hospital,
Virginia,
USA.
Sample size not
reported. Only
reported that 3
medical-surgical step-
down nursing units
were included.
Before-EWS
implementati
on (Jun 2009
– May 2010),
After (Jun
2010-May
2011).
The Vital Sign Alert System (VSA) EWS implemented in Jun 2010,
created by nurses in the hospital. The program was designed to
scan each patient’s EMR every 60 seconds, recalculating scores
whenever new vital sign data were available. Color-coded VSA
scores were also added to the nurses’ patient lists, so they were
readily available to nurses using mobile computers at the bedside.
Double-clicking on a patient’s VSA score opened the VSA
algorithm, prompting timely nursing action when a score was out
of the target range. Scores in range (≤2) – continue to monitor
every 4 h. Score 3-4: perform complete assessment (assess the
following: urine output, telemetry, mean arterial pressure,
peripheral perfusion, heart and breath sounds, change in
LOC/speech, new symptoms). Notify charge nurse of issues and
charge nurse to notify medical response team and evaluate as
necessary – monitor vital signs every 2 h until score is <=3.Score 5-
8: Notify charge nurse, Notify medical doctor, Consider calling
medical response team. Monitor vital signs every hour until score
is <5, then every 2 h until score is <3.
Primary outcome: Cardiac arrest
Before VSA-EWS implementation: n=16 events.
After VSA-EWS implementation: n=3 (no statistical test
reported).
(68)Nishijima (2016),
Retrospective
before-after
observational
study.
331-bed
Chubu
Hospital,
Japan.
N= 15,462 patients
before MEWS (Apr
2011-Sept 2012) and
N=17,961 patients
after MEWS (Oct 2013
– Mar 2015). All
patients eligible
except ICU and DNR
patients.
18-months
pre and 18
months post
MEWS
implement-
ation.
A system was introduced to calculate the MEWS automatically
when vital signs were entered into the patient’s medical record by
a ward nurse. The MEWS system was used routinely on all
inpatients. An evaluation was conducted one or more times each
day depending on the patient’s illness severity, and the highest
score was used in this study.
Primary outcome: In-hospital deaths: Before: 36.3 per 1,000 After: 35.4 per 1,000 (not significant p >0.05). Primary outcome: In-hospital cardiac arrests: Before: 5.21 per 1,000 (79/15,170) After: 2.39 per 1,000 (43/17,961), p<0.01).

Clinical & Cost-effectiveness of the National Early Warning System (NEWS): Systematic Review Update
Health Research Board – Collaboration in Ireland for Clinical Effectiveness Reviews
92
Table 5.1 Studies of the impact of EWSs interventions on patient outcomes and resource utilisation [continued]
Author,
Study design
Setting,
Country
Sample size,
Type of patient
Study duration Description of intervention Outcomes
Before-after observational studies (uncontrolled) (88)Jones (2011),
Retrospective
before-after
observational
study.
Manchester
Royal
Infirmary, UK
N=1,481 consecutive adult
patients admitted to the
MAU.
Before
Patientrack
implement-ation
(Nov-Dec 2007);
After (Aug-Sept
2008)
‘Patientrack’ was implemented on a central web server with an underlying
data repository. The study had 3 phases. The first phase entailed baseline
data capture. The second phase involved implementation of the electronic
observation capture and EWS calculation. Patient bedside observations
were taken manually and the results were entered into a personal digital
assistant (PDA). The PDA was connected to a wireless network that
allowed the results to be presented as a whole-of-ward view. Doctors were
alerted by the traditional systems (i.e., nurse call, switchboard to page
doctors, or personal notification). The third phase was the alert phase —
electronic observation capture (as above) with automated electronic alerts
to the doctor.
Primary outcome: Hospital mortality Before: 67 (9.5%) After: 59 (7.6%), p=0.19 Primary outcome: Cardiac arrest Before: 3 (0.4%) After: 0, p=0.21 Primary outcome: LOS Before: 9.7 days 95% CI(4.7-19.8) After: 6.9 days, 95% CI(3.3-13.9) p<0.001. Primary outcome: Critical care utilisation: Before: 14 patients (51 bed days) After: 5 patients (26 bed-days), p=0.04. Secondary outcomes: post-hoc: Compliance with EWS protocol. EWS accuracy – 81% of observations measured and summed correctly. Before: 27% After: 22%, p=0.07. Documentation of clinical response: Before: 29%, After: 78% after (p<0.001). Clinical response for EWS greater than 5: Before: 67% of instances After: 96% of instances (p<0.003)
(97)Patel (2011), Retrospective before-after study.
Leicester Royal Infirmary Hospital, UK.
N=32,149 patients admitted to the orthopaedic trauma unit Jan 2002 and Dec 2009.
Three years pre-MEWS (2002-2004) and 4 years post (2006-2009).
A MEWS system implemented in the summer of 2005 coupled with the existing CCOS. Data were obtained from the coding dept.
Primary outcome: mortality Pre-MEWS: 3.22 per 1,000 admissions After: 2.29 per 1,000 admissions, Decreased mortality rate : all patients: 0.9% (95% CI 0.53, 1.31; p=0.09)
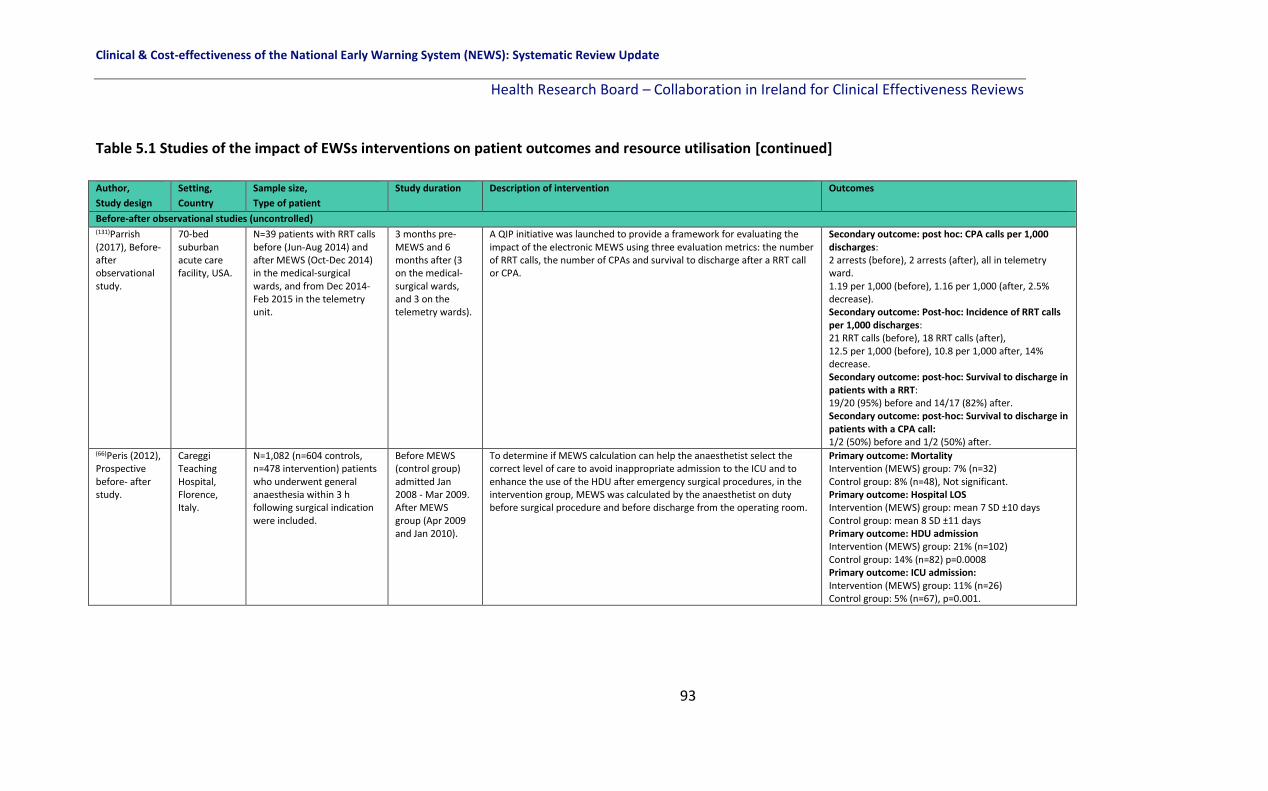
Clinical & Cost-effectiveness of the National Early Warning System (NEWS): Systematic Review Update
Health Research Board – Collaboration in Ireland for Clinical Effectiveness Reviews
93
Table 5.1 Studies of the impact of EWSs interventions on patient outcomes and resource utilisation [continued]
Author,
Study design
Setting,
Country
Sample size,
Type of patient
Study duration Description of intervention Outcomes
Before-after observational studies (uncontrolled) (131)Parrish (2017), Before-after observational study.
70-bed suburban acute care facility, USA.
N=39 patients with RRT calls before (Jun-Aug 2014) and after MEWS (Oct-Dec 2014) in the medical-surgical wards, and from Dec 2014-Feb 2015 in the telemetry unit.
3 months pre-MEWS and 6 months after (3 on the medical-surgical wards, and 3 on the telemetry wards).
A QIP initiative was launched to provide a framework for evaluating the impact of the electronic MEWS using three evaluation metrics: the number of RRT calls, the number of CPAs and survival to discharge after a RRT call or CPA.
Secondary outcome: post hoc: CPA calls per 1,000 discharges: 2 arrests (before), 2 arrests (after), all in telemetry ward. 1.19 per 1,000 (before), 1.16 per 1,000 (after, 2.5% decrease). Secondary outcome: Post-hoc: Incidence of RRT calls per 1,000 discharges: 21 RRT calls (before), 18 RRT calls (after), 12.5 per 1,000 (before), 10.8 per 1,000 after, 14% decrease. Secondary outcome: post-hoc: Survival to discharge in patients with a RRT: 19/20 (95%) before and 14/17 (82%) after. Secondary outcome: post-hoc: Survival to discharge in patients with a CPA call: 1/2 (50%) before and 1/2 (50%) after.
(66)Peris (2012), Prospective before- after study.
Careggi Teaching Hospital, Florence, Italy.
N=1,082 (n=604 controls, n=478 intervention) patients who underwent general anaesthesia within 3 h following surgical indication were included.
Before MEWS (control group) admitted Jan 2008 - Mar 2009. After MEWS group (Apr 2009 and Jan 2010).
To determine if MEWS calculation can help the anaesthetist select the correct level of care to avoid inappropriate admission to the ICU and to enhance the use of the HDU after emergency surgical procedures, in the intervention group, MEWS was calculated by the anaesthetist on duty before surgical procedure and before discharge from the operating room.
Primary outcome: Mortality Intervention (MEWS) group: 7% (n=32) Control group: 8% (n=48), Not significant. Primary outcome: Hospital LOS Intervention (MEWS) group: mean 7 SD ±10 days Control group: mean 8 SD ±11 days Primary outcome: HDU admission Intervention (MEWS) group: 21% (n=102) Control group: 14% (n=82) p=0.0008 Primary outcome: ICU admission: Intervention (MEWS) group: 11% (n=26) Control group: 5% (n=67), p=0.001.

Clinical & Cost-effectiveness of the National Early Warning System (NEWS): Systematic Review Update
Health Research Board – Collaboration in Ireland for Clinical Effectiveness Reviews
94
Table 5.1 Studies of the impact of EWSs interventions on patient outcomes and resource utilisation [continued]
Author,
Study design
Setting,
Country
Sample size,
Type of patient
Study duration Description of intervention Outcomes
Before-after observational studies (uncontrolled)
(69)Drower (2013), Before-after observational study (Apr 2009 – Mar 2011)
Waikato Hospital, 600-bed, Auckland, New Zealand
N=21,806 pre-intervention and N=22,378 post-intervention, adult admissions.
23 months. ADDS EWS chart with protocol for action introduced. Developed within the hospital.
Primary outcome: Cardiac arrest
Pre-intervention: 4.67 per 1,000
Post-intervention: 2.91 per 1,000
Mean difference: 1.77 (95% CI 0.59-2.95. p=0.005), 38% reduction.
Secondary: post hoc: Number of MET calls
Pre-intervention: n=90, 7.5 medical emergencies per month Post-intervention: n=109, 9.1 medical emergencies per month (not
statistically significant). (99)Schmidt
(2014),
Retrospective
before-after
observational
study.
2 large acute
general
hospitals in
the UK.
Hospital 1 (QAH): Before: 27,959, after: 29,676. Hospital 2 (UHC): Before: 21,771, after: 26,241.
July 2004 to Jun 2011. To determine whether introducing an electronic physiological
surveillance system (EPSS), specifically designed to improve the
collection and clinical use of vital signs data, reduced hospital
mortality, the VitalPAC wireless handheld device, prompts nurses to
take bedside observations and then calculates the EWS instantly was
introduced in both hospitals.
Primary outcome: Mortality: QAH hospital: Before (2004): 7.75% (2,168/27,959) After (2010): 6.42% (1,904/29,676), p<0.0001 397 fewer deaths. UHC hospital: Before (2006): 7.57% (1,648/21,771) After (2010): 6.15% (1,614/26,241). p<0.0001. 372 fewer deaths.
(137)Stewart (2014), Retrospective before (12 months) after (12 months) MEWS.
242-bed acute care hospital, Pennsylvania, USA.
N=39 medical-surgical patients with RRT calls before MEWS and N=55 patients with RRT calls post MEWS implementation.
24 months. MEWS implemented into the electronic health record system in 2012. No other details provided.
Primary outcome: Cardiopulmonary arrests: Before: 14, After 11, p=0.88 Secondary outcome: Post-hoc: No of RRT calls: Before: 39 RRT activations before MEWS After: 55 RRT activation post MEWS, p=0.29

Clinical & Cost-effectiveness of the National Early Warning System (NEWS): Systematic Review Update
Health Research Board – Collaboration in Ireland for Clinical Effectiveness Reviews
95
Table 5.1 Studies of the impact of EWSs interventions on patient outcomes and resource utilisation [continued]
Author,
Study design
Setting,
Country
Sample size,
Type of patient
Study duration Description of intervention Outcomes
Before-after observational studies (uncontrolled)
Farenden et al
(2017),(109)
Retrospective
before-after
observational
study.
586-bed University College Hospital, London, UK
N=191 patients from adult non-obstetric wards 2 months before NEWS implementation in 2013 and N=234 patients 2 months after NEWS implementation in 2014
Before NEWS implementation (May-June 2013), After NEWS implementation (May-June 2014)
The NEWS was implemented in April 2014, including a user friendly vital signs chart and a detailed protocol for action based on different NEWS scores. Training in the calculation and use of the NEWS was provided to all staff to facilitate effective implementation.
Primary outcome: Mortality Before: n=190 After: n=234 (not significant) Primary outcome: ICU admission Before: n=44 After: n=54 (not significant) Secondary outcome, post-hoc: SAE (Sepsis or septic shock) Before: n=69 After: n=98 (not significant) Secondary outcome, post hoc: Resource utilisation, referrals to RRT per 1,000 admissions Before: n=191 (32.8 per 1,000) After: n=234 (36.5 per 1,000), p=0.260
(153)Young
(2014),
QIP
retrospective
study
897-bed
university
hospital,
Chicago,
Illinois.
N=2,471 patients before
and n=5,027 after,
haematology/oncology
patients.
Before MEWS
intervention
(control group)
admitted
between April
2007 and Feb
2008. After MEWS
intervention
(March 2008 to
Sept 2009).
A protocol employing a lower MEWS score to trigger escalation was
implemented for nurses and a recommendation to check serum
lactate level if infection was suspected was implemented for
physicians to identify deteriorating patients who required the
attention of the RRT in March 2008.
Primary outcome: Transfer to the ICU
“ICU transfer rates remained stable” – no statistical tests reported.
Secondary outcome, post hoc: Resource utilisation
Proportion of codes per 100 unit discharges:
Pre: 0.014
Post: 0.005, significant decrease (p=0.0001)
Preventable codes per 100 unit discharges:
Pre: 0.008
Post: 0.003, significant decrease (p=0.008)

Clinical & Cost-effectiveness of the National Early Warning System (NEWS): Systematic Review Update
Health Research Board – Collaboration in Ireland for Clinical Effectiveness Reviews
96
Table 5.1 Studies of the impact of EWSs interventions on patient outcomes and resource utilisation [continued]
Author,
Study design
Setting,
Country
Sample size,
Type of patient
Study duration Description of intervention Outcomes
Before-after observational studies (uncontrolled)
(49)DeMeester
(2013a), Before
(Nov 2008- Feb
2009) and after
(Jun 2009 –Oct
2009) MEWS
implementation
observational
study.
Antwerp
University
Hospital,
tertiary
referral,
Belgium.
N=530 patients before,
N=509 after MEWS
implementation, from 14
different medical and
surgical wards post ICU
discharge.
4 months pre and
5 months post
MEWS
implementation
MEWS implemented as a standard nurse observation protocol in Nov
2009 and a colour graphic observation chart. Patients observed at ICU
discharge, at admission to the ward, 4 hours after admission to the
ward and 12 hourly thereafter according to the study protocol.
Secondary: Post hoc: SAEs up to 5 days post-ICU discharge
pre-intervention: 5.7%
Mean post intervention: 3.5%. A 2.2% reduction (-0.4% - 4.7%), p>0.05
Secondary: Post hoc: Nurse observation frequency
Mean pre-intervention: 0.999 (95% CI 0.964–1.035)
Mean post intervention: 1.073 (95% CI 1.036–1.110), p =0 .005.
(78)Van Galen (2016), Prospective cohort study.
Large urban university hospital, the Netherlands.
N=1,053 patients admitted to 6 wards (acute admission unit, general surgery, internal medicine, trauma surgery, vascular surgery/ urology/nephrology ward and the pulmonary ward Oct-Nov 2015.
7 weeks recruitment (Oct-Nov 2015) and 30 day follow-up.
MEWS implemented with detailed protocol for escalation. According to the hospital wide protocol, every morning at the end of the nightshift or at the beginning of the dayshift, nurses were requested to determine the MEWS using vital parameter measurements recorded in the electronic system. During the implementation of the protocol staff were trained extensively and the protocol card containing the protocol distributed. MEWS was calculated by hand and electronically documented in patients’ charts. Once a patient reaches a critical MEWS (≥3) nurses were to contact the doctor in charge immediately. The doctor must then assess the patient within 30 minutes and draft a plan for treatment, evaluate this after 60 minutes or call a RIT team. The RIT may also directly be called by the nurses or the doctor at the outset.
Secondary outcomes: post-hoc: Compliance with EWS protocol: 89%
(3,270/3,673 vital parameter measurements).
Correctly calculated MEWS: 2,600/3,673 (71%).
(91)Huddart (2015), QIP observational study.
4 NHS hospitals, UK.
N=299 before; N=427 after ELPQuiC bundle implementation; Emergency laparotomy surgery patients.
ELPQuiC bundle implemented in Dec 2012. Data reviewed 4 months before and 4 months after.
ELPQuiC bundle implemented as part of QIP initiative. 5-part bundle: 1)Initial assessment with EWS, 2) Early antibiotics, 3) Interval between decision and operation less than 6 h,4) Goal-directed fluid therapy and 5) postoperative intensive care across 4 hospitals simultaneously. Followed the ‘Plan, Do, Study, Act’ approach. Anonymised data were entered by each hospital into the Electronic Database for Global Education.
Primary outcome: Mortality
Overall case mix-adjusted risk of 30-day mortality:
Before: 15.6% per 100 (12.5%-18.9%)
After: 9.6% per 100 (7.4-11.8%), p=0.003
(Risk ratio 0⋅614, 95% CI 0.451 to 0.836; P =0⋅002).

Clinical & Cost-effectiveness of the National Early Warning System (NEWS): Systematic Review Update
Health Research Board – Collaboration in Ireland for Clinical Effectiveness Reviews
97
Key: ABCDE: Airway, Breathing, Circulation, Disability, Exposure; ADDS: Adult deterioration Detection System; CAT: Cardiac arrest team; CCOS: Critical care outreach service; CPA: Cardiopulmonary arrest; CREWS:
Chronic respiratory EWS; DNR: Do not resuscitate; ELPQuic: Emergency Laparotomy Pathway Quality Improvement Care; EMR: Electronic medical record; EPSS: Electronic patient surveillance system; EWS: Early
warning system; GI: Gastrointestinal; HDU: High dependency unit; ICU: Intensive care unit; LOC: Level of consciousness; LOS: Length of stay; MAU: Medical assessment unit; MET: Medical emergency team; MEWS:
Modified EWS; NEWS: National early warning score; NHS: National Health Service; PDA: Personal digital assistant; QAH: Queen Alexandra Hospital; QIP: Quality improvement project; RCT: Randomised clinical trial;
RRS/T: Rapid response system/team; SAE: Serious adverse events; SBAR: Situation, Background, Assessment, Response; UHC: University Hospital Coventry; VSA: Vital Sign Alert system;

Clinical & Cost-effectiveness of the National Early Warning System (NEWS): Systematic Review Update
Health Research Board – Collaboration in Ireland for Clinical Effectiveness Reviews
98
5.6 Methodological quality
A number of different study designs were included (three RCTs, two nRCTs, one ITS study,
and 15 observational studies, including before-after and cohort studies) in this systematic
review update and therefore the methodological quality was appraised using different tools.
The quality of included studies is presented according to the different study designs.
5.6.1 RCTs
The Cochrane risk of bias tool(23) was used to appraise the methodological quality of the
three included RCTs.(59, 118, 132) One trial by Picker et al. was deemed to have a low risk of bias
overall and the other two trials had an unclear risk of bias overall(59, 118) (Figure 5.1).
Figure 5.1 Risk of bias summary for RCTs of EWS interventions and deterioration in adults
in acute health care
Allocation
Random sequence generation
Two of the trials described the method of sequence generation used and had a low risk of
bias.(59, 132) One trial selected eight wards within one hospital and matched them on alert

Clinical & Cost-effectiveness of the National Early Warning System (NEWS): Systematic Review Update
Health Research Board – Collaboration in Ireland for Clinical Effectiveness Reviews
99
rate before assigning them to groups using a random number generator creating a potential
risk of selection bias(118) (Figure 5.2).
Allocation concealment
Two of the trials described the method of allocation and had a low risk of bias.(59, 132) Bailey
et al.(118) provided insufficient details and had an unclear risk of bias (Figure 5.2).
Blinding participants and personnel (performance bias)
One trial had a low risk of bias as patients had no knowledge - the outcome was ICU
transfer.(118) One trial had a high risk of bias as the participants were not blinded to the
intervention, (59) and one trial had an unclear risk of bias as it was not clear whether
participants were blinded or not.(132) Blinding of personnel was low risk in one trial,(132) high
risk in Bailey et al. (118) as the staff knew there was an intervention (received alert) and
knowledge could have affected decision to transfer patients to the ICU. One trial did not
report whether personnel were blinded and had an unclear risk of bias (Figure 5.2).(59)
Detection bias
Picker et al. (132) had a high risk of detection bias as outcome assessors were not blinded,
and two trials had an unclear risk at it was not clear whether outcome assessors were
blinded (Figure 5.2).(59, 118)
Incomplete outcome data
Two trials described loss to follow-up and accounted for participants.(118, 132) Petersen et al.
(59) had a high risk of attrition bias as 60% of patients were lost to follow up, mainly due to
early discharge, which is well above the estimated dropout rate of 20% reported in the
study (Figure 5.2).
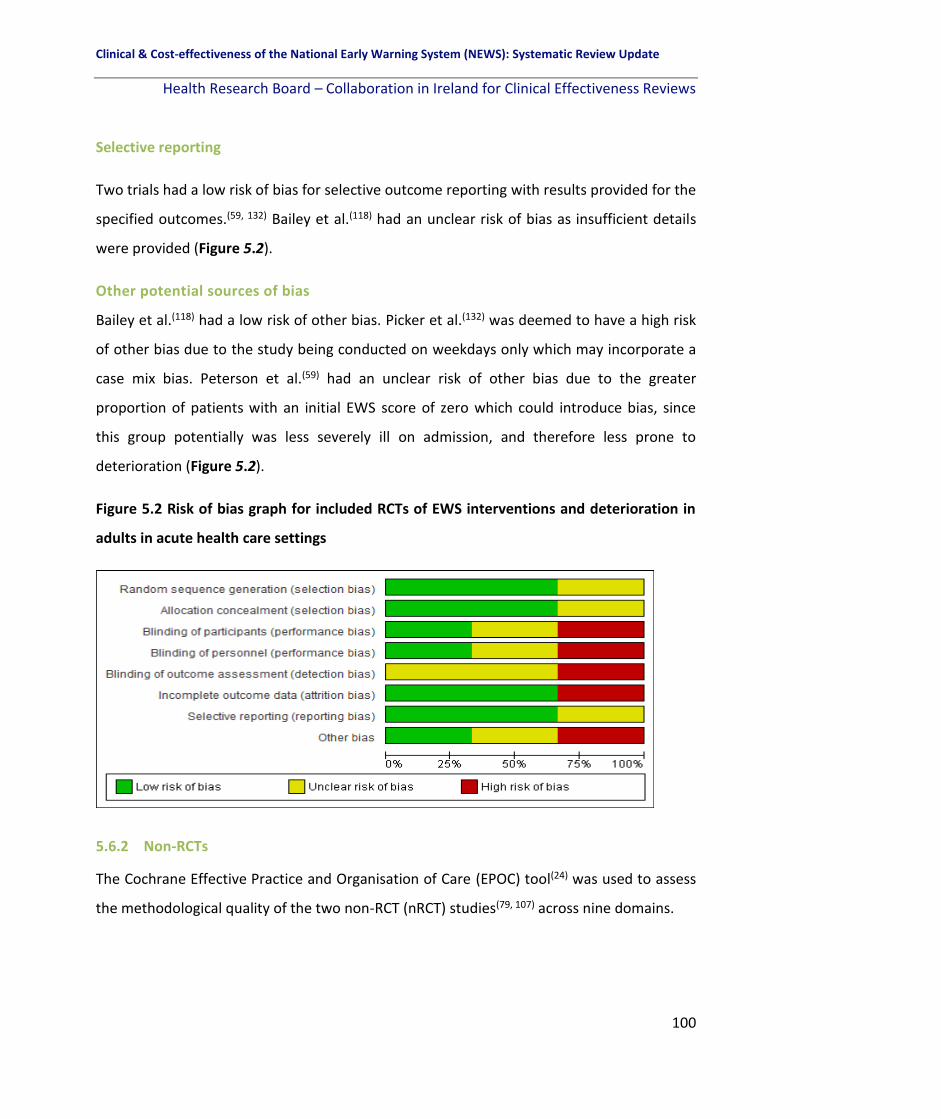
Clinical & Cost-effectiveness of the National Early Warning System (NEWS): Systematic Review Update
Health Research Board – Collaboration in Ireland for Clinical Effectiveness Reviews
100
Selective reporting
Two trials had a low risk of bias for selective outcome reporting with results provided for the
specified outcomes.(59, 132) Bailey et al.(118) had an unclear risk of bias as insufficient details
were provided (Figure 5.2).
Other potential sources of bias
Bailey et al.(118) had a low risk of other bias. Picker et al.(132) was deemed to have a high risk
of other bias due to the study being conducted on weekdays only which may incorporate a
case mix bias. Peterson et al.(59) had an unclear risk of other bias due to the greater
proportion of patients with an initial EWS score of zero which could introduce bias, since
this group potentially was less severely ill on admission, and therefore less prone to
deterioration (Figure 5.2).
Figure 5.2 Risk of bias graph for included RCTs of EWS interventions and deterioration in
adults in acute health care settings
5.6.2 Non-RCTs
The Cochrane Effective Practice and Organisation of Care (EPOC) tool(24) was used to assess
the methodological quality of the two non-RCT (nRCT) studies(79, 107) across nine domains.

Clinical & Cost-effectiveness of the National Early Warning System (NEWS): Systematic Review Update
Health Research Board – Collaboration in Ireland for Clinical Effectiveness Reviews
101
5.6.2.1 nRCT studies
Both nRCT studies were deemed to have an unclear risk of bias overall across the domains
(Figure 5.3).(79, 107)
Figure 5.3 Risk of bias summary for nRCTs of EWS interventions and deterioration in adults
in acute health care settings
Allocation
Allocation concealment and Random sequence generation
Both studies had a high risk of bias for allocation concealment and random sequence
generation as they were non-randomised control trials (Figure 5.4).(79, 107)
Baseline outcome measurements similar
Both trials had an unclear risk of bias as they did not report baseline outcome measures and
it was not possible to determine whether baseline outcome measurements were similar as a
result (Figure 5.4).(79, 107)

Clinical & Cost-effectiveness of the National Early Warning System (NEWS): Systematic Review Update
Health Research Board – Collaboration in Ireland for Clinical Effectiveness Reviews
102
Baseline characteristics similar
Subbe et al.(107) had a low risk of bias for baseline characteristics however Ludikhuize et
al.(79) had an unclear risk of bias as baseline characteristics were not reported (Figure 5.4).
Incomplete outcome data
Both studies had an unclear risk of bias for incomplete outcome data. No flow diagram was
provided in either study.(107) In one study the control ward dropped out due to logistical
reasons (excluding 5,752 measurements) and the number of patients was not reported
(Figure 5.4).(79)
Knowledge of the allocated interventions prevented (Blinding)
Subbe et al. had a high risk of bias as the study was not blinded.(107) Ludikhuize et al. had an
unclear risk of bias as to whether knowledge of the allocated interventions was prevented
as it was not clear from the paper or explicitly stated (Figure 5.4).(79)
Protected against contamination
Both trials had an unclear risk of contamination.(79, 107) Both were single hospital studies and
the authors acknowledged that nurses from the control wards might have been informed
about the intervention – introducing a Hawthorne effect (Figure 5.4).
Selective outcome reporting
Both trials had a low risk of bias for selective outcome reporting as all outcomes were
reported (Figure 5.4).(79, 107)
Other potential sources of bias
Both studies had an unclear risk of other potential sources of bias.(79, 107) Subbe et al.
received funding from the manufacturer of the wireless sensor. Ludikhuize et al. by
excluding patients absent from the ward for a significant part of the day (could include
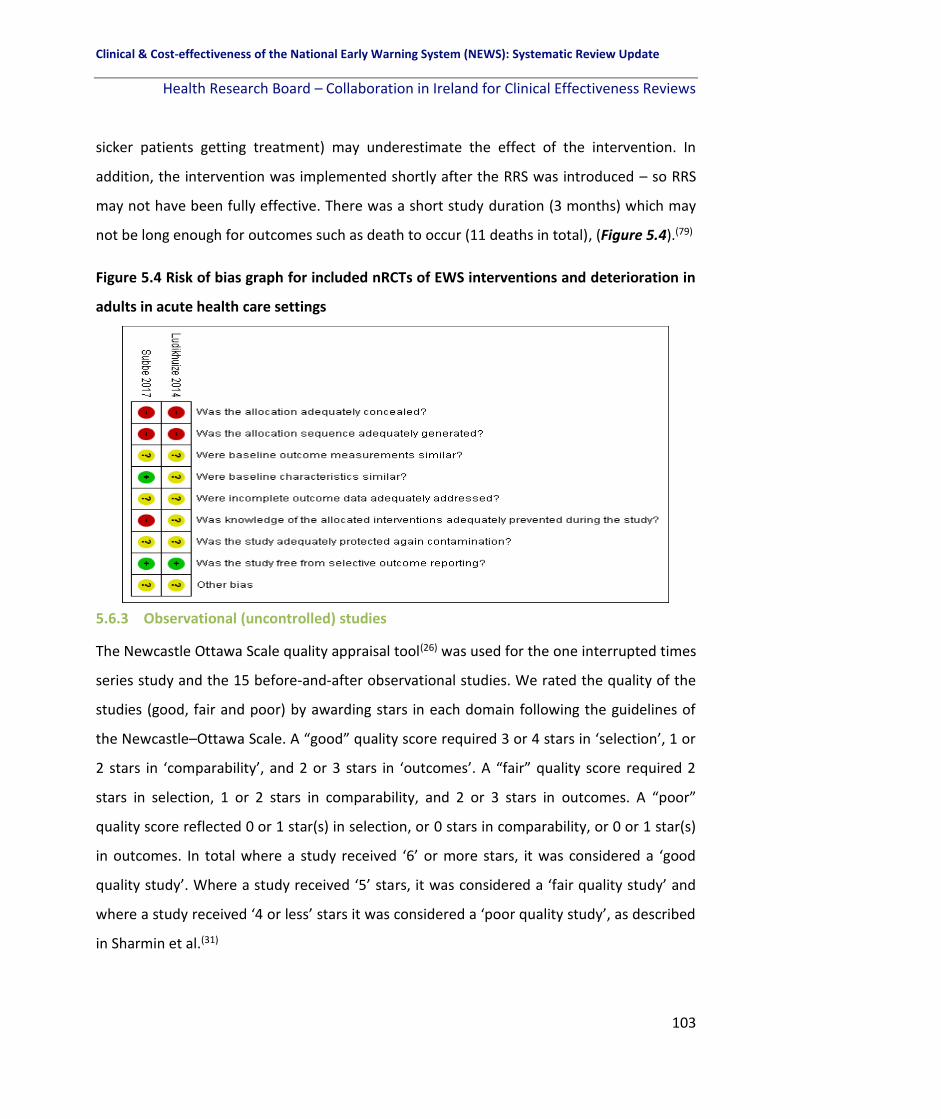
Clinical & Cost-effectiveness of the National Early Warning System (NEWS): Systematic Review Update
Health Research Board – Collaboration in Ireland for Clinical Effectiveness Reviews
103
sicker patients getting treatment) may underestimate the effect of the intervention. In
addition, the intervention was implemented shortly after the RRS was introduced – so RRS
may not have been fully effective. There was a short study duration (3 months) which may
not be long enough for outcomes such as death to occur (11 deaths in total), (Figure 5.4).(79)
Figure 5.4 Risk of bias graph for included nRCTs of EWS interventions and deterioration in
adults in acute health care settings
5.6.3 Observational (uncontrolled) studies
The Newcastle Ottawa Scale quality appraisal tool(26) was used for the one interrupted times
series study and the 15 before-and-after observational studies. We rated the quality of the
studies (good, fair and poor) by awarding stars in each domain following the guidelines of
the Newcastle–Ottawa Scale. A “good” quality score required 3 or 4 stars in ‘selection’, 1 or
2 stars in ‘comparability’, and 2 or 3 stars in ‘outcomes’. A “fair” quality score required 2
stars in selection, 1 or 2 stars in comparability, and 2 or 3 stars in outcomes. A “poor”
quality score reflected 0 or 1 star(s) in selection, or 0 stars in comparability, or 0 or 1 star(s)
in outcomes. In total where a study received ‘6’ or more stars, it was considered a ‘good
quality study’. Where a study received ‘5’ stars, it was considered a ‘fair quality study’ and
where a study received ‘4 or less’ stars it was considered a ‘poor quality study’, as described
in Sharmin et al.(31)

Clinical & Cost-effectiveness of the National Early Warning System (NEWS): Systematic Review Update
Health Research Board – Collaboration in Ireland for Clinical Effectiveness Reviews
104
5.6.4 Interrupted time series studies
There was one interrupted time series study.(48, 57, 66) It received five stars in total and was
considered ‘fair quality’ across the following domains (exposed cohort representative,
selection of the non-exposed cohort, ascertainment of the exposure, comparability of
cohorts in the design and assessment of the outcome).

Clinical & Cost-effectiveness of the National Early Warning System (NEWS): Systematic Review Update
Health Research Board – Collaboration in Ireland for Clinical Effectiveness Reviews
105
Table 5.2 Quality assessment of interrupted time series studies on the effectiveness of EWS interventions
Key: CA: Cardiac Arrest; ICU: Intensive Care Unit.
Study Selection Comparability Outcome Overall quality
S1 Exposed cohort representative
S2 Selection of non-exposed cohort
S3 Ascertainment of exposure
S4 Outcome not present at beginning
C1 Comparability of cohorts in design phase
C2 Comparability of cohorts analysis phase
O1 Assessment of outcome
O2 Follow-up sufficient for outcome to occur
O3 Adequate follow-up
Total stars
Interrupted time series studies (57)Bunkenborg (2014)
* * * Statement of ‘no history of CA or ICU admission/ transfer’ was not provided
* Does not control for additional factors in analysis phase
* 4-month post-intervention 1 and 4-month
post-intervention 2
No statement of follow-up.
5 stars (FAIR QUALITY)
Clinical & Cost-effectiveness of the National Early Warning System (NEWS): Systematic Review Update
Health Research Board – Collaboration in Ireland for Clinical Effectiveness Reviews
106
5.6.4.1 Before-after observational studies
There were 15 before-after observational studies.(48, 49, 66, 68, 69, 78, 88, 91, 97, 99, 109, 114, 131, 137, 153)
Of these, five studies were considered ‘good quality’ overall and received six or more stars
across the different domains of selection, comparability and outcome.(68, 88, 97, 99, 109) Three
studies were considered ‘fair quality’ overall and received five stars across the different
domains of selection, comparability and outcome.(69, 78, 91) Seven studies were rated as ‘poor
quality’ overall receiving four or less stars across the domains (Table 5.3).(48, 49, 66, 114, 131, 137,
153)

Clinical & Cost-effectiveness of the National Early Warning System (NEWS): Systematic Review Update
Health Research Board – Collaboration in Ireland for Clinical Effectiveness Reviews
107
Table 5.3 Quality Assessment of before-and-after observational cohort studies on the effectiveness of EWS interventions
Study Selection Comparability Outcome Overall Quality
S1 Exposed
cohort
representative
S2 Selection of
non-exposed
cohort
S3
Ascertainm
ent of
exposure
S4 Outcome not
present at
beginning
C1
Comparability of
cohorts in
design phase
C2
Comparability of
cohorts in
analysis phase
O1 Assessment
of outcome O2 Follow-up
sufficient for
outcome to
occur
O3 Adequate
follow-up Total stars
DeMeester
(2013a)(49) * * * Did not include any
of the review’s
primary outcomes
Does not control
for additional
factors in design
phase
Does not control
for additional
factors in
analysis phase
* SAEs 5 days post
ICU discharge,
study follow-up
8 months.
No statement of
follow-up,
retrospective
review of patient
charts
4 stars (POOR
QUALITY)
(48)De Meester
(2013b) * * * Statement of ‘no
history of ICU
admission/ transfer’
was not provided
Does not control
for additional
factors in design
phase
Does not control
for additional
factors in
analysis phase
* 10 months pre-
and post-
intervention
No statement of
follow-up,
retrospective
chart review
4 stars (POOR
QUALITY)
Drower (2013)(69) * * * Statement of ‘no
history of CA’ was
not provided
Does not control
for additional
factors in design
phase
Does not control
for additional
factors in
analysis phase
* * No statement of
follow-up,
retrospective
review of patient
charts
5 stars (FAIR
QUALITY)
Farenden et al
(2017)(109) * * * Statement of ‘no
history of ICU
admission’ was not
provided
* Does not control
for additional
factors in
analysis phase
* 2 months post
NEWS
implementation
* 6 stars (GOOD
QUALITY)

Clinical & Cost-effectiveness of the National Early Warning System (NEWS): Systematic Review Update
Health Research Board – Collaboration in Ireland for Clinical Effectiveness Reviews
108
Table 5.3 Quality assessment of before-and-after observational studies on the effectiveness of EWS interventions [continued]
Study Selection Comparability Outcome Overall Quality
S1 Exposed
cohort
representative
S2 Selection of
non-exposed
cohort
S3
Ascertainm
ent of
exposure
S4 Outcome not
present at
beginning
C1
Comparability of
cohorts in
design phase
C2
Comparability of
cohorts in
analysis phase
O1 Assessment
of outcome O2 Follow-up
sufficient for
outcome to
occur
O3 Adequate
follow-up Total stars
Huddart
(2015)(91) Patients with
emergency
laparoscopic
surgery
* * * * Does not control
for additional
factors in
analysis phase
* 8-months
follow-up
period.
No statement of
follow-up. 5 stars (FAIR
QUALITY)
Jones (2013a)(114) Single centre
pilot study – no
details
provided
Single centre
pilot study – no
details
provided
* Statement of ‘no
history of CA’ was
not provided
Does not control
for additional
factors in design
phase
Does not control
for additional
factors in
analysis phase
* * No details
provided on
sample size
3 stars (POOR
QUALITY)
Jones (2011)(88) * * * Statement of ‘no
history of CA or ICU
admission/ transfer’
was not provided
* Does not control
for additional
factors in
analysis phase
* 1 month * 6 stars (GOOD
QUALITY)
Patel (2011)(97) * * * * Does not control
for additional
factors in design
phase
Does not control
for additional
factors in
analysis phase
* * Retrospective
analysis.
6 stars (GOOD
QUALITY)

Clinical & Cost-effectiveness of the National Early Warning System (NEWS): Systematic Review Update
Health Research Board – Collaboration in Ireland for Clinical Effectiveness Reviews
109
Table 5.3 Quality assessment of before-and-after observational studies on the effectiveness of EWS interventions [continued]
Study Selection Comparability Outcome Overall Quality
S1 Exposed
cohort
representative
S2 Selection of
non-exposed
cohort
S3
Ascertainm
ent of
exposure
S4 Outcome not
present at
beginning
C1
Comparability of
cohorts in
design phase
C2
Comparability of
cohorts in
analysis phase
O1 Assessment
of outcome O2 Follow-up
sufficient for
outcome to
occur
O3 Adequate
follow-up Total stars
(66)Peris (2012) emergency
abdominal
surgery
patients
* * Statement of ‘no
history of ICU
admission/ transfer’
was not provided
Does not control
for additional
factors in design
phase
Does not control
for additional
factors in
analysis phase
* * No statement of
follow-up. 4 stars (POOR
QUALITY)
Schmidt
(2014)(99)
* * * * * Does not control
for additional
factors in
analysis phase
* * Retrospective
analysis.
7 stars (GOOD
QUALITY)
Stewart
(2014)(137)
patients with
RRS
activations,
single hospital
* * Statement of ‘no
history of CA’ was
not provided
Does not control
for additional
factors in design
phase
Does not control
for additional
factors in
analysis phase
* * No statement,
retrospective
review
4 stars (POOR
QUALITY)
Nishijima
(2016)(68)
* * * Statement of ‘no
history of CA’ was
not provided
* Does not control
for additional
factors in
analysis phase
* * No statement of
follow-up,
retrospective
review of patient
charts
6 stars (GOOD
QUALITY)
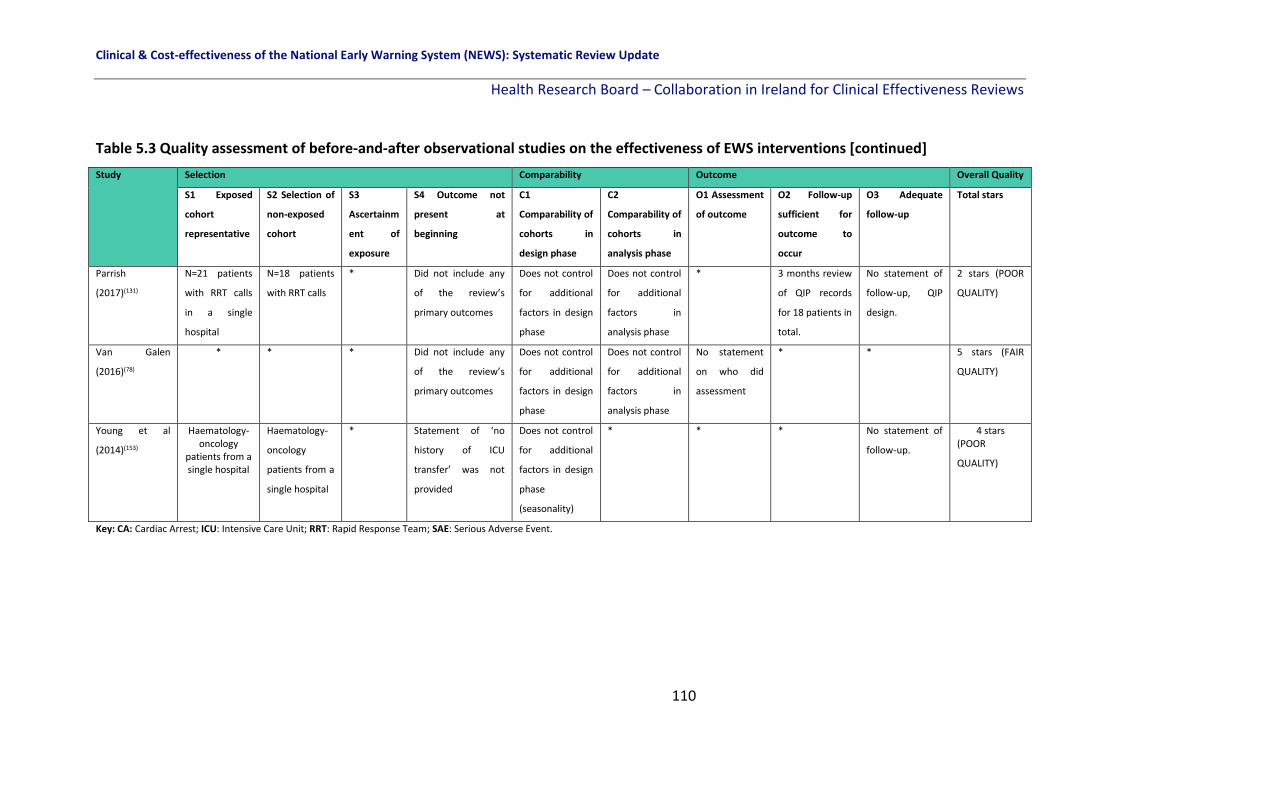
Clinical & Cost-effectiveness of the National Early Warning System (NEWS): Systematic Review Update
Health Research Board – Collaboration in Ireland for Clinical Effectiveness Reviews
110
Table 5.3 Quality assessment of before-and-after observational studies on the effectiveness of EWS interventions [continued]
Study Selection Comparability Outcome Overall Quality
S1 Exposed
cohort
representative
S2 Selection of
non-exposed
cohort
S3
Ascertainm
ent of
exposure
S4 Outcome not
present at
beginning
C1
Comparability of
cohorts in
design phase
C2
Comparability of
cohorts in
analysis phase
O1 Assessment
of outcome O2 Follow-up
sufficient for
outcome to
occur
O3 Adequate
follow-up Total stars
Parrish
(2017)(131) N=21 patients
with RRT calls
in a single
hospital
N=18 patients
with RRT calls * Did not include any
of the review’s
primary outcomes
Does not control
for additional
factors in design
phase
Does not control
for additional
factors in
analysis phase
* 3 months review
of QIP records
for 18 patients in
total.
No statement of
follow-up, QIP
design.
2 stars (POOR
QUALITY)
Van Galen
(2016)(78)
*
* * Did not include any
of the review’s
primary outcomes
Does not control
for additional
factors in design
phase
Does not control
for additional
factors in
analysis phase
No statement
on who did
assessment
* * 5 stars (FAIR
QUALITY)
Young et al
(2014)(153)
Haematology-oncology
patients from a single hospital
Haematology-
oncology
patients from a
single hospital
* Statement of ‘no
history of ICU
transfer’ was not
provided
Does not control
for additional
factors in design
phase
(seasonality)
* * * No statement of
follow-up.
4 stars (POOR
QUALITY)
Key: CA: Cardiac Arrest; ICU: Intensive Care Unit; RRT: Rapid Response Team; SAE: Serious Adverse Event.

Clinical & Cost-effectiveness of the National Early Warning System (NEWS): Systematic Review Update
Health Research Board – Collaboration in Ireland for Clinical Effectiveness Reviews
111
5.7 Certainty of the evidence
We assessed the overall certainty of the evidence for question 2 of the review (How
effective are the different EWSs in terms of improving key patient outcomes in adult (non-
pregnant) patients in acute healthcare setting?). A narrative summary of findings table was
created using GRADEpro software for the following primary outcomes: Mortality, cardiac
arrest, LOS, and transfer or admission to the ICU.
Overall the certainty of the evidence is ‘very low’ owing to a high risk of bias in the various
study designs, a high risk of confounding in the observational studies, small sample sizes and
inconsistency in the results probably owing to the heterogeneous nature of the EWS
interventions applied as well as the variety of single centre settings in various countries
where the findings may not be applicable to other health care settings (Table 5.4).

Clinical & Cost-effectiveness of the National Early Warning System (NEWS): Systematic Review Update
Health Research Board – Collaboration in Ireland for Clinical Effectiveness Reviews
112
Table 5.4 Summary of findings table for primary outcomes in the effectiveness of EWS
interventions (Q2)
Summary of findings:
EWS interventions for detecting acute physiological deterioration
Patient or population: Adult patients (aged 16+ years) Setting: Acute health care settings; High or very high HDI Intervention: EWS interventions Comparison: other EWS/ usual care
Outcomes Impact № of participants (studies)
Certainty of the evidence (GRADE)
Mortality The definition of mortality within the 13 studies varied as did the EWS interventions applied. As a result the findings varied. 6/13 studies found no change in mortality rates as a result of use of the EWS intervention. 7/13 studies found a significant effect on mortality.
244,340, 13 studies (3 RCTs, 1 nRCT, ITS study, 8 observational studies)
⨁◯◯◯ VERY LOW a,b,c,d
Cardiac arrest2 The definition of cardiac arrest within the 7 studies varied as did the EWS interventions applied. As a result the findings varied. 4/7 studies found no change in cardiac arrest rates as a result of use of the EWS intervention. 3/7 studies found a significant effect on cardiac arrest rates (a reduction).
89,767, 7 studies (1 nRCT, 1 ITS study, 5 observational studies)
⨁◯◯◯ VERY LOW a,b,c,d
Length of stay (LOS) 4/5 of the included studies found no change in length of stay (LOS) as a result of use of the EWS intervention. One before-after observational study where an electronic EWS was introduced with automated alerts found a significant reduction in LOS.
24,146, 5 studies (3 RCTs, 2 observational studies)
⨁◯◯◯ VERY LOW a,b,d
Transfer or admission to the ICU
7/10 studies found no change in ICU admission or transfer rates and 3/10 studies found an improvement/reduction in ICU admission or transfer rates as a result of use of the EWS intervention. Given the varying definition of the outcome and heterogeneous nature of the interventions applied this is to be expected.
79,893, 10 studies (3 RCTs, 1 nRCT, 1 ITS study, 5 observational studies)
⨁◯◯◯ VERY LOW a,b,c,d
*The risk in the intervention group (and its 95% confidence interval) is based on the assumed risk in the comparison group and the relative effect of the intervention (and its 95% CI). CI: Confidence interval
GRADE Working Group grades of evidence High certainty: We are very confident that the true effect lies close to that of the estimate of the effect Moderate certainty: We are moderately confident in the effect estimate: The true effect is likely to be close to the estimate of the effect, but there is a possibility that it is substantially different Low certainty: Our confidence in the effect estimate is limited: The true effect may be substantially different from the estimate of the effect Very low certainty: We have very little confidence in the effect estimate: The true effect is likely to be substantially different from the estimate of effect
2 Note: the sample size was not reported by one study included for the outcome cardiac arrest.
a. Downgraded one level due to risk of bias in the RCTs and nRCTS b. Downgraded one level due to risk of bias as observational studies were of poor quality and at a high risk of confounding c. Downgraded one level for inconsistency in findings given the heterogeneous nature of the EWS interventions applied d. Downgraded one level for imprecision due to small sample size and low event rate

Clinical & Cost-effectiveness of the National Early Warning System (NEWS): Systematic Review Update
Health Research Board – Collaboration in Ireland for Clinical Effectiveness Reviews
113
5.8 Discussion
For the studies specific to the effectiveness of EWSs (afferent limb), evidence from the
review is inconsistent. For the primary outcome mortality, of the 13 studies which examined
the effectiveness of EWSs on mortality, seven found a significant effect in mortality rates as
a result of use of the EWS in a total of 244,340 patients. Of the 13 studies, six reported no
change in mortality as a result of use of the EWSs.
For cardiac arrest, in seven studies (no RCTs identified) and 89,767 patients in total, four out
of the seven studies showed no change in the occurrence cardiac arrest as a result of use of
the EWS, while three studies showed a significant reduction in cardiac arrest. In terms of
LOS, four out of the five studies including 24,146 patients in total (and three RCTs), showed
no change in mean or median LOS as a result of EWSs. For the fourth primary outcome, ICU
transfers or admission rates the findings were mixed. Ten studies, including 79,893 patients
overall, reported this outcome, with three studies showing an improvement in ICU transfers
or admission rates while five studies showed no change, and two studies reporting a
worsening of the rates.
The quality of evidence to evaluate the effect of EWS interventions on patient outcomes is
poor due to a number of factors. There were only three RCTs identified and the remaining
studies had higher risk of bias based on their study design. The following limitations were
noted: small sample size in some studies and low event rates; a wide variation in the EWS
interventions used, the definition of the outcomes varied from study to study (for example
mortality may have included death within 24 hours in one study and 30-day mortality in
another). The settings varied and the population included varied. All of these add significant
heterogeneity to the review findings and as a result a meta-analysis was not possible.
Future research is needed to address limitations highlighted in this review. Ideally study
designs of a more rigorous methodological quality are needed, preferably RCTs. A
Clinical & Cost-effectiveness of the National Early Warning System (NEWS): Systematic Review Update
Health Research Board – Collaboration in Ireland for Clinical Effectiveness Reviews
114
standardised approach to the EWS interventions used and the outcomes included are
warranted.
5.9 Conclusion
The findings from the 21 included studies which look at EWS interventions and their effect
on patient outcomes and resources utilisation in adult patients in acute settings is of poor
quality overall. The findings are contrasting owing to the heterogeneous nature of the
interventions included but there was no clear evidence of an effect on primary outcomes
such as mortality and cardiac arrest.

Clinical & Cost-effectiveness of the National Early Warning System (NEWS): Systematic Review Update
Health Research Board – Collaboration in Ireland for Clinical Effectiveness Reviews
115
6 The effectiveness of different EWS chart designs (Q2)
6.1 Chapter overview
This chapter discusses the studies which focussed specifically on early warning systems
chart designs as the key intervention element and the effect on response time to recognise
physiological deterioration and the accuracy of reporting on the results of the score by the
study participants (including healthcare professionals (HCPs) and students).These studies
form part of review question two (effectiveness of EWS interventions).
6.2 Early Warning System Chart Design
Five studies focussed on paper-based EWS chart designs.(42-44, 47, 108) There was one RCT,(47)
three nRCTs (quasi-experimental studies)(42-44) and one observational cohort study.(108) One
included nurses and novice chart users,(43) two included a mix of HCPs(42, 108) and two
included novices in terms of EWS charts from a university setting only.(44, 47) The number and
type of vital sign parameters varied across studies (please refer to 4.2.3, in chapter 4
Descriptive overview of EWSs, for details on parameters included).
6.3 Results for studies focussing on chart design
The results will be discussed according to the three EWS types considered. Three of the
studies considered chart designs based on the ADDS EWS.(42, 44, 47) The fourth study
compared four different EWS chart designs which included BP and HR only.(43) The final
study compared 12 different chart designs using the PARS EWS.(108)
6.3.1 ADDS-based chart design to measure novices ability to recognise clinical
deterioration through percentage errors and response time
An RCT by Christofidis et al.,(47) compared eight different chart formats based on the ADDS
observation chart in university novice chart users using four formats (Table 6.1). Response
time and error rates were recorded for each design in a 2x2x2x2 mixed factorial design in
the two groups.

Clinical & Cost-effectiveness of the National Early Warning System (NEWS): Systematic Review Update
Health Research Board – Collaboration in Ireland for Clinical Effectiveness Reviews
116
Percentage Errors
Participants for whom scores were absent made 2.57% fewer errors (95% CI 1.19-3.94)
using drawn dots (vs. written numbers), (p<0.001). For participants with scores present,
there was no effect seen for data-recording format (p>0.05). Participants for whom scores
were absent made 2.24% fewer errors (95% CI 0.75-3.73) using an integrated colour-based
(vs. tabular) system, (p<0.05). This effect was not significant for participants with scores
present (p>0.05). Participants made 2.13% fewer errors (95% CI 1.01-3.25) using an
integrated colour-based (vs. tabular) system when scoring rows were grouped (p<0.001).
This effect was not significant when scoring rows were separate (p>0.05), (Table 6.1).
Response time
Participants for whom scores were absent responded 2.24 seconds faster (95% CI 1.76-2.72)
using drawn dot (vs. written number) observations (p<0.001) and participants with scores
present responded 0.42 seconds faster (95% CI 0.10-0.74), (p<0.05). Participants for whom
scores were absent responded 3.94 seconds faster (95% CI 3.40-4.48) using an integrated
colour based (vs. tabular) system, (p<0.001) and participants with scores present responded
0.69 seconds faster (95% CI 0.32-1.06), (p<0.001). Participants for whom scores were absent
responded 0.62 seconds faster (95% CI 0.14-1.09) using grouped (vs. separate) scoring rows,
(p<0.05). Participants with scores present responded 0.59 seconds faster (95% CI 0.15-1.04)
using separate (vs. grouped) scoring rows, (p<0.05), (Table 6.1).
6.3.2 ADDS-based chart designs based on scoring rows
A further quasi-experimental factorial design (within subjects, with scoring system design as
the independent variable) by Christofidis et al.(44) compared three different chart designs
based on the ADDS EWS in novice chart users (psychology undergraduates). The scoring
rows were either: 1) grouped together beneath all of the vital sign data (‘grouped rows’); 2)
separated, with each row presented immediately below the corresponding vital sign data

Clinical & Cost-effectiveness of the National Early Warning System (NEWS): Systematic Review Update
Health Research Board – Collaboration in Ireland for Clinical Effectiveness Reviews
117
(‘separate rows’) or 3) excluded altogether (‘no rows’). All three chart designs included a
row for recording overall early warning scores at the bottom of the page.
Response time in recognising clinical deterioration
For ‘no rows’ compared with ‘separate rows’: participants responded 6.35 seconds faster
(95% CI 5.83–6.87) than when there were separate rows (p<0.001). In the second
comparison, ‘no rows’ compared with ‘grouped rows’: participants responded 7.69 seconds
faster (95% CI 7.17–8.20) than when there were grouped rows (p<0.001). For the final
comparison, ’separate rows’ compared with ‘grouped rows’: participants were 1.34 seconds
faster (95% CI 0.82–1.86), (p<0.001). In addition, for each chart, response times were
positively correlated with ‘target’ early warning scores [e.g. score 0-8] indicating that the
more at risk the patient, the slower responses were likely to be (‘grouped rows’, p<0.001;
‘separate rows’, p<0.001; ‘no rows’, p<0.001), (Table 6.1).
Error rate in recognising clinical deterioration
For ‘no rows’ for scoring individual vital signs compared with ‘separate rows’: participants
made 2.48% fewer errors (95% CI 0.86–4.11) when there were ‘no rows’ rather than
‘separate rows’ (p=0.008). For ‘no rows’ compared with ‘grouped rows’: participants made
2.76% fewer errors (95% CI 1.01–4.50) when there were ‘no rows’ than when there were
‘grouped rows’ (p=0.007). However, there was no significant difference found between the
‘separate rows’ and ‘grouped rows’ conditions (p=1), (Table 6.1).
6.3.3 ADDS-based chart design to measure HCPs ability to recognise clinical
deterioration through percentage errors and response time
An nRCT by Christofidis et al.,(42) investigated the effect of six different chart designs (based
on the ADDS EWS) by measuring HCPs’ ability to recognise normal and abnormal
observations and clinical deterioration. Two groups, the first with ‘prior multiple parameter
track and trigger chart experience’ and the second with ‘graphical chart without track and

Clinical & Cost-effectiveness of the National Early Warning System (NEWS): Systematic Review Update
Health Research Board – Collaboration in Ireland for Clinical Effectiveness Reviews
118
trigger experience’ were assessed for the percentage of errors they made and their
response time in recognising clinical deterioration.
Percentage errors
In the ‘prior track and trigger chart experience’ group, the ADDS chart without a BP table
was the best chart design (the HCPs made 9% of errors [95% CI 6-13%]) while the no track
and trigger numerical chart was the worst design (34% errors [95% CI 28-38%]). In the ‘no
prior track and trigger chart experience’ group, the ADDS chart without a BP table was again
the best chart design (the HCPs made 7% of errors [95% CI 3-11%]) while the no track and
trigger graphical chart was the worst design (38% errors [32-46%]), (Table 6.1).
Response time
In terms of response time, the ‘prior track-and-trigger chart experience group’ responded
faster than the ‘no prior track-and-trigger graphical chart experience group’ on their own
chart, (p=0.033). Response time in the ‘prior track and trigger experience chart’ group
ranged from 12 seconds (95% CI 11-13 seconds) in the ADDS chart with BP compared with
18 seconds (95% CI 16-21 seconds) in the no track and trigger numerical chart (best to worst
chart design based on percentage of errors). Response time in the ‘no prior track and trigger
chart experience’ group ranged from 12 seconds (95% CI 9-13 seconds) in the ADDS chart
with a BP table compared with 17 seconds (95% CI 14-19 seconds) in the no track and
trigger numerical chart (best to worst chart design based on percentage of errors).
6.3.4 Chart designs for BP and HR
A 3x2x2 mixed design experiment by Christofidis et al.(43) compared four different chart
designs. There were two groups: ‘seagull trained nurses and novices (psychology
undergraduates)’ and novices only (who did not receive seagull training). Seagull training
involved the use of a visual cue called the ‘Seagull Sign’ to detect physiological
abnormalities.

Clinical & Cost-effectiveness of the National Early Warning System (NEWS): Systematic Review Update
Health Research Board – Collaboration in Ireland for Clinical Effectiveness Reviews
119
Response time in recognising clinical deterioration
For all participants there was no significant difference found between participant groups (all
p values>0.10). There were significant effects of graph format, (p<0.001) and alerting
system, (p=0.01), with a faster response (Table 6.1) seen when both graph format and
alerting system were present, (p=0.002). Simple effects tests revealed that participants
responded faster using separate (compared to overlapping) graphs both on charts with a
track-and-trigger system, (p<0.001), and without (p<0.001). Separate graphs also yielded
faster responses in the presence (compared to absence) of a track-and-trigger system
(p<0.001).
In seagull trained nurses and novices only there was no significant effect of participant
groups (all p values>0.70). However, there were significant effects on response time for
graph format, (p=0.03) and alerting system, (p<0.001), and an additional effect when both
graph format and alerting system were present, (p=0.02). When a track-and-trigger system
was present, participants responded faster using separate (compared with overlapping)
graphs, (p=0.002). For separate graphs, participants also responded faster using designs
with (compared with without) a track-and-trigger system, (p<0.001). It is worth noting from
the table that the difference between groups is literally seconds.
Percentage errors in recognising clinical deterioration
There were no significant participant group effects (all p values >0.10) in recognising clinical
deterioration. However, there were significant effects on graph format, (p<0.001) and
alerting system, (p=0.008), with a greater effect seen (Table 6.1) when both a graph format
and alerting system were present, (p=0.001). Simple effects tests revealed that participants
made fewer errors using separate (compared with overlapping) graphs, both on charts with
a track-and-trigger system (p<0.001) and without (p<0.001). Separate graphs also yielded
fewer errors in the presence (compared with absence) of a track-and-trigger system,
(p<0.001).

Clinical & Cost-effectiveness of the National Early Warning System (NEWS): Systematic Review Update
Health Research Board – Collaboration in Ireland for Clinical Effectiveness Reviews
120
6.3.5 Comparison of old chart (graphic depiction of observations) and new chart (EWS
numerically depicted observations)
A fifth study investigated two different chart designs, the old chart design currently in use
by the participants (which had a graphic depiction of observations) and a new chart, where
the EWS numerically depicted observations. This observational cohort study by Fung et
al.,(108) used six clinical scenarios (1. Low-grade temperature; 2. Spiking temperature; 3.
Tachypnea; 4. Cushing’s response; 5. Hypovolemic shock; and 6. Normal observations),
identically depicted on old and new charts, creating 12 charts.
Response time
The old chart was associated with faster responses in all six clinical scenarios, reaching
statistical significance in five of the six scenarios (p<0.0001, for five scenarios). Overall,
response to the old chart was 1.6 times faster (p<0.0001) than the new chart (Table 6.1).
Accuracy
Additionally, participant’s responses were more accurate in detecting deterioration in all of
the six clinical scenarios on the old chart (graphical depiction) compared with the new chart
(numerical depiction), reaching statistical significance in three of the scenarios (p<0.0001 for
two scenarios, p=0.0008 for one scenario). Overall, the old chart was 15% more accurate
(90% versus 75%, p<0.0001), (Table 6.1).

Clinical & Cost-effectiveness of the National Early Warning System (NEWS): Systematic Review Update
Health Research Board – Collaboration in Ireland for Clinical Effectiveness Reviews
121
Table 6.1 The impact of EWS chart design-based interventions on patient outcomes (Q2 Effectiveness of EWS interventions)
Author, Study design
Description of intervention
Outcomes
RCTs
Christofidis (2015a),(47) 2x2x2x2 mixed factorial design RCT
Sample: 205 novice chart users (university students)
Comparison of 8 different chart formats based on the ADDS chart:
1. Data recording format (drawn dots versus written numbers)
2. Scoring system integration (integrated colour-based system versus non-integrated tabular system)
3. Scoring row placement (grouped versus separate)
4. Scores (present versus absent)
Outcome, secondary post-hoc: Response time
Data recording format (drawn dots versus written numbers): Participants for whom scores were absent responded 2.24 seconds faster (95% CI 1.76-2.72) using drawn dot (vs. written number) observations (p<0.001) and participants with scores present responded 0.42 seconds faster (95% CI 0.10-0.74), (p<0.05). Significant main effect of data recording format: p<0.001.
Scoring system integration (integrated colour-based system versus non-integrated tabular system): Participants for whom scores were absent responded 3.94 seconds faster (95% CI 3.40-4.48) using an integrated colour-based (vs. tabular) system, (p<0.001) and participants with scores present responded 0.69 seconds faster (95% CI 0.32-1.06), (p<0.001). Significant main effect of scoring system integration: p<0.001
Scoring row placement (grouped versus separate): Participants for whom scores were absent responded 0.62 seconds faster (95% CI 0.14-1.09) using grouped (vs. separate) scoring rows, (p<0.05). Participants with scores present responded 0.59 seconds faster (95% CI 0.15-1.04) using separate (vs. grouped) scoring rows, (p<0.05). Insignificant effect of scoring row placement: p=0.941.
Participants responded 2.89 seconds faster (95% CI 2.38-3.39) using an integrated colour based (vs. tabular) system when scoring rows were grouped (p<0.001) and 1.78 seconds faster (95% CI 1.32-2.23) when scoring rows were separate, (p<0.001). Significant scoring system integration by scoring row placement interaction, (p<0.001) In addition, there was a main effect of scores, indicating that participants for whom scores were present (vs. absent) responded faster overall, (p<0.001). However, this effect was also qualified by the interactions with data recording format, scoring system integration and scoring row placement outlined above.
Outcome, secondary post-hoc: Percentage errors:
Data recording format (drawn dots versus written numbers): Significant main effect of data recording format: p<0.001, qualified by a significant data recording format x scores interaction, (p<0.05). Participants for whom scores were absent made 2.57% fewer errors (95% CI 1.19-3.94) using drawn dots (vs. written numbers), (p<0.001). For participants with scores present, there was no effect of data recording format (p>0.05).
Scoring system integration (integrated colour-based system versus non-integrated tabular system): Participants for whom scores were absent made 2.24% fewer errors (95% CI 0.75-3.73) using an integrated colour-based (vs. tabular) system, (p<0.05). This effect was not significant for participants with scores present (p>0.05). Significant main effect of scoring system integration: p<0.05
Scoring row placement (grouped versus separate): Participants made 2.13% fewer errors (95% CI 1.01-3.25) using an integrated colour-based (vs. tabular) system when scoring rows were grouped (p<0.001). This effect was not significant when scoring rows were separate (p>0.05). Scoring row placement yielded no significant interaction with scores (p>0.05)

Clinical & Cost-effectiveness of the National Early Warning System (NEWS): Systematic Review Update
Health Research Board – Collaboration in Ireland for Clinical Effectiveness Reviews
122
Table 6.1 The impact of EWS chart design based interventions on patient outcomes (Q2 Effectiveness of EWS interventions) [continued]
Author, Study design
Description of intervention Outcomes
nRCTs (42)Christofidis (2013), Quasi-experimental design Sample: a mix of 101 HCPs
6 different chart designs based in the ADDS EWS were compared, measuring HCPs ability to recognise normal and abnormal observations and clinical deterioration. 1. ADDS chart with BP table 2. ADDS without BP table 3. Multiple parameter track and trigger chart 4. Single parameter track and trigger chart 5. No track and trigger graphical chart 6. No track and trigger numerical chart
Outcome, secondary post hoc: Percentage of errors in recognising clinical deterioration:
‘Track and trigger chart experience group’: ADDS with BP table: 10% (95% CI 7-14%) ADDS without BP table: 9% (95% CI 6-13%) Multiple parameter track and trigger chart: 15% (95% CI 10-20%) Single parameter track and trigger chart: 21% (95% CI 16-26%) No track and trigger graphical chart: 30% (95% CI 26-36%) No track and trigger numerical chart: 34% (95% CI 28-38%) ‘Graphical chart without track and trigger experience group’: ADDS with BP table: 9% (95% CI 4-14%) ADDS without BP table: 7% (95% CI 3-11%) Multiple parameter track and trigger chart: 28% (95% CI 20-34%) Single parameter track and trigger chart: 23% (95% CI 17-30%) No track and trigger graphical chart: 38% (95% CI 32-46%) No track and trigger numerical chart: 37% (95% CI 30-43%) Outcome, secondary post hoc: Response time in recognising clinical deterioration
The ‘multiple parameter track-and-trigger chart experience group’ responded faster than the ‘no track and trigger graphical chart experience group’ on their own chart, (p= 0.033). Response time in the ‘multiple parameter group’ ranged from 12 seconds (95% CI 11-13) in the ADDS chart with BP compared with 18 seconds (95% CI 16-21) in the no track and trigger numerical chart (best to worst chart design). Response time in the ‘no track and trigger graphical chart experience group’ ranged from 12 seconds (95% CI 9-13) in the ADDS chart with BP compared with 17 seconds (95% CI 14-19) in the no track and trigger numerical chart (best to worst chart design).

Clinical & Cost-effectiveness of the National Early Warning System (NEWS): Systematic Review Update
Health Research Board – Collaboration in Ireland for Clinical Effectiveness Reviews
123
Table 6.1 The impact of EWS chart design-based interventions on patient outcomes (Q2 Effectiveness of EWS interventions) [continued]
Author,
Study design
Description of intervention Outcomes
nRCTs (43)Christofidis (2014), 3x2x2 mixed-design experiment Sample: nurses (41) and novice chart users (113)
Comparison of 4 chart designs for BP and HR: 1. Separate graphs for BP, HR 2. Overlapping graphs for BP, HR 3. Integrated colour-based track and trigger system present 4. No track and trigger system present.
Outcome, secondary post hoc: Response time in recognising clinical deterioration All participants: Simple effects tests revealed that participants responded faster using separate (9 seconds, 95% CI 8-9.5 seconds) vs. overlapping (10 seconds, 95% CI 9-11 seconds)) graphs both on charts with a track-and-trigger system, (p<0.001), and without (p<0.001) [separate 9 seconds, 95% CI 8.5-10 seconds; overlapping 10 seconds, 95% CI 9.5-11 seconds)). Separate graphs also yielded faster responses in the presence (vs. absence) of a track-and-trigger system (p<0.001). No significant main or interaction effect of participant group (all p-values > 0.10). There were significant main effects of graph format, (p<0.001) and alerting system, (p=0.01), qualified by a significant graph format and alerting system interaction, (p=0.002). Seagull cases and seagull trained nurses and novices only: When a track-and-trigger system was present, participants responded faster using separate (8 seconds, 95% CI 7-9 seconds) vs. overlapping (9 seconds, 95% CI 8-10 seconds) graphs, (p=0.002). There were no significant main or interactive effects of participant group (all p values> 0.70). There were significant main effects of graph format, (p=0.03) and alerting system, (p <0.001), qualified by a significant graph format and alerting system interaction, (p=0.02). Outcome, secondary post hoc: Percentage errors in recognising clinical deterioration For all cases no significant main or interactive effect of participant group (all p values >0.10). There were significant main effects of graph format, (p<0.001) and alerting system, (p=0.008), qualified by a significant graph

Clinical & Cost-effectiveness of the National Early Warning System (NEWS): Systematic Review Update
Health Research Board – Collaboration in Ireland for Clinical Effectiveness Reviews
124
format and alerting system interaction, (p=0.001). Simple effects tests revealed that participants made fewer errors using separate (9 seconds, 95% CI 8-11 seconds) vs. overlapping (17 seconds, 95% CI 14-20 seconds) graphs, both on charts with a track and trigger system (p < 0.001) and without (p<0.001). Separate graphs also yielded fewer errors in the presence (vs. absence) of a track and trigger system, (p<0.001).
(44)Christofidis (2015), Quasi-experimental factorial design. Sample: 47 novices in terms of EWS charts from a university setting only.
3 different ADDS based chart designs included. The scoring-rows were
either:
1. grouped together beneath all of the vital sign data (‘grouped rows’);
2. separated, with each row presented immediately below the
corresponding vital sign data (‘separate rows’) or
3. excluded altogether (‘no rows’).
All 3 chart designs included a row for recording overall early-warning scores at the bottom of the page
Outcome, secondary post hoc: Response time in recognising clinical deterioration 1. No rows versus separate rows: participants responded 6.35 seconds faster (95%CI 5.83–6.87) than when there were separate rows (p<0.001) 2. No rows versus grouped rows: 7.69 seconds faster (95%CI 7.17–8.20) than when there were grouped rows (p<0.001). 3. Separate versus grouped rows: participants were 1.34 seconds faster (95%CI 0.82–1.86) with separate vs. grouped rows (p<0.001). In addition, for each chart, response times were positively correlated with ‘target’ early-warning scores [e.g. score 0-8] indicating that the more at risk the patient, the slower responses were likely to be. Grouped rows, p<0.001; separate rows, p<0.001; no rows, p<0.001. Outcome, secondary post hoc: Error rate in recognising clinical deterioration 1. No rows versus separate rows: participants made 2.48% fewer errors (95%CI 0.86–4.11) when there were no rows for scoring individual vital signs rather than separate rows (p=0.008). 2. No rows versus grouped rows: 2.76% fewer errors (95%CI 1.01–4.50) when there were no rows than when there were grouped rows (p=0.007). 3. However, there was no significant difference between the separate and grouped rows conditions (p=1.00).

Clinical & Cost-effectiveness of the National Early Warning System (NEWS): Systematic Review Update
Health Research Board – Collaboration in Ireland for Clinical Effectiveness Reviews
125
Table 6.1 The impact of EWS chart design-based interventions on patient outcomes (Q2 Effectiveness of EWS interventions) [continued]
Author,
Study design
Description of intervention Outcomes
Observational (uncontrolled studies) (108)Fung (2014), Observational cohort study Sample: a mix of 100 HCPs
PARS implemented as part of the Leading Improvements in Patient Safety Programme within hospital. This revised chart aimed to improve the detection and management of deteriorating patients by incorporating early warning scores with routine observations. 6 clinical scenarios (low-grade temperature, spiking temperature, tachypnea, Cushing’s response, hypovolemic shock and normal observations) were identically depicted on old and new charts, creating 12 charts. Old chart: graphic depiction of observations; New chart: EWS numerically depicted observations
Outcomes: Secondary post-hoc: Response time (in seconds) Scenario: Low grade pyrexia Old chart: 5.4 (95% CI 3.4-7.9); New chart: 9.5 (95% CI 7.3-13.0), factor faster 1.8 (p<0.0001) Scenario: Spiking pyrexia Old chart: 3.9 (95% CI 2.7-6.5); New chart: 7.7 (95% CI 5.3-10.4), factor faster 2.0 (p<0.0001) Scenario: Tachypnea Old chart: 4.2 (95% CI 2.9-7.1); New chart: 4.8 (95% CI 3.2-7.4), factor faster 1.1 (p=0.32) Scenario: Shock Old chart: 3.1 (95% CI 1.9-4.8); New chart: 5.3 (95% CI 3.3-7.5), factor faster 1.7 (p<0.0001) Scenario: Cushing’s response Old chart: 2.6 (95% CI 1.9-4.4); New chart: 7.8 (95% CI 5.1-11), factor faster 3.0 (p<0.0001) Scenario: Normal Old chart: 5.4 (95% CI 3.4-8.0); New chart: 12.8 (95% CI 10-18.2), factor faster 2.4 (p<0.0001) Overall speed: Old chart: 4.5 (95% CI 2.7-7.4); New chart: 7.2 (95% CI 4.1-11), factor faster 1.6 (p<0.0001)
Outcomes: Secondary post-hoc: Accuracy Scenario low grade pyrexia: Old chart:55%; New chart:44%, p=0.16 Scenario spiking pyrexia: Old chart:100%; New chart:100%, p=1.0 Scenario tachypnea: Old chart:98%; New chart:78%, p<0.0001 Scenario Shock: Old chart:91%; New chart:89%, p=0.81 Scenario Cushing’s response Old chart:96%; New chart:53%, p<0.0001 Normal: Old chart:98%; New chart:84%, p=0.0008 Overall accuracy: Old chart:90%; New chart:75%, p<0.0001
Key: ADDS: Adult deterioration detection system; BP: Blood pressure; HCP: Health care professional; HR: Heart rate; PARS: Patient at risk score.

Clinical & Cost-effectiveness of the National Early Warning System (NEWS): Systematic Review Update
Health Research Board – Collaboration in Ireland for Clinical Effectiveness Reviews
126
6.4 Methodological quality
Three different study designs were included (one RCT, three nRCTs and one observational
cohort study). The quality of included studies is presented according to the different study
designs.
6.4.1 RCTs
The Cochrane risk of bias tool(23) was used to appraise the methodological quality of the
included RCT.(47)
The single RCT was deemed to have an overall unclear risk of bias owing to an unclear risk of
bias across two domains (allocation concealment, other bias) and a high risk of bias in two
domains (blinding of participants and personnel and blinding of outcome assessment).
[Figure 6.6.1.].
Figure 6.6.1. Risk of bias summary for RCTs of EWS chart design-based interventions

Clinical & Cost-effectiveness of the National Early Warning System (NEWS): Systematic Review Update
Health Research Board – Collaboration in Ireland for Clinical Effectiveness Reviews
127
Allocation concealment and random sequence generation
There was no allocation concealment reported and the trial was deemed to have an unclear
risk of bias.(47) Prior to testing, participants were assigned to one of two conditions using a
random sequence generated by Microsoft Excel 2011 and the trial was judged to have a low
risk of bias in this domain.(47)
Incomplete outcome data
The study had a low risk of bias for attrition and all participants were accounted for.(47)
Knowledge of the allocated interventions prevented (Blinding of participants and
personnel)
The study was not blinded and had a high risk of bias as a result.(47)
Blinding of outcome assessment
The study was not blinded for outcome assessment and it was judged to have a high risk of
bias as a result. (47)
Selective outcome reporting
The study reported all pre-specified outcomes and had a low risk of bias as a result.(47)
Other potential sources of bias
The study had an unclear risk of bias as the sample included university students and novice
charts users and so the findings may not be generalisable to HCPs or the clinical setting. In
addition, the students received course credit to participate (Figure 6.6.2).(47)

Clinical & Cost-effectiveness of the National Early Warning System (NEWS): Systematic Review Update
Health Research Board – Collaboration in Ireland for Clinical Effectiveness Reviews
128
Figure 6.6.2 Risk of bias graph for RCTs of EWS chart design-based interventions
6.4.2 Non-RCTs
The Cochrane Effective Practice and Organisation of Care (EPOC) tool(24) was used to assess
methodological quality of the three nRCT studies(42-44) across nine domains.
The three nRCT studies were deemed to have an unclear risk of bias overall across seven out
of the nine domains (all three studies had a low risk of bias for selective outcome reporting
and protection from contamination) (Figure 6.6.3).(42-44)
Figure 6.6.3 Risk of bias summary of nRCTs of EWS chart-based interventions

Clinical & Cost-effectiveness of the National Early Warning System (NEWS): Systematic Review Update
Health Research Board – Collaboration in Ireland for Clinical Effectiveness Reviews
129
Allocation
Allocation concealment and random sequence generation
Two of the three studies had a high risk of bias for allocation concealment and random
sequence generation as they were non-randomised control trials.(42, 44) Christofidis et al.
(2014)(43) had an unclear risk of bias for allocation concealment as the included purposive
sample of nurses all received the intervention, however the convenience sample of novices
group were randomly assigned to the intervention using an automated excel spread sheet
which allocated each novice participant to a training condition at random (Figure 6.6.4).
Baseline outcome measurements similar
All three trials had an unclear risk of bias as none of them reported baseline outcome
measures and as a result it was not possible to determine whether baseline outcome
measurements were similar or not (Figure 6.6.4).(42-44)
Baseline characteristics similar
All three studies had an unclear risk of bias as baseline characteristics were not reported
(Figure 6.6.4).(42-44)
Incomplete outcome data
Two studies had a low risk of bias for attrition as all participants were accounted for.(43, 44)
Christofidis et al. (2013)(42) had an unclear risk of bias for incomplete outcome data. There
was no statement of the total number of eligible staff approached, non-responders or flow
diagram and thus it was difficult to establish accurate numbers and follow up (Figure 6.6.4).
Knowledge of the allocated interventions prevented (blinding)
Christofidis et al. (2013)(42) had a high risk of bias as it was not blinded. Two studies had an
unclear risk of bias as to whether knowledge of the allocated interventions was prevented
as it was not clear from the papers or explicitly stated (Figure 6.6.4).(43, 44)

Clinical & Cost-effectiveness of the National Early Warning System (NEWS): Systematic Review Update
Health Research Board – Collaboration in Ireland for Clinical Effectiveness Reviews
130
Protected against contamination
All three studies were deemed to have a low risk of bias and were adequately protected
against study contamination (Figure 6.6.4).(42-44)
Selective outcome reporting
All three studies adequately reported outcomes and had a low risk of bias for selective
outcome reporting as a result (Figure 6.6.4).(42-44)
Other potential sources of bias
All three studies were deemed to have an unclear risk of other potential sources of bias.(42-
44) In Christofidis et al. (2013)(42), the charts used for the no track and trigger experience
group were different in design than the ones they actually used in their own hospital so
results may not be representative and all participants were compensated 100 Australian
dollars for their time. In Christofidis et al. (2014),(43) the novice users were recruited from a
university and not an actual clinical environment and the representativeness of the sample
(purposive nursing sample) is questionable. Participants were also paid 75 Australian dollars
to participate and the convenience undergraduate sample was given course credit to
participate. In Christofidis et al. (2015),(44) again students received course credit to
participate; it was not based in an actual clinical setting and the psychology students
experience may not be generalisable to nurses, doctors and HCPs in general. The findings
also only apply to paper based charts in all three studies,(42-44) (Figure 6.6.4).
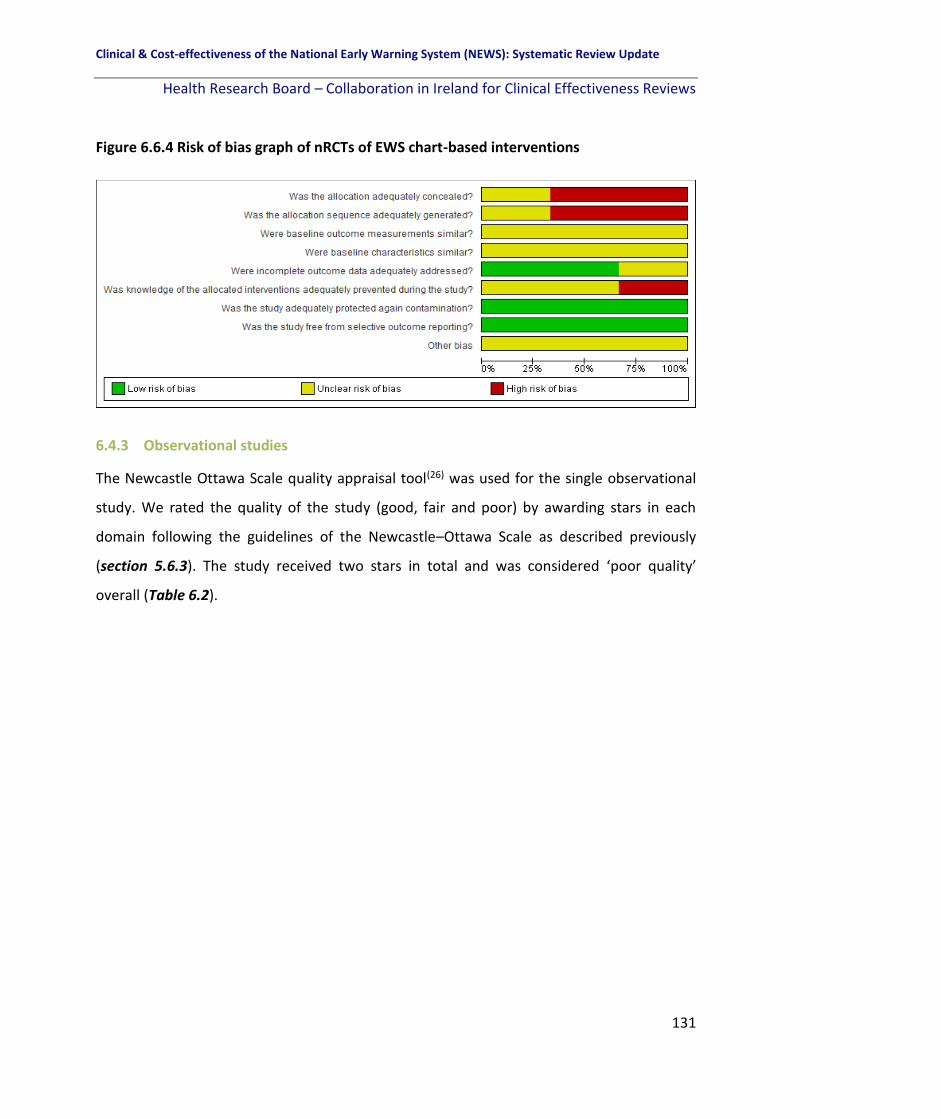
Clinical & Cost-effectiveness of the National Early Warning System (NEWS): Systematic Review Update
Health Research Board – Collaboration in Ireland for Clinical Effectiveness Reviews
131
Figure 6.6.4 Risk of bias graph of nRCTs of EWS chart-based interventions
6.4.3 Observational studies
The Newcastle Ottawa Scale quality appraisal tool(26) was used for the single observational
study. We rated the quality of the study (good, fair and poor) by awarding stars in each
domain following the guidelines of the Newcastle–Ottawa Scale as described previously
(section 5.6.3). The study received two stars in total and was considered ‘poor quality’
overall (Table 6.2).

Clinical & Cost-effectiveness of the National Early Warning System (NEWS): Systematic Review Update
Health Research Board – Collaboration in Ireland for Clinical Effectiveness Reviews
132
Table 6.2 Quality assessment of single observational study investigating the effectivenss of EWS chart design-based interventions
Study Selection Comparability Outcome Overall Quality
S1 Exposed
cohort
representative
S2 Selection of
non-exposed
cohort
S3
Ascertainment
of exposure
S4 Outcome
not present at
beginning
C1
Comparability
of cohorts in
design phase
C2
Comparability
of cohorts in
analysis phase
O1
Assessment of
outcome
O2 Follow-up
sufficient for
outcome to
occur
O3 Adequate
follow-up
Total stars
Observational studies (uncontrolled) (108)Fung (2014) 100 HCPs from
a single UK
hospital.
No description. * * Does not
control for
additional
factors in
design phase
Does not
control for
additional
factors in
analysis phase
Recorded by
study
investigators,
unclear
whether they
were blinded
or if any
objective
measure used
Immediate –
no follow-up.
No statement
of follow-up, or
number of
HCPs eligible to
be included.
2 stars (POOR
QUALITY)
Key: HCP: Health care professional

Clinical & Cost-effectiveness of the National Early Warning System (NEWS): Systematic Review Update
Health Research Board – Collaboration in Ireland for Clinical Effectiveness Reviews
133
6.5 Discussion and conclusion
Five studies focussed on the effectiveness of different EWS chart designs on specific
outcomes including response time (of study particpants to recognise physiological
deterioration) and accuracy (of documentation and recognition of deterioration). Each study
assessed a different chart design, or a different component and it is not possible to combine
the findings overall.
An RCT compared four different design features based on the ADDS observation chart in
novice chart users and found that participants responded faster (for both scores present
and absent) and made fewer errors (for scores absent only) using drawn dot (vs. written
number) observations and an integrated colour-based (vs. non-integrated tabular) scoring
system. A nRCT compared six different chart designs using the ADDS EWS and found that
the ADDS chart without a separate BP table was the best design and no track and trigger
chart designs were the worst in terms of response time and error rates. Another nRCT using
the ADDS EWS compared three different chart designs and found that no rows rather than
grouped rows or separate rows was the best chart design in terms of response time and
error rates.
The fourth study compared four different chart designs for two parameters only (BP and HR)
and found that separate rather than overlapping graphs were best for HR and BP in terms of
both recognising deterioration in patients and in reducing the percentage of errors made by
participants. The fifth study compared two different chart designs (the old chart currently in
use by participants where early warning scores were graphically depicted, and the new
chart where scores were numerically depicted). The graphic depictions of observations was
found to be better than numerical depictions in terms of response time in all six clinical
scenarios used and resulted in more accurate responses (less errors) in all six clinical
scenarios (reaching statistical significance in three). This however could be due to familiarity
with the old chart design.

Clinical & Cost-effectiveness of the National Early Warning System (NEWS): Systematic Review Update
Health Research Board – Collaboration in Ireland for Clinical Effectiveness Reviews
134
The findings of these five studies are only applicable to paper-based EWSs; we found no
relevant studies of electronic EWSs. It must be acknowledged that the results are from five
single studies looking at different components of early warning systems chart design,
making an overall conclusion of the evidence difficult. In addition, where a significant effect
was reported (in particular for response time), the difference was not clinically significant.
Further research is warranted into optimal EWS chart designs, in both paper-based and
electronic systems. The certainty of the evidence is not assessed as these studies did not
include any of the primary outcomes of this review and so a summary of findings table is not
presented. However, our results indicate that different chart designs may well have a
clinically important impact on the rates of recording errors on observation charts, but given
the poor quality of the included studies this would need to be interpreted with caution.

Clinical & Cost-effectiveness of the National Early Warning System (NEWS): Systematic Review Update
Health Research Board – Collaboration in Ireland for Clinical Effectiveness Reviews
135
7 Results: The predictive value in terms of patient outcomes and resource utilisation of EWS interventions for the detection of physiological deterioration in adult (non-pregnant) patients in acute health care settings
7.1 Chapter overview
This chapter in the systematic review focusses on the literature pertinent to question 2 of
the review. “How effective are the different EWSs in terms of improving key patient
outcomes in adult (non-pregnant) patients in acute health care settings?” with a specific
focus on the predictive ability of EWSs. This chapter specifically addresses studies which
measure the predictive ability of EWSs in terms of the primary (mortality, cardiac arrest,
LOS, transfer or admission to the ICU) and secondary outcomes (clinical deterioration in sub-
populations, PROMs [validated tools] and any other outcomes identified post-hoc
[composite outcome of serious adverse events, acute heart failure, hospital-acquired acute
kidney injury, total number of responses and interventions]).
7.2 Overview of studies focussing on the predictive ability of EWSs
Sixty eight studies investigated the predictive ability of one or more EWS.(8, 13, 40, 41, 49, 54-56, 58,
60, 61, 64, 65, 67, 70, 73-78, 83-87, 89, 90, 92-94, 100-106, 110-113, 116, 118, 120-123, 126, 138-152, 154-156, 158) There was
one RCT,(118) two before-after studies,(49, 139) 18 prospective cohorts,(40, 61, 65, 67, 70, 75, 77, 78, 83-87,
100, 101, 104, 110, 148) 43 retrospective cohorts,(8, 13, 41, 54-56, 58, 60, 64, 73, 74, 76, 89, 90, 92-94, 102, 103, 105, 106,
111-113, 116, 120, 121, 123, 138, 140-146, 149, 150, 152, 154-156, 158) and four case control studies.(122, 126, 147, 151)
The sample size ranged from 62 elective surgical patients(138) to 374,838 adult patients
(Table 7.1).(156)
7.3 Overview of EWSs included
Eight studies investigated the predictive ability of NEWS alone.(70, 77, 90, 93, 101, 110, 113, 120) Five
studies investigated the predictive ability of a MEWS alone.(67, 74, 78, 100, 138) Thirty studies
investigated the predictive ability of a number of existing EWSs.(8, 13, 40, 41, 49, 56, 60, 65, 73, 75, 76, 89,

Clinical & Cost-effectiveness of the National Early Warning System (NEWS): Systematic Review Update
Health Research Board – Collaboration in Ireland for Clinical Effectiveness Reviews
136
94, 103-106, 111, 112, 143, 144, 146, 148-152, 155, 156, 158) Twenty-five studies investigated the predictive
ability of newly-developed (often algorithm-based) EWSs, which were compared to other
existing EWSs in most studies.(54, 55, 58, 61, 64, 83-87, 92, 102, 116, 118, 121-123, 126, 139-142, 145, 147, 154)
7.4 Primary outcomes
7.4.1 Mortality
In total, 33 of the 68 studies examined the predictive ability of EWSs for mortality with
varying predictive ability reported.(8, 40, 41, 56, 60, 67, 70, 73, 75, 76, 87, 92-94, 102, 104-106, 111-113, 118, 121, 138,
139, 142, 144, 146, 148, 150, 152, 154, 155, 158)
A single RCT was included. One randomised controlled crossover study in general ward
patients using a prediction model by Bailey et al.,(118) tested the sensitivity and specificity of
the model to predict death. The model had a sensitivity of 54.2% (95% CI 49.6-58.8%) and a
specificity of 89.2% (95% CI 88.8-89.7%), with a PPV of 10.4% (95% CI 9.2-11.7%) and a NPV
of 98.8% (95% CI 98.7-99.0%), (Table 7.1).
Thirty-two observational cohort studies were included with ten examining a single EWS, 15
comparing a number of different EWSs and seven investigated the predictive ability of
newly-developed (often algorithm-based) EWSs, which were compared to other existing
EWSs in most studies. Ten of the 32 observational cohort studies investigated the predictive
ability of a single EWS, with three considering NEWS(70, 93, 113), two studies considering a
MEWS(67, 138) and one study each considering VSS,(76) SCS,(40) ViEWS,(94) Rothman index(150)
and a centile based EWS.(158)
In a retrospective cohort study by Jarvis et al.,(93) including more than 45,000 patients and
942,000 observation sets, the authors calculated the 24-hour risk of serious clinical
outcomes including mortality for vital signs observation sets with NEWS values of 3, 4 and 5,
separately determining risks when the score did/did not include a single score of 3.
Aggregate NEWS values of 3 with a component score of 3 had a significantly lower risk (OR:
0.26) than an aggregate value of 5 (OR: 1.0).

Clinical & Cost-effectiveness of the National Early Warning System (NEWS): Systematic Review Update
Health Research Board – Collaboration in Ireland for Clinical Effectiveness Reviews
137
In a cohort of 330 patients admitted to either a medical, surgical or haematology ward, Luís
et al.,(70) compared the predictive ability of NEWS, to individual parameters within NEWS
(HR, RR, Temperature, SBP, SpO2, FiO2 and AVPU) as well as to a model excluding
temperature and a model excluding SBP. NEWS overall (AUC 0.94, 95% CI 0.91-0.98) was
superior in predicting mortality than any of the individual parameters within NEWS. When
temperature was removed from the NEWS model, the AUC increased to 0.97 (95% CI 0.94,
0.99) and when SBP was removed the AUC dropped to 0.90 (95% CI 0.86-0.95). In terms of
sensitivity and specificity the model removing temperature from NEWS had the highest
sensitivity (97.2%) and specificity (80.7%) at a cut-off of 5.5.
Smith et al.,(113) retrospectively examined the ability of the NEWS compared to 44 different
sets of MET calling criteria to predict mortality in a large UK hospital study including 66,712
unique patients, where an AUC of 0.91 (95% CI 0.91-0.92) was reported. The NEWS at a cut-
off of 7 had superior sensitivity (54.2%) and specificity (97.2%) to all of the different MET
calling criteria.
In a retrospective cohort study Stark et al.,(138) compared the ability of the max MEWS
(highest MEWS score on the day of the event) to predict mortality in 62 elective surgical
patients who had a cardiopulmonary arrest. Max MEWS of three and four both had AUCs
>0.70 and were superior to max MEWS of 5 or more which had AUCs <0.70. The sensitivity
and specificity of max MEWS three and four were greater than max MEWS of five or more in
addition and had greater NPVs.
In 526 sepsis-diagnosed patients from 14 different regions of Italy, Tirotta et al.,(67)
investigated the ability of a MEWS to predict in-hospital mortality. Overall the MEWS had
poor discriminatory ability (AUC 0.60, 95% CI 0.52-0.67). When dichotomized as low risk vs
high risk (MEWS < 4 vs. >4), the MEWS had a sensitivity of 35% (95% CI, 24–46%) and a
specificity of 83% (95% CI, 80–87%), a NPV of 88% (95% CI, 44–91%) and a PPV of 27% (95%
CI, 18–37%) for in-hospital mortality (Table 7.1).
Clinical & Cost-effectiveness of the National Early Warning System (NEWS): Systematic Review Update
Health Research Board – Collaboration in Ireland for Clinical Effectiveness Reviews
138
In a cohort of 1,317 patients with MET calls the VSS EWS was retrospectively applied to
assess its ability to predict mortality.(76) The VSS EWS was a poor predictor of mortality (AUC
0.63).
In a prospective cohort of 752 patients admitted to the AMU, Nguyen et al.,(40) assessed the
ability of the SCS EWS to predict mortality (in-hospital and 30-day mortality). When only age
was included in the model, the AUC was 0.66 for overall mortality. This increased when age
and the SCS were combined (AUC 0.80). Similar findings were generated for in-hospital
mortality and 30-day mortality. In addition, a SCS of 11 had a sensitivity of 72.9% and
specificity of 81.1% to predict 30-day mortality, compared to a sensitivity of 81.3% and
specificity of 73.3% at a score of 10.
In a retrospective cohort study including three different hospitals by Rothman et al.,(150) and
electronic medical record data from over 148,000 patients the ability of the RI EWS to
predict 24-hour mortality was compared in the three different hospitals. The RI had
excellent discriminatory ability in all three (AUCs all >0.92).
In a retrospective cohort study by Tarassenko et al.,(158) including 863 acutely ill in-hospital
medical surgical patients, a centile-based alerting system was modelled using the
aggregated database. The alerting system was constructed using the hypothesis that an EWS
of 3 (which, in most systems, initiates a review of the patient) should be generated when a
vital sign is below the 1st centile or above the 99th centile for that variable. Normalised
histograms (unit area under the curve) and cumulative distribution functions were
generated for four key vital signs (HR, RR, SpO2 and SBP). When compared with EWSs based
on a ‘future outcome’, the cut-off values in this centile-based system were most different
for RR and SBP. With four-hourly observations in a 12-h shift, about 1 in 8 at-risk patients
would trigger this centile-based alerting system during the shift. The authors state that a
centile-based EWS will identify patients with abnormal vital signs regardless of their
eventual outcome and might therefore be more likely to generate an alert when presented
with patients with ‘redeemable morbidity or avoidable mortality’.

Clinical & Cost-effectiveness of the National Early Warning System (NEWS): Systematic Review Update
Health Research Board – Collaboration in Ireland for Clinical Effectiveness Reviews
139
Kovacs et al.,(94) compared the ability of ViEWS to predict death within 24 hours in a cohort
study of over 87,000 medical and surgical patients. The predictive ability of ViEWS was
similar across all groups (all observations non-elective medical, all observations non-elective
surgical, random observations non-elective medical, random observations non-elective
surgical) with all yielding AUC’s >0.90.
Fifteen of the 32 observational cohort studies compared the predictive ability of a number
of existing EWSs.(8, 41, 56, 60, 73, 75, 105, 106, 111, 112, 144, 146, 148, 152, 155)
A retrospective cohort study by Boulos et al.,(41) compared the predictive ability of SIRS
compared to qSOFA in a cohort of patients with MET calls where sepsis was the trigger from
medical, surgical and mental health settings to predict 28-day in-hospital mortality. Both
SIRS (AUC 0.54) and qSOFA (AUC 0.64) had poor predictive ability. SIRS had better sensitivity
(86.4%) than qSOFA (62.1%). The SIRS PPV was 23.7% compared to a PPV of 31.3% for
qSOFA and a NPV of 86% for SIRS versus 85.1% for qSOFA.
A retrospective cohort study by Churpek et al.,(144) including over 59,000 medical and
surgical patients compared the predictive ability of eight different EWSs using vital sign data
extracted from the electronic database. The CART EWS (AUC 0.88, 95% CI 0.86-0.90), ViEWS
(AUC 0.88, 95% CI 0.86-0.91) and SEWS (AUC 0.88, 95% CI 0.86-0.90) all had similar
predictive ability for mortality. The MERIT EWS had the lowest (AUC 0.74, 95% CI 0.71-0.76)
followed by the modified MERIT (AUC 0.79 95% CI 0.76-0.81).
In over 269,000 patients from five hospitals in a retrospective cohort design, Churpek et
al.,(146) compared the electronic CART (eCART) to a MEWS by splitting the data into 60%
development and 40% validation. The eCART (AUC 0.93, 95% CI 0.93-0.93) was superior to
the MEWS (AUC 0.88, 95% CI 0.88-0.88) in predicting mortality.
A prospective observational cohort study by Dawes et al.,(104) compared the Worthing PSS
EWS (in data from 2005 [validation] and 2010 [re-validation]) to the NEWS to predict
mortality. When the final Worthing PSS score in the AMU (2010) was compared to the

Clinical & Cost-effectiveness of the National Early Warning System (NEWS): Systematic Review Update
Health Research Board – Collaboration in Ireland for Clinical Effectiveness Reviews
140
NEWS it had superior predictive ability for mortality (AUC 0.88, 95% CI 0.83-0.94 vs. AUC
0.76, 95% CI 0.72-0.80).
In a retrospective cohort of more than 32,000 general medical or surgical patients, Finlay et
al.,(152) compared the ability of a MEWS and the Rothman index (RI) to predict mortality. In
this cohort, the RI (AUC 0.93, 95% CI 0.92-0.93) was superior to the MEWS (AUC 0.82, 95%
CI 0.82-0.83) in predicting mortality. A MEWS score of four had a sensitivity of 49.8% (and a
specificity of 93.6%) compared to an RI score of -16 which had a sensitivity of 48.9% (and a
specificity of 97.1%) and a RI of 30 which had a sensitivity of 76.8% (and a specificity of
90.4%). The MEWS and RI had similar PPVs and NPVs.
In a study by Jarvis et al.,(106) including more than 64,000 observation sets the authors
investigated the performance of 35 previously published EWSs using three methods of
observation selection (1, all observations; 2, one randomly chosen observation set per
episode and 3, one observation set per episode based on choosing a random point in time
with each episode). The AUC is lowest for any given EWS when all observations in the
dataset were used and highest when one random observation is selected per episode. All
observations range: AUC 0.76 (centiles-based EWS by Tarrassenko et al.,(158)) to AUC 0.90
(NEWS). Observations chosen at random range: AUC 0.78 (Tarrassenko centiles-based EWS)
to AUC 0.91 (NEWS) and for observations chosen at random point in time range: AUC 0.77
(Tarrassenko centiles-based EWS) to AUC 0.91 (NEWS).
In a small retrospective cohort study of 151 patients, Jo et al.,(73) compared the predictive
ability of ViEWS-L (with lactate level) to ViEWS, HOTEL, APACHE II, SAPS II and SAPS III. The
ViEWS-L (AUC 0.80, 95% CI 0.73-0.88) was superior to VIEWS (AUC 0.74, 95% CI 0.66-0.82),
HOTEL (AUC 0.66, 95% CI 0.58-0.75) and APACHE II (AUC 0.69, 95% CI 0.58-0.75), and on par
with SAPS II (AUC 0.80, 95% CI 0.73-0.87) and SAPS III (AUC 0.80, 95% CI 0.73-0.88) in
predicting mortality.

Clinical & Cost-effectiveness of the National Early Warning System (NEWS): Systematic Review Update
Health Research Board – Collaboration in Ireland for Clinical Effectiveness Reviews
141
In a study by Jarvis et al.,(105) the authors investigated the effectiveness of EWSs that have
only two possible scores, 0 (normal, i.e., low risk) or 1 (abnormal, i.e., increased risk), for
each vital sign. The simplified EWS, referred to as ‘binary EWS’, are based on previously
existing standard EWSs (36 published ‘standard’ EWS—the 34 previously compared by Smith
et al.,(8) plus CART and the centiles EWS.(158)) All aggregate EWSs and binary EWS had an AUC
≥0.70 for predicting mortality. Binary EWS had lower discriminatory ability than the
standard EWS in general for predicting death, but these differences were not statistically
significant. Binary NEWS had significantly better discriminatory ability than all other
standard EWS, except the standard NEWS.
In a prospective cohort by Moseson et al.,(148) the authors compared in 227 critically ill
patients admitted to the ICU directly from the ED; the APACHE II, APACHE III, and SAPS II
[ICU scores] to a MEWS, REMS, PEDS, and a pre-hospital critical illness prediction score
developed by Seymour et al.,(159) [ED-based scores] and their ability to predict 60-day
mortality. The ICU scores outperformed the ED scores with higher AUC values. There were
no differences in discrimination among the ED-based scoring systems (AUC 0.69 to 0.74) or
among the ICU-based scoring systems (AUC 0.77 to 0.79).
The SOFA, SAPS III and a MEWS EWSs were compared in a prospective cohort study by Reini
et al.,(75) including 518 patients admitted to the ICU for their ability to predict ICU-mortality.
The SOFA EWS had the best predictive ability (AUC 0.91, 95% CI 0.86-0.97) compared to the
MEWS (AUC 0.80, 95% CI 0.72-0.88) and SAPS III (AUC 0.89, 95% CI 0.83-0.94). The SOFA (at
a score of 8) and SAPS III (at a score of 70) had similar sensitivity and specificity and were
superior in sensitivity to the MEWS (at a score of 6).
In a population of more than 35,000 patients with real-time vital sign data, Smith et al.,(8)
compared the ability of NEWS to detect death to 33 other EWSs currently in use. The NEWS
had an AUC of 0.89 (95 % CI 0.89-0.90) and was superior to all other 33 EWSs whose AUCs
ranged from 0.81 to 0.86.

Clinical & Cost-effectiveness of the National Early Warning System (NEWS): Systematic Review Update
Health Research Board – Collaboration in Ireland for Clinical Effectiveness Reviews
142
A study by Churpek et al.,(155) compared the NEWS, a MEWS, qSOFA and SIRS in predicting
in-hospital mortality. The NEWS had a higher predictive ability (AUC 0.79) than the MEWS
(AUC 0.75), the qSOFA (AUC 0.69) and the SIRS (AUC 0.68).
Qin et al.,(56) compared the ability of the APACHE II, MEWS, the Shock Index, the SOFA and a
modified-MEWS (based on the conventional MEWS, which also included age and
transcutaneous oxygen saturation) to predict 28-day death in a cohort of 292 patients with
septic shock in a single Chinese hospital. The APACHE II had the best discriminatory ability
(AUC 0.78) and the Shock index had the worst (AUC 0.53). The MEWS had an AUC of 0.61
and the SOFA an AUC of 0.62. The modified MEWS had an AUC of 0.70. The optimal
threshold for the APACHE II was reported to be 23.5, 6.5 for the MEWS, 0.78 for the shock
index and 11.5 for the SOFA EWS in predicting 28-day death.
Pimentel et al.,(112) compared the NEWS and NEWS2 using a cohort of 251,266 acute
admissions from five UK hospitals to predict in-hospital death within 24 hours. They split the
cohort into three groups: patients with recorded type two respiratory failure (T2RF)
[n=1,394], those at risk of T2RF [n=48,898], and patients not at risk of T2RF [n=202,094].
Across the three groups, the NEWS had slightly better discriminatory ability than the NEWS2
in predicting in-hospital death within 24 hours. For example, in patients with T2RF, the
NEWS had an AUC of 0.86 (95% CI 0.85, 0.87) and the NEWS2 had an AUC of 0.84 (95% CI
0.83, 0.85). In patients with T2RF the NEWS2 at cut-offs of 5 and 7 reduced sensitivity by
10% and 14%.
In a Danish cohort of 11,266 patients with chronic respiratory disease, Pedersen et al.,(60)
compared the NEWS, CROS, CREWS and S-NEWS EWSs in predicting 48-hour mortality. All
four EWSs had similar predictive ability (NEWS AUC 0.85, CROS AUC 0.82, CREWS AUC 0.85
and S-NEWS AUC 0.84). Applying any of the NEWS modifications resulted in lower
sensitivities, and NPV, and high specificities and PPV, both when using a total score of 6 or 9
as cut-off values.

Clinical & Cost-effectiveness of the National Early Warning System (NEWS): Systematic Review Update
Health Research Board – Collaboration in Ireland for Clinical Effectiveness Reviews
143
Hodgson et al.,(111) compared the predictive ability of the NEWS, CREWS and S-NEWS in a
cohort of 39,470 patients from two UK hospitals. The cohort was split into two, patients
with an acute exacerbation of COPD (AECOPD) [n=2,361] and non-COPD patients
[n=37,109]. When including first admissions only data, in the AECOPD group, the NEWS had
an AUC of 0.74, the CREWS had an AUC of 0.72 and the S-NEWS had an AUC of 0.62. In the
non-COPD group, the NEWS had an AUC of 0.77. Similar findings were reported when all
inpatient episode data were included. The NEWS had a higher sensitivity but lower
specificity than the CREWS and S-NEWS across all groups.
Seven of the 32 observational cohort studies investigated the predictive ability of newly-
developed (often algorithm-based) EWSs, which were compared to other existing EWSs in
most studies.(87, 92, 102, 121, 139, 142, 154)
A retrospective cohort study by Badriyah et al.,(102) using decision tree analysis and a data
mining technique to create the DTEWS in over 35,000 acute medical admissions compared
the predictive ability of this electronic system to NEWS. The DTEWS had a similar AUC for
mortality to the NEWS (AUC 0.90, 95% CI 0.90-0.91 vs. AUC 0.89, 95% CI 0.89-0.90). The
authors also found that a trigger point of 5 for DTEWS and 4 for NEWS would detect 83% of
those who die within 24 hours of a given EWS value, requiring a response to only 25% of
either DTEWS or NEWS values.
A retrospective cohort study including over 27,000 medical patients by Bleyer al.,(142)
compared the predictive ability of the critical vital sign EWS to the ViEWS and a MEWS. A
critical vital sign (these included SBP, temperature, SpO2, RR and level of consciousness) was
arbitrarily defined as the level at which a patient who sustained the given vital sign during
an admission had a 5% or greater chance of dying. The predictive ability of the critical vital
sign EWS was similar to ViEWS (AUC 0.86) and NEWS (AUC 0.87) for ages 60-70 years (AUC
0.84), ages >70 (AUC 0.87) and ages >80 (AUC 0.86).

Clinical & Cost-effectiveness of the National Early Warning System (NEWS): Systematic Review Update
Health Research Board – Collaboration in Ireland for Clinical Effectiveness Reviews
144
In a retrospective cohort study, Churpek et al.,(121) developed an EWS based on location and
time-stamped vital signs obtained from the hospital electronic medical record. Four models
were generated (one for each outcome, Model 1: ICU transfer, Model 2: Cardiac arrest,
Model 3: Mortality, and Model 4: Composite outcome) in one half of the training dataset
and validated in the other half. The ability of the different models to predict mortality
ranged from 0.73 to 0.82, with Model 3 having the best AUC.
A prospective cohort study including 108 medical patients by Durusu-Tanriover et al.,(87)
compared the predictive ability of a MEWS to the individual vital signs. The highest total
MEWS score and the highest neurological score (AVPU) had the best predictive ability for
mortality (AUC 0.85, 95% CI 0.77-0.91 and AUC 0.85, 95% CI 0.77-0.91, respectively).
Sensitivity and specificity of the individual parameters varied with the highest BP score
having a sensitivity of 100% compared to 85.7% for the MEWS highest total score (Table
7.1). Specificity ranged from 33.6% (BP) to 100% for highest neurological score.
In a cohort of more than 86,000 adult medical patients, Jarvis et al.,(92) developed a
laboratory-based decision tree EWS (LDT-EWS) in a single set (n=3,496) and validated it in 22
different sets (n=3,428-4,093) to predict in-hospital mortality. The AUC was for the LDT-EWS
ranged from 0.75 (95% CI 0.72-0.78) to 0.80 (95% CI 0.77-0.82), with similar AUC’s found in
males only and females only.
In a cohort of over 31,000 adult non-ICU patients admitted to one of three different
hospitals, Umscheid et al.,(139) examined the ability of the 7-item sepsis EWRS to detect
mortality in a before-after intervention study. The EWRS had low sensitivity (6%) and
specificity (16%) to detect mortality in the derivation cohort (with very similar findings for
the validation cohort). The EWRS had a PPV of 97% and NPV of 26% to detect mortality in
the derivation cohort (with very similar findings for the validation cohort).
Churpek et al.,(154) compared nine different machine learning techniques to a MEWS in
269,999 hospitalised medical-surgical ward patients from five US hospitals in predicting

Clinical & Cost-effectiveness of the National Early Warning System (NEWS): Systematic Review Update
Health Research Board – Collaboration in Ireland for Clinical Effectiveness Reviews
145
ward death. Eight out of the nine different machine learning techniques were superior to
the MEWS, with the random forest model (AUC 0.94) having the highest discriminatory
ability and the decision tree model having the lowest (AUC 0.87). The MEWS had an AUC of
0.88.
7.4.2 Cardiac arrest
In total, 15 of the 68 studies examined the predictive ability of EWSs for cardiac arrest with
varying predictive ability reported.(8, 93, 94, 102, 105, 112, 113, 121-123, 143-146, 154)
There were 14 retrospective cohort studies included which were compared to other existing
EWSs in most studies with three examining a single EWS, six comparing a number of
different EWSs and five investigated the predictive ability of newly-developed (often
algorithm-based) EWS.
Three of the retrospective cohort studies investigated the predictive ability of a single EWS,
with two considering NEWS(70, 93, 113), and one study considering ViEWS.(94)
In a retrospective cohort study by Jarvis et al.,(93) including more than 45,000 patients and
942,000 observation sets, the authors calculated the 24-hour risk of serious clinical
outcomes including cardiac arrest for vital signs observation sets with NEWS values of 3, 4
and 5. They also determined the risks when the score did/did not include a single score of 3.
Aggregate NEWS values of 3 with or without a component score of 3 have significantly lower
risks (OR: 0.24 and 0.21) than an aggregate value of 5 (OR: 1.0).
Smith et al.,(113) examined the ability of the NEWS compared to 44 different MET calling
criteria sets to predict cardiac arrest in a cohort of 66,712 patients in a large UK hospital.
The NEWS had an AUC of 0.78 (95% CI 0.76, 0.78), a sensitivity of 22.2% and a specificity of
97.0%. The position of the NEWS ROC curve was above and to the left of all MET criteria
points, indicating better discrimination.

Clinical & Cost-effectiveness of the National Early Warning System (NEWS): Systematic Review Update
Health Research Board – Collaboration in Ireland for Clinical Effectiveness Reviews
146
Kovacs et al.,(94) compared the ability of ViEWS to predict cardiac arrest in a cohort of over
87,000 medical and surgical patients. The predictive ability of ViEWS was similar across all
groups (all observations non-elective medical, all observations non-elective surgical, random
observations non-elective medical, random observations non-elective surgical) with all
yielding AUCs >0.70.
Six of the retrospective cohort studies investigated the predictive ability of a number of
existing EWSs.(8, 106, 112, 143, 144, 146)
A retrospective cohort study by Churpek et al.,(144) including over 59,000 medical and
surgical patients, compared the predictive ability of eight different EWSs using vital sign
data extracted from the electronic database. The CART EWS had the best predictive ability
(AUC 0.83, 95% CI 0.79-0.86) followed by ViEWS (AUC 0.77, 95% CI 0.72-0.82). The MERIT
EWS had the lowest AUC (0.63, 95% CI 0.59-0.68) and poor discriminatory power to predict
cardiac arrest.
A retrospective cohort study by Churpek et al.,(143) including over 47,000 patients, compared
the predictive ability of the CART score to a MEWS using ward vital signs collected from
admission to discharge. The CART score was superior to the MEWS in terms of predicting
cardiac arrest (AUC 0.84 vs. AUC 0.76).
In over 269,000 patients from five hospitals, Churpek et al.,(146) compared the electronic
CART (eCART) to a MEWS by splitting the data into 60% development and 40% validation.
The eCART (AUC 0.83, 95% CI 0.82-0.83) was superior to the MEWS (AUC 0.71, 95% CI 0.70-
0.73) in predicting cardiac arrest. At a specificity of 90%, the eCART had higher sensitivity
(54%) for cardiac arrest compared with the MEWS (39%).
In a retrospective cohort study by Jarvis et al.,(105) the authors investigated the effectiveness
of EWSs that have only two possible scores, 0 (normal, i.e., low risk) or 1 (abnormal, i.e.,
increased risk), for each vital sign. The simplified EWSs, referred to as ‘binary EWS’, were
based on previously existing standard EWSs (36 published ‘standard’ EWS—the 34

Clinical & Cost-effectiveness of the National Early Warning System (NEWS): Systematic Review Update
Health Research Board – Collaboration in Ireland for Clinical Effectiveness Reviews
147
previously compared by Smith et al.,(8) plus CART and the centiles EWS.(158)) All aggregate
EWSs and binary EWSs had an AUC ≥0.60. Binary EWSs had lower discriminatory ability than
the standard EWSs in general for predicting cardiac arrest, but these differences were not
statistically significant. Binary NEWS had significantly better discriminatory ability than all
other standard EWSs, except the standard NEWS.
In a population of more than 35,000 patients with real-time vital sign data, Smith et al.,(8)
compared the ability of NEWS to detect cardiac arrest to 33 other EWSs currently in use.
The NEWS had an AUC of 0.72 (95% CI 0.69-0.76) and was superior to all other 33 EWSs
whose AUCs ranged from 0.61 to 0.71.
Pimentel et al.,(112) compared the predictive ability of the NEWS and NEWS2 in a cohort of
251,266 adult acute admissions from five UK hospitals to predict cardiac arrest. Three
groups were compared: those with T2RF (n=1,394), those at risk of T2RF (n=48,898) and
patients with no risk (control) of respiratory failure (n=202,094). Both the NEWS and NEWS2
had similar discriminatory ability in each of the three groups (AUCs > 0.70).
Five of the retrospective cohort studies investigated the predictive ability of newly-
developed (often algorithm-based) EWSs, which were compared to other existing EWSs in
most studies.(102, 121, 123, 145, 154)
A retrospective cohort study by Badriyah et al.,(102) using decision tree analysis and a data
mining technique to create the DTEWS in over 35,000 acute medical admissions compared
the predictive ability of this electronic system to NEWS. The DTEWS had a similar AUC for
cardiac arrest to the NEWS (AUC 0.71, 95% CI 0.67-0.75 vs. AUC 0.72, 95% CI 0.69-0.76).
A retrospective cohort study by Churpek in 109 cardiac arrest patients, 2,543 ICU transfer
patients and 56,000 controls compared the predictive ability of the newly developed cardiac
arrest EWS (using electronic health record data) to the ViEWS.(145) The AUC for the cardiac
arrest model to predict a cardiac arrest event was 0.88 (95% CI 0.84-0.91) and superior to
the ViEWS (AUC: 0.78, 0.73-0.83). Similar findings were generated for the model’s ability to

Clinical & Cost-effectiveness of the National Early Warning System (NEWS): Systematic Review Update
Health Research Board – Collaboration in Ireland for Clinical Effectiveness Reviews
148
predict cardiac arrest within 24 hours (Table 7.1). The cardiac arrest model had a sensitivity
of 65% compared to ViEWS (41%) and a specificity of 93%. The derived model had a
specificity of 95% (compared to ViEWS – 85%) at the cut-off with 60% sensitivity.
A further retrospective cohort study by Churpek et al.,(121) where the authors developed an
EWS based on location and time-stamped vital signs obtained from the hospital electronic
medical record was included. Four models were generated (one for each outcome, Model 1:
ICU transfer, Model 2: Cardiac arrest, Model 3: Mortality, and Model 4: Composite
outcome) in one half of the training dataset and validated in the other half. The ability of the
different models to predict cardiac arrest ranged from AUC 0.74 to 0.76, with Models 1 and
4 having the best AUCs.
In a cohort of over 269,000 patients admitted to five different hospitals, Churpek et al.,(123)
compared the predictive ability of vital signs (Temperature, RR, HR, SBP, DBP, Pulse pressure
index, Shock index, SpO2) and a MEWS prior to cardiac arrest in elderly (>65 years) and non-
elderly (<65 years) patients using data from prospectively collected electronic health
records. In both the elderly (AUC 0.71, 95% CI 0.68-0.75) and non-elderly (AUC 0.85, 95% CI
0.82-0.88) the MEWS had the best predictive ability to detect cardiac arrest, followed by RR
(highest value), (Elderly AUC: 0.67, 95% CI 0.64-0.71; non-elderly AUC: 0.82, 95% CI 0.79-
0.86) and shock index (highest value), (Elderly AUC: 0.67, 95% CI 0.63-0.70; non-elderly AUC:
0.76, 95% CI 0.72-0.81).
Churpek et al.,(154) compared nine different machine learning techniques to a MEWS in a
cohort of 269,999 hospitalised medical-surgical patients from five US hospitals. All nine
machine learning techniques had superior discriminatory ability (AUCs ranged from 0.74 to
0.83) when compared to the MEWS (AUC 0.71).
A single case control study was included. A nested case-control study by Churpek et al.,(122)
including 88 cases of cardiac arrest and 352 matched controls in medical and surgical wards.
The accuracy of a MEWS and routinely collected vital signs (RR, HR, DBP, SBP, pulse pressure

Clinical & Cost-effectiveness of the National Early Warning System (NEWS): Systematic Review Update
Health Research Board – Collaboration in Ireland for Clinical Effectiveness Reviews
149
index, temperature and SpO2) were compared using the maximum and minimum values for
each to predict cardiac arrest. The MEWS (AUC 0.77, 95% CI 0.71-0.82) followed by
maximum RR (AUC 0.72, 95% CI 0.65-0.78) had the best predictive ability. Maximum
temperature (AUC 0.48, 95% CI 0.42-0.56) and maximum DBP (AUC 0.53, 95% CI 0.45-0.60)
had the lowest AUCs for predicting cardiac arrest.
7.4.3 LOS
One prospective cohort study examined the predictive ability of an EWS on LOS.(40) In 752
patients admitted to the AMU, Nguyen et al.,(40) assessed the ability of the SCS EWS to
predict LOS longer than three days. When only age was included in the model, the AUC was
0.65. This increased when age and the SCS were combined (AUC 0.70). A SCS of 7 had a
sensitivity of 66.2% and specificity of 63.6% to predict LOS.
7.4.4 Transfer or admission to the ICU
In total 20 of the 68 studies examined the predictive ability of EWSs on transfer or
admission to the ICU with varying predictive ability reported.(8, 49, 60, 74, 93, 94, 102, 105, 112, 113, 116,
118, 121, 140, 143-147, 154)
Of these 20 studies, one RCT, one before-after study, 17 cohort studies and one
retrospective case control study(147) examined ability to predict transfer or admission to the
ICU.
One randomised controlled crossover trial in general ward patients using a prediction model
by Bailey et al.,(118) tested the sensitivity and specificity of the model to predict ICU transfer.
The model had a sensitivity of 41.1% (95% CI 37.9-44.5%) and a specificity of 89.6% (95% CI
89.2-90.0%), with a PPV of 15.2% (95% CI 13.8-16.7%) and a NPV of 97.1% (95% CI 96.8-
97.3%), (Table 7.1).
One before-after intervention study by DeMeester et al.,(49) compared the predictive ability
of a MEWS to SAPS, reporting that the SAPS (AUC 0.70) was superior to the MEWS (AUC

Clinical & Cost-effectiveness of the National Early Warning System (NEWS): Systematic Review Update
Health Research Board – Collaboration in Ireland for Clinical Effectiveness Reviews
150
0.60). A SAPS score of three had a sensitivity of 61% compared to 40% for a MEWS score of
three. Specificity for SAPS was 74% compared to 76% for the MEWS (Table 7.1).
There were 17 cohort studies which examined the ability of EWSs to predict transfer or
admission to the ICU with four examining a single EWS, seven comparing a number of
different EWSs and six investigated the predictive ability of newly-developed (often
algorithm-based) EWSs, which were compared to other existing EWSs in most studies.
Four of these 17 cohort studies investigated the predictive ability of a single EWS, with two
considering NEWS(70, 93, 113), one considering a MEWS(74) and one study considering ViEWS.(94)
In a retrospective cohort study by Jarvis et al.,(93) including more than 45,000 patients and
942,000 observation sets, the authors calculated the 24-hour risk of serious clinical
outcomes including unplanned ICU transfer for vital signs observation sets with NEWS
values of 3, 4 and 5, separately determining risks when the score did/did not include a single
score of 3. Aggregate NEWS values of either 3 or 4 with a component score of 3 have
significantly lower risks (OR: 0.23 and 0.46) than an aggregate value of 5 (OR: 1.0).
Smith et al.,(113) compared the NEWS to 44 different MET calling criteria in a large UK
hospital including over two million vital sign sets from 66,712 patients to predict unplanned
ICU admission. The NEWS had an AUC of 0.86 (95% CI 0.85-0.86), a sensitivity of 37.4% and
specificity of 97.1%. For all outcomes (mortality, cardiac arrest and unplanned ICU
admission) the position of the NEWS ROC curve was above and to the left of all 44 different
MET criteria points, indicating better discrimination.
Yoo et al.,(74) investigated the predictive ability of a MEWS compared to MEWS with blood
lacate (MEWS BLA) in 100 septic patients in a single hospital in South Korea to predict ICU
transfer. When blood lactate was added the AUC was 0.90 compared to MEWS alone where
the AUC was 0.82. At a cut-off of 5.5, the MEWS had higher sensitivity (81.6%) than the
MEW BLA at a cut-off of 3.05 (73.7%) but lower specificity (66.1% versus 87%).

Clinical & Cost-effectiveness of the National Early Warning System (NEWS): Systematic Review Update
Health Research Board – Collaboration in Ireland for Clinical Effectiveness Reviews
151
Kovacs et al.,(94) compared the ability of ViEWS to predict unplanned ICU transfer in a cohort
of over 87,000 medical and surgical patients. The predictive ability of ViEWS was similar
across all groups (all observations non-elective medical, all observations non-elective
surgical, random observations non-elective medical, random observations non-elective
surgical) with all yielding AUCs >0.80 (Table 7.1).
Seven of the cohort studies investigated the predictive ability of a number of existing EWSs
(8, 60, 105, 112, 143, 144, 146)
A retrospective cohort study by Churpek et al.,(144) including over 59,000 medical and
surgical patients compared the predictive ability of eight different EWSs using vital sign data
extracted from the electronic database. The CART EWS had the highest AUC (0.77, 95% CI
0.76-0.78) and the MERIT EWS had the lowest (AUC 0.64, 95% CI 0.63-0.65).
A retrospective cohort study by Churpek et al.,(143) including over 47,000 patients compared
the predictive ability of the CART score to a MEWS using ward vital signs collected from
admission to discharge. The CART score was superior to the MEWS in terms of predicting
ICU transfer (AUC 0.71 vs. AUC 0.67).
In over 269,000 patients from five hospitals, Churpek et al.,(146) compared the electronic
CART (eCART) to a MEWS by splitting the data into 60% development and 40% validation.
The eCART (AUC 0.75, 95% CI 0.74-0.75) was superior to the MEWS (AUC 0.68, 95% CI 0.68-
0.68) in predicting ICU transfer.
In a study by Jarvis et al.,(105) the authors investigated the effectiveness of EWSs that have
only two possible scores, 0 (normal, i.e., low risk) or 1 (abnormal, i.e., increased risk), for
each vital sign. The simplified EWSs, referred to as ‘binary EWS’, were based on previously
existing standard EWSs (36 published ‘standard’ EWS—the 34 previously compared by Smith
et al.,(8) plus CART and the centiles EWS).(158) All aggregate EWSs and binary EWSs had an
AUC ≥0.70 for predicting unplanned ICU admission (except Bakir EWS and CART). Binary
EWSs had lower discriminatory ability than the standard EWS in general but these

Clinical & Cost-effectiveness of the National Early Warning System (NEWS): Systematic Review Update
Health Research Board – Collaboration in Ireland for Clinical Effectiveness Reviews
152
differences were not significant. Binary NEWS had significantly better discriminatory ability
than all other standard EWSs, except the standard NEWS.
In a population of more than 35,000 patients with real-time vital sign data, Smith et al.,(8)
compared the ability of NEWS to detect unanticipated ICU admission to 33 other EWSs
currently in use. The NEWS had an AUC of 0.86 (95% CI 0.85-0.87) and was superior to all
other 33 EWSs whose AUCs ranged from 0.57 to 0.83.
Pimentel et al.,(112) investigated the ability of the NEWS and NEWS2 to predict unanticipated
ICU admission in a cohort of 251,266 acute adult admissions in five UK hospitals. The cohort
as previously described was split into three groups: those with documented T2RF (n=1,394),
those at risk of T2RF (n=48,898) and those with no risk of T2RF (n=202,094). Similar to the
findings for mortality and cardiac arrest, the two EWSs had similar predictive ability across
the three groups for unanticipated ICU admission. For example, in the group with
documented T2RF, the NEWS had an AUC of 0.81 (95% CI 0.79, 0.83) and the NEWS2 had an
AUC of 0.82 (95% CI 0.80, 0.84). In those patients at risk of T2RF, the NEWS had an AUC of
0.81 (95% CI 0.81, 0.82) almost identical to the NEWS2 (AUC 0.81, 95% CI 0.81, 0.82).
Pedersen et al.,(60) compared the predictive ability of the NEWS to modified EWSs including
the CROS, CREWS and S-NEWS in a cohort of 11,266 patients with a diagnosis of chronic
respiratory disease for ICU admission in Denmark. All four EWSs had similar AUCs (NEWS
AUC 0.79, S-NEWS AUC 0.79, CREWS AUC 0.81 and CROS AUC 0.81). Similar to the findings
for mortality, applying any of the NEWS modifications (CREWS, CROS, S-NEWS) resulted in
lower sensitivities and NPV, and higher specificities and PPV, when using a total score of 6 or
9 (Table 7.1).
Six of the cohort studies investigated the predictive ability of newly-developed (often
algorithm-based) EWSs, which were compared to other existing EWSs in most studies.(102,
116, 121, 140, 145, 154)

Clinical & Cost-effectiveness of the National Early Warning System (NEWS): Systematic Review Update
Health Research Board – Collaboration in Ireland for Clinical Effectiveness Reviews
153
A retrospective cohort study by Alaa et al.(140) in general medical patients developed and
validated a model using electronic medical records and compared it a MEWS, SOFA, APACHE
II and the RI EWS. The AUC for ICU admission for this model (AUC 0.81) was superior to the
other EWSs (MEWS AUC 0.64, SOFA AUC 0.62, APACHE II AUC 0.63 and RI AUC 0.72). The
proposed risk model at a true positive rate (TPR) of 60, had a positive predictive value (PPV)
of 30%. The risk score offers a lower false alarm rate compared to all other EWSs for all TPR
settings (40%, 50%, 60%, 70% and 80%).
A retrospective cohort study by Badriyah et al.,(102) using decision tree analysis and a data
mining technique to create the DTEWS in over 35,000 acute medical admissions compared
the predictive ability of this electronic system to NEWS. The DTEWS had a similar AUC for
unanticipated ICU admission to the NEWS (AUC 0.86, 95% CI 0.85-0.87 vs. AUC 0.86, 95% CI
0.85-0.87).
A retrospective cohort study by Churpek et al.,(145) in 109 cardiac arrest patients, 2,543 ICU
transfer patients and 56,000 controls compared the predictive ability of the newly
developed ICU transfer model (using electronic health record data) to the ViEWS. The AUC
for the ICU transfer model to predict ICU transfer was 0.77 (95% CI 0.76-0.78) and superior
to the ViEWS (AUC: 0.73, 95% CI 0.72-0.74). Similar findings were found for the model’s
ability to predict ICU transfer within 24 hours.
A further retrospective cohort study in which Churpek et al.,(121) developed an EWS based on
location and time-stamped vital signs obtained from the hospital electronic medical record
was included. Four models were generated (one for each outcome, Model 1: ICU transfer,
Model 2: Cardiac arrest, Model 3: Mortality, and Model 4: Composite outcome) in one half
of the training dataset and validated in the other half. The ability of the different models to
predict ICU transfer ranged from 0.68 to 0.71.
In a retrospective cohort study of 19,000 general patients, Hackmann et al.,(116) measured
the predictive ability of an electronic EWS with over 300 parameters to predict ICU transfer
Clinical & Cost-effectiveness of the National Early Warning System (NEWS): Systematic Review Update
Health Research Board – Collaboration in Ireland for Clinical Effectiveness Reviews
154
and compared it to a real-time simulator of the model in just over 1,200 patients in a mini
trial. The electronic model had an AUC of 0.88 and when compared to a real-time simulator
of the model the AUC was 0.73. The electronic model had similar sensitivity (49%) and
specificity (95%) to the real-time simulator of the model (sensitivity 41%, specificity 95%).
This was also true for the PPV and NPV in both models.
Churpek et al.,(154) compared nine different machine learning techniques to a MEWS in a
cohort of 269,999 medical-surgical patients from five US hospitals to predict ICU transfer.
Similar to the findings for cardiac arrest and mortality, the random forest model had the
best predictive ability (AUC 0.78) and the MEWS had the lowest (AUC 0.68). RR, HR, age and
SBP were the most important predictor variables in the random forest model.
There was a single case-control study which examined the ability of an EWS to predict
transfer or admission to the ICU.
One retrospective case control study including over 43,000 surgical and medical patients
from 14 hospitals in the USA compared a 14-item electronic EWS to a MEWS in terms of
unplanned ICU transfer.(147) In the derivation cohort the MEWS had an AUC of 0.71 (95% CI
0.70-0.72) compared to the electronic EWS which had an AUC of 0.85 (95% CI 0.83-0.86).
The EWS had superior AUC in the validation cohort (MEWS: 0.70, 95% CI 0.69-0.71 vs.
electronic EWS 0.78, 95% CI 0.75-0.80). Similar findings were produced when only one
randomly selected observation per patient was included (Table 7.1).
7.5 Secondary outcomes
7.5.1 Clinical deterioration in sub-populations
In total, 13 of the 68 studies examined the ability of EWSs to predict clinical deterioration in
sub-populations.(13, 55, 56, 58, 61, 64, 65, 67, 74, 100, 103, 120, 151) with 12 cohort studies and one case
control study.

Clinical & Cost-effectiveness of the National Early Warning System (NEWS): Systematic Review Update
Health Research Board – Collaboration in Ireland for Clinical Effectiveness Reviews
155
Of the 12 cohort studies examining predictive ability, four investigated a single EWS, four
compared a number of existing EWSs and four investigated newly developed EWSs.
Four of the 12 cohort studies investigated the predictive ability of a single EWS, with one
considering NEWS(120) and three considering a MEWS.(74)
A retrospective cohort study by Capan et al.,(67, 100, 120) used electronic medical records to
identify optimal patient-centred RRT activation rules using the NEWS. There were 12
statistically significant sub-populations identified in the study. Of these there were two
categories of patients with distinct RRT thresholds. Highly frail surgical patients with no
previous deterioration events had an optimal RRT activation at NEWS of 1-4 and moderately
frail medical patients had an optimal RRT activation threshold at a NEWS of ≥7 to detect
clinical deterioration (Table 7.1).
In a prospective cohort by Suppiah et al.,(100) including 142 acute pancreatitis patients, the
ability of a MEWS to detect severe acute pancreatitis was examined using the highest MEWS
value and the mean MEWS value for each patient. The AUC for the highest MEWS was 0.92
(95% CI 0.85-1.00) and this was similar to the mean MEWS (AUC 0.91, 95% CI 0.84-0.99).
The sensitivity (95.5%) and specificity (90.8%) for the highest MEWS (≥3) was similar to that
of the mean MEWS (>1) sensitivity (95.5%) and specificity (87.5%) in detecting severe acute
pancreatitis.
Tirotta et al.,(67) included 526 sepsis-diagnosed patients from 31 different medical wards in
Italy to investigate the predictive ability of a MEWS for in-hospital mortality. The MEWS had
an AUC of 0.60 (95% CI 0.52, 0.67) and when dichotomised as low risk vs high risk (MEWS <
4 vs. >4), the MEWS had a sensitivity of 35% (95% CI, 24–46%) and a specificity of 83% (95%
CI, 80–87%), a NPV of 88% (95% CI, 44–91%) and a PPV of 27% (95% CI, 18–37%) for in-
hospital mortality.
Yoo et al.,(74) included 100 patients with sepsis or septic shock and compared a MEWS with
MEWS and blood lactate (MEWS BLA) in predicting ICU transfer. Both had good

Clinical & Cost-effectiveness of the National Early Warning System (NEWS): Systematic Review Update
Health Research Board – Collaboration in Ireland for Clinical Effectiveness Reviews
156
discriminatory power (MEWS AUC 0.82, MEWS BLA 0.90). The MEWS with a cut-off of 5.5
had higher sensitivity (81.6%) than the MEWS-BLA (73.7%) at a cut-off of 3.05 and lower
specificity (66.1% versus 87%).
Four of the 12 cohort studies investigated the predictive ability of a number of existing
EWSs.(13, 56, 65, 103)
A retrospective cohort study by Cooksley et al.,(103) including 840 oncology patients
compared NEWS and a MEWS to predict 30-day mortality and critical care unit admission.
Both the NEWS and the MEWS were poor predictors of 30-day mortality in oncology
patients (AUC 0.59 and AUC 0.55 respectively). The findings were similar for critical care unit
admission with an AUC of 0.62 for the NEWS and an AUC of 0.60 for the MEWS.
A retrospective cohort study by Eccles et al.,(13) compared the predictive ability of CREWS to
NEWS in a subgroup of patients with chronic hypoxaemia. The CREWS (AUC 0.91, 95% CI
0.85-0.98) was similiar to the NEWS (AUC 0.88, 95% CI 0.79-0.96) in this subpopulation of
patients with respiratory conditions.
A prospective cohort by Ghanem-Zoubi et al.,(65) in patients with a specific validated
diagnosis of sepsis compared the ability of four different EWSs (MEWS, SCS, MEDS and
REMS) to predict mortality. The 14-item SCS (AUC 0.77, 95% CI 0.74-0.80) and the 7-item
REMS (AUC 0.77, 95% CI 0.73-0.80), both of which included age as a parameter were
superior to the 5-item MEWS (AUC 0.69, 9% CI 0.65-0.73) in predicting mortality. Similar
findings were generated for 5-day in-hospital mortality and 28-day in-hospital mortality.
Qin et al.,(56) compared the APACHE II, MEWS, Shock Index, SOFA and New MEWS in a
sample of 292 patients admitted with shock (hypovolemic, septic, cardiogenic and mixed) in
a single Chinese university hospital. In this sub-population, the MEWS had poor predictive
ability (AUC 0.61) and the APACHE II had the highest AUC (0.78) in predicting 28-day death.

Clinical & Cost-effectiveness of the National Early Warning System (NEWS): Systematic Review Update
Health Research Board – Collaboration in Ireland for Clinical Effectiveness Reviews
157
Four of the 12 cohort studies investigated the predictive ability of newly-developed (often
algorithm-based) EWSs, which were compared to other existing EWSs in most studies.(55, 58,
61, 64)
A retrospective cohort study by Liljehult et al.,(58) including 274 stroke patients compared
the ability of the 7-item ViEWS (on admission and max ViEWS) to the Scandinavian Stroke
Scale to predict mortality. Max ViEWS (AUC 0.94, 95% CI 0.91-0.98) was similiar to
admission ViEWS (AUC 0.85, 95% CI 0.76-0.95) and the Scandinavian Stroke Scale (AUC 0.90,
95% CI 0.84-0.96).
In a prospective cohort of 100 patients undergoing elective colorectal surgery, Martin et
al.,(61) estimated the ability of the DULK score to predict anastomotic leakage (AL) following
surgery. The DULK score had good predictive ability with an AUC of 0.86 (95% CI 0.76-0.96),
sensitivity of 91.7% and a specificity of 55.7% at a score of >3. The PPV was 22% at a DULK
score of >3.
Xiao et al.,(55) in a retrospective cohort compared the ability of a MEWS and the AFSS to
clinical deterioration defined as death and severe fever in a sample of 357 patients
presenting to fever clinics in Beijing. The AFSS had an AUC of 0.95 for mortality and 0.96 for
severe fever, superior to the MEWS which had an AUC of 0.76 for mortality.
Zimlichman et al.,(64) conducted a retrospective cohort analysis including 113 patients with
respiratory conditions including pneumonia, COPD, asthma exacerbation, pulmonary edema
or patients who needed supplemental oxygen on admission who had their vital signs
measured using the Earlysense continuous monitor with alerts switched off to identify
optimal cut-offs for threshold and 24-hour trend alerts using RR and HR parameters. Both
RR and HR combined provided the optimal AUC for threshold alerts (AUC 0.75) compared to
the AUC for the parameters individually in detecting clinical deterioration (defined as ICU
transfer, ventilation or cardiac arrest). This was also true for the optimal 24-hour trend alert
where RR and HR combined provided the best predictive ability (AUC 0.93).

Clinical & Cost-effectiveness of the National Early Warning System (NEWS): Systematic Review Update
Health Research Board – Collaboration in Ireland for Clinical Effectiveness Reviews
158
There was a single case-control study.
Yu et al.,(151) compared the ability of seven different EWSs (REMS, SOFA, PIRO, ViEWS, SCS,
MEDS and MEWS) to predict clinical deterioration defined as critical care consult, ICU
admission or death in a 328 cases (ICD-9 diagnosis of infections) and 328 matched controls
over two time periods (0-12 hours, and 12-72 hours) in patients admitted with a diagnosis of
infection. At 0-12 hours the SOFA EWS had the best predictive ability (AUC 0.78, 95% CI
0.74-0.81) and the REMS EWS was the poorest predictor of clinical deterioration (AUC 0.67,
95% CI 0.62-0.71). At 12-72 hours all except MEDS had poor discrimination for mortality
(AUCs<0.70), (Table 7.1).
7.5.2 PROMS
No study examined the ability of EWSs to predict PROMS.
7.5.3 Post-hoc identified outcomes
7.5.3.1 Composite outcome of SAEs
In total, 23 of the 68 studies included a composite outcome of serious adverse events
(SAEs)(8, 49, 77, 78, 83, 85, 86, 89, 94, 101, 102, 105, 110, 112, 113, 121, 126, 141, 146, 149, 154-156) with one before-after
study, 21 cohort studies and one case control study.
There was a single before-after intervention study.
DeMeester et al.,(49) defined a SAE as death without a DNAR or ICU re-admission in a before-
after intervention study investigating the predictive ability of a MEWS at different shifts
before the SAE occurred. A MEWS score of two in in the shift which the SAE occurred had
similiar predictive ability (AUC 0.79, 95% CI 0.63, 0.96) compared to one shift before the SAE
(AUC 0.75, 95% CI 0.57-0.93) and two shifts before the SAE (AUC 0.77, 95% CI 0.59, 0.95)
(Table 7.1).

Clinical & Cost-effectiveness of the National Early Warning System (NEWS): Systematic Review Update
Health Research Board – Collaboration in Ireland for Clinical Effectiveness Reviews
159
There were 21 cohort studies with eight examining a single EWS, seven comparing a number
of different EWSs and seven investigated the predictive ability of newly-developed (often
algorithm-based) EWSs, which were compared to other existing EWSs in most studies.
Eight of the cohort studies investigated the predictive ability of a single EWS, with four
considering NEWS,(77, 101, 110, 113) two considering ViEWS(89, 94) and two considering a
MEWS.(78, 83)
A prospective cohort study by Abbott et al.(101) defined this as critical care admission or
death with 48 hours of admission. The authors strived to identify the optimal NEWS
threshold and found that patients admitted to the AAU with a NEWS score of ≥3 were more
likely to meet the primary endpoint and for every one point increase in NEWS, there was a
55% increased risk of the composite outcome (Table 7.1).
Uppanisakorn et al.,(77) investigated the predictive ability of the NEWS at discharge (NEWSdc)
from the ICU to the destination ward for the composite outcome of clinical deterioration
with 24 hours (defined as acute respiratory failure or circulatory shock). The AUC for NEWSdc
was 0.93 (95% CI 0.90-0.95) and a NEWSdc score of 7 gave the best sensitivity (92.3%) and
specificity (85.1%).
Abbott et al.,(110) compared the NEWS and the NEWS combined with lactate, glucose and
base excess biomarkers to predict a composite outcome of critical care unit admission or
death. The NEWS alone had the best predictive ability (AUC 0.74) compared to lactate (AUC
0.57), glucose (AUC 0.38) and base excess (AUC 0.52).
Smith et al.,(113) compared the NEWS to 44 different MET calling criteria sets to predict the
composite outcome of cardiac arrest, unplanned ICU admission or mortality. The NEWS had
an AUC of 0.88 (95% CI 0.88, 0.88), sensitivity of 44.5% and specificity of 97.4% at a cut-off
of 7. Sensitivity of the 44 sets of MET criteria ranged from 19.6% to 71.2% and specificity
ranged from 71.5% to 98.5% (Table 7.1).

Clinical & Cost-effectiveness of the National Early Warning System (NEWS): Systematic Review Update
Health Research Board – Collaboration in Ireland for Clinical Effectiveness Reviews
160
Kovacs et al.,(94) compared the ability of ViEWS to predict a combined outcome (defined as
death within 24 hours, cardiac arrest or unplanned ICU transfer) in a cohort of over 87,000
medical and surgical patients. The predictive ability of ViEWS was similar across all groups
(all observations non-elective medical, all observations non-elective surgical, random
observations non-elective medical, random observations non-elective surgical) with all
yielding AUC’s >0.80 (Table 7.1).
Hollis et al.,(89) included 522 surgical patients admitted over a one year period in a single US
hospital and a composite outcome of SAEs (defined as surgical site infection, organ surgical
site infection, myocardial infarction, pneumonia, wound disruption, sepsis, unplanned
return to the operation room, bleeding/transfusion, acute renal failure, cerebral vascular
accident, unplanned intubation, sepsis shock, MET activation, unplanned ICU transfer,
cardiac arrest or death). The EWS (based on ViEWS measurements taken on the ward only)
had an AUC of 0.90, and a sensitivity of 81% and specificity of 84% and PPV of 27%.
A MEWS ability to predict a composite outcome (defined as death, reanimation, unexpected
ICU admission, emergency operations and severe complications) was examined by Smith et
al.,(83) in 572 general and trauma surgery ward patients. The AUC was 0.87 (95% CI 0.81-
0.93) with a sensitivity of 74% and specificity of 82% at a score of three. Sensitivity dropped
to 54% for an increased specificity of 94% at a MEWS score of four or more.
Van Galen et al.,(78) determined the sensitivity and specificity of a MEWS in a cohort of 1,053
patients from six different wards to predict their composite outcome of death, cardiac
arrest, ICU admission or re-admission. A MEWS of >3 had 61% sensitivity and 83%
specificity, with a PPV of 12.5% and NPV of 98.1%.
Seven of the cohort studies investigated the predictive ability of a number of existing
EWSs.(8, 105, 112, 146, 149, 155, 156)
In over 269,000 patients from five hospitals, Churpek et al.,(146) compared the electronic
CART (eCART) to a MEWS by splitting the data into 60% development and 40% validation.

Clinical & Cost-effectiveness of the National Early Warning System (NEWS): Systematic Review Update
Health Research Board – Collaboration in Ireland for Clinical Effectiveness Reviews
161
The eCART (AUC 0.77, 95% CI 0.76-0.77) was superior to the MEWS (AUC 0.70, 95% CI 0.70-
0.70) in predicting the composite outcome (of mortality, cardiac arrest and ICU transfer).
In a retrospective cohort study by Jarvis et al.,(105) the authors investigated the effectiveness
of EWSs that have only two possible scores, 0 (normal, i.e., low risk) or 1 (abnormal, i.e.,
increased risk), for each vital sign. The simplified EWSs, referred to as ‘binary EWS’, were
based on previously existing standard EWSs (36 published ‘standard’ EWSs—the 34
previously compared by Smith et al.,(8) plus CART and the centiles EWSs).(158) In this study
the NEWS followed by binary NEWS were the best predictors of mortality, cardiac arrest and
ICU admission (composite outcome) compared to over 30 other published EWSs. In terms of
sensitivity and specificity, a NEWS aggregate score ≥5 for any adverse outcome had a
sensitivity of 69.7% and a specificity of 94.2%, similar to the binary NEWS (score ≥3), which
had a sensitivity of 67.7% and a specificity of 92.9% (Table 7.1).
In a retrospective cohort study by Romero-Brufau et al.,(149) including more than 34,000
hospitalised patients, the authors compared the ability of the ViEWS, a MEWS, the GMEWS,
the SEWS, the Worthing EWS and NEWS to predict the composite outcome (defined as
resuscitation call, RRS activation or unplanned transfer to the ICU), in a time-dependent
manner (3, 8, 12, 24 and 36 h after the observation). PPVs ranged from less than 1%
(Worthing, 3 h) to 21% (GMEWS, 36 h). Sensitivity ranged from 7% (GMEWS, 3 h) to 75%
(ViEWS, 36 h). Used in an automated fashion, these would correspond to 1,040–215,020
false positive alerts per year.
In a population of more than 35,000 patients with real-time vital sign data, Smith et al.,(8)
compared the ability of NEWS to detect a composite outcome of death, cardiac arrest or
unanticipated ICU admission to 33 other EWSs currently in use. The NEWS had an AUC of
0.87 (95% CI 0.86-0.87) and was superior to all other 33 EWSs whose AUCs ranged from 0.73
to 0.83 (Table 7.1).

Clinical & Cost-effectiveness of the National Early Warning System (NEWS): Systematic Review Update
Health Research Board – Collaboration in Ireland for Clinical Effectiveness Reviews
162
Kipnis et al.,(156) included a composite outcome defined as transfer to the ICU or death
outside of the ICU and compared the NEWS, eCART and an algorithm-based EWS, the
Advanced Alert Model (AAM) using data from 21 hospital databases in the US. Overall the
three EWSs had similar predictive ability (NEWS AUC 0.76, AAM AUC 0.82, eCART AUC 0.79).
Churpek et al.,(155) included a composite outcome defined as death or ICU stay and
compared the NEWS, MEWS, qSOFA and SIRS in 12,154 patients from a single US hospital
with suspicion of infection. The NEWS (AUC 0.73) was superior in terms of predicting this
composite outcome to the qSOFA (AUC 0.64) and SIRS (AUC 0.61).
Pimentel et al.,(112) compared the predictive ability of the NEWS and NEWS2 in a cohort of
251,266 adult acute admissions from five UK hospitals to detect the composite outcome
(defined as in-hospital death within 24 hours, unanticipated ICU admission or cardiac
arrest). As described earlier, the cohort was split into three groups: those with documented
T2RF, those at risk of T2RF and those with no risk of T2RF (control). Again, the findings were
similar to those reported for the outcomes individually where both the NEWS and modified
NEWS2 had comparable predictive ability. In the T2RF group the NEWS had an AUC of 0.83
whilst the NEWS2 had an AUC of 0.830.
Seven of the cohort studies investigated the predictive ability of newly-developed (often
algorithm-based) EWSs, which were compared to other existing EWSs in most studies.(83, 85,
86, 102, 121, 126, 141, 154)
A retrospective cohort study by Alvarez et al.,(141) compared an automated near real time
electronic medical record EWS to a MEWS in general medical patients. The primary outcome
was defined as resuscitation events or death (RED) and included out of ICU hospital codes
(cardiopulmonary arrests (CPAs) or acute respiratory compromise events) and unplanned
transfers to the ICU. The newly developed automated EWS was superior to the MEWS in
predicting RED events (Automated EWS AUC: 0.85, 95% CI 0.82-0.87; MEWS AUC: 0.75, 95%
CI 0.71-0.78) (Table 7.1).

Clinical & Cost-effectiveness of the National Early Warning System (NEWS): Systematic Review Update
Health Research Board – Collaboration in Ireland for Clinical Effectiveness Reviews
163
A retrospective cohort study by Badriyah et al.,(102) using decision tree analysis and a data
mining technique to create the DTEWS in over 35,000 acute medical admissions compared
the predictive ability of this electronic system to NEWS. The DTEWS had a similar AUC for
the composite outcome (cardiac arrest, death or unanticipated ICU admission within 24
hours) to the NEWS (AUC 0.88, 95% CI 0.87-0.88 vs. AUC 0.87, 95% CI 0.87-0.88).
Churpek et al.,(121) developed an EWS based on location and time-stamped vital signs
obtained from the hospital electronic medical record. Four models were generated (one for
each outcome, Model 1: ICU transfer, Model 2: Cardiac arrest, Model 3: Mortality, and
Model 4: Composite outcome) in one half of the training dataset and validated in the other
half. The ability of the different models to predict the composite outcome ranged from 0.68
to 0.71, with Models 1 and 4 having the best AUC.
Douw et al.,(85) investigated the predictive ability of the nine worry variables within the
Dutch Early Nurse Worry Indicator Score (DENWIS) combined with the existing EWS to
predict the composite outcome (defined as unplanned ICU/HDU admission or unexpected
in-hospital mortality) in 3,522 surgical patients. The EWS alone had an AUC of 0.86 (95% CI
0.82, 0.90). When only including the nine worry indicators in the model, an AUC of 0.81
(95% CI 0.77, 0.85) was reported. When combining the EWS and nine worry indicators (the
DENWIS) an AUC of 0.91 (95% CI 0.88, 0.93) was reported.
A further study was conducted by Douw et al.,(86) in the same population of surgical patients
where a prediction model was constructed weighing all of the DENWIS indicators by
multiplying the regression coefficients by five to accomplish full advantage of the
discriminative value between the indicators. For the composite outcome of unplanned
ICU/HDU admission or unexpected in-hospital mortality the DENWIS had an AUC of 0.85
(95% CI 0.80, 0.89).
Churpek et al.,(154) compared nine different machine learning techniques to a MEWS in a
large cohort of 269,999 hospitalised medical-surgical ward patients in five US hospitals to

Clinical & Cost-effectiveness of the National Early Warning System (NEWS): Systematic Review Update
Health Research Board – Collaboration in Ireland for Clinical Effectiveness Reviews
164
predict the composite outcome (defined as ward death, ward to ICU transfer or ward
cardiac arrest). Similar to the findings for mortality, cardiac arrest and ICU transfer
individually, the random forest model had the best predictive ability (AUC 0.801) and the
MEWS the worst (AUC 0.70).
In a single retrospective case control study by Kirkland et al.,(126) the predictive ability of a
time-dependent electronic model to identify future events (defined as unplanned ICU
transfer, unexpected death or RRT calls) in a cohort of 1,882 patients was examined. Lead
times were divided into 2 to 12 hours, 12 to 24 hours, or 24 to 48 hours prior to an event.
The single-entry model looked at each set of clinical variables individually. Serial 24 hours
looked at trends of each clinical variable over 24 hours. Serial 7 days looked at trends of
each clinical variable over 7 days. For future events (2-12 hours), serial 24-hour trends had
the superior predictive ability (AUC 0.71). For future events (12-24 hours and 24-48 hours),
serial 7 day trends had the best predictive ability (AUC 0.73, and AUC 0.66 respectively).
7.5.3.2 Acute heart failure
One study examined the ability of EWSs to predict acute heart failure.(54) A retrospective
cohort study by Bian et al.,(54) compared the newly developed Super Score to a MEWS to
predict acute heart failure. The Super Score was superior to the MEWS (AUC 0.81 vs. AUC
0.66), p<0.05. When age was added to the Super Score the AUC was 0.82. The Super Score
was able to predict acute heart failure 3.9 ±1.9 hours (1-17 hours) earlier (Table 7.1).
7.5.3.3 Hospital-acquired Acute Kidney Injury (AKI)
One study examined the ability of EWSs to predict AKI.(90)In a retrospective cohort of over
33,000 emergency medical admissions, Faisal et al.,(90) developed four models (NEWS only;
NEWS plus age and sex; NEWS plus sub-components of NEWS; and NEWS plus two-way
interactions) comparing index NEWS values and maximum NEWS values ability to predict
hospital-acquired AKI >48 hours after admission. Maximum NEWS values were better able
to predict AKI than index NEWS values across all four models (AUC’s >0.69). In addition, the

Clinical & Cost-effectiveness of the National Early Warning System (NEWS): Systematic Review Update
Health Research Board – Collaboration in Ireland for Clinical Effectiveness Reviews
165
maximum NEWS had higher sensitivity and specificity and PPV across the different
probability thresholds for hospital-acquired AKI than the index NEWS (Table 7.1).
7.5.3.4 Total number of responses and interventions (including infusion prescription,
change in medication and ICU consultation)
One study examined the ability of EWSs to predict the total number of responses to EWS
activations and interventions applied.(84) Van Rooijen et al.,(84) measured the sensitivity and
specificity of an 8-item EWS from a database including 71,911 EWS values. Whenever the
threshold was exceeded (EWS ≥3) it was registered within the database. At a threshold of 4,
the sensitivity of the EWS was 74% and specificity was 51%. At a threshold of 5, the
sensitivity was 52% and specificity 73%. The authors concluded that a threshold of three for
triggering remains the optimal threshold for activation (Table 7.1).
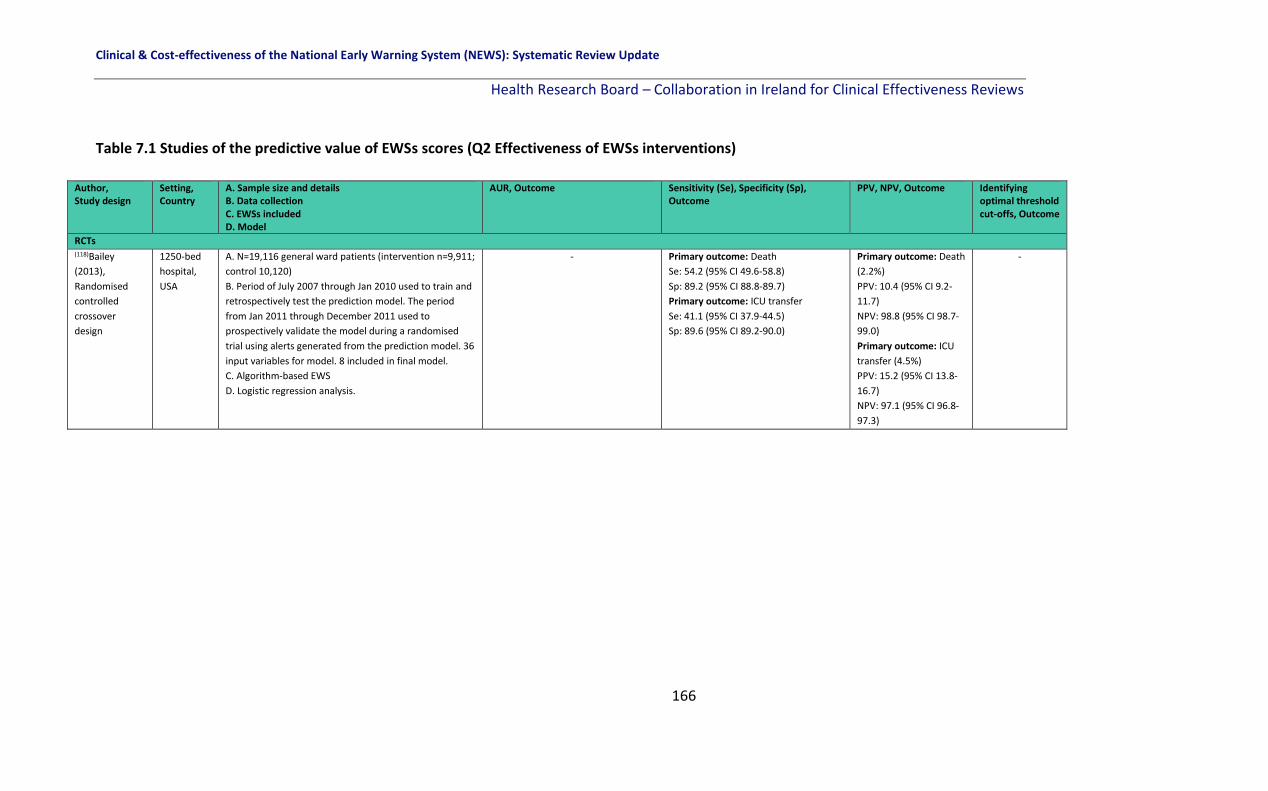
Clinical & Cost-effectiveness of the National Early Warning System (NEWS): Systematic Review Update
Health Research Board – Collaboration in Ireland for Clinical Effectiveness Reviews
166
Table 7.1 Studies of the predictive value of EWSs scores (Q2 Effectiveness of EWSs interventions)
Author, Study design
Setting, Country
A. Sample size and details B. Data collection C. EWSs included D. Model
AUR, Outcome Sensitivity (Se), Specificity (Sp), Outcome
PPV, NPV, Outcome Identifying optimal threshold cut-offs, Outcome
RCTs (118)Bailey
(2013),
Randomised
controlled
crossover
design
1250-bed
hospital,
USA
A. N=19,116 general ward patients (intervention n=9,911;
control 10,120)
B. Period of July 2007 through Jan 2010 used to train and
retrospectively test the prediction model. The period
from Jan 2011 through December 2011 used to
prospectively validate the model during a randomised
trial using alerts generated from the prediction model. 36
input variables for model. 8 included in final model.
C. Algorithm-based EWS
D. Logistic regression analysis.
-
Primary outcome: Death
Se: 54.2 (95% CI 49.6-58.8)
Sp: 89.2 (95% CI 88.8-89.7)
Primary outcome: ICU transfer
Se: 41.1 (95% CI 37.9-44.5)
Sp: 89.6 (95% CI 89.2-90.0)
Primary outcome: Death
(2.2%)
PPV: 10.4 (95% CI 9.2-
11.7)
NPV: 98.8 (95% CI 98.7-
99.0)
Primary outcome: ICU
transfer (4.5%)
PPV: 15.2 (95% CI 13.8-
16.7)
NPV: 97.1 (95% CI 96.8-
97.3)
-

Clinical & Cost-effectiveness of the National Early Warning System (NEWS): Systematic Review Update
Health Research Board – Collaboration in Ireland for Clinical Effectiveness Reviews
167
Table 7.1 Studies of the predictive value of EWSs scores (Q2 Effectiveness of EWSs interventions) continued.
Author, Study design
Setting, Country
A. Sample size and details B. Data collection C. EWSs included D. Model
AUC, Outcome Sensitivity (Se), Specificity (Sp), Outcome
PPV, NPV, Outcome Identifying optimal threshold cut-offs, Outcome
Before-after intervention studies (49)DeMeester (2013a), Before-after intervention study.
14 medical and surgical wards, Antwerp University Hospital, Belgium
A. N=1,039 patients discharged to the wards from the ICU. B. Retrospective review of patient records. C. MEWS and SAPS D. ROC analysis
Primary outcome: ICU transfer or admission MEWS score of 3 at ICU discharge: AUC=0.60 SAPS of 3 at ICU admission: AUC=0.70 Secondary outcome: post hoc: SAEs (died without DNR, ICU admission) Shift of the SAE, MEWS 2; AUC=0.79 (95%CI 0.63,0.96) One shift before the SAE, MEWS 3; AUC=0.75 (95%CI 0.57,0.93) 2 shifts before the SAE, MEWS 3; AUC=0.77 (95%CI 0.59,0.95)
Primary outcome: ICU transfer or admission MEWS score of 3 at ICU discharge: Se=40.0% Sp=76.0% SAPS of 3 at ICU admission: Se=61.0% Sp=74.0% Secondary outcome: post hoc: SAEs (died without DNR, ICU admission) Shift of the SAE, MEWS 2; Se=69.2% Sp=84.6% One shift before the SAE, MEWS 3; Se=61.5% Sp=92.3% 2 shifts before the SAE, MEWS 3; Se=61.5% Sp=88.5%
- -

Clinical & Cost-effectiveness of the National Early Warning System (NEWS): Systematic Review Update
Health Research Board – Collaboration in Ireland for Clinical Effectiveness Reviews
168
Table 7.1 Studies of the predictive value of EWSs scores (Q2 Effectiveness of EWSs interventions) continued.
Author, Study design
Setting, Country
A. Sample size and details B. Data collection C. EWSs included D. Model
AUC, Outcome Sensitivity (Se), Specificity (Sp), Outcome
PPV, NPV, Outcome Identifying optimal threshold cut-offs, Outcome
Before-After studies (139)Umscheid
(2015),
Retrospective
development,
Prospective
validation and
before-after
intervention
study.
University of
Pennsylvania
Health
System (3
hospitals),
USA.
A. Adult non-ICU patients admitted to acute inpatient units from Oct 1 to Oct 31, 2011 for tool derivation, Jun 6 to Jul 5, 2012 for tool validation, and Jun 6 to Sept 4, 2012 - Jun 6, 2013 to Sept 4, 2013 for pre-implementation/post-implementation analysis=31,093 included. B. The EWRS was initially activated for a pre implementation “silent” period (Jun 6, 2012–September 4, 2012) to both validate the tool and provide the baseline data to which the post implementation period was compared. During this time, new admissions could trigger the alert, but notifications were not sent. Admissions from the 1st 30 days of the pre implementation period were used to estimate the tool’s screen positive rate, test characteristics, predictive values, and likelihood ratios. The post implementation (Live) Period and Impact Analysis The EWRS went “live” Sept 12, 2012, upon which new admissions triggering the alert would result in a notification and response. C. EWRS D. Cox regression.
Primary outcome: Mortality: A “positive” trigger as a score >=4, Derivation cohort: Se: 6%, Sp: 16% Validation cohort: Se: 6%, Sp: 17%
Primary outcome: Mortality: A “positive” trigger as a score >=4, Derivation cohort: PPV 97%, NPV 26% Validation cohort: PPV 97%, NPV 28%
-

Clinical & Cost-effectiveness of the National Early Warning System (NEWS): Systematic Review Update
Health Research Board – Collaboration in Ireland for Clinical Effectiveness Reviews
169
Table 7.1 Studies of the predictive value of EWS scores (Q2 Effectiveness of EWS interventions) continued
Author, Study design
Setting, Country
A. Sample size and details B. Data collection C. EWS included D. Model
AUC, Outcome Sensitivity (Se), Specificity (Sp), Outcome
PPV, NPV, Outcome Identifying optimal threshold cut-offs, Outcome
Cohort studies (141)Alvarez
(2013),
Retrospective
cohort
Urban
academic
hospital,
USA
A. N=7466 patients admitted to the internal medicine
wards or ICU between May 2009 and Mar 2010.
B. Clinical prediction model created in the derivation
same (50% randomly selected from total cohort) and
validated in the remaining 50% of the cohort.
C. Algorithm based-EWS
D. Multivariate logistic regression.
Outcome: Resuscitation events or death [RED] (defined
as out of ICU hospital codes and unplanned transfers to
the ICU. Hospital codes included CPA and acute
respiratory compromise (ARC) events)
Automated EWS: Derivation AUC 0.87, 95% CI 0.85-
0.89; Validation AUC 0.85, 95% CI 0.82-0.87.
MEWS: AUC 0.75, 95% CI 0.71-0.78.
Outcome: RED
Se automated EWS: 51.6%
Se MEWS: 42.2%
Sp automated EWS: 94.3%
Sp MEWS: 91.3%
Outcome: RED (1.2%
in cohort)
PPV automated EWS
10%
PPV MEWS 5.6%.
NPV automated EWS
99.4%
NPV MEWS 99.2%
-
(102)Badriyah
(2014),
Retrospective
cohort
Hospital, UK A. N=35,585 consecutive acute medical admissions
(198,755 vital signs) between May 2006 and Jun 2008.
B. Decision tree (DTEWS) developed using data mining
classification technique for building trees by recurring
splitting or partitioning of datasets into homogenous
groups. DTEWS developed using 0,1,2,3 weighting
system. Data obtained via personal digital assistants
running the VitalPAC software.
C. DTEWS, EWS
D. Decision tree analysis.
Outcome: death
DTEWS: AUC 0.90, 95% CI 0.90-0.91
NEWS: AUC 0.89, 95% CI 0.89-0.90
Outcome: cardiac arrest
DTEWS: AUC 0.71, 95% CI 0.67-0.75
NEWS: AUC 0.72, 95% CI 0.69-0.76
Outcome: unanticipated ICU admission
DTEWS: AUC 0.86, 95% CI 0.85-0.87
NEWS: AUC 0.86, 95% CI 0.85-0.87
Outcome: composite outcome within 24hr
DTEWS: AUC 0.88, 95% CI 0.87-0.88
NEWS: AUC 0.87, 95% CI 0.87-0.88
-
-
Outcome:
Death within 24
hrs. The
detection of
83% of those
who die within
24 hrs of a
given EWS
value requires a
response to
only 25% of
either DTEWS
or NEWS
values. Trigger
point of 5 for
DTEWS and 4
for NEWS.

Clinical & Cost-effectiveness of the National Early Warning System (NEWS): Systematic Review Update
Health Research Board – Collaboration in Ireland for Clinical Effectiveness Reviews
170
Table 7.1 Studies of the predictive value of EWSs scores (Q2 Effectiveness of EWSs interventions) continued Author,
Study design
Setting,
Country
A. Sample size and details
B. Data collection
C. EWSs included
D. Model
AUC, outcome Sensitivity (Se),
Specificity (Sp),
outcome
PPV, NPV,
outcome
Identifying
optimal threshold
cut-offs, outcome
Cohort studies (54)Bian (2015),
Retrospective
cohort study
Shandong
University
Hospital,
China
A. N=433 patients triaged to the acute heart failure unit or the chest
pain centre between Nov 2011 - Jun 2014.
B. All admission and follow-up data retrieved from hospital charts.
Model developed using 12 variables and only 5 significant variables
were included in the new scoring system ‘Super Score’.
C. Algorithm-based EWS and MEWS
D. Logistic regression analysis.
Secondary outcome post hoc: Acute heart failure
(AHF)
Super Score AUC: 0.81
Super Score + Age: 0.82
MEWS AUC: 0.66, p<0.05
Super Score predicted AHF 3.9 ± 1.9 hrs (1-17 hrs)
earlier.
-
-
-
(142)Bleyer
(2011),
Retrospective
cohort study
872-bed
hospital,
USA
A. N=27,722 patients (1.15 million individual VS measurements)
admitted to a tertiary hospital Jan 2008 - Jun 2009.
B. All VS measurements obtained from hospital database.
Categories representing different intervals were determined for
each vital sign, and the prevalence of admissions with vital signs in
each range, together with proportionate mortality, were
determined. A critical VS was arbitrarily defined as the level at which
a patient who sustained the given VS during an admission had a 5%
or greater chance of mortality.
C. Algorithm-based EWS, ViEWS, MEWS
D. Logistic regression analysis.
Critical vital signs i.e. levels and ranges associated
with a ≥5% chance of mortality were identified as
SBP (<85mmHg), HR (>120 bpm), temp (<35 or
>38.90C), SpO2 (<91%), RR (≤12 or ≥24), and level
of consciousness (any other than ‘Alert’).
Primary outcome: mortality
New critical VS EWS:
AUC (1 point for ages 60-70): 0.84
AUC (1 point for ages >70): 0.87
AUC (1 point for ages >80): 0.86
ViEWS AUC: 0.86
MEWS AUC: 0.87
-
-
-
(41)Boulos
(2017),
Retrospective
cohort study
Monash
Health, a
2170-bed
network of
5 hospitals,
Australia
A. N=646 patients with MET call where sepsis was the trigger from
medical, surgical and mental health units in 2015 (n=4,496 MET
calls).
B. Medical records reviewed and scores calculated using
physiological data measured at time of MET call.
C. qSOFA, SIRS
D. Kaplan Meier survival curves.
Primary outcome: 28-day in-hospital mortality:
SIRS AUC: 0.54
qSOFA AUC: 0.64
Primary outcome: 28-
day in-hospital
mortality:
Se SIRS: 86.4%
Se qSOFA: 62.1
Primary outcome:
28-day in-hospital
mortality: (22%)
PPV SIRS: 23.7%
PPV qSOFA: 31.3%
NPV SIRS: 86.0%
NPV qSOFA:85.1%
-

Clinical & Cost-effectiveness of the National Early Warning System (NEWS): Systematic Review Update
Health Research Board – Collaboration in Ireland for Clinical Effectiveness Reviews
171
Table 7.1 Studies of the predictive value of EWSs scores (Q2 Effectiveness of EWSs interventions) continued
Author,
Study design
Setting,
Country
A. Sample size and details
B. Data collection
C. EWSs included
D. Model
AUC, outcome Sensitivity (Se),
Specificity (Sp),
outcome
PPV, NPV,
outcome
Identifying optimal
threshold cut-offs,
outcome
Cohort studies (104)Dawes
(2014),
Prospective
observational
study
Western
Sussex
Hospitals
Trust, UK.
A. N=3,184 AMU patients (Feb 2010-July 2010) B. Automatically calculated once entered into handheld device. Compared 2010 with 2005 data (revalidation). C. Worthing PSS score, NEWS D. Logistic regression analysis.
Primary outcome: Mortality Worthing PSS score final in AMU (2010 data) AUC: 0.88 (95% CI 0.83-0.94). NEWS AUC: 0.76 (95% CI 0.72-0.80).
- - -
(120)Capan
(2015),
Retrospective
cohort study
Mayo
Clinic, USA
A. N=38,356 medical and surgical patients admitted to a single hospital Jan – Dec 2011. B. Electronic medical health records were used to identify optimal patient-centred RRT activation rules. 12 statistically significant sub-populations were identified. C NEWS. D. Semi-Markov decision process (SMDP) models.
- - - Secondary outcome: clinical deterioration in sub-populations: 2 categories of patients with distinct RRT thresholds (1) highly frail surgical patient with no previous deterioration events optimal RRT activation at a NEWS of 1-4; (2) moderately frail medical patient optimal RRT activation at a NEWS of ≥7.

Clinical & Cost-effectiveness of the National Early Warning System (NEWS): Systematic Review Update
Health Research Board – Collaboration in Ireland for Clinical Effectiveness Reviews
172
Table 7.1 Studies of the predictive value of EWSs scores (Q2 Effectiveness of EWSs interventions) continued
Author,
Study design
Setting,
Country
A. Sample size and details
B. Data collection
C. EWSs included
D. Model
AUC, outcome Sensitivity (Se), Specificity
(Sp), outcome
PPV, NPV,
outcome
Identifying
optimal
threshold
cut-offs,
outcome
Cohort studies (144)Churpek (2013), Retrospective cohort study
Urban academic hospital, USA
A. N=59,643 medical and surgical patients admitted between Nov 2008 – Aug 2011. B. Ward vital signs extracted from electronic database and the EWS were retrospectively calculated from every simultaneous ward VS set in the entire dataset. C.MERIT, Modified MERIT, EWS, MEWS, SEWS, ViEWS, CART D. Accuracy calculated using the AUC, Se and Sp using the patient’s highest score prior to the event.
Primary outcome, mortality: MERIT: 0.74 (95% CI 0.71-0.76) Modified MERIT: 0.79 (95% CI 0.76-0.81) Bleyer et al. EWS: 0.84 (95% CI 0.82-0.87) Tarassenko centile-based EWS: 0.83 (95% CI 0.80-0.86) MEWS: 0.87 (95% CI 0.84-0.89) SEWS: 0.88 (95% CI 0.86-0.90) ViEWS: 0.88 (95% CI 0.86-0.91) CART: 0.88 (95% CI 0.86-0.90) Primary outcome, cardiac arrest: MERIT: 0.63 (95% CI 0.59-0.68); Modified MERIT: 0.69 (95% CI 0.65-0.74) Bleyer et al. EWS: 0.73 (95% CI 0.68-0.78) Tarassenko centile-based EWS: 0.70 (95% CI 0.65-0.76) MEWS: 0.76 (95% CI 0.71-0.81) SEWS: 0.76 (95% CI 0.71-0.81) ViEWS: 0.77 (95% CI 0.72-0.82) CART: 0.83 (95% CI 0.79-0.86) Primary outcome, ICU transfer: MERIT: 0.64 (95% CI 0.63-0.65) Modified MERIT: 0.69 (95% CI 0.68-0.70) Bleyer et al. EWS: 0.72 (95% CI 0.71-0.73) Tarassenko centile-based EWS: 0.71 (95% CI 0.69-0.72) MEWS: 0.74 (95% CI 0.73-0.75) SEWS: 0.75 (95% CI 0.74-0.76) ViEWS: 0.73 (95% CI 0.72-0.75) CART: 0.77 (95% CI 0.76-0.78)
Primary outcome, cardiac arrest: SEWS >3 Se 55 Sp 85, >4 Se 38 Sp 94, >5 Se 19 Sp 97 MEWS >3 Se 67 Sp 80, >4 Se 39 Sp 91, >5 Se 20 Sp 96 ViEWS >8 Se 60 Sp 83, >9 Se 41 Sp 91, >10 Se 29 Sp 95 CART >16 Se 61 Sp 84, >20 Se 49 Sp 90 >24 Se 35 Sp 95
- -

Clinical & Cost-effectiveness of the National Early Warning System (NEWS): Systematic Review Update
Health Research Board – Collaboration in Ireland for Clinical Effectiveness Reviews
173
Table 7.1 Studies of the predictive value of EWSs scores (Q2 Effectiveness of EWSs interventions) continued Author, Study design
Setting, Country
A. Sample size and details B. Data collection C.EWSs Included D. Model
AUC, outcome Sensitivity, Specificity, outcome PPV, NPV, outcome
Identifying optimal threshold cut-offs, outcome
Cohort studies (145)Churpek (2014), Retrospective cohort study
500-bed academic hospital, USA
A. N=56,649 controls, N=109 cardiac arrest patients and N=2,543 ICU transfers hospitalised between Nov 2008-Aug 2011. B. Data extracted from the electronic health record to predict cardiac arrest and ICU transfer. Validated using three-fold cross validation C. Algorithm based-EWS, ViEWS D. Logistic regression.
Primary outcome, cardiac arrest: EVER experienced event: Cardiac arrest model AUC: 0.88 (0.84-0.91); VitalPAC (ViEWS) AUC: 0.78 (0.73-0.83); Within 24 hrs: Cardiac arrest model AUC: 0.88 (0.88-0.89), VitalPAC (ViEWS) AUC: 0.74 (0.72-0.75). Primary outcome, transfer to ICU: EVER experienced event: ICU transfer model AUC: 0.77 (0.76-0.78); VitalPAC (ViEWS) AUC: 0.73 (0.72-0.74); Within 24 hrs: ICU transfer model AUC: 0.76 (0.76-0.76), VitalPAC (ViEWS) AUC: 0.73 (0.72-0.73)
Primary outcome: cardiac arrest: Specificity of 93%, cardiac arrest model had a Se 65% compared to ViEWS (41%). The derived model had a specificity of 95% (compared to ViEWS – 85%) at the cut-off with 60% Se.
- -
(143)Churpek (2012a) Retrospective cohort study.
Academic tertiary care hospital, USA
A. N=88 cardiac arrest patients, N=2,820 ICU transfer patients and N=44,519 controls hospitalised between Nov 2008 - Jan 2011. B. Ward vital signs from admission to discharge were used. C. CART, MEWS D. Logistic regression.
Primary outcome: cardiac arrest CART score AUC: 0.84 MEWS AUC: 0.76 Primary outcome: ICU transfer CART score AUC: 0.71 MEWS AUC: 0.67
Primary outcome: cardiac arrest CART score: At a specificity of 89.9%, the CART score (cut-off >17) had a Se 53.4% compared to the MEWS (cut-off >4) Se 47.7%. Compared to the MEWS at cut-off >4 (specificity 89.9%), the CART score at cut-off >20 had a specificity of 91.9% with the same Se (47.7%).
- -
(121)Churpek (2013a) Retrospective cohort study.
Academic tertiary care hospital, USA
A. N=59,643 general and surgical patients admitted between Nov 2008 - Aug 2011. B. Location and time-stamped vital signs obtained from hospital EMR. 1st half of dataset used to derive four logistic regression models (one for each outcome) and the second half of the dataset used to validate each model to detect each of the four outcomes. C. Algorithm based EWS D. Logistic regression
Primary outcome: Mortality Model 1 AUC: 0.77 Model 2 AUC: 0.73 Model 3 AUC: 0.82 Model 4 AUC: 0.78 Primary outcome: Cardiac arrest Model 1 AUC: 0.76 Model 2 AUC: 0.74 Model 3 AUC: 0.75 Model 4 AUC: 0.76 Primary outcome: Transfer to the ICU Model 1 AUC: 0.71 Model 2 AUC: 0.68 Model 3 AUC: 0.69 Model 4 AUC: 0.71 Primary outcome: Combined outcomes Model 1 AUC: 0.71 Model 2 AUC: 0.68 Model 3 AUC: 0.70 Model 4 AUC: 0.71
- - -

Clinical & Cost-effectiveness of the National Early Warning System (NEWS): Systematic Review Update
Health Research Board – Collaboration in Ireland for Clinical Effectiveness Reviews
174
Table 7.1 Studies of the predictive value of EWSs scores (Q2 Effectiveness of EWSs interventions) continued Author, Study design
Setting, Country
A. Sample size and details B. Data collection C. EWSs included D. Model
AUC, outcome Sensitivity (Se), Specificity (Sp), outcome
PPV, NPV, outcome
Identifying optimal threshold cut-offs, outcome
Cohort studies (123)Churpek (2015), Retrospective cohort study.
Five hospitals in the USA
A. N=269,956 adult patients admitted between Nov 2008- Jan 2013. B. Patient characteristics and vital signs prior to cardiac arrest were compared between elderly (>65years) and non-elderly (<65 years) patients and extracted from prospectively collected databases and electronic health records. C. Individual VS, MEWS D. Mixed-effects regression model with patient-level random effects.
Primary outcome: Cardiac arrest Temp, highest value: Elderly: - ; Non-elderly: 0.53 (0.47-0.58) Temp, lowest value: Elderly: 0.56 (0.52-0.60) Non-elderly: 0.65 (0.60-0.70); RR, highest value: Elderly: 0.67 (0.64-0.71); Non-elderly: 0.82 (0.79-0.86) RR, lowest value: Elderly: 0.57 (0.53-0.61); Non-elderly: 0.54 (0.49-0.59); HR, highest value: Elderly: 0.63 (0.60-0.67); Non-elderly: 0.77 (0.73-0.81); SBP, highest value: Elderly: - ; Non-elderly: 0.57 (0.52-0.62); SBP, lowest value: Elderly: 0.65 (0.61-0.69); Non-elderly: 0.67 (0.62-0.73); DBP, highest value: Elderly: - ; Non-elderly: 0.59 (0.54-0.64); DBP, lowest value: Elderly: 0.60 (0.56-0.63); Non-elderly: 0.65 (0.60-0.70); Pulse pressure index, highest value: Elderly: 0.48 (0.44-0.52); Non-elderly: 0.60 (0.54-0.66); Pulse pressure index, lowest value: Elderly: 0.57 (0.54-0.61); Non-elderly: 0.68 (0.63-0.73); Shock index, highest value: Elderly: 0.67 (0.63-0.70); Non-elderly: 0.76 (0.72-0.81); Oxygen saturation, lowest value: Elderly: 0.55 (0.51-0.59); Non-elderly: 0.69 (0.64-0.74) MEWS, Highest value; Elderly: 0.71 (0.68-0.75); Non-elderly: 0.85 (0.82-0.88) ‘-‘ denotes AUC was statistically worse than 0.50 and thus not predictive.
- - -
(146)Churpek (2014a) Retrospective cohort study.
Five hospitals in the USA
A. N=269,999 adult patient admissions between Nov 2008 - Jan 2012. B. Dataset was split into development (60%) and validation (40%) to develop the new model (eCART). C. eCART, MEWS D. Logistic regression.
Primary outcome: Mortality eCART AUC: 0.93 [95% CI, 0.93–0.93] MEWS AUC: 0.88 [95% CI, 0.88–0.88] Primary outcome: cardiac arrest eCART AUC: 0.83 [95% CI, 0.82–0.83] MEWS AUC: 0.71 [95% CI, 0.70–0.73] Primary outcome: ICU transfer eCART AUC: 0.75 [95% CI, 0.74–0.75] MEWS AUC: 0.68 [95% CI, 0.68–0.68] Secondary outcome: combined outcomes eCART AUC: 0.77 [95% CI,0.76–0.77] MEWS AUC: 0.70 [95% CI, 0.70–0.70] P<0.01 for all comparisons.
At a Sp 90%, the eCART score had a Se 54% for cardiac arrest within 24 hrs compared with 39% for MEWS. Conversely, at a similar Se (65% and 67% for eCART score and MEWS), the eCART had a Sp 85% versus 71% for MEWS.
- -

Clinical & Cost-effectiveness of the National Early Warning System (NEWS): Systematic Review Update
Health Research Board – Collaboration in Ireland for Clinical Effectiveness Reviews
175
Table 7.1 Studies of the predictive value of EWSs scores (Q2 Effectiveness of EWSs interventions) continued Author, Study design
Setting, Country
A. Sample size and details B. Data collection C. EWSs included D. Model
AUC, outcome Sensitivity (Se), Specificity (Sp), outcome
PPV, NPV, outcome
Identifying optimal threshold cut-offs, outcome
Cohort studies (87)Durusu-Tanriover (2016), Prospective cohort study
University Hospital, Turkey.
A. N=108 patients admitted to a medical ward (dates not reported). B. Prospectively recruited patients from non-acute wards and nurses calculated. C. Individual VS, MEWS D. ROC analysis
Primary outcome: Mortality Highest neurological score (cut-off: >0): AUC: 0.85 (95% CI 0.77, 0.91) Highest temp score (cut-off: >1) AUC: 0.79 Highest systolic BP (cut-off: >0): AUC: 0.72 MEWS Highest total score (cut-off: >4) AUC: 0.85 (95% CI 0.77, 0.91)
Primary outcome: Mortality Highest neurological score (cut-off: >0): Se: 71.4% Sp: 100% Highest temp score (cut-off: >1) Se: 85.7% Sp: 71.2% Highest systolic BP (cut-off: >0): Se: 100% Sp: 33.6% MEWS Highest total score (cut-off: >4) Se: 85.7% Sp: 94.1%
Primary outcome: Mortality (6%) Highest neurological score (cut-off: >0): NPV: 98.1% PPV: 100% Highest temp score (cut-off: >1) NPV: 98.6% PPV: 17.1% Highest systolic BP (cut-off: >0): NPV: 100% PPV: 9.5% MEWS Highest total score (cut-off: >4) NPV: 99% PPV: 50%
-
(13)Eccles (2014), UK, Retrospective cohort study.
2 NHS district general hospitals, UK
A. N=196 admissions to the respiratory ward between Aug - Oct 2012. B. Data obtained from medical notes and observation charts with NEWS scores recorded prospectively. Patients split into 2 groups, those with target SpO2 of 88-92% (chronic hypoxaemia, CH group) and those with target SpO2 saturations of 94-98% (O group). CREWS score retrospectively applied for comparison. C. NEWS, CREWS D. ROC analysis.
Secondary outcome: Clinical deterioration in sub-populations 30-day Mortality CH patients NEWS AUC: 0.88 (95% CI 0.79–0.96). CH patients CREWS AUC: 0.91 (95% CI 0.85–0.98). All patients NEWS AUC: 0.83 (0.70–0.96) O patients NEWS AUC: 0.75 (0.52–0.98).
- - -

Clinical & Cost-effectiveness of the National Early Warning System (NEWS): Systematic Review Update
Health Research Board – Collaboration in Ireland for Clinical Effectiveness Reviews
176
Table 7.1 Studies of the predictive value of EWSs scores (Q2 Effectiveness of EWSs interventions) continued Author, Study design
Setting, Country
A. Sample size and details B. Data collection C. EWSs included D. Model
AUC, outcome Sensitivity (Se), Specificity (Sp), outcome
PPV, NPV, outcome
Identifying optimal threshold cut-offs, outcome
Cohort studies (76)Etter (2014), Retrospective cohort study
960-bed University Hospital, Switzerland
A. N=1,628 MET calls in 1,317 patients admitted to the dept of intensive care medicine between Oct 2009 and Dec 2013. B. Data on patient characteristics, parameters related to MET activation and patient outcomes were extracted from the QIP database. The VSS EWS which is the sum of the occurrence of each VS abnormality were calculated for all physiological parameters retrospectively. C. VSS D. ROC analysis.
Primary outcome: Mortality VSS AUC: 0.63 Max VSS 24 hrs before MET event AUC: 0.62
- - -
(152)Finlay (2014), Retrospective cohort study
Abington Memorial, 665-bed teaching hospital, USA
A. N=32,472 patients admitted to general medical surgical wards between Jul 2009 and Jun 2010. B. Scores were computed retrospectively using the EMR where sufficient data were available. C. MEWS, RI D. ROC analysis.
Primary outcome: Mortality RI AUC: 0.93 (95% CI 0.92-0.93) MEWS AUC: 0.82 (95% CI 0.82-0.83), p<0.0001.
Primary outcome: Mortality MEWS Score= 4: Se=49.8% Sp=93.6% RI Score =-16: Se=48.9% Sp=97.1% RI Score =30: Se=76.8% Sp=90.4%
Primary outcome: Mortality (1.9%) MEWS Score= 4: PPV=5.2% NPV=99.6% RI Score =-16: PPV=10.6% NPV=99.6% RI Score =30: PPV=5.3% NPV=99.8%
-
(92)Jarvis (2013), Retrospective cohort.
Portsmouth Hospital, UK.
A. N=86,472 discharged adult medical patients. B. Using a database of combined haematology and biochemistry results, decision tree (DT) analysis was used to generate a lab DT EWS for each gender. LDT-EWS was developed for a single set (n=3,496) and validated in 22 other discrete sets each of three months long (total n=82,976, n=3,428-4,093). C. algorithm based EWS D.Decision Tree analysis.
Primary outcome: In-hospital mortality (from 22 validation sets) AUC Males and females combined: Ranged from 0.75 (0.72-0.78) to 0.80 (0.77-0.82). AUC Males: Ranged from 0.74 (0.70-0.78) to 0.82 (0.79-0.85). AUC Females: Ranged from 0.74 (0.70-0.77) to 0.82 (0.79-0.85).
- - LDT-EWS score of 4 threshold: would mean that 40.7% of all lab test results datasets would trigger and 79.7% of all patients subsequently dying would be visited. LDT-EWS score of 5: Males: 36.7% calls triggered, 75.8% deaths visited. LDT-EWS score of 4: Females: 35.2% calls triggered, 75.3% deaths visited.
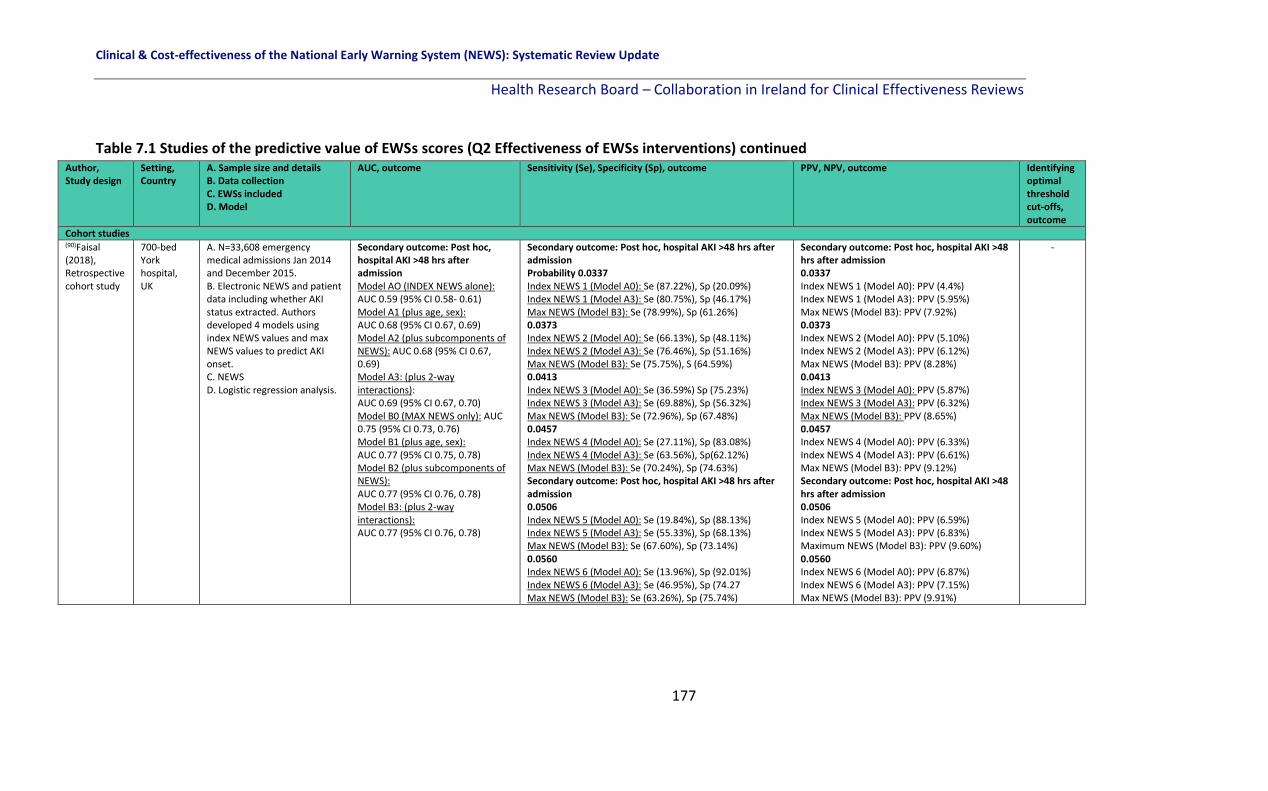
Clinical & Cost-effectiveness of the National Early Warning System (NEWS): Systematic Review Update
Health Research Board – Collaboration in Ireland for Clinical Effectiveness Reviews
177
Table 7.1 Studies of the predictive value of EWSs scores (Q2 Effectiveness of EWSs interventions) continued Author, Study design
Setting, Country
A. Sample size and details B. Data collection C. EWSs included D. Model
AUC, outcome Sensitivity (Se), Specificity (Sp), outcome PPV, NPV, outcome Identifying optimal threshold cut-offs, outcome
Cohort studies (90)Faisal (2018), Retrospective cohort study
700-bed York hospital, UK
A. N=33,608 emergency medical admissions Jan 2014 and December 2015. B. Electronic NEWS and patient data including whether AKI status extracted. Authors developed 4 models using index NEWS values and max NEWS values to predict AKI onset. C. NEWS D. Logistic regression analysis.
Secondary outcome: Post hoc, hospital AKI >48 hrs after admission Model AO (INDEX NEWS alone): AUC 0.59 (95% CI 0.58- 0.61) Model A1 (plus age, sex): AUC 0.68 (95% CI 0.67, 0.69) Model A2 (plus subcomponents of NEWS): AUC 0.68 (95% CI 0.67, 0.69) Model A3: (plus 2-way interactions): AUC 0.69 (95% CI 0.67, 0.70) Model B0 (MAX NEWS only): AUC 0.75 (95% CI 0.73, 0.76) Model B1 (plus age, sex): AUC 0.77 (95% CI 0.75, 0.78) Model B2 (plus subcomponents of NEWS): AUC 0.77 (95% CI 0.76, 0.78) Model B3: (plus 2-way interactions): AUC 0.77 (95% CI 0.76, 0.78)
Secondary outcome: Post hoc, hospital AKI >48 hrs after admission Probability 0.0337 Index NEWS 1 (Model A0): Se (87.22%), Sp (20.09%) Index NEWS 1 (Model A3): Se (80.75%), Sp (46.17%) Max NEWS (Model B3): Se (78.99%), Sp (61.26%) 0.0373 Index NEWS 2 (Model A0): Se (66.13%), Sp (48.11%) Index NEWS 2 (Model A3): Se (76.46%), Sp (51.16%) Max NEWS (Model B3): Se (75.75%), S (64.59%) 0.0413 Index NEWS 3 (Model A0): Se (36.59%) Sp (75.23%) Index NEWS 3 (Model A3): Se (69.88%), Sp (56.32%) Max NEWS (Model B3): Se (72.96%), Sp (67.48%) 0.0457 Index NEWS 4 (Model A0): Se (27.11%), Sp (83.08%) Index NEWS 4 (Model A3): Se (63.56%), Sp(62.12%) Max NEWS (Model B3): Se (70.24%), Sp (74.63%) Secondary outcome: Post hoc, hospital AKI >48 hrs after admission 0.0506 Index NEWS 5 (Model A0): Se (19.84%), Sp (88.13%) Index NEWS 5 (Model A3): Se (55.33%), Sp (68.13%) Max NEWS (Model B3): Se (67.60%), Sp (73.14%) 0.0560 Index NEWS 6 (Model A0): Se (13.96%), Sp (92.01%) Index NEWS 6 (Model A3): Se (46.95%), Sp (74.27 Max NEWS (Model B3): Se (63.26%), Sp (75.74%)
Secondary outcome: Post hoc, hospital AKI >48 hrs after admission 0.0337 Index NEWS 1 (Model A0): PPV (4.4%) Index NEWS 1 (Model A3): PPV (5.95%) Max NEWS (Model B3): PPV (7.92%) 0.0373 Index NEWS 2 (Model A0): PPV (5.10%) Index NEWS 2 (Model A3): PPV (6.12%) Max NEWS (Model B3): PPV (8.28%) 0.0413 Index NEWS 3 (Model A0): PPV (5.87%) Index NEWS 3 (Model A3): PPV (6.32%) Max NEWS (Model B3): PPV (8.65%) 0.0457 Index NEWS 4 (Model A0): PPV (6.33%) Index NEWS 4 (Model A3): PPV (6.61%) Max NEWS (Model B3): PPV (9.12%) Secondary outcome: Post hoc, hospital AKI >48 hrs after admission 0.0506 Index NEWS 5 (Model A0): PPV (6.59%) Index NEWS 5 (Model A3): PPV (6.83%) Maximum NEWS (Model B3): PPV (9.60%) 0.0560 Index NEWS 6 (Model A0): PPV (6.87%) Index NEWS 6 (Model A3): PPV (7.15%) Max NEWS (Model B3): PPV (9.91%)
-

Clinical & Cost-effectiveness of the National Early Warning System (NEWS): Systematic Review Update
Health Research Board – Collaboration in Ireland for Clinical Effectiveness Reviews
178
Table 7.1 Studies of the predictive value of EWSs scores (Q2 Effectiveness of EWSs interventions) Author, Study design
Setting, Country
A. Sample size and details B. Data collection C. EWSs included D. Model
AUC, outcome Sensitivity (Se), Specificity (Sp), outcome
PPV, NPV, outcome Identifying optimal threshold cut-offs, outcome
Cohort studies (65)Ghanem-Zoubi (2011), Prospective cohort study.
Community-based University hospital, Israel.
A. N=1,072 patients with sepsis admitted to a 110-bed general internal medicine ward between Feb 2008 - Apr 2009. B. Prospective collection of patients with sepsis using the computerised system and a validated definition of sepsis. C. MEWS, SCS, MEDS, REMS D. Logistic regression analysis.
Secondary outcome: Clinical deterioration in sub-populations mortality AUC for in-hospital mortality overall MEWS: 0.69 (0.65-0.73) SCS 0.77 (0.74-0.80) MEDS 0.73 (0.70-0.77) REMS, 0.77 (0.73-0.80) 5-day in-hospital mortality MEWS: 0.73 (0.68-0.78) SCS 0.79 (0.76-0.83) MEDS 0.77 (0.73-0.81) REMS, 0.80 (0.76-0.84) 28-day in-hospital mortality MEWS: 0.70 (0.66-0.74) SCS 0.79 (0.75-0.82) MEDS 0.75 (0.71-0.78) REMS, 0.79 (0.75-0.81)
- - -
(116)Hackmann (2011), Retrospective cohort and mini clinical trial design
Single hospital, USA
A. N=19,116 general patients admitted between Jul 2007 and Jan 2010. Mini ‘real-time simulation’ trial included n=1,204 patients between Oct and Dec 2010. B. 2-tier system: (1) automatic identification of patients at risk of clinical deterioration using EWS from existing electronic database calculated using machine learning algorithms, and (2) real-time detection of clinical event based on real-time VS data collected from on-body technology attached to those high-risk patients. Data is sent to the EMR and EWS scores are assigned to patients in real time using ‘machine-learning techniques’ to analyse the data. C. algorithm based EWS D. Logistic regression.
Primary outcome: Transfer to the ICU New electronic model AUC: 0.88. Using a ‘real-time simulator’ of the model, the predictive value for transfer to ICU was; AUC = 0.73
Primary outcome: Transfer to the ICU New electronic model Se: 0.49 Sp: 0.95 Using a ‘real-time simulator’ of the model: Se: 0.41 Sp: 0.95
Primary outcome: Transfer to the ICU (N of events not reported) New electronic model: PPV: 0.31 NPV: 0.97 Using a ‘real-time simulator’: PPV: 0.29 NPV: 0.97
-
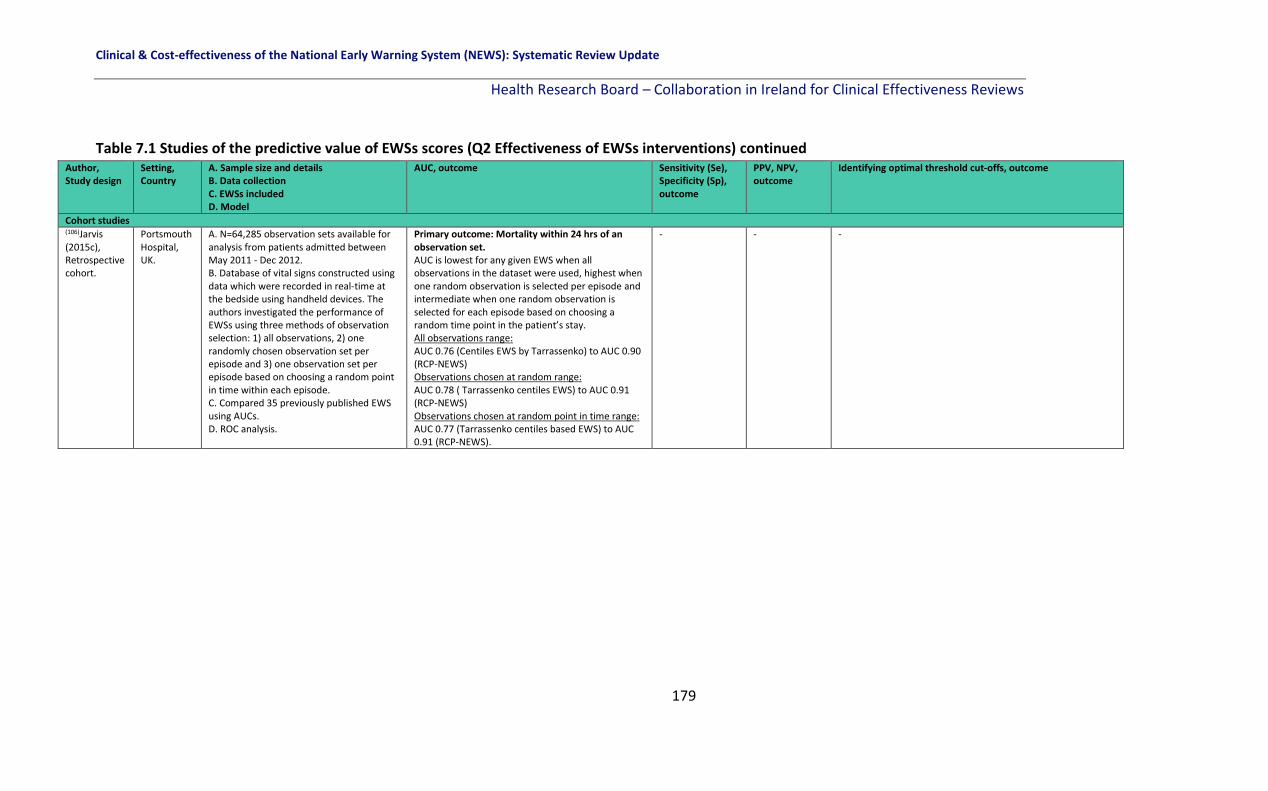
Clinical & Cost-effectiveness of the National Early Warning System (NEWS): Systematic Review Update
Health Research Board – Collaboration in Ireland for Clinical Effectiveness Reviews
179
Table 7.1 Studies of the predictive value of EWSs scores (Q2 Effectiveness of EWSs interventions) continued Author, Study design
Setting, Country
A. Sample size and details B. Data collection C. EWSs included D. Model
AUC, outcome Sensitivity (Se), Specificity (Sp), outcome
PPV, NPV, outcome
Identifying optimal threshold cut-offs, outcome
Cohort studies (106)Jarvis (2015c), Retrospective cohort.
Portsmouth Hospital, UK.
A. N=64,285 observation sets available for analysis from patients admitted between May 2011 - Dec 2012. B. Database of vital signs constructed using data which were recorded in real-time at the bedside using handheld devices. The authors investigated the performance of EWSs using three methods of observation selection: 1) all observations, 2) one randomly chosen observation set per episode and 3) one observation set per episode based on choosing a random point in time within each episode. C. Compared 35 previously published EWS using AUCs. D. ROC analysis.
Primary outcome: Mortality within 24 hrs of an observation set. AUC is lowest for any given EWS when all observations in the dataset were used, highest when one random observation is selected per episode and intermediate when one random observation is selected for each episode based on choosing a random time point in the patient’s stay. All observations range: AUC 0.76 (Centiles EWS by Tarrassenko) to AUC 0.90 (RCP-NEWS) Observations chosen at random range: AUC 0.78 ( Tarrassenko centiles EWS) to AUC 0.91 (RCP-NEWS) Observations chosen at random point in time range: AUC 0.77 (Tarrassenko centiles based EWS) to AUC 0.91 (RCP-NEWS).
- - -
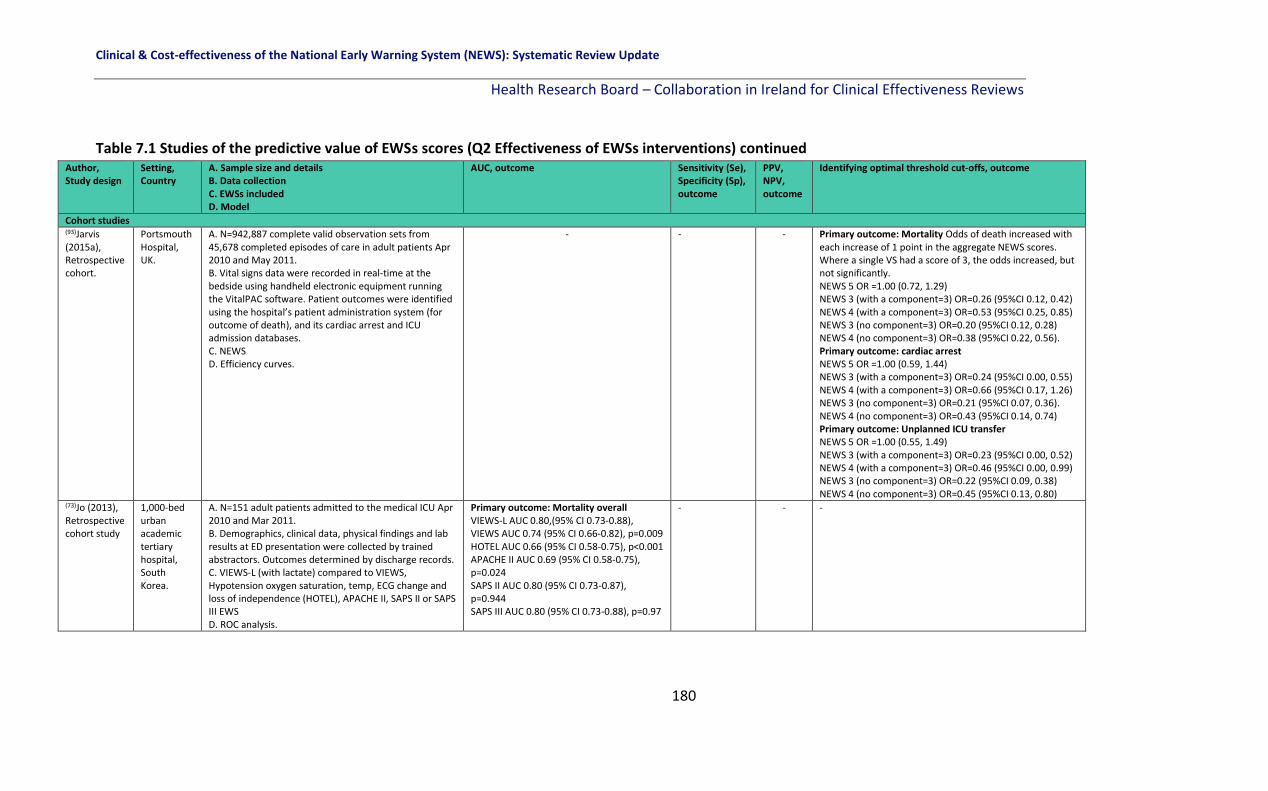
Clinical & Cost-effectiveness of the National Early Warning System (NEWS): Systematic Review Update
Health Research Board – Collaboration in Ireland for Clinical Effectiveness Reviews
180
Table 7.1 Studies of the predictive value of EWSs scores (Q2 Effectiveness of EWSs interventions) continued Author, Study design
Setting, Country
A. Sample size and details B. Data collection C. EWSs included D. Model
AUC, outcome Sensitivity (Se), Specificity (Sp), outcome
PPV, NPV, outcome
Identifying optimal threshold cut-offs, outcome
Cohort studies (93)Jarvis (2015a), Retrospective cohort.
Portsmouth Hospital, UK.
A. N=942,887 complete valid observation sets from 45,678 completed episodes of care in adult patients Apr 2010 and May 2011. B. Vital signs data were recorded in real-time at the bedside using handheld electronic equipment running the VitalPAC software. Patient outcomes were identified using the hospital’s patient administration system (for outcome of death), and its cardiac arrest and ICU admission databases. C. NEWS D. Efficiency curves.
- - - Primary outcome: Mortality Odds of death increased with each increase of 1 point in the aggregate NEWS scores. Where a single VS had a score of 3, the odds increased, but not significantly. NEWS 5 OR =1.00 (0.72, 1.29) NEWS 3 (with a component=3) OR=0.26 (95%CI 0.12, 0.42) NEWS 4 (with a component=3) OR=0.53 (95%CI 0.25, 0.85) NEWS 3 (no component=3) OR=0.20 (95%CI 0.12, 0.28) NEWS 4 (no component=3) OR=0.38 (95%CI 0.22, 0.56). Primary outcome: cardiac arrest NEWS 5 OR =1.00 (0.59, 1.44) NEWS 3 (with a component=3) OR=0.24 (95%CI 0.00, 0.55) NEWS 4 (with a component=3) OR=0.66 (95%CI 0.17, 1.26) NEWS 3 (no component=3) OR=0.21 (95%CI 0.07, 0.36). NEWS 4 (no component=3) OR=0.43 (95%CI 0.14, 0.74) Primary outcome: Unplanned ICU transfer NEWS 5 OR =1.00 (0.55, 1.49) NEWS 3 (with a component=3) OR=0.23 (95%CI 0.00, 0.52) NEWS 4 (with a component=3) OR=0.46 (95%CI 0.00, 0.99) NEWS 3 (no component=3) OR=0.22 (95%CI 0.09, 0.38) NEWS 4 (no component=3) OR=0.45 (95%CI 0.13, 0.80)
(73)Jo (2013), Retrospective cohort study
1,000-bed urban academic tertiary hospital, South Korea.
A. N=151 adult patients admitted to the medical ICU Apr 2010 and Mar 2011. B. Demographics, clinical data, physical findings and lab results at ED presentation were collected by trained abstractors. Outcomes determined by discharge records. C. VIEWS-L (with lactate) compared to VIEWS, Hypotension oxygen saturation, temp, ECG change and loss of independence (HOTEL), APACHE II, SAPS II or SAPS III EWS D. ROC analysis.
Primary outcome: Mortality overall VIEWS-L AUC 0.80,(95% CI 0.73-0.88), VIEWS AUC 0.74 (95% CI 0.66-0.82), p=0.009 HOTEL AUC 0.66 (95% CI 0.58-0.75), p<0.001 APACHE II AUC 0.69 (95% CI 0.58-0.75), p=0.024 SAPS II AUC 0.80 (95% CI 0.73-0.87), p=0.944 SAPS III AUC 0.80 (95% CI 0.73-0.88), p=0.97
- - -

Clinical & Cost-effectiveness of the National Early Warning System (NEWS): Systematic Review Update
Health Research Board – Collaboration in Ireland for Clinical Effectiveness Reviews
181
Table 7.1 Studies of the predictive value of EWSs scores (Q2 Effectiveness of EWSs interventions) continued
Author, Study design
Setting, Country
A. Sample size and details B. Data collection C. EWSs included D. Model
AUC, outcome Sensitivity (Se), Specificity (Sp), outcome
PPV, NPV, outcome Identifying optimal threshold cut-offs, outcome
Cohort studies (105)Jarvis (2015b), Retrospective cohort.
Portsmouth Hospital, UK.
A. N=68,576 discharges of 46,944 unique adult patients between May 2011 - Dec 2012. B. Database of vital signs constructed using data which were recorded in real-time at the bedside using handheld devices. The authors investigated the effectiveness of EWSs that have only 2 scores, 0 (normal, i.e., low risk) or 1 (abnormal, i.e., increased risk), for each vital sign. C. The simplified EWS, referred to as ‘binary EWS’, were based on previously existing standard EWSs (36 published ‘standard’ EWS—the 34 previously compared by Smith et al.(8), plus CART and the Centiles EWS). D. ROC analysis.
Primary outcome: Mortality All aggregate EWSs and binary EWS AUC≥0.70. Binary EWS had lower discriminatory ability than the standard EWS in general for predicting death, but these differences were not statistically significant. The exception was Bakir’s EWS and CART. Binary NEWS had significantly better discriminatory ability than all other standard EWS, except the standard NEWS. Primary outcome: Cardiac arrest All aggregate EWSs and binary EWS AUC≥0.60. Binary EWS had lower discriminatory ability than the standard EWS in general for predicting cardiac arrest, but these differences were not statistically significant. The exception was Bakir’s EWS and CART. Binary NEWS had significantly better discriminatory ability than all other standard EWS, except the standard NEWS. Primary outcome: ICU admission All aggregate EWSs and binary EWS AUC ≥0.70 for predicting unplanned ICU admission (except Bakir EWS and CART). Binary EWS had lower discriminatory ability than the standard EWS in general but these differences were not significant. Binary NEWS had significantly better discriminatory ability than all other standard EWS, except the standard NEWS.
NEWS aggregate score ≥5; any adverse outcome: Se=69.7% Sp=94.2%
Binary NEWS score ≥3; Any adverse outcome: Se=67.7% Sp=92.9%
NEWS aggregate score ≥5; Any adverse outcome (3.4%): PPV=11.8% NPV=99.6% Binary NEWS score ≥3, Any adverse outcome: PPV=9.6% NPV=99.6%
A score of 3 in Binary NEWS is closest to the standard triggering score of 5 in NEWS. NEWS would generate a trigger in 10.20% of observations and 29.01% of episodes, and would trigger in the 24h before an adverse outcome in 92.57%of cases. For Binary NEWS, 11.78% of observation sets would result in a trigger (35.27% of episodes) and 93.05% of episodes ending in an adverse outcome would trigger in the 24h preceding that outcome.

Clinical & Cost-effectiveness of the National Early Warning System (NEWS): Systematic Review Update
Health Research Board – Collaboration in Ireland for Clinical Effectiveness Reviews
182
Table 7.1 Studies of the predictive value of EWSs scores (Q2 Effectiveness of EWSs interventions)
Author, Study design
Setting, Country
A. Sample size and details B. Data collection C. EWSs included D. Model
AUC, outcome Sensitivity (Se), Specificity (Sp), outcome
PPV, NPV, outcome
Identifying optimal threshold cut-offs, outcome
Cohort studies (58)Liljehult (2016), Retrospective cohort study.
Copenhagen University Hospital, Denmark.
A. N=274 patients who on admission were suspected of ischemic or haemorrhagic stroke were included. B. Data systematically collected to audit and secure the implementation process on all patients in 2012 (May-September). All data were extracted retrospectively from electronic patient files. 1st set of vital signs recorded used in analysis as well as the highest EWS during the hospitalisation period. C. newly-developed EWS D. ROC analysis.
Secondary outcome clinical deterioration in a subpopulation: Mortality (p values are differences between survivors and non-survivors) Admission ViEWS: AUC: 0.85 (0.76-0.95), p<0.001 Max ViEWS: AUC: 0.94 (0.91-0.98), p<0.001 No difference between areas: p=0.07. Scandinavian Stroke Scale: AUC 0.90 (0.84-0.96), p<0.001. Not different to admission EWS (p=0.44) or max EWS (p=0.16). For individual parameters, only RR (AUC 0.67, p=0.005) and AVPU (AUC 0.72, p<0.001) were significantly better at distinguishing between survivors and non-survivors than pure chance.
Primary outcome: Mortality Admission EWS 1 Se=79.2% Sp=80.1% Admission EWS 4 Se=50% Sp=97.3% Max EWS EWS 1 Se=100% Sp=45.3% EWS 4 Se=95.8% Sp=87.0%
Primary outcome: Mortality Admission EWS 1 PPV=27.1% NPV=97.6% EWS 4 PPV=63.2% NPV=95.4% Max EWS EWS 1 PPV=14.7% NPV=100% EWS 4 PPV=41.1% NPV=99.5%
-
(70)Luis (2017), Prospective cohort study.
Lisbon Central Hospital, Portugal.
A.N=330 patients admitted to 2 medical wards, 3 surgical wards and 1 haematology ward Dec 1st and 31st 2012. B. Authors evaluated the individual parameters of the NEWS model for an appropriate detection of the outcomes, building an aggregate system properly adapted to the suited convenience sample based on nursing records for admitted patients. C. NEWS D. ROC analysis.
Primary outcome: Mortality NEWS overall: AUC 0.94 (0.91, 0.98), p<0.001. HR: AUC 0.77 (0.67, 0.86), p<0.001. RR: AUC 0.62 (0.51, 0.73), p=0.025. Temp: AUC 0.51 (0.41, 0.61), not significant. SBP: AUC 0.71 (0.62, 0.81), not significant. SpO2: AUC 0.73 (0.63, 0.83), p<0.001. FiO2: AUC 0.83 (0.77, 0.89), p<0.001. AVPU: AUC 0.78 (0.68, 0.88), p<0.001. Model 1 (excluding temp): AUC 0.97 (0.94-0.99), p<0.001 Model 2 (excluding SBP): AUC 0.90 (0.86-0.95), p<0.001.
Primary outcome: Mortality NEWS=6.5: Se 91.2%, Sp 78.4%, Model 1<5.5: Se 97.2%, Sp 80.7%, Model 2=4.5: Se 82.4%, Sp 82.8%
- -

Clinical & Cost-effectiveness of the National Early Warning System (NEWS): Systematic Review Update
Health Research Board – Collaboration in Ireland for Clinical Effectiveness Reviews
183
Table 7.1 Studies of the predictive value of EWSs scores (Q2 Effectiveness of EWSs interventions) continued Author, Study design
Setting, Country
A. Sample size and details B. Data collection C. EWSs included D. Model
AUC, outcome Sensitivity, Specificity, outcome
PPV, NPV, outcome
Identifying optimal threshold cut-offs, outcome
(94)Kovacs (2016), Retrospective cohort study
Portsmouth Hospitals NHS Trust, UK.
A. N=87 399 admissions, comprising 2,017,455 observation sets. Of these, 35,174 were admissions to surgical specialities (792,889 observation sets) and 52,225 admissions to medical specialties (1,174,574 observation sets) over 31 months (25/05/2011 and discharged on or before 31/12/2013). B. Data were categorised as elective or non-elective surgical or medical admissions. Staff entered patients’ vital signs data at the bedside into handheld devices running the VitalPAC software following the hospital protocol. For each admission (or episode of care) three outcomes (death, cardiac arrest and unanticipated ICU admission) were extracted from the appropriate hospital databases. C. NEWS D. ROC analysis.
Primary outcome: Death within 24 hrs: All observations, non-elective surgical AUC 0.91 (0.90, 0.92) All observations, non-elective medical AUC 0.90 (0.89, 0.90), p=0.003 Random observations, non-elective surgical AUC 0.91 (0.89, 0.94) Random observations, non-elective medical AUC 0.92 (0.92, 0.93), p=0.522 Primary outcome: Cardiac arrest within 24 hrs: All observations, non-elective surgical AUC 0.76 (0.73, 0.79) All observations, non-elective medical AUC 0.74 (0.73, 0.75), p=0.345 Random observations, non-elective surgical AUC 0.72 (0.66, 0.77) Random observations, non-elective medical AUC 0.74 (0.72, 0.76), p=0.508
Primary outcome: Unanticipated ICU admission within 24 hrs: All observations, non-elective surgical AUC 0.86 (0.85, 0.86) All observations, non-elective medical AUC 0.86 (0.85, 0.87), p=0.555 Random observations, non-elective surgical AUC 0.83 (0.81, 0.85) Random observations, non-elective medical AUC 0.87 (0.85, 0.88), p<0.001 Combined outcome: All observations, non-elective surgical AUC 0.87 (0.86, 0.88) All observations, non-elective medical AUC 0.87 (0.87, 0.87), p=0.874 Random observations, non-elective surgical AUC 0.84 (0.83, 0.86) Random observations, non-elective medical AUC 0.88 (0.88, 0.89), p<0.001
- - ViEWS value of 5 would trigger for 12.3% of observations performed on non-elective medical or surgical admissions, and this would result in the detection of 70.2% of combined outcomes. ViEWS value of 4 would have a similar efficiency (11.0% of observations detecting 70.9% of Combined Outcomes) for non-elective admissions to medical or surgical specialties.
(78)Van Galen (2016), Prospective cohort study
Large urban university hospital, The Netherlands.
A.N=1,053 patients admitted to 6 different wards between Oct and Nov 2015. B. Charts of all included patients were checked by the investigator to obtain the patients’ MEWS and to determine whether scores were documented correctly. All patients followed up for 30 days after inclusion. Max Score per patient used to perform the predictive analysis. C. MEWS D. ROC analysis.
- Composite outcome: death, cardiac arrest, ICU admission and re-admission: MEWS >3: Se: 61%, Sp: 83%
Composite outcome (3.9%): Death, cardiac arrest, ICU admission MEWS >3: PPV: 12.5%, NPV: 98.1%
-

Clinical & Cost-effectiveness of the National Early Warning System (NEWS): Systematic Review Update
Health Research Board – Collaboration in Ireland for Clinical Effectiveness Reviews
184
Table 7.1 Studies of the predictive value of EWSs scores (Q2 Effectiveness of EWSs interventions) continued Author, Study design
Setting, Country
A. Sample size and details B. Data collection C. EWSs included D. Model
AUC, outcome Sensitivity (Se), Specificity (Sp), outcome PPV, NPV, outcome
Identifying optimal threshold cut-offs, outcome
(148)Moseson (2014), Prospective observational cohort study.
Academic tertiary hospital, San Francisco, USA.
A. N=227 patients admitted to the ICU with acute medical or surgical complications. B. Prospective cohort, scores calculated by computer and manually checked at random. C. Compared ED-based EWS (REMS, MEWS, Seymour and PEDS) to ICU-based EWS (SAPS II, APACHE II, APACHE III) D. ROC analysis.
Primary outcome: 60-day mortality ED data: REMS: 0.70 (0.61, 0.78) MEWS: 0.69 (0.62, 0.77) PEDS 0.70 (0.62-0.79) Seymour: 0.74 (0.67-0.81) ICU data: APACHE-II 0.77 (0.70-0.85) APACHE-III 0.79 (0.72-0.87) SAPS II 0.79 (0.72, 0.86).
- - -
(61)Martin (2015), Prospective cohort study.
French hospital, France.
A. N=100 consecutive patients undergoing elective colorectal surgery with anastomosis between Jun 2012 - Jun 2013. B. Parameters were measured at the bedside and the score calculated. Each patient had a routine visit 4 weeks post surgery and followed for three months or longer by appointment visits or telephone. C. The Dutch leakage score (DULK) D. ROC analysis.
Secondary outcome clinical deterioration in a subpopulation: AL-related mortality 3AUC: 0.86 [0.76 – 0.96]
Primary outcome: AL-related mortality Se: 91.7% (at a DULK score >3 threshold) Sp: 55.7% (at a DULK score >3 threshold)
Primary outcome: AL-related mortality (17%) PPV: 22% (at a DULK score >3 threshold)
-
(40)Nguyen (2015), Prospective cohort study.
680-bed hospital, Australia.
A. N=752 AMU patients (Feb and Aug 2013). B. Calculated retrospectively to predict mortality and LOS. C. Simple clinical score (SCS) EWS D. Logistic regression.
Primary outcome: Mortality AUC using age: 0.66; AUC using age and SCS: 0.80 Primary outcome: 30-day mortality: AUC using age: 0.68; AUC using age and SCS: 0.85 Primary outcome: In-hospital mortality: AUC using age: 0.65; AUC using age and SCS: 0.82 Primary outcome: LOS (>3 days) AUC using age: 0.65; AUC using age and SCS: 0.70
Primary outcome: 30-day mortality (6.4%): SCS threshold:11; Se: 72.9%; Sp: 81.1% Primary outcome: In-hospital mortality (4.3%): SCS threshold:10; Se: 81.3%; Sp: 73.3% Primary outcome: LOS (>3 days) SCS threshold: 7; Se: 66.2%; Sp: 63.6%
- -
3 Author was contacted for the correct AUC and 95% CIs as these were incorrectly reported in the paper.

Clinical & Cost-effectiveness of the National Early Warning System (NEWS): Systematic Review Update
Health Research Board – Collaboration in Ireland for Clinical Effectiveness Reviews
185
Table 7.1 Studies of the predictive value of EWSs scores (Q2 Effectiveness of EWSs interventions) continued
Author, Study design
Setting, Country
A. Sample size and details B. Data collection C. EWSs included D. Model
AUC, outcome Sensitivity (Se), Specificity (Sp), outcome PPV, NPV, outcome
Identifying optimal threshold cut-offs, outcome
Cohort studies (150)Rothman (2013), Retrospective cohort study.
Three US hospitals, USA.
A. Model construction: N=22,265. Model validation: in-patient data from 3 hospitals: total admissions: n=148,985. B.A single dataset for model construction and 5 datasets for validation using the EMR. C. Rothman Index (RI) D. ROC analysis.
Primary outcome: 24-hr mortality: Hospital A: RI AUC: 0.93 (95% CI, 0.93–0.93) Hospital B: RI AUC: 0.94 (95% CI, 0.94– 0.95) Hospital C: RI AUC: 0.92 (5% CI, 0.91–0.94)
- - -
(75)Reini (2012), Prospective cohort study.
600-bed Linkoping Hospital, Sweden.
A. N=518 patients admitted to the general ICU between Oct 2008 - Dec 2009. B. Demographic data in addition to the scores and ICU LOS obtained from computer-based ICU registry. C. MEWS, SOFA, SAPS III D. ROC analysis.
Primary outcome – ICU mortality MEWS AUC: 0.80 (0.72-0.88). SOFA AUC: 0.91 (0.86-0.97). SAPS III AUC 0.89 (0.83-0.94).
Primary outcome – ICU mortality MEWS-in (MEWS on admission to ICU) of 6: Se 62% and Sp 85%. SOFA of 8: Se 83% and Sp 82%. SAPS III of 70: Se 83% and Sp 82%.
- -
(83)Smith (2012), Prospective cohort study.
University hospital, The Netherlands.
A. N=572 consecutive patients admitted to the general and trauma surgery ward of a university hospital (Mar–Sept 2009). B. Authors investigated the relationship between the EWS and the composite endpoint consisting of death, reanimation, unexpected ICU admission, emergency surgery and severe complications. C. EWS D. ROC analysis.
Secondary outcome post hoc: Composite outcome (Death, reanimation, unexpected ICU admission, emergency operations and sever complications). AUC: 0.87 (0.81 to 0.93).
Secondary outcome post hoc: Composite outcome (Death, reanimation, unexpected ICU admission, emergency operations and sever complications). Se MEWS of at least 3 was 74 (59 to 85) Sp was 82 (78 to 85) Whilst an EWS≥4 as a positive test result equated to a Se 54% and Sp 94%.
- -

Clinical & Cost-effectiveness of the National Early Warning System (NEWS): Systematic Review Update
Health Research Board – Collaboration in Ireland for Clinical Effectiveness Reviews
186
Table 7.1 Studies of the predictive value of EWSs scores (Q2 Effectiveness of EWSs interventions) continued
Author, Study design
Setting, Country
A. Sample size and details B. Data collection C. EWSs included D. Model
AUC, outcome Sensitivity (Se), Specificity (Sp), outcome
PPV, NPV, outcome
Identifying optimal threshold cut-offs, outcome
Cohort studies (149)Romero-Brufau (2014), Retrospective cohort study.
2 academic hospitals, USA.
A. N=6,948,689 unique time points from N=34,898 unique consecutive hospitalised patients in 2011. B. We developed a longitudinal database that included patients’ data at the minute level throughout each patient’s hospital stay. Vital signs were manually collected and entered into the EMR by a nurse. C. EWSs (MEWS, SEWS, GMEWS, Worthing, ViEWS and NEWS), with the RRT single parameter calling criteria currently in use in the institution D. Calculated a variety of triggers using the MEWS, ViEWS, SEWS, GMEWS, NEWS and Worthing scores and own RRT criteria in a rolling fashion through episodes of care. The score was updated every time a new parameter was entered into the EMR, and last values were carried forward to complete the rest of the required parameters to calculate the score. Published thresholds used to create rule triggers.
Figure reproduced from paper (page 550).
Secondary outcome: post hoc: composite outcome of resuscitation calls, RRT activation or unplanned ICU transfer). Positive predictive values ranged from less than 0.01 (Worthing, 3 h) to 0.21 (GMEWS, 36 h). Se ranged from 0.07 (GMEWS, 3 h) to 0.75 (ViEWS, 36 h). Thus MEWS had the best Sp, but missed many events; VIEWS detected more events, but identified many false positive alerts. Used in an automated fashion, these would correspond to 1040–215,020 false positive alerts per year.
(100)Suppiah (2014), Prospective cohort study.
University hospital, Leeds, UK.
A. N=142 patients with acute pancreatitis admitted Jan and Dec 2010. B. A prospective database was analysed to determine value of MEWS in identifying severe acute pancreatitis (SAP) and predicting poor outcome. C. MEWS D. ROC analysis.
Secondary outcome: clinical deterioration in a subpopulation: SAP Highest MEWS: AUC 0.92, 95% CI: 0.85 – 1.00 Mean MEWS: AUC 0.91, 95% CI: 0.84–0.99
Secondary outcome: clinical deterioration in a subpopulation: SAP Highest MEWS ≥3: Se 95.5%, Sp: 90.8% Mean MEWS >1: Se 95.5%, Sp 87.5%.
- -

Clinical & Cost-effectiveness of the National Early Warning System (NEWS): Systematic Review Update
Health Research Board – Collaboration in Ireland for Clinical Effectiveness Reviews
187
Table 7.1 Studies of the predictive value of EWSs scores (Q2 Effectiveness of EWSs interventions) continued
Author, Study design
Setting, Country
A. Sample size and details B. Data collection C. EWSs included D. Model
AUC, outcome Sensitivity (Se), Specificity (Sp), outcome
PPV, NPV, outcome Identifying optimal threshold cut-offs, outcome
Cohort studies (8)Smith (2013), Retrospective cohort analysis.
Portsmouth hospital, UK.
A. N=198,755 observation sets collected from 35,585 consecutive, completed acute medical admissions between May 2006 and Jun 2008. B. A database of vital signs collected in real-time from completed consecutive admissions to beds in the Medical Assessment Unit (MAU) of the hospital was developed. We tested the ability of NEWS to discriminate patients at risk of cardiac arrest, unanticipated ICU admission or death within 24 h of a NEWS value. C. NEWS and 33 other EWSs currently in use D. ROC analysis.
Primary outcome: Death NEWS AUC: 0.89 (95 % CI 0.89–0.90), Other EWSs AUC: ranged from 0.81(95 % CI 0.80–0.82) to 0.86 (95 % CI 0.850–0.87) Primary outcome: Cardiac arrest: NEWS AUC: 0.72 (95 % CI 0.68–0.76), Other EWSs AUC: ranged from 0.61 (95 % CI 0.57–0.65) to 0.71 (95 % CI 0.67–0.74) Primary outcome: Unanticipated ICU admission: NEWS AUC: 0.86 (95 % CI 0.85–0.87), Other EWSs AUC: ranged from 0.57 (95 % CI 0.55–0.57) to 0.83 (95 % CI 0.81–0.84) Secondary outcome post hoc: Combined outcomes NEWS AUC: 0.87 (95 % CI 0.86–0.87) Other EWSs AUC: ranged from 0.73 (95 % CI 0.72–0.74) to 0.83 (95 % CI 0.82–0.84).
- - -

Clinical & Cost-effectiveness of the National Early Warning System (NEWS): Systematic Review Update
Health Research Board – Collaboration in Ireland for Clinical Effectiveness Reviews
188
Table 7.1 Studies of the predictive value of EWSs scores (Q2 Effectiveness of EWSs interventions) continued
Author, Study design
Setting, Country
A. Sample size and details B. Data collection C. EWSs included D. Model
AUC, outcome Sensitivity (Se), Specificity (Sp), outcome
PPV, NPV, outcome Identifying optimal threshold cut-offs, outcome
Cohort studies (138)Stark (2015), Retrospective cohort study.
Ronald Regan UCLA hospital, USA.
A. N=62 elective surgical patients admitted Jan 2013 and Mar 2014 with code blue events. B. Using the EMR, for all patients, the previously validated MEWS was calculated using routine vital signs and nursing assessments. The MEWS was calculated on admission and at 24-hour intervals preceding the event using the earliest recorded complete set of vitals on that day (72 hrs, 48 hrs, 24 hrs, and event-day). A “Max MEWS” was calculated for event-day after reviewing all complete sets of recorded vital signs before the event on the day of cardiopulmonary arrest. C. MEWS D. ROC analysis.
Primary outcome: Mortality after CPA Max MEWS 3 AUC: 0.73 Max MEWS 4 AUC: 0.73 Max MEWS 5 AUC: 0.68 Max MEWS 6 AUC: 0.59 Max MEWS 7 AUC: 0.61
Primary outcome: Mortality after CPA Max MEWS 3 Se (%) 97 Sp (%) 40 Max MEWS 4 Se (%) 91 Sp (%) 48 Max MEWS 5 Se (%) 68 Sp (%) 68 Max MEWS 6 Se (%) 50 Sp (%) 72 Max MEWS 7 Se (%) 47 Sp (%) 80
Primary outcome: Mortality after CPA (56.5%) Max MEWS 3 PPV (%) 69 NPV (%) 91 Max MEWS 4 PPV (%) 71 NPV (%) 80 Max MEWS 5 PPV (%) 74 NPV (%) 61 Max MEWS 6 PPV (%) 71 NPV (%) 51 Max MEWS 7 PPV (%) 76 NPV (%) 53
-
(103)Cooksley (2012), Retrospective cohort study
Specialist oncology hospital, UK.
A. N=840 oncology patients admitted Apr 2009 and Jan 2011. B. Data collected from proformas completed by the acute oncology nurse specialist and data used to retrospectively calculate the scores. C. NEWS, MEWS D. Logistic regression analysis.
Secondary outcome: clinical deterioration in sub-populations 30-day mortality MEWS AUC: 0.55 NEWS AUC: 0.59 Secondary outcome: clinical deterioration in sub-populations critical care unit admission MEWS AUC: 0.60 NEWS AUC: 0.62
- - -
(84)Van Rooijen (2013), Prospective cohort study.
700-bed teaching hospital, The Netherlands.
A. 71,911 EWS values were obtained, 31,728 (44%) on medical wards and 40,183 (56%) on surgical wards from May 2010 – May 2011. B. EWS was calculated from vital parameters in all patients. Cut-off
value was defined as EWS ≥ 3. It was registered whenever the threshold was exceeded within the database. C. EWS D. Se and Sp calculated using appropriate formulas.
- - - Outcome: Se was calculated from the total number of responses and interventions Threshold: 4 Se: 74% Sp: 51% Threshold: 5 Se: 52% Sp: 73%
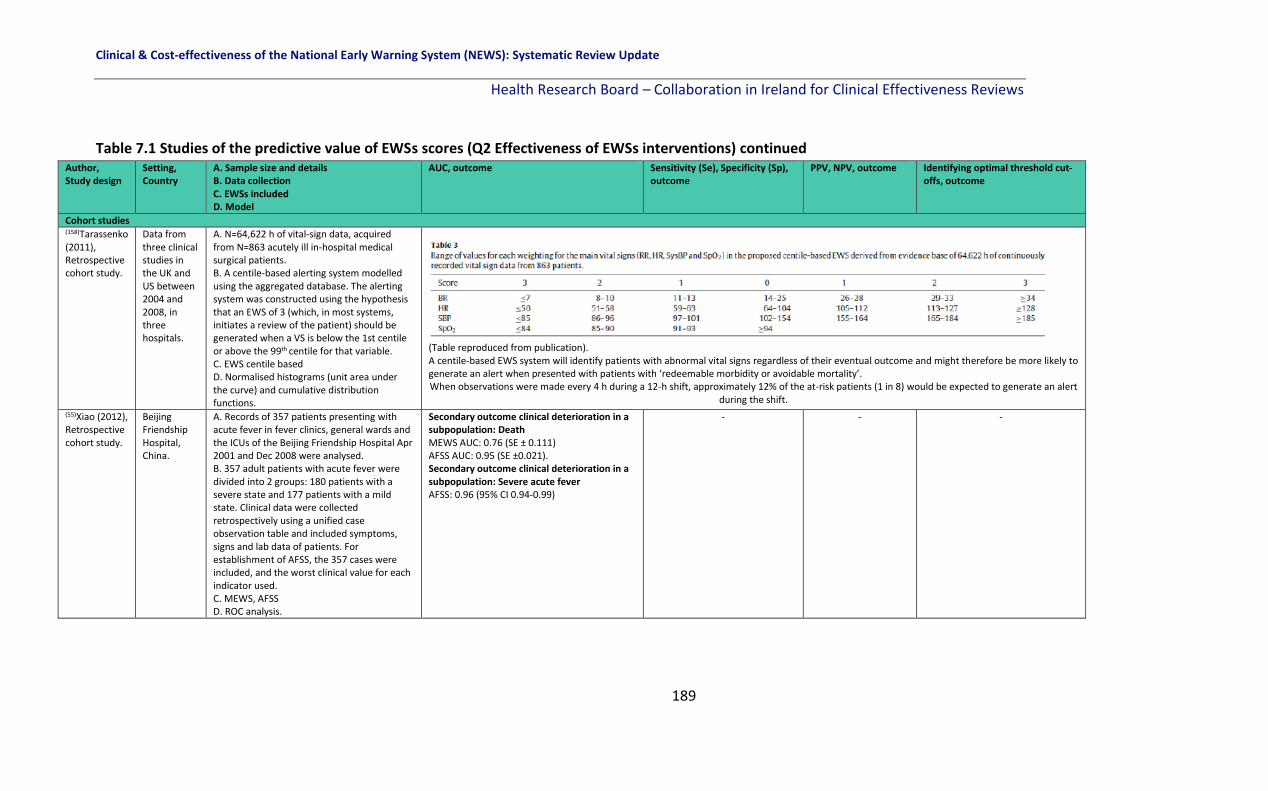
Clinical & Cost-effectiveness of the National Early Warning System (NEWS): Systematic Review Update
Health Research Board – Collaboration in Ireland for Clinical Effectiveness Reviews
189
Table 7.1 Studies of the predictive value of EWSs scores (Q2 Effectiveness of EWSs interventions) continued Author, Study design
Setting, Country
A. Sample size and details B. Data collection C. EWSs included D. Model
AUC, outcome Sensitivity (Se), Specificity (Sp), outcome
PPV, NPV, outcome Identifying optimal threshold cut-offs, outcome
Cohort studies (158)Tarassenko (2011), Retrospective cohort study.
Data from three clinical studies in the UK and US between 2004 and 2008, in three hospitals.
A. N=64,622 h of vital-sign data, acquired from N=863 acutely ill in-hospital medical surgical patients. B. A centile-based alerting system modelled using the aggregated database. The alerting system was constructed using the hypothesis that an EWS of 3 (which, in most systems, initiates a review of the patient) should be generated when a VS is below the 1st centile or above the 99th centile for that variable. C. EWS centile based D. Normalised histograms (unit area under the curve) and cumulative distribution functions.
(Table reproduced from publication). A centile-based EWS system will identify patients with abnormal vital signs regardless of their eventual outcome and might therefore be more likely to generate an alert when presented with patients with ‘redeemable morbidity or avoidable mortality’. When observations were made every 4 h during a 12-h shift, approximately 12% of the at-risk patients (1 in 8) would be expected to generate an alert
during the shift.
(55)Xiao (2012), Retrospective cohort study.
Beijing Friendship Hospital, China.
A. Records of 357 patients presenting with acute fever in fever clinics, general wards and the ICUs of the Beijing Friendship Hospital Apr 2001 and Dec 2008 were analysed. B. 357 adult patients with acute fever were divided into 2 groups: 180 patients with a severe state and 177 patients with a mild state. Clinical data were collected retrospectively using a unified case observation table and included symptoms, signs and lab data of patients. For establishment of AFSS, the 357 cases were included, and the worst clinical value for each indicator used. C. MEWS, AFSS D. ROC analysis.
Secondary outcome clinical deterioration in a subpopulation: Death MEWS AUC: 0.76 (SE ± 0.111) AFSS AUC: 0.95 (SE ±0.021). Secondary outcome clinical deterioration in a subpopulation: Severe acute fever AFSS: 0.96 (95% CI 0.94-0.99)
- - -

Clinical & Cost-effectiveness of the National Early Warning System (NEWS): Systematic Review Update
Health Research Board – Collaboration in Ireland for Clinical Effectiveness Reviews
190
Table 7.1 Studies of the predictive value of EWSs scores (Q2 Effectiveness of EWSs interventions) continued
Author, Study design
Setting, Country
A. Sample size and details B. Data collection C. EWSs included D. Model
AUC, outcome Sensitivity (Se), Specificity (Sp), outcome
PPV, NPV, outcome Identifying optimal threshold cut-offs, outcome
Cohort studies (101)Abbott
(2015),
Prospective cohort study.
Teaching hospital, UK.
A: N=445 adults admitted to AAU between Mar
and Apr 2013.
B: Patient notes and PARS observation charts
reviewed during 1st 48 hrs. NEWS score
retrospectively calculated in database for each set
of measurements available alongside PARS.
C: NEWS D. Logistic regression to identify optimal threshold.
PARS thresholds not identified as insignificant
association with the composite outcome primary
outcomes (p=0.056).
-
-
-
Composite outcome: Critical care
admission or death within 48 hrs,
NEWS>1: OR 3.23, p=0.073
NEWS>2: OR 7.03, p=0.003
NEWS>3: OR 8.12, p<0.001
NEWS>4: OR 6.36, p=0.001
NEWS>5: OR 6.02, p=0.002
NEWS>6: OR 11.66, p<0.001
NEWS>7: OR 15.11, p<0.001
Every NEWS-point increase associated with a 55% increased
risk. (140)Alaa (2018), Retrospective cohort study.
Ronald Regan tertiary hospital, USA
A. N=6,321 critical care patients admitted to a
general medical floor between 2013 and 2016.
B. Risk scoring model trained with n=5,130 patients
and tested with the most recently admitted 1,191
patients (2015-2016) using hospital EMR. Training
set split into n=4130 patients for training and
N=1,000 for validation.
C. Risk model EWS, MEWS, SOFA, APACHE II, Rothman Index. D. Risk modelled using a continuous time model and latent class analysis and patient sub-types modelled accounting for heterogeneity of patients.
ICU admission rate
Proposed risk model G=6:
AUC 0.81
MEWS:
AUC 0.64
SOFA: AUC 0.62
APACHE II:
AUC 0.63
Rothman Index: AUC 0.72
-
ICU admission rate (<10%)
Proposed risk model G=6:
TPR=60, PPV=30%
MEWS:
TPR=60, PPV=11%
SOFA:
TPR=60, PPV=12%
APACHE II:
TPR=60, PPV=12%
Rothman Index:
TPR=60, PPV=15%
The risk score offers a lower false alarm
rate compared to all other EWS for all TPR
settings
-
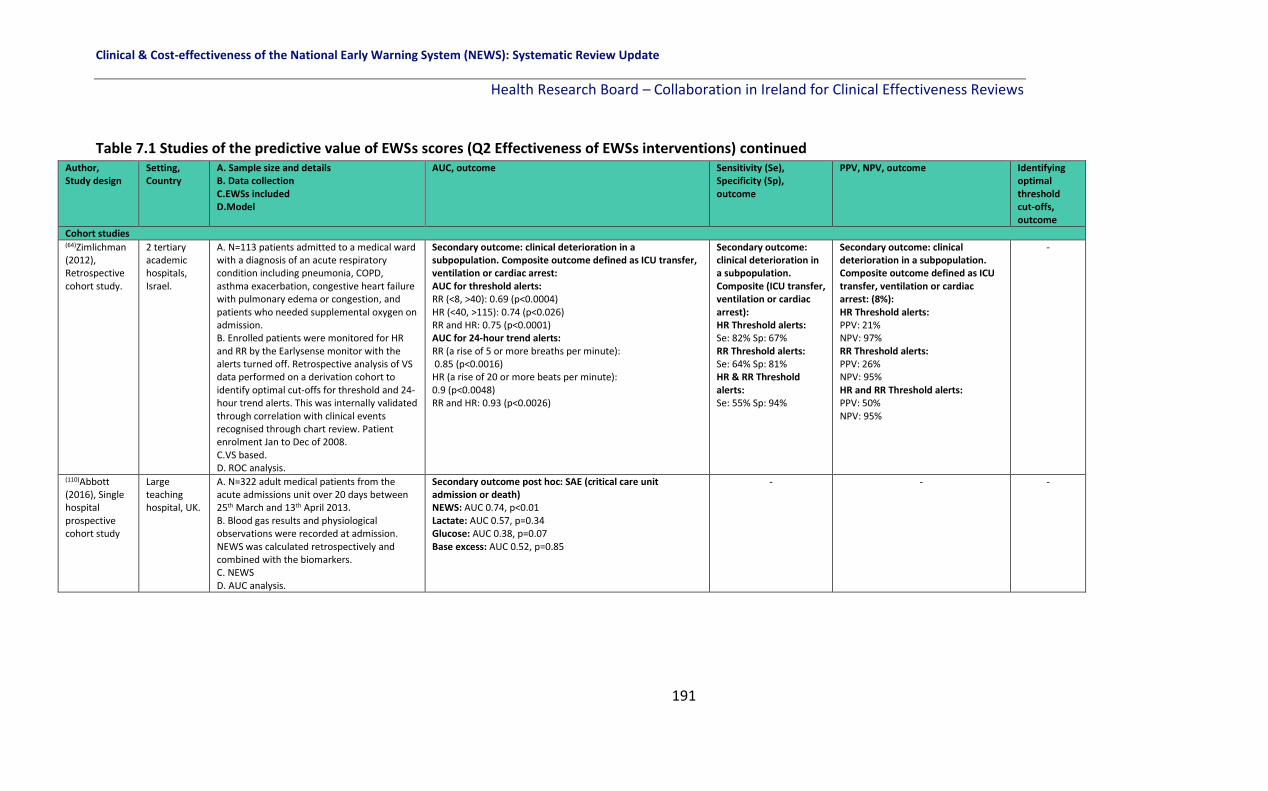
Clinical & Cost-effectiveness of the National Early Warning System (NEWS): Systematic Review Update
Health Research Board – Collaboration in Ireland for Clinical Effectiveness Reviews
191
Table 7.1 Studies of the predictive value of EWSs scores (Q2 Effectiveness of EWSs interventions) continued Author, Study design
Setting, Country
A. Sample size and details B. Data collection C.EWSs included D.Model
AUC, outcome Sensitivity (Se), Specificity (Sp), outcome
PPV, NPV, outcome Identifying optimal threshold cut-offs, outcome
Cohort studies (64)Zimlichman (2012), Retrospective cohort study.
2 tertiary academic hospitals, Israel.
A. N=113 patients admitted to a medical ward with a diagnosis of an acute respiratory condition including pneumonia, COPD, asthma exacerbation, congestive heart failure with pulmonary edema or congestion, and patients who needed supplemental oxygen on admission. B. Enrolled patients were monitored for HR and RR by the Earlysense monitor with the alerts turned off. Retrospective analysis of VS data performed on a derivation cohort to identify optimal cut-offs for threshold and 24-hour trend alerts. This was internally validated through correlation with clinical events recognised through chart review. Patient enrolment Jan to Dec of 2008. C.VS based. D. ROC analysis.
Secondary outcome: clinical deterioration in a subpopulation. Composite outcome defined as ICU transfer, ventilation or cardiac arrest: AUC for threshold alerts: RR (<8, >40): 0.69 (p<0.0004) HR (<40, >115): 0.74 (p<0.026) RR and HR: 0.75 (p<0.0001) AUC for 24-hour trend alerts: RR (a rise of 5 or more breaths per minute): 0.85 (p<0.0016) HR (a rise of 20 or more beats per minute): 0.9 (p<0.0048) RR and HR: 0.93 (p<0.0026)
Secondary outcome: clinical deterioration in a subpopulation. Composite (ICU transfer, ventilation or cardiac arrest): HR Threshold alerts: Se: 82% Sp: 67% RR Threshold alerts: Se: 64% Sp: 81% HR & RR Threshold alerts: Se: 55% Sp: 94%
Secondary outcome: clinical deterioration in a subpopulation. Composite outcome defined as ICU transfer, ventilation or cardiac arrest: (8%): HR Threshold alerts: PPV: 21% NPV: 97% RR Threshold alerts: PPV: 26% NPV: 95% HR and RR Threshold alerts: PPV: 50% NPV: 95%
-
(110)Abbott (2016), Single hospital prospective cohort study
Large teaching hospital, UK.
A. N=322 adult medical patients from the acute admissions unit over 20 days between 25th March and 13th April 2013. B. Blood gas results and physiological observations were recorded at admission. NEWS was calculated retrospectively and combined with the biomarkers. C. NEWS D. AUC analysis.
Secondary outcome post hoc: SAE (critical care unit admission or death) NEWS: AUC 0.74, p<0.01 Lactate: AUC 0.57, p=0.34 Glucose: AUC 0.38, p=0.07 Base excess: AUC 0.52, p=0.85
- - -

Clinical & Cost-effectiveness of the National Early Warning System (NEWS): Systematic Review Update
Health Research Board – Collaboration in Ireland for Clinical Effectiveness Reviews
192
Table 7.1 Studies of the predictive value of EWSs scores (Q2 Effectiveness of EWSs interventions) continued Author, Study design
Setting, Country
A. Sample size and details B. Data collection C. EWSs included D. Model
AUC, outcome Sensitivity (Se), Specificity (Sp), outcome
PPV, NPV, outcome
Identifying optimal threshold cut-offs, outcome
Cohort studies (154)Churpek (2016), Observational cohort study
Five hospitals in Illinois, USA (One tertiary academic hospital; 2 suburban teaching hospitals; and 2 community hospitals)
A. N= 269,999 hospitalised medical-surgical ward patients admitted between November 2008 until Jan 2013 in a large multicentre study. B. Using EHRs the dataset was split at each hospital into derivation (60%) and validation (40%) cohorts. C. Different machine learning techniques (Logistic regression; Tree-based models; K-Nearest Neighbours; Support Vector Machines; and Neutral Networks) compared to the MEWS. D. AUC analysis.
Primary outcome: mortality Random forest: AUC 0.94 K-nearest neighbours: AUC 0.93 Gradient boosted machine: AUC 0.93 Logistic (linear): AUC 0.92 Support vector machine: AUC 0.92 Neural network: AUC 0.92 Bagged tree: AUC 0.92 Logistic (spine): AUC 0.91 MEWS: AUC 0.88 Decision tree: AUC 0.87 Primary outcome: cardiac arrest Random forest: AUC 0.83 Logistic (linear): AUC 0.81 K-nearest neighbours: AUC 0.81 Gradient boosted machine: AUC 0.81 Support vector machine: AUC 0.81 Bagged tree: AUC 0.79 Neural network: AUC 0.79 Logistic (spine): AUC 0.78 Decision tree: AUC 0.74 MEWS: AUC 0.71
Primary outcome: ICU transfer.
Random forest: AUC 0.78
Gradient boosted machine: AUC 0.78
Bagged tree: AUC 0.77
Support vector machine: AUC 0.77
Neural network: AUC 0.77
Logistic (spine): AUC 0.75
K-nearest neighbours: AUC 0.73
Decision tree: AUC 0.72
Logistic (linear): AUC 0.71
MEWS: AUC 0.68
Secondary outcome post-hoc: Composite outcome of ward
death, ward to ICU transfer or ward cardiac arrest
Random forest: AUC 0.80
Gradient booted machine: AUC 0.79
Bagged trees: AUC 0.79
Support vector machine: AUC: 0.79
Neutral network: AUC 0.78
Logistic (spline): AUC 0.77
K-nearest neighbours: AUC 0.75
Logistic (linear): AUC 0.73
Decision tree: AUC: 0.73
MEWS: 0.70
RR, HR, age, and SBP were the most important predictor
variables in the random forest model
Secondary outcome post-hoc: Composite outcome of ward death, ward to ICU transfer or ward cardiac arrest (16,452/269,999) At the 75% Se cut-off 31% of
the observations in the validation dataset were above the risk threshold
associated with this Se for random forest model
compared to 37% for logistic spline model, 44% for logistic linear term model and 50%
for MEWS.
- -

Clinical & Cost-effectiveness of the National Early Warning System (NEWS): Systematic Review Update
Health Research Board – Collaboration in Ireland for Clinical Effectiveness Reviews
193
Table 7.1 Studies of the predictive value of EWSs scores (Q2 Effectiveness of EWSs interventions) Author, Study design
Setting, Country
A. Sample size and details B. Data collection C. EWSs included D. Model
AUC, outcome Sensitivity (Se), Specificity (Sp), outcome
PPV, NPV, outcome Identifying optimal threshold cut-offs, outcome
Cohort studies (155)Churpek (2017), Observational cohort study
University of Chicago, an urban tertiary care hospital with 500 beds
A. N=12,154 patients with a suspicion of infection on the wards (n=18,523 ED patients not included in this systematic review, but were presented in this study separately) admitted between Nov 2008 - Jan 2016. B: All time and location-stamped vital signs, lab orders and demographic data from the EHR were de identified and put on a server. C. qSOFA, SIRS, MEWS and NEWS D. AUC analysis.
Outcome: In-hospital mortality – ward patients only NEWS: AUC 0.79 (95% CI 0.77-0.82) MEWS: AUC 0.75 (95% CI 0.73-0.77) qSOFA: AUC 0.69 (95% CI 0.67-0.72) SIRS: AUC 0.68 (95% CI 0.66-0.69) Secondary outcome post hoc: SAE (death or ICU stay – ward patients only) NEWS: AUC 0.73 (95% CI 0.71-0.75) MEWS: AUC 0.69 (95% CI 0.67-0.72) qSOFA: AUC 0.64 (95% CI 0.62-0.66) SIRS: AUC 0.61 (95% CI 0.58-0.62)
Results not presented separately for ward patients
(included ED and ward patients combined)
Results not presented separately for ward patients
(included ED and ward patients combined)
Results not
presented
separately for
ward patients
(included ED
and ward
patients
combined)
(85)Douw (2016), Prospective cohort study.
500-bed tertiary University affiliated teaching hospital, Netherlands.
A: N=3522 surgical patients, admitted between March 2013 and April 2014. B: Data from the electronic patient files were extracted from the hospital’s data warehouse. Nine DENWS indicators of worry together with the EWS totalled ten variables for prediction model. C.DENWIS, algorithm based EWS D. AUC analysis.
Secondary outcome post hoc: SAE (unplanned ICU/HDU admission or unexpected in-hospital mortality) EWS: AUC 0.86 (95% CI 0.82-0.90) Worry: AUC 0.81 (95% CI 0.77-0.85) EWS <7: AUC 0.74 (95% CI 0.69-0.79) DENWIS model (10 variables): AUC 0.85 (95% CI 0.80-0.89) DENWIS model plus worry: AUC 0.87 (95% CI 0.84-0.91) EWS plus DENWIS model: AUC: 0.91 (95% CI 0.88-0.93)
- - -
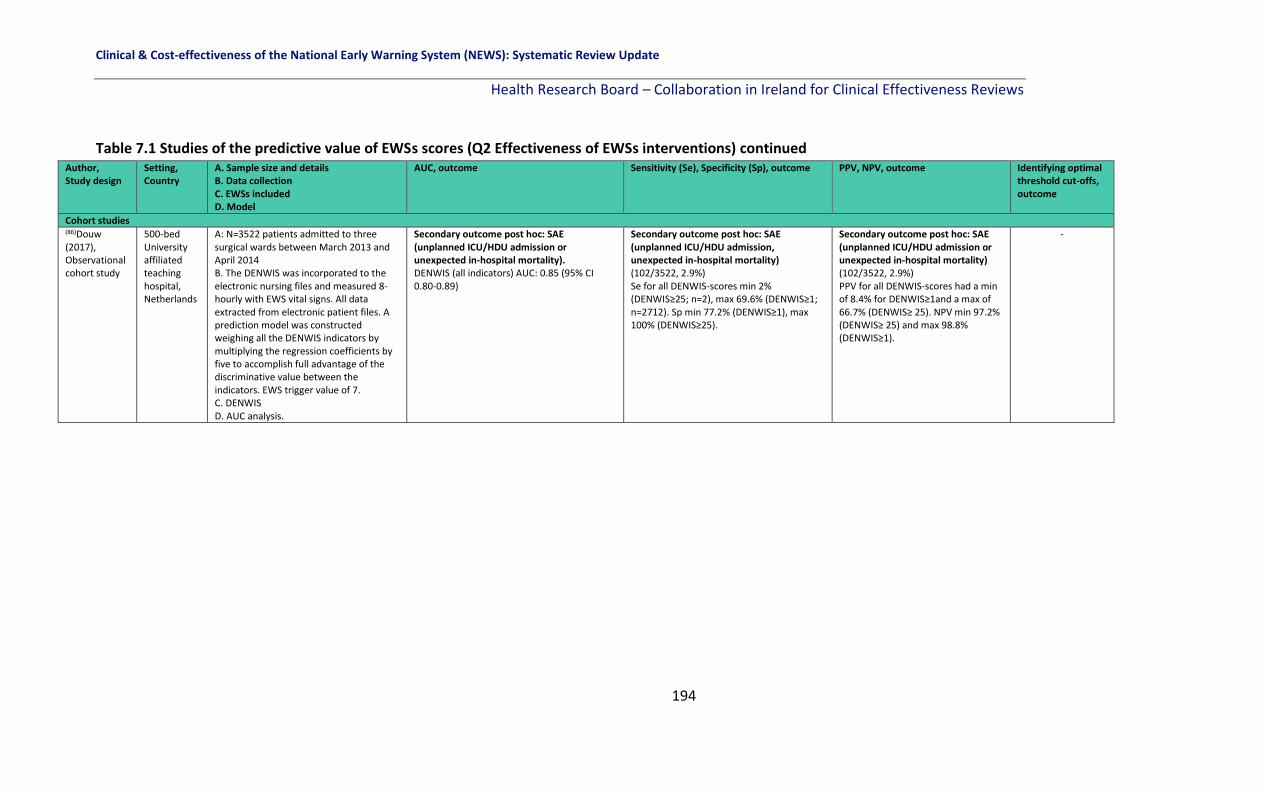
Clinical & Cost-effectiveness of the National Early Warning System (NEWS): Systematic Review Update
Health Research Board – Collaboration in Ireland for Clinical Effectiveness Reviews
194
Table 7.1 Studies of the predictive value of EWSs scores (Q2 Effectiveness of EWSs interventions) continued Author, Study design
Setting, Country
A. Sample size and details B. Data collection C. EWSs included D. Model
AUC, outcome Sensitivity (Se), Specificity (Sp), outcome PPV, NPV, outcome Identifying optimal threshold cut-offs, outcome
Cohort studies (86)Douw (2017), Observational cohort study
500-bed University affiliated teaching hospital, Netherlands
A: N=3522 patients admitted to three surgical wards between March 2013 and April 2014 B. The DENWIS was incorporated to the electronic nursing files and measured 8-hourly with EWS vital signs. All data extracted from electronic patient files. A prediction model was constructed weighing all the DENWIS indicators by multiplying the regression coefficients by five to accomplish full advantage of the discriminative value between the indicators. EWS trigger value of 7. C. DENWIS D. AUC analysis.
Secondary outcome post hoc: SAE (unplanned ICU/HDU admission or unexpected in-hospital mortality). DENWIS (all indicators) AUC: 0.85 (95% CI 0.80-0.89)
Secondary outcome post hoc: SAE (unplanned ICU/HDU admission, unexpected in-hospital mortality) (102/3522, 2.9%) Se for all DENWIS-scores min 2% (DENWIS≥25; n=2), max 69.6% (DENWIS≥1; n=2712). Sp min 77.2% (DENWIS≥1), max 100% (DENWIS≥25).
Secondary outcome post hoc: SAE (unplanned ICU/HDU admission or unexpected in-hospital mortality) (102/3522, 2.9%) PPV for all DENWIS-scores had a min of 8.4% for DENWIS≥1and a max of 66.7% (DENWIS≥ 25). NPV min 97.2% (DENWIS≥ 25) and max 98.8% (DENWIS≥1).
-

Clinical & Cost-effectiveness of the National Early Warning System (NEWS): Systematic Review Update
Health Research Board – Collaboration in Ireland for Clinical Effectiveness Reviews
195
Table 7.1 Studies of the predictive value of EWSs scores (Q2 Effectiveness of EWSs interventions) continued Author, Study design
Setting, Country
A. Sample size and details B. Data collection C. EWSs included D. Model
AUC, outcome Sensitivity (Se), Specificity (Sp), outcome PPV, NPV, outcome Identifying optimal threshold cut-offs, outcome
Cohort studies (111)Hodgson (2017), Observational retrospective cohort study
2 UK hospitals.
A: N=39,470 patients admitted between March 2012 - February 2014 (n=2,361 admissions in 942 individuals with an acute exacerbation of COPD (AECOPD) and n=37,109 non-COPD admissions in 20,415 comparison patients) B. NEWS calculated automatically using handheld electronic devices to predict inpatient mortality. C. NEWS, CREWS, S-NEWS D. AUC analysis
Primary outcome: Inpatient mortality 1st admissions: AECOPD cohort: NEWS=AUC 0.74 (95% CI 0.66-0.82) CREWS=AUC 0.72 (95% CI 0.63 to 0.80) Salford-NEWS=AUC 0.62 (95% CI 0.53 to 0.70). AMU cohort NEWS=AUC 0.77 (95% CI 0.75 to 0.78) All inpatient episodes AECOPD cohort NEWS=AUC 0.69 (95% CI 0.64 to 0.75), CREWS=AUC 0.70 (95% CI 0.64 to 0.75) Salford-NEWS=AUC 0.67 (95% CI 0.61 to 0.72). AMU cohort NEWS=AUC 0.75 (95% CI 0.74 to 0.76)
Primary outcome: Inpatient mortality For AECOPD cohort, for their 1st admission, using Score ≥5 COPD: NEWS: Se 76% (61 to 88) Sp 57% (54 to 61) CREWS: Se 48% (32 to 64) Sp 88% (85 to 90) Salford-NEWS: Se 24% (12 to 39) Sp 91% (89 to 93) For AMU cohort, for their 1st admission, using Score ≥5 COPD: NEWS: Se 43% (40 to 46) Sp 90% (90 to 91) For AECOPD cohort, for their 1st admission, using Score ≥7 COPD: NEWS: Se 60% (43 to 74) Sp 80% (77 to 83) CREWS: Se 13% (6 to 23) Sp 96% (95 to 97) Salford-NEWS: Se 14% (5 to 29) Sp 95% (94 to 97) For AMU cohort, for their 1st admission, using Score ≥7 COPD: NEWS: Se 25% (23 to 28) Sp 96% (96 to 97)
Primary outcome: Inpatient mortality For AECOPD cohort, for their 1st admission, using Score ≥5 COPD: NEWS: PPV 8% (5 to 11) NPV 98% (97 to 99) CREWS: PPV 15% (10 to 23) NPV 97% (96 to 98) Salford-NEWS: PPV 11% (5 to 19) NPV 96% (95 to 97) For AMU cohort, for their 1st admission, using Score ≥5: NEWS: PPV 17% (16 to 19) NPV 97% (97 to 97) For AECOPD cohort, for their 1st admission, using Score ≥7 COPD: NEWS: PPV 12% (8 to 18) NPV 98% (96 to 99) CREWS: PPV 21% (10 to 37) NPV 93% (91 to 95) Salford-NEWS: PPV 12% (5 to 25) NPV 96% (95 to 97) For AMU cohort, for their 1st admission, using Score ≥7: 25% (22 to 28) NPV 96% (96 to 97)
-
(89)Hollis (2016), Retrospective cohort study
Single hospital, USA
A: N=522 surgical patients admitted from 2013 to 2014. B. QIP data on all surgical procedures merged with enterprise data on vital signs, ICU transfer status and MET activation. ViEWS measurements on ward locations only were used to achieve the lowest acuity setting. C. ViEWS D. AUC analysis
Secondary outcome posthoc: SAEs (surgical site infection including organs, myocardial infarction, pneumonia, wound disruption, sepsis, unplanned return to operating theatre, bleeding/ transfusion, acute renal failure, cerebral vascular accident, unplanned intubation, septic shock, MET activation, unplanned ICU transfer, cardiac arrest, death) (n=105/522, 20%) EWS: AUC 0.90
- - Using a threshold of 8: Se 81%, Sp 84% PPV 27%
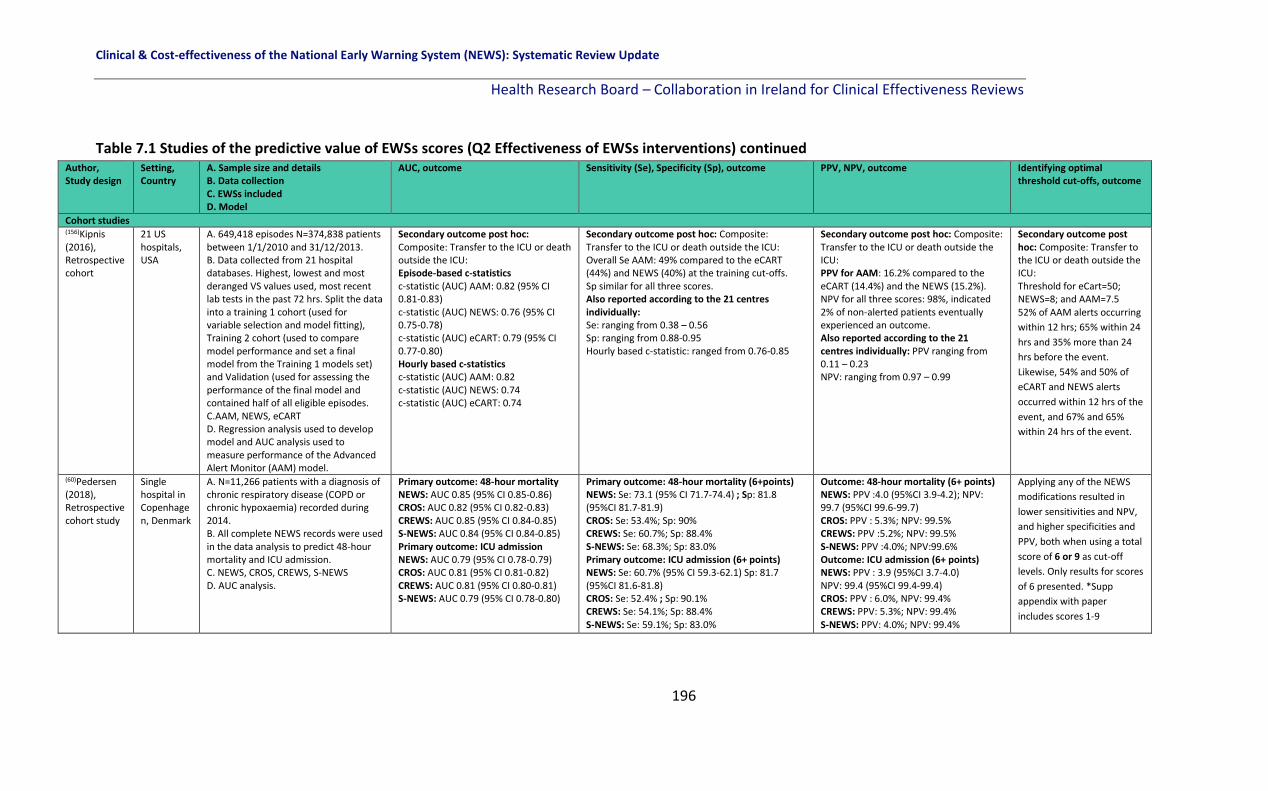
Clinical & Cost-effectiveness of the National Early Warning System (NEWS): Systematic Review Update
Health Research Board – Collaboration in Ireland for Clinical Effectiveness Reviews
196
Table 7.1 Studies of the predictive value of EWSs scores (Q2 Effectiveness of EWSs interventions) continued Author, Study design
Setting, Country
A. Sample size and details B. Data collection C. EWSs included D. Model
AUC, outcome Sensitivity (Se), Specificity (Sp), outcome PPV, NPV, outcome Identifying optimal threshold cut-offs, outcome
Cohort studies (156)Kipnis (2016), Retrospective cohort
21 US hospitals, USA
A. 649,418 episodes N=374,838 patients between 1/1/2010 and 31/12/2013. B. Data collected from 21 hospital databases. Highest, lowest and most deranged VS values used, most recent lab tests in the past 72 hrs. Split the data into a training 1 cohort (used for variable selection and model fitting), Training 2 cohort (used to compare model performance and set a final model from the Training 1 models set) and Validation (used for assessing the performance of the final model and contained half of all eligible episodes. C.AAM, NEWS, eCART D. Regression analysis used to develop model and AUC analysis used to measure performance of the Advanced Alert Monitor (AAM) model.
Secondary outcome post hoc: Composite: Transfer to the ICU or death outside the ICU: Episode-based c-statistics c-statistic (AUC) AAM: 0.82 (95% CI 0.81-0.83) c-statistic (AUC) NEWS: 0.76 (95% CI 0.75-0.78) c-statistic (AUC) eCART: 0.79 (95% CI 0.77-0.80) Hourly based c-statistics c-statistic (AUC) AAM: 0.82 c-statistic (AUC) NEWS: 0.74 c-statistic (AUC) eCART: 0.74
Secondary outcome post hoc: Composite: Transfer to the ICU or death outside the ICU: Overall Se AAM: 49% compared to the eCART (44%) and NEWS (40%) at the training cut-offs. Sp similar for all three scores. Also reported according to the 21 centres individually: Se: ranging from 0.38 – 0.56 Sp: ranging from 0.88-0.95 Hourly based c-statistic: ranged from 0.76-0.85
Secondary outcome post hoc: Composite: Transfer to the ICU or death outside the ICU: PPV for AAM: 16.2% compared to the eCART (14.4%) and the NEWS (15.2%). NPV for all three scores: 98%, indicated 2% of non-alerted patients eventually experienced an outcome. Also reported according to the 21 centres individually: PPV ranging from 0.11 – 0.23 NPV: ranging from 0.97 – 0.99
Secondary outcome post hoc: Composite: Transfer to the ICU or death outside the ICU: Threshold for eCart=50; NEWS=8; and AAM=7.5 52% of AAM alerts occurring
within 12 hrs; 65% within 24
hrs and 35% more than 24
hrs before the event.
Likewise, 54% and 50% of
eCART and NEWS alerts
occurred within 12 hrs of the
event, and 67% and 65%
within 24 hrs of the event.
(60)Pedersen (2018), Retrospective cohort study
Single hospital in Copenhagen, Denmark
A. N=11,266 patients with a diagnosis of chronic respiratory disease (COPD or chronic hypoxaemia) recorded during 2014. B. All complete NEWS records were used in the data analysis to predict 48-hour mortality and ICU admission. C. NEWS, CROS, CREWS, S-NEWS D. AUC analysis.
Primary outcome: 48-hour mortality NEWS: AUC 0.85 (95% CI 0.85-0.86) CROS: AUC 0.82 (95% CI 0.82-0.83) CREWS: AUC 0.85 (95% CI 0.84-0.85) S-NEWS: AUC 0.84 (95% CI 0.84-0.85) Primary outcome: ICU admission NEWS: AUC 0.79 (95% CI 0.78-0.79) CROS: AUC 0.81 (95% CI 0.81-0.82) CREWS: AUC 0.81 (95% CI 0.80-0.81) S-NEWS: AUC 0.79 (95% CI 0.78-0.80)
Primary outcome: 48-hour mortality (6+points) NEWS: Se: 73.1 (95% CI 71.7-74.4) ; Sp: 81.8 (95%CI 81.7-81.9) CROS: Se: 53.4%; Sp: 90% CREWS: Se: 60.7%; Sp: 88.4% S-NEWS: Se: 68.3%; Sp: 83.0% Primary outcome: ICU admission (6+ points) NEWS: Se: 60.7% (95% CI 59.3-62.1) Sp: 81.7 (95%CI 81.6-81.8) CROS: Se: 52.4% ; Sp: 90.1% CREWS: Se: 54.1%; Sp: 88.4% S-NEWS: Se: 59.1%; Sp: 83.0%
Outcome: 48-hour mortality (6+ points) NEWS: PPV :4.0 (95%CI 3.9-4.2); NPV: 99.7 (95%CI 99.6-99.7) CROS: PPV : 5.3%; NPV: 99.5% CREWS: PPV :5.2%; NPV: 99.5% S-NEWS: PPV :4.0%; NPV:99.6% Outcome: ICU admission (6+ points) NEWS: PPV : 3.9 (95%CI 3.7-4.0) NPV: 99.4 (95%CI 99.4-99.4) CROS: PPV : 6.0%, NPV: 99.4% CREWS: PPV: 5.3%; NPV: 99.4% S-NEWS: PPV: 4.0%; NPV: 99.4%
Applying any of the NEWS
modifications resulted in
lower sensitivities and NPV,
and higher specificities and
PPV, both when using a total
score of 6 or 9 as cut-off
levels. Only results for scores
of 6 presented. *Supp
appendix with paper
includes scores 1-9

Clinical & Cost-effectiveness of the National Early Warning System (NEWS): Systematic Review Update
Health Research Board – Collaboration in Ireland for Clinical Effectiveness Reviews
197
Table 7.1 Studies of the predictive value of EWSs scores (Q2 Effectiveness of EWSs interventions) Author, Study design
Setting, Country
A. Sample size and details B. Data collection C. EWSs included D. Model
AUC, outcome Sensitivity (Se), Specificity (Sp), outcome
PPV, NPV, outcome Identifying optimal threshold cut-offs, outcome
Cohort studies (112)Pimentel (2018), Multicentre, retrospective cohort study
Five acute hospitals from 2 UK NHS Trusts, UK.
A.N=251,266 adult acute admissions Jan 2012 - Dec 2016. B. Data were obtained from completed adult admissions who were not fit enough to be discharged alive on the day of admission with at least one complete set of vital signs recorded. Divided into three groups: 1) Patients with recorded type II respiratory failure (T2RF) [n=1,394], 2) Patients at risk of T2RF (n=48,898), and 3) Patients not at risk of T2RF (n=202,094). C. NEWS, NEWS2 D. AUC analysis
Primary outcome: in-hospital death within 24-hrs 1) Patients with recorded T2RF: NEWS: AUC 0.86 (95% CI 0.85-0.87) NEWS2: AUC 0.84 (95%CI 0.83-0.85) 2) Patients at risk of T2RF: NEWS: AUC 0.88 (95% CI 0.88-0.88) NEWS2: AUC 0.86 (95%CI 0.86-0.86) 3) Patients not at risk of T2RF (control) NEWS: AUC 0.91 (95%CI 0.91-0.91) NEWS2: AUC 0.89 (95% CI 0.89-0.89) Primary outcome: unanticipated ICU admission Documented T2RF NEWS: 0.81 (0.79 - 0.83) NEWS2: 0.82 (0.80 - 0.84) At risk T2RF NEWS: 0.81 (0.81 - 0.82) NEWS2: 0.81 (0.81 - 0.82) Neither at risk or documented NEWS: 0.84 (0.84 - 0.84) NEWS2: 0.83 (0.83 - 0.84)
Primary outcome: cardiac arrest Documented T2RF NEWS: 0.70 (0.65 - 0.75) NEWS2: 0.71 (0.66 - 0.75) At risk T2RF NEWS: 0.76 (0.74 - 0.77) NEWS2: 0.74 (0.73 - 0.75) Neither at risk or documented NEWS: 0.78 (0.78 - 0.79) NEWS2: 0.77 (0.76 - 0.78)
Secondary outcome post hoc:
composite
Documented T2RF
NEWS: 0.83 (0.82 - 0.85)
NEWS2: 0.83 (0.82 - 0.84)
At risk T2RF
NEWS: 0.86 (0.85 - 0.86)
NEWS2: 0.84 (0.84 - 0.85)
Neither at risk or documented
NEWS: 0.88 (0.88 - 0.88)
NEWS2: 0.87 (0.864 - 0.87)
Primary outcome: in-hospital death
within 24 h
Documented T2RF
Score>5 / Score>7
NEWS: Se 90.7 / 73.9, Sp 57.8 / 88.8
NEWS2: Se 80.9 / 60.1, Sp 68.8 / 87.3
At risk T2RF
Score>5 / Score>7
NEWS: Se 78.5 / 57.6, Sp 82.4 / 93.9
NEWS2: Se 73.2 / 51.8, Sp 80.6 / 83.6
Neither at risk or documented
Score>5 / Score>7
NEWS: Se 72.0 / 51.7, Sp 93.6 / 98.1
NEWS2: Se 73.5 / 54.5, Sp 87.4 / 95.7
Primary outcome: in-
hospital death within 24
h
Documented T2RF
Score>5 / Score>7
NEWS: PPV 2.5 / 4.6
NEWS2: PPV 3.0 / 5.3
At risk T2RF
Score>5 / Score>7
NEWS: PPV 3.2 / 6.6
NEWS2: PPV 2.7 / 5.7
Neither at risk or
documented
Score>5 / Score>7
NEWS: PPV 5.0 / 11.2
NEWS2: PPV 2.7 / 5.7
Outcome: in-hospital
death with 24-hrs
Patients with
documented T2RF:
NEWS2 at cut-offs of 5 &
7 reduced Se
approximately 10% and
14%. For patients at risk
of T2RF, NEWS2 cut-offs
of 5 and 7
reduces Se by 5-6%.
Finally, if used in error
for patients not at risk of
T2RF at the suggested
cut-offs, NEWS2 is
slightly more sensitive
than NEWS.

Clinical & Cost-effectiveness of the National Early Warning System (NEWS): Systematic Review Update
Health Research Board – Collaboration in Ireland for Clinical Effectiveness Reviews
198
Table 7.1 Studies of the predictive value of EWSs scores (Q2 Effectiveness of EWSs interventions) continued Author, Study design
Setting, Country A. Sample size and details B. Data collection C. EWSs included D. Model
AUC, outcome Sensitivity (Se), Specificity (Sp), outcome PPV, NPV, outcome Identifying optimal threshold cut-offs, outcome
Cohort studies (56)Qin (2017), Retrospective cohort study
West China Hospital of Sichuan University
A. N=292 patients admitted with shock (hypovolemic, septic, cardiogenic and mixed) Jan 2013 and Jan 2014. B. Data were retrospectively collected for 28-day prognosis of death. C. Shock index ,APACHE II, MEWS, SOFA scores, modified MEWS D. AUC analysis.
Primary outcome: 28-day death
APACHE II: AUC 0.78
MEWS: AUC0.61
Shock index: AUC 0.53
SOFA: AUC 0.63
modified-MEWS: AUC 0.70
- - Outcome: 28-day death
Optimal threshold:
APACHE II: 23.5
MEWS: 6.5
Shock index: 0.78
SOFA: 11.5
(77)Uppanisakorn (2018), Prospective observational study.
Songklanagarind Hospital medical ICU, Thailand
A. N=440/500 patients discharged from the medical ICU Dec 2015 and Oct 2016. B. NEWS at ICU discharge (NEWSdc) calculated before transfer of the patient to the destination ward. Clinical deterioration (acute respiratory failure or circulatory shock within 24hrs of ICU discharge) recorded by researchers. C. NEWS D. AUC analysis.
Secondary outcome post-hoc : SAE
(clinical deterioration within 24 hrs
defined as acute respiratory failure
or circulatory shock)
NEWSdc AUC: 0.93 (95% CI 0.90-
0.95)
Secondary outcome post-hoc : SAE (clinical deterioration
within 24 hrs defined as acute respiratory failure or circulatory
shock)
NEWSdc >7 gave the best Se(92.3%) and Sp(85.1%)

Clinical & Cost-effectiveness of the National Early Warning System (NEWS): Systematic Review Update
Health Research Board – Collaboration in Ireland for Clinical Effectiveness Reviews
199
Table 7.1 Studies of the predictive value of EWSs scores (Q2 Effectiveness of EWSs interventions) continued Author, Study design
Setting, Country
A. Sample size and details B. Data collection C. EWSs included D. Model
AUC, outcome Sensitivity (Se), Specificity (Sp), outcome PPV, NPV, outcome Identifying optimal threshold cut-offs, outcome
Cohort studies (113)Smith (2016), Retrospective cohort study
A large NHS
District
hospital, UK
A. N=2,245,778 VS sets (n=103,998 admissions) and n=66,712 unique patients between May 25th 2011 to December 31st 2013 in adult in-patient areas (except critical care units). B. VS data were recorded using VitalPAC software. Outcomes were taken from the hospital’s patient administration system, cardiac arrest database and ICU admission database. C. NEWS and 44 different MET criteria. D. AUC analysis.
Primary outcome: Mortality NEWS: AUC: 0.91 (95% CI 0.91-0.92) Primary outcome: Cardiac arrest NEWS: AUC: 0.78 (95% CI 0.76-0.78) Primary outcome: Unplanned ICU admission NEWS: AUC: 0.86 (95% CI 0.85-0.86) Secondary outcome post hoc: Composite outcome: (Cardiac arrest, Unplanned ICU admission, Mortality) NEWS: AUC: 0.88 (95% CI 0.88-0.88)
Primary outcome: Death Se 54.2 (cut-off 7) Sp 97.2 Primary outcome: Cardiac Arrest Se 22.2 Sp 97.0 Primary outcome: Unanticipated ICU Admission Se 37.4 Sp 97.1 Secondary outcome post hoc: Composite (Cardiac arrest, Unplanned ICU admission, Mortality) Se NEWS=7: 44.5% Sp NEWS=7: 97.4% Se 44 sets of MET criteria: ranged from 19.6% to 71.2% Sp 44 sets of MET criteria: ranged from 71.5% to 98.5%. For all outcomes, the position of the NEWS ROC curve was above and to the left of all MET criteria points, indicating better discrimination. Similarly, the positions of all MET criteria points were above and to the left of the NEWS efficiency curve, indicating higher workloads (trigger rates).
- -

Clinical & Cost-effectiveness of the National Early Warning System (NEWS): Systematic Review Update
Health Research Board – Collaboration in Ireland for Clinical Effectiveness Reviews
200
Table 7.1 Studies of the predictive value of EWSs scores (Q2 Effectiveness of EWSs interventions) continued Author, Study design
Setting, Country
A. Sample size and details B. Data collection C. EWSs included D. Model
AUC, outcome Sensitivity (Se), Specificity (Sp), outcome PPV, NPV, outcome Identifying optimal threshold cut-offs, outcome
Cohort studies (67)Tirotta (2017), Secondary analysis of a multicentre prospective study (The SNOOPI study)
31 Italian medical wards, in 14 different regions in Italy.
A. N=526 consecutive sepsis-diagnosed patients admitted to 31 different medical wards (dates not reported). B. secondary analysis of data collected for SNOOPI study. Patients followed-up from admission until discharge. Data collected at enrolment. C. MEWS D. AUC analysis
Primary outcome: In-hospital mortality MEWS AUC: 0.60 (95% CI
0.52-0.67)
Primary outcome: In-hospital mortality MEWS dichotomized as low risk vs. high risk (MEWS < 4 vs. >4): Se 35% (95% CI, 24–46%); Sp 83% (95% CI, 80–87%) MEWS: >1 Se: 0.65 (95% CI 0.53–0.75) Sp: 0.42 (95% CI 0.38–0.48) MEWS >2 Se 0.55 (95% CI 0.43–0.66) Sp: 0.59 (95% CI 0.54–0.63) MEWS >3: Se 0.38 (95% CI 0.28–0.50) Sp: 0.71 (CI 0.67–0.75) MEWS >4: Se: 0.35 (95% CI 0.24–0.46) Sp 0.83 (95% CI 0.80–0.87) MEWS>5: Se 0.23 (95% CI 0.15–0.34) Sp: 0.91 (95% CI 0.88–0.93) MEWS >6: Se 0.17 (95% CI 0.10–0.27) Sp: 0.95 (95% CI 0.93–0.97) MEWS >7: Se 0.10 (95% CI 0.049–0.20) Sp: 0.98 (95% CI
0.96–0.99)
Primary outcome: In-hospital mortality MEWS dichotomized as low risk vs high risk (MEWS < 4 vs.>4): NPV 88% (95% CI, 44–91%); PPV: 27% (95% CI, 18–37%) MEWS: >1: PPV 0.17 (95% CI 0.13–0.21) NPV: 0.87 (CI 0.82–0.92) MEWS >2: PPV: 0.19 (95% CI 0.14–0.25) NPV: 0.88 (95% CI 0.84–0.91) MEWS >3: PPV 0.19 (CI 0.13–0.26) NPV: 0.86 (CI 0.82–0.90) MEWS >4: PPV: 0.19 (95 CI 0.13–0.26) NPV 0.86 (95% CI 0.82–0.90) MEWS >5: PPV: 0.31 (95% CI 0.20–0.45) NPV: 0.87 (95% CI 0.84–0.90) MEWS>6: PPV: 0.37 (95% CI 0.22–0.55) NPV 0.87 (95% CI 0.83–0.90) MEWS >7: PPV: 0.42 (95% CI 0.21–0.66) NPV: 0.88 (95% CI 0.85–0.90)
-
(74)Yoo (2015),
Retrospective
cohort study.
University-affiliated urban, tertiary care hospital in South Korea
A. N=100/186 patients with sepsis/septic shock
who were screened or contacted by the MET Jan
2012 - Aug 2012.
B. Usefulness of the MEWS and blood lactate
(BLA) to predict ICU transfer was assessed by
reviewing retrospectively medical records of
enrolled patients and clinical, demographic and
lab data were collected.
C. MEWS, MEWS with BLA
D. Predictive ability using the C-statistic
Primary outcome: ICU
transfer
MEWS alone: AUC 0.82
MEWS with BLA: AUC 0.90
Primary outcome: ICU transfer
MEWS (Cut-off: 5.5):
Sen: 81.6%, Spec: 66.1%
MEWS with BLA (cut-off 3.05): Sen: 73.7%, Spec: 87%
- -

Clinical & Cost-effectiveness of the National Early Warning System (NEWS): Systematic Review Update
Health Research Board – Collaboration in Ireland for Clinical Effectiveness Reviews
201
Table 7.1 Studies of the predictive value of EWSs scores (Q2 Effectiveness of EWSs interventions) continued Author, Study design
Setting, Country
A. Sample size and details B. Data collection C. EWSs included D. Model
AUC, outcome Sensitivity (Se), Specificity (Sp), outcome
PPV, NPV, outcome
Identifying optimal threshold cut-offs, outcome
Case control studies (151)Yu (2014), Retrospective nested case control study.
2 hospitals, New York, USA.
A. N=328 cases (an infection ICD-9 code present) and N=328 matched controls. B. Calculated nine well-validated prediction scores for 328 cases and 328 matched controls. The cohort included non-ICU ward patients admitted to the hospital with a diagnosis of infection, and cases were patients in this cohort who experienced clinical deterioration, defined as requiring a critical care consult, ICU admission, or death. We then compared each prediction score’s ability, over the course of 72 hrs, to discriminate between cases and controls. All clinical variables were collected retrospectively from either an electronic database or paper medical records. C. REMS, SOFA, PIRO, ViEWS, SCS, MEDS, MEWS D. ROC analysis.
Secondary outcome clinical deterioration in a subpopulation: composite outcome (critical care consult, ICU admission, or death). 0- to 12-hour interval: REMS AUC 0.67 (95%CI 0.62, 0.71) SOFA AUC 0.78 (95% CI 0.74, 0.81) PIRO AUC 0.76 (95% 0.72-0.79), ViEWS AUC 0.75 (95% 0.71-0.79) SCS AUC 0.74 (95%CI 0.70-0.78) MEDS AUC 0.74 (95%CI 0.70-0.78) MEWS AUC 0.73 (95%CI 0.69-0.77) 12- to 72-hour interval: all scores, with the exception of MEDS (AUC=0.69 (95%CI 0.63-0.74) at 24 to 48 hrs and AUC=0.71(95%CI 0.64-0.78) at 48-72 hrs), no longer performed with acceptable discrimination for mortality (AUC <0.70).
- - -
(122)Churpek (2012), Retrospective nested case-control study.
Academic tertiary care hospital, USA.
A. N=88 cases (cardiac arrest) matched to N=352 controls in medical and surgical wards between Nov 2008 - Jan 2011. B. Cases were consecutive adults who experienced a cardiac arrest identified from a prospective register. Controls were selected from the same ward and matched using a random number generator. C. VS EWS D. Created ROC curves, calculated AUC using the trapezoidal rule.
Primary outcome: Cardiac arrest RR max AUC 0.72 (0.65-0.78) min AUC 0.56 (0.49-0.62) HR max AUC 0.68 (0.61-0.74) min AUC 0.56 (0.49-0.63) DBP max AUC 0.53 (0.45-0.60) min AUC 0.60 (0.53-0.67) SBP max AUC 0.55 (0.48-0.62) min AUC 0.58 (0.50-0.65) Pulse pressure index max AUC 0.61 (0.54-0.68) min AUC 0.58 (0.50-0.65) Temp max AUC: 0.48(0.42-0.56) min AUC: 0.55 (0.48-0.63) SpO2 min AUC: 0.54 (0.47-0.61) MEWS: max AUC 0.77 (0.71-0.82)
Primary outcome: Cardiac arrest Max RR >20: Se 67 (56-77) Sp 70 (51-80) Max HR >110: Se 44 (29-57) Sp 80 (70-88) Max pulse >0.55: Se 49 (38-61) Sp 67 (56-80) Min DBP <50: Se 45 (33-55), Sp 77 (57-84) Max MEWS >2: Se 69 (61-83), Sp 69 (59-83)
- -

Clinical & Cost-effectiveness of the National Early Warning System (NEWS): Systematic Review Update
Health Research Board – Collaboration in Ireland for Clinical Effectiveness Reviews
202
Table 7.1 Studies of the predictive value of EWSs scores (Q2 Effectiveness of EWSs interventions) continued Author, Study design
Setting, Country
A. Sample size and details B. Data collection C. EWSs included D. Model
AUC, outcome Sensitivity (Se), Specificity (Sp), outcome
PPV, NPV, outcome
Identifying optimal threshold cut-offs, outcome
Case control studies (126)Kirkland (2013), Retrospective case control study.
1157-bed, academic, tertiary referral hospital, Minnesota, USA.
A. Derivation cohort n=1,882 eligible patients. Among them, 68 suffered events; these patients were matched to up to 3 control patients, 267 patients as the derivation group. Validation cohort n=1,946 eligible patients, 77 of whom suffered events, with 1869 control patients between 2008 - 2009. B. A time-dependent data set was developed to model looking forward in time for a serious clinical event. Lead times were divided into 2 to 12 hrs, 12 to 24 hrs, or 24 to 48 hrs prior to an event. The single-entry model looked at each set of clinical variables individually. Serial 24 hrs looked at trends of each clinical variable over 24 hrs. Serial 7 days looked at trends of each clinical variable over 7 days. C. algorithm based EWS D. Logistic regression using the generalized estimating equations (GEE) approach.
Primary outcome: Future event (defined as an unplanned ICU transfer, unexpected death, or RRT call) Future event 2-12 hrs: Single entry: 0.68 Serial 24-hrs: 0.71 Serial 7-days: 0.66 Future event 12-24 hrs: Single entry: 0.67 Serial 24-hrs: 0.65 Serial 7-days: 0.73 Future event 24-48 hrs: Single entry: 0.63 Serial 24-hrs: 0.65 Serial 7-days: 0.66 AUC validation group: 0.71 (0.68-0.74).
- - -
(147)Escobar (2012), Retrospective case control study
14 hospitals in Northern California, USA.
A.N=4,036 events and N=39,782 controls admitted between Nov 2006 and Dec 2009 to general medical and surgical wards. B. Unit of analysis was a 12-hour patient shift. Shifts where patients experienced an unplanned ICU transfer were ‘event shifts’ and shifts without a transfer were comparison shifts. Electronic medical health records were used to split the dataset 50-50 into development and validation datasets to develop the model. MEWS was retrospectively applied for comparison. C. algorithm based EWS, MEWS D. Logistic regression.
Primary outcome: unplanned transfer to the ICU All diagnoses: MEWS derivation AUC: 0.71 (95% CI, 0.70–0.72) MEWS validation AUC: 0.70 (95% CI 0.69–0.71) Electronic EWS derivation AUC: 0.85 (0.83–0.86) Electronic EWS validation AUC: 0.78 (0.75–0.80) Primary outcome: unplanned transfer to the ICU 1 randomly selected observation per patient: MEWS derivation AUC: 0.71 (0.69–0.73) MEWS validation AUC: 0.70 (0.69–0.71) Electronic EWS derivation: 0.86 (0.84–0.88) Electronic EWS validation: 0.78 (0.76–0.80)
- - -
Key: AAU: Acute assessment unit; PARS: Patient at risk score; ICU: Intensive care unit; MEWS: Modified early warning score; SOFA: Sequential organ failure assessment; APACHE: Acute physiology and chronic health evaluation; AUC: Area under the receiver operating curve; PPV: Positive predictive value; NPV: Negative predictive value; TPR: True positive rate; NEWS: National early warning score; DTEWS: Decision tree-EWS; RED: Resuscitation events or death; CPA: cardiopulmonary arrests; ARC: Acute respiratory compromise; MET: Medical emergency team; qSOFA: quick-SOFA; SIRS: Systemic inflammatory response system; AHF: Acute heart failure; SBP: Systolic blood pressure; RR: Respiratory rate; ViEWS: VitalPAC EWS; RRT/S: Rapid response team/system; MERIT: Medical Early Response Intervention and Therapy; SEWS: Standardised
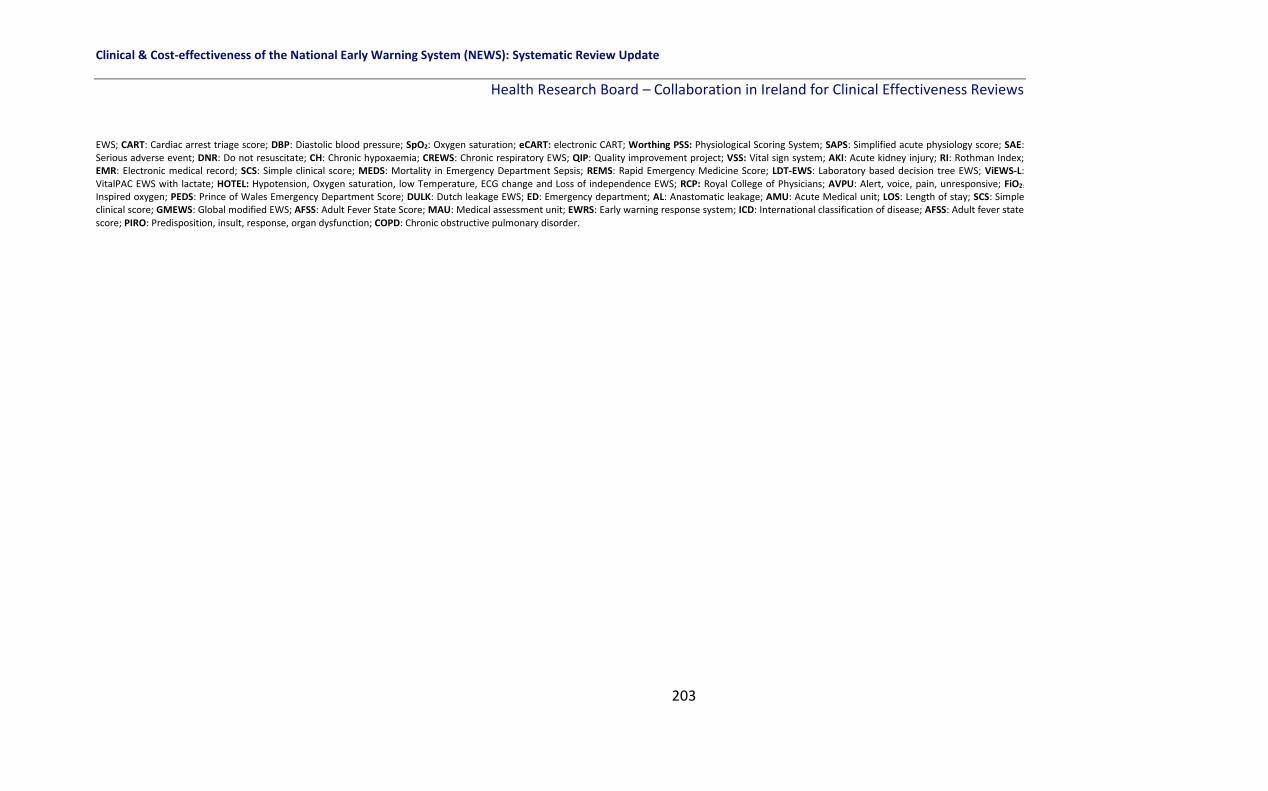
Clinical & Cost-effectiveness of the National Early Warning System (NEWS): Systematic Review Update
Health Research Board – Collaboration in Ireland for Clinical Effectiveness Reviews
203
EWS; CART: Cardiac arrest triage score; DBP: Diastolic blood pressure; SpO2: Oxygen saturation; eCART: electronic CART; Worthing PSS: Physiological Scoring System; SAPS: Simplified acute physiology score; SAE: Serious adverse event; DNR: Do not resuscitate; CH: Chronic hypoxaemia; CREWS: Chronic respiratory EWS; QIP: Quality improvement project; VSS: Vital sign system; AKI: Acute kidney injury; RI: Rothman Index; EMR: Electronic medical record; SCS: Simple clinical score; MEDS: Mortality in Emergency Department Sepsis; REMS: Rapid Emergency Medicine Score; LDT-EWS: Laboratory based decision tree EWS; ViEWS-L: VitalPAC EWS with lactate; HOTEL: Hypotension, Oxygen saturation, low Temperature, ECG change and Loss of independence EWS; RCP: Royal College of Physicians; AVPU: Alert, voice, pain, unresponsive; FiO2:
Inspired oxygen; PEDS: Prince of Wales Emergency Department Score; DULK: Dutch leakage EWS; ED: Emergency department; AL: Anastomatic leakage; AMU: Acute Medical unit; LOS: Length of stay; SCS: Simple clinical score; GMEWS: Global modified EWS; AFSS: Adult Fever State Score; MAU: Medical assessment unit; EWRS: Early warning response system; ICD: International classification of disease; AFSS: Adult fever state score; PIRO: Predisposition, insult, response, organ dysfunction; COPD: Chronic obstructive pulmonary disorder.

Clinical & Cost-effectiveness of the National Early Warning System (NEWS): Systematic Review Update
Health Research Board – Collaboration in Ireland for Clinical Effectiveness Reviews
204
7.6 Methodological quality
The QUADAS II tool(29) was used to assess the risk of bias in the 68 included studies which
assessed the predictive ability of EWSs.(8, 13, 40, 41, 49, 54-56, 58, 60, 61, 64, 65, 67, 70, 73-78, 83-87, 89, 90, 92-94,
100-106, 110-113, 116, 118, 120-123, 126, 138-152, 154-156, 158) This included four risk of bias domains (patient
selection, index test, reference standard and flow and timing) and three applicability
domains (patient selection, index test and reference standard). Overall, the studies were
deemed to have a low risk of bias across the seven domains (Figure 7.1).
Figure 7.1 Risk of bias summary of the predictive studies
Risk of bias domain: Patient selection
In total, 55 of the 68 studies had a low risk of bias for patient selection (i.e. a consecutive or
random sample was used, a case-control design was avoided and the study avoided
inappropriate exclusions).(8, 13, 40, 41, 54, 60, 61, 65, 67, 73-78, 83-87, 89, 90, 92-94, 100-106, 111-113, 116, 118, 120, 121,
123, 138-150, 152, 154-156) Two studies had a high risk of bias for patient selection,(87, 151) due to
using a case-control design and not including a consecutive or random sample. In total, 12
studies had an unclear risk of bias for patient selection, (13, 49, 56, 58, 64, 70, 76, 110, 122, 126, 158) as it
was not clear exactly how the sample were selected or not reported.
Risk of bias domain: Index test
In total, 42 of the 68 studies had a low risk of bias for the index test (i.e. a description of the
index test and how it was conducted was provided; a threshold was specified if one was
Clinical & Cost-effectiveness of the National Early Warning System (NEWS): Systematic Review Update
Health Research Board – Collaboration in Ireland for Clinical Effectiveness Reviews
205
used; and the conduct or interpretation of the index test was deemed not to have been
biased).(40, 49, 54-56, 60, 61, 64, 67, 70, 74, 77, 78, 83-87, 89, 90, 94, 100, 106, 110-113, 118, 122, 123, 139-143, 149, 150, 154-156)
Two studies had a high risk of bias for the index test.(76, 102) One developed a decision tree
EWS (DTEWS) using a database of vital signs and known patient outcomes which could
introduce bias.(102) In the other study the results were likely interpreted with the knowledge
of the reference standard results and no threshold cut-off was specified.(76) There were 24
studies with an unclear risk of bias for the index test,(8, 13, 41, 58, 65, 73, 75, 92, 93, 101, 103-105, 116, 120,
126, 138, 144, 146-148, 151, 152, 158) where it was not clear or not reported on how the index test was
conducted.
Risk of bias domain: Reference standard
In total, 45 of the 68 studies had a low risk of bias for the reference standard (i.e. the
reference standard and how it was conducted and interpreted was described; the reference
standard was likely to correctly classify the target condition; and it was interpreted without
the knowledge of the index test results).(8, 13, 40, 41, 54-56, 60, 64, 67, 70, 74, 78, 84-87, 89, 90, 94, 101, 102, 104,
105, 110-113, 118, 120-122, 126, 140-146, 149, 150, 154-156) No study had a high risk of bias for the reference
test and 23 studies had an unclear risk of bias,(49, 58, 61, 65, 73, 75-77, 83, 92, 93, 100, 103, 106, 116, 123, 138,
139, 147, 148, 151, 152, 158) mainly due to the reference standard not being described or unclear
details reported. In six studies(58, 75, 100, 116, 138, 158) there was no reference standard (and so
this risk of bias domain was not applicable).
Risk of bias domain: Flow and timing
In total, 57 of the 68 studies had a low risk of bias for flow and timing (i.e. any patient who
did not receive the index or test or reference standard or was excluded from the analysis
was described; time intervals between the index test and reference standard were
described and the patient flow was unlikely to introduce bias).(8, 13, 40, 41, 49, 55, 56, 58, 60, 64, 65, 67,
70, 73-78, 83, 84, 89, 90, 92-94, 100-102, 105, 106, 110-113, 116, 118, 120-123, 126, 138, 140-151, 156, 158) Four studies had a
high risk of bias for flow and timing as the reasons some patients were excluded from the

Clinical & Cost-effectiveness of the National Early Warning System (NEWS): Systematic Review Update
Health Research Board – Collaboration in Ireland for Clinical Effectiveness Reviews
206
analysis were not described.(85-87, 103) Seven studies had an unclear risk of bias for flow and
timing as they did not report clearly on patients who received the index and reference
standard and numbers excluded from the analysis, or the time intervals between both.(54, 61,
104, 139, 152, 154, 155)
Applicability domain: Patient selection
Forty-nine of the 68 studies had a low risk of bias for patient selection (i.e. they included
patients who matched the review question).(8, 40, 41, 49, 70, 75-78, 83, 84, 90, 92-94, 101, 102, 104-106, 110-113,
116, 118, 120-123, 126, 139-152, 154-156, 158) Fourteen studies had a high risk of bias for patient
selection.(55, 56, 60, 64, 65, 67, 73, 74, 85-87, 89, 100, 103) These studies included selective subpopulations
deemed not completely generalisable to the review (oncology patients, heart failure
patients, sepsis or shock patients, critically ill patients in Korea, patients with acute
pancreatitis, patients with an ICD-9 diagnosis of acute fever and patients with acute
respiratory failure). Five studies had an unclear risk of bias for the applicability of the
patients selected as details on the patients included were not reported.(13, 54, 58, 61, 138)
Applicability domain: Index test
Forty-nine of the 68 studies had a low risk of bias in terms of the index test and its
applicability to this review (i.e. there was no concern that the index test, its conduct, or
interpretation differ from the review question).(8, 40, 49, 54, 56, 58, 60, 64, 65, 67, 70, 74-78, 84, 87, 89, 90, 94,
100, 101, 103, 105, 106, 110-113, 118, 121-123, 126, 138, 140, 142-146, 149-151, 154-156, 158) Five studies had a high risk
of bias.(55, 85, 86, 102, 120) One study developed a decision tree EWS using a database of vital
signs and known patient outcomes; and in four studies (one of which used electronic
medical record-derived models) it was unclear whether the test results were interpreted
without knowledge of the reference standard results. Fourteen studies were classified as
having an unclear risk of bias as it was not clear whether the index test was applicable to the
NEWS or EWS in this review (i.e. some studies used automated prediction models; others
included additional parameters such as co-morbidities, biochemical values and age; others

Clinical & Cost-effectiveness of the National Early Warning System (NEWS): Systematic Review Update
Health Research Board – Collaboration in Ireland for Clinical Effectiveness Reviews
207
included EWS tools for specific sub-populations [e.g. CREWS]; others included no vital sign
parameters, only lab test results as predictors; others were designed for use in different
settings [e.g. the ED], (13, 41, 61, 73, 83, 92, 93, 104, 116, 139, 141, 147, 148, 152).
Applicability domain: Reference standard
Fifty-four of the 68 studies had a low risk of bias for the applicability of the reference
standard (i.e. there was no concern that the target condition as defined by the reference
standard does not match the review question).(8, 13, 40, 41, 49, 54, 60, 64, 65, 67, 70, 73, 74, 76-78, 84-87, 89, 90,
92-94, 101-105, 110-113, 118, 120, 121, 123, 126, 140-147, 149-152, 154-156) Two studies had a high risk of bias as
they included a specific subpopulation of Chinese patients with acute fever or shock.(55, 56)
Twelve studies(58, 61, 75, 83, 100, 106, 116, 122, 138, 139, 148, 158) had an unclear risk of bias in terms of
the applicability of the reference standard to this review question mainly due to the
reference standard not being described or unclear details reported. In six studies (58, 75, 100,
116, 138, 158) there was no reference standard (and so this risk of bias domain was not
applicable), (Figure 7.2).

Clinical & Cost-effectiveness of the National Early Warning System (NEWS): Systematic Review Update
Health Research Board – Collaboration in Ireland for Clinical Effectiveness Reviews
208
Figure 7.2 Risk of bias graph for studies of EWS interventions and deterioration in adults in
acute health care settings

Clinical & Cost-effectiveness of the National Early Warning System (NEWS): Systematic Review Update
Health Research Board – Collaboration in Ireland for Clinical Effectiveness Reviews
209
7.7 Certainty of the evidence
We assessed the overall certainty of the evidence where appropriate for question 2 of the
review (How predictive are the different EWSs in terms of improving key patient outcomes in
adult (non-pregnant) patients in acute healthcare setting?). A narrative summary of findings
table was created using GRADEpro software for the following primary outcomes: Mortality,
cardiac arrest, LOS, and transfer or admission to the ICU.
Overall the certainty of the evidence is ‘very low’ owing to a high risk of bias due to the
various study designs with very few robust designs such as RCTs, a high risk of confounding
in the observational studies, small sample sizes and inconsistency in the results.
Inconsistency related to the heterogeneous nature of the EWS interventions applied as well
as the variety of single centre settings in various countries where the findings may not be
applicable to other health care settings (Table 7.2).
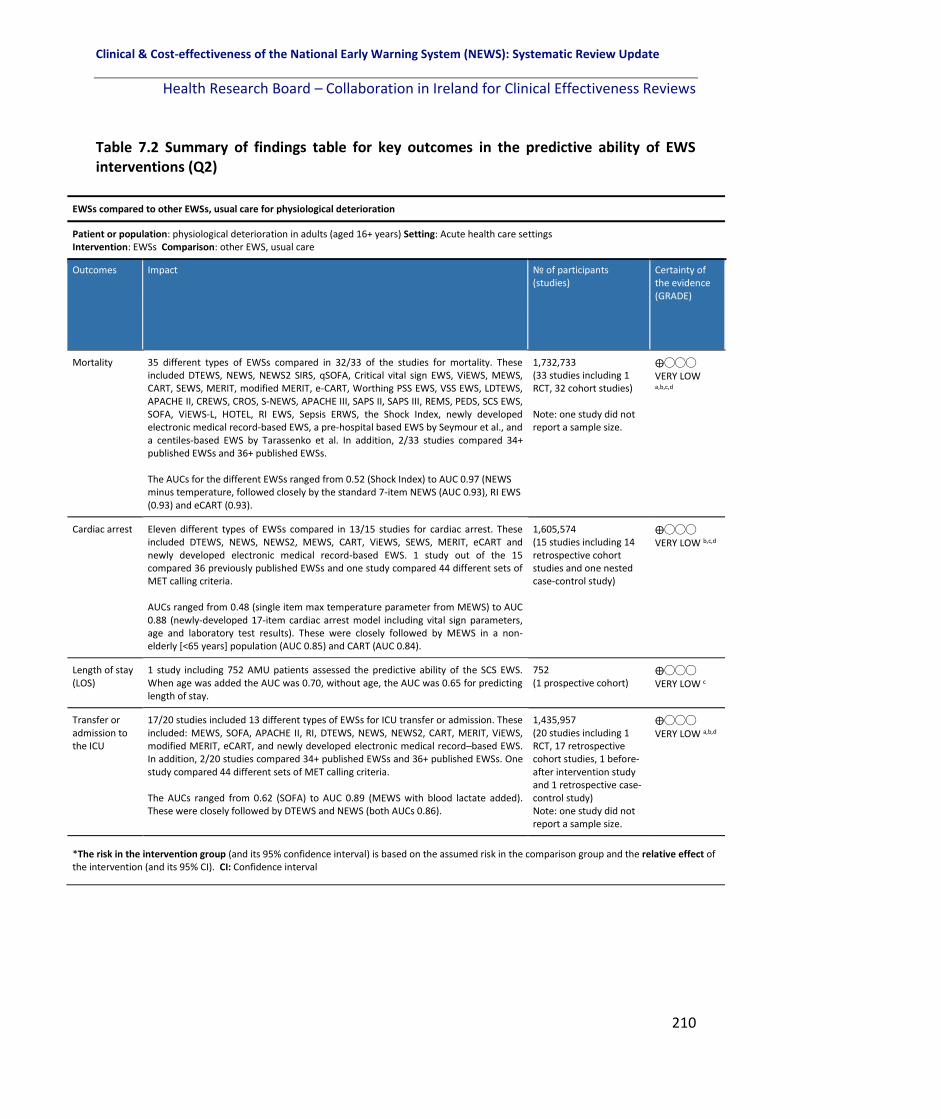
Clinical & Cost-effectiveness of the National Early Warning System (NEWS): Systematic Review Update
Health Research Board – Collaboration in Ireland for Clinical Effectiveness Reviews
210
Table 7.2 Summary of findings table for key outcomes in the predictive ability of EWS interventions (Q2)
EWSs compared to other EWSs, usual care for physiological deterioration
Patient or population: physiological deterioration in adults (aged 16+ years) Setting: Acute health care settings Intervention: EWSs Comparison: other EWS, usual care
Outcomes Impact № of participants (studies)
Certainty of the evidence (GRADE)
Mortality 35 different types of EWSs compared in 32/33 of the studies for mortality. These included DTEWS, NEWS, NEWS2 SIRS, qSOFA, Critical vital sign EWS, ViEWS, MEWS, CART, SEWS, MERIT, modified MERIT, e-CART, Worthing PSS EWS, VSS EWS, LDTEWS, APACHE II, CREWS, CROS, S-NEWS, APACHE III, SAPS II, SAPS III, REMS, PEDS, SCS EWS, SOFA, ViEWS-L, HOTEL, RI EWS, Sepsis ERWS, the Shock Index, newly developed electronic medical record-based EWS, a pre-hospital based EWS by Seymour et al., and a centiles-based EWS by Tarassenko et al. In addition, 2/33 studies compared 34+ published EWSs and 36+ published EWSs. The AUCs for the different EWSs ranged from 0.52 (Shock Index) to AUC 0.97 (NEWS minus temperature, followed closely by the standard 7-item NEWS (AUC 0.93), RI EWS (0.93) and eCART (0.93).
1,732,733 (33 studies including 1 RCT, 32 cohort studies) Note: one study did not report a sample size.
⨁◯◯◯ VERY LOW a,b,c,d
Cardiac arrest Eleven different types of EWSs compared in 13/15 studies for cardiac arrest. These included DTEWS, NEWS, NEWS2, MEWS, CART, ViEWS, SEWS, MERIT, eCART and newly developed electronic medical record-based EWS. 1 study out of the 15 compared 36 previously published EWSs and one study compared 44 different sets of MET calling criteria. AUCs ranged from 0.48 (single item max temperature parameter from MEWS) to AUC 0.88 (newly-developed 17-item cardiac arrest model including vital sign parameters, age and laboratory test results). These were closely followed by MEWS in a non-elderly [<65 years] population (AUC 0.85) and CART (AUC 0.84).
1,605,574 (15 studies including 14 retrospective cohort studies and one nested case-control study)
⨁◯◯◯ VERY LOW b,c,d
Length of stay (LOS)
1 study including 752 AMU patients assessed the predictive ability of the SCS EWS. When age was added the AUC was 0.70, without age, the AUC was 0.65 for predicting length of stay.
752 (1 prospective cohort)
⨁◯◯◯ VERY LOW c
Transfer or admission to the ICU
17/20 studies included 13 different types of EWSs for ICU transfer or admission. These included: MEWS, SOFA, APACHE II, RI, DTEWS, NEWS, NEWS2, CART, MERIT, ViEWS, modified MERIT, eCART, and newly developed electronic medical record–based EWS. In addition, 2/20 studies compared 34+ published EWSs and 36+ published EWSs. One study compared 44 different sets of MET calling criteria. The AUCs ranged from 0.62 (SOFA) to AUC 0.89 (MEWS with blood lactate added). These were closely followed by DTEWS and NEWS (both AUCs 0.86).
1,435,957 (20 studies including 1 RCT, 17 retrospective cohort studies, 1 before- after intervention study and 1 retrospective case-control study) Note: one study did not report a sample size.
⨁◯◯◯ VERY LOW a,b,d
*The risk in the intervention group (and its 95% confidence interval) is based on the assumed risk in the comparison group and the relative effect of the intervention (and its 95% CI). CI: Confidence interval

Clinical & Cost-effectiveness of the National Early Warning System (NEWS): Systematic Review Update
Health Research Board – Collaboration in Ireland for Clinical Effectiveness Reviews
211
EWSs compared to other EWSs, usual care for physiological deterioration
Patient or population: physiological deterioration in adults (aged 16+ years) Setting: Acute health care settings Intervention: EWSs Comparison: other EWS, usual care
Outcomes Impact № of participants (studies)
Certainty of the evidence (GRADE)
GRADE Working Group grades of evidence High certainty: We are very confident that the true effect lies close to that of the estimate of the effect. Moderate certainty: We are moderately confident in the effect estimate: The true effect is likely to be close to the estimate of the effect, but there is a possibility that it is substantially different. Low certainty: Our confidence in the effect estimate is limited: The true effect may be substantially different from the estimate of the effect. Very low certainty: We have very little confidence in the effect estimate: The true effect is likely to be substantially different from the estimate of effect .
7.8 Discussion
The predictive ability of the various EWSs included differs across studies and as a result the
findings for the primary outcomes for this review are inconsistent. Thirty-three studies
examined the ability of EWSs to predict mortality comparing one or more of 35 different
named EWSs. Given the different EWSs included, the AUCs ranged from 0.52 (Shock Index)
to AUC 0.97 (NEWS minus temperature), followed closely by the standard 7-item NEWS
(AUC 0.93), RI EWS (0.93) and eCART (0.93), in a total population of 1,732,733 patients.
Fifteen studies examined the ability of EWSs to predict cardiac arrest, totalling 1,605,574
patients. AUCs ranged from 0.48 (single item max temperature parameter from MEWS) to
AUC 0.88 (newly-developed 17-item cardiac arrest model including vital sign parameters,
age and laboratory test results). These were closely followed by MEWS in a non-elderly (<65
years) population (AUC 0.85) and CART (AUC 0.84).
One study examined the ability of an EWS to predict LOS including 752 AMU patients and
assessed the predictive ability of the SCS EWS. When age was added the AUC was 0.70,
without age, the AUC was 0.65 for predicting LOS.
Explanations a. High risk of bias in the RCTs and nRCTs , b. Retrospective and prospective cohort studies and case control studies - risk of bias and confounding c. Small sample size and low event rate d. Inconsistency due to the heterogeneous EWSs predictive models included, varying EWSs (e.g. NEWS, MEWS, modified EWS, etc.) and varying patient populations

Clinical & Cost-effectiveness of the National Early Warning System (NEWS): Systematic Review Update
Health Research Board – Collaboration in Ireland for Clinical Effectiveness Reviews
212
Twenty studies examined the ability of EWSs to predict ICU admission or transfer. The AUCs
ranged from 0.62 (SOFA) to AUC 0.89 (MEWS with blood lactate added). These were closely
followed by DTEWS and NEWS (both AUCs 0.86).
The lack of high quality evidence to evaluate the predictive ability of EWS interventions on
patient outcomes is due to a number of factors. These include small sample size in some
studies and low event rates; a wide variation in the EWS interventions used and a wide
variation in the definition of the outcomes from study to study (for example mortality may
have included death within 24 hours in one study and 30-day mortality in another). The
population included also varied.
Future research is needed to address limitations highlighted in this review. Ideally study
designs of a more rigorous methodological quality are needed, preferably adequately
powered prospective cohort studies or RCTs of alternative scores and systems. A
standardised approach to the EWS interventions used and the outcomes included are
warranted.
7.9 Conclusion
The findings from the studies included that examine the predictive ability of EWS
interventions and their effect on healthcare staff and on improving the detection and
management of physiological deterioration in adult patients in acute settings is of poor
quality overall. The findings are contrasting owing to the heterogeneous nature of the
interventions included making it difficult to draw definitive conclusions to inform policy and
clinical practice.

Clinical & Cost-effectiveness of the National Early Warning System (NEWS): Systematic Review Update
Health Research Board – Collaboration in Ireland for Clinical Effectiveness Reviews
213

Clinical & Cost-effectiveness of the National Early Warning System (NEWS): Systematic Review Update
Health Research Board – Collaboration in Ireland for Clinical Effectiveness Reviews
214
8 Results: The impact of emergency response system interventions on patient outcomes and resource utilisation for the detection of physiological deterioration in adult (non-pregnant) patients in acute health care settings.
8.1 Chapter overview
This chapter in the systematic review update focusses on the literature pertinent to
question 2 of the review. “How effective are the different EWSs in terms of improving key
patient outcomes in adult (non-pregnant) patients in acute health care settings?” This
chapter specifically focusses on the efferent limb (i.e. emergency response systems, which
are also referred to as Rapid Response Systems [RRS], Rapid Response Teams [RRT], Medical
Emergency Teams [MET] or Critical Care Outreach Teams [CCOT]) and their effectiveness in
terms of the primary outcomes (mortality, cardiac arrest, length of stay, transfer or
admission to the ICU), secondary outcomes (clinical deterioration in sub-populations,
PROMs [validated tools]) and outcomes identified post-hoc (including significant adverse
events [SAEs], resources utilisation and objective patient-related positive and negative
outcomes).
8.2 Overview of studies focussing on the effectiveness of emergency
response systems
There were 32 studies which investigated the effectiveness of emergency response
systems.(38, 39, 45, 46, 50-53, 62, 63, 71, 72, 80-82, 95, 96, 98, 115, 117, 119, 124, 125, 127-130, 133-136, 157) These
included two interrupted time series designs (ITS),(115, 133) 23 uncontrolled before-after
observational studies,(38, 39, 45, 46, 50, 51, 53, 62, 63, 71, 72, 80-82, 95, 119, 124, 125, 128, 129, 134, 135, 157) and
seven observational cohort studies.(52, 96, 98, 117, 127, 130, 136) All studies were set in hospitals.
Sample size ranged from 140 patients(117) to 471,062 patients(134) and was not reported in
one study.(129)
Clinical & Cost-effectiveness of the National Early Warning System (NEWS): Systematic Review Update
Health Research Board – Collaboration in Ireland for Clinical Effectiveness Reviews
215
8.3 Overview of emergency response systems included
The emergency response systems included varied from study to study in their name or
terminology, team composition, escalation plan and response times. This review categorises
them as either nurse-led (n=15 studies) or doctor-led (n=16 studies) emergency response
systems, and in one study, where multiple hospitals were included, the type of emergency
response system varied.
8.3.1 Doctor-led emergency response systems
There were 16 studies which reported on doctor-led emergency response systems (Table
8.1), these are described below in terms of team composition, triggering of teams and
response times where reported.
Three studies(71, 125, 129) considered an intensivist-led RRT with an ICU fellow or registrar,
critical care nurse and a respiratory therapist. For Al-Qahtani et al.,(71) the RRT could be
triggered by any HCP when any of the eight triggering criteria (which included vital sign
parameters) were met or when staff were concerned. A response time of 15 minutes was
reported for the RRT to respond to the deteriorating patient. For Moriarty et al.,(129) any HCP
could activate the RRT based on staff concern or physiologically-based criteria. The response
time was not reported in this study. In Karpman et al.,(125) the RRT worked in one of the two
study ICUs, with calling criteria including derangements in four specific vital signs, staff
concern, acute chest pain, and change in conscious state or new onset of symptoms
suggestive of stroke. No optimal response time for the RRT was reported in the study.
Karvellas et al.,(52) investigated the effect of an intensivist-led MET (between 8am-4pm
Monday to Friday) and a MET outside of these hours which was led by either the resident,
nurse or respiratory therapist, who consulted with the on-call consultant intensivist. Any
HCP could activate the MET when any of the calling criteria were present including
derangements in vital sign parameters, change in level of consciousness or staff concern. A
response was expected within 15 minutes by the MET in this study. Moon et al.,(95) reported

Clinical & Cost-effectiveness of the National Early Warning System (NEWS): Systematic Review Update
Health Research Board – Collaboration in Ireland for Clinical Effectiveness Reviews
216
on a Critical Care Outreach Service (CCOS) including a consultant intensivist and two senior
ICU nurses. The required frequency of measurement of vital signs was increased with higher
MEWS scores. The on-call Senior House Officer (SHO), Specialist Registrar (SpR) and team
consultant had 30 minutes to respond to the various triggers (different MEWS scores).
Beitler at al.,(119) described a RRT led by a senior medical house officer and the team
included an ICU nurse, respiratory therapist and a patient transporter. Clinical judgement or
derangements in individual vital signs were triggers for the RRT, which was activated via
hospital pager to respond immediately to the bedside.
The Rapid Response System (RRS) team described by Kansal et al.,(38) consisted of an ICU
senior resident medical officer, a designated ICU nurse and medical registrar supervised by
an ICU consultant or ICU senior registrar. There was a two tier escalation system with early
and late calling criteria (Table 8.1), where early warning criteria triggered the first tier of
clinical review by the ward team, which must be attended to within 30 minutes. Delayed
clinical review, progression to or occurrence of late warning criteria at any time triggered
the second tier escalation, a RRT call.
The emergency response team reported on in Mathukia et al.,(128) included a hospitalist, a
third year medical ICU resident, on-call first and second-year medical residents, and a
surgical resident on-call, in addition to a respiratory therapist and an ICU nurse. A MEWS
score of six or greater triggered a call to the RRT immediately with transfer to a higher level
of care. No response time was reported.
Rothberg et al.,(133) described a hospitalist-led MET comprised of a critical care nurse, a
respiratory therapist, intravenous therapist and the patient’s physician (either attending or
resident). In the hospital, there was a separate code team for cardiac arrests. The MET
members carried pagers which were triggered by one or more physiological parameters or
staff concern. The response time for the MET was not reported. The RRT based in Iran in the
before-after study by Sabahi et al.,(63) included one doctor, one senior ICU nurse and one
Clinical & Cost-effectiveness of the National Early Warning System (NEWS): Systematic Review Update
Health Research Board – Collaboration in Ireland for Clinical Effectiveness Reviews
217
staff nurse. The criteria for RRT activation was displayed prominently in each ward and
included airway, breathing, circulation, neurologic changes, and other parameters including
chest pain and restlessness. The RRT was activated by a pager call and by a public
announcement internal communication call. The response time was not reported.
Segon et al.,(135) reported on a RRT which was led by an admitting senior resident in the ICU,
an ICU nurse, and a respiratory therapist. The criteria for activation included vital sign
parameters, changes in breathing pattern, urine output, seizures, change in mental status
and staff or family concern. No specific response time for the RRT was reported, however all
activations of the RRT were recorded in a log and reviewed in monthly rapid response
meetings.
Two studies by Simmes et al.,(81, 82) described a physician-led RRS comprised of a critical care
physician and a critical care nurse and was accessible 24/7. The RRS included a two-tier MET
calling protocol. In the first, tier nurses had to call the ward physician immediately if one of
the EWS criteria were met (included respiratory rate[RR], Oxygen saturation [SpO2], heart
rate [HR], eye, motor, verbal [EMV] score or staff concern) and the physician was expected
to respond within 10 minutes. In the second tier, the ward physician activated the MET
immediately if a serious situation existed or if the patient did not stabilise after the initial
intervention. Gonçales et al.,(50) describe a ‘code yellow’ RRT led by an ICU physician.
Triggers included worsening in vigilance and cardiac, neurological and respiratory
monitoring parameters, or staff concern. The physician had five minutes to respond.
Joshi et al.,(45) reported on a two-tier RRS, which consisted of a pre-call response team
(general medicine registrar and an ICU nurse) and for code blue events additional members
were included (an anaesthesia registrar/emergency registrar or their consultants from the
pre-call team and several other specialist nurses and ward persons/orderlies). The criteria
for escalation was based on the Q-ADDS EWS call criteria being met for the pre-response
team but immediate escalation of care was expected for code blue events (cardiorespiratory

Clinical & Cost-effectiveness of the National Early Warning System (NEWS): Systematic Review Update
Health Research Board – Collaboration in Ireland for Clinical Effectiveness Reviews
218
arrest, threatened airway or altered conscious state). An optimal response time for the RRT
was not reported.
Jung et al.,(62) described a 24/7 intensivist–led RRT comprised of an ICU resident and either
an ICU fellow or an attending physician. An ICU nurse could be part of the team if requested
by the attending physician. Criteria for escalation included derangements in specific vital
signs as well as respiratory distress in a tracheotomised patient, respiratory arrest, coma,
sudden change in consciousness or seizure. The expected response time for a code blue
event was five minutes and 20 minutes in other situations (Table 8.1).
8.3.2 Nurse-led emergency response system
In total, 15 studies reported on nurse-led emergency response systems, which are described
below.
Davis et al.,(124) described a RRT with a dedicated respiratory therapist and critical care nurse
and a configuration where unit charge nurses only respond in their own unit. The RRT was
triggered by derangements in a number of vital signs, chest pain, acute blood loss, laboured
breathing, an acute decrease in mental status or staff or family concern. A response time to
escalation for help was not reported.
Albert et al.,(117) described a nurse-led RRT which included an ICU resident, medical ICU
charge nurse and a respiratory therapist. A MEWS score of greater than or equal to three
was the trigger for referral to the RRT and no response time for the RRT was reported.
Hayani et al.,(51) described the Rapid Assessment of Critical Events (RACE) emergency
response team, led by a critical care nurse including a respiratory therapist and medical
doctor. A staff intensivist was available during daytime working hours and a senior resident
or fellow at night and on weekends. The RACE team could be initiated by any HCP using
specific criteria including threatened airway, vital sign derangements, GCS level of
consciousness decreased, staff concern or failure to respond to therapy. The RACE team

Clinical & Cost-effectiveness of the National Early Warning System (NEWS): Systematic Review Update
Health Research Board – Collaboration in Ireland for Clinical Effectiveness Reviews
219
responded to all urgent calls and provided follow-up care for at least two days after
discharge from the ICU.
Howell et al.,(115) described a RRT made up of the patients’ usual care providers (the primary
nurse, primary house officer, the floor’s senior nurse, and a respiratory therapist for
patients with respiratory-based triggers). The RRS was triggered by the primary nurse who
paged all of the team members when any of the following criteria were met: derangements
in vital sign parameters, change in conscious state, urine output or marked nursing concern.
The team had to verbally discuss the case with the attending physician within one hour of
the event.
Kim et al.,(72) investigated the effectiveness of a part-time RRS during operating and non-
operating hours. The RRS operated from 7am to 10pm on weekdays and from 7am to 12pm
on Saturdays. The RRS was led by four experienced nurses, a MDT of 12 doctors and during
weekday hours one pulmonologist (an intensivist from the ICU) and two RRS nurses were on
duty. From 6-10pm weekdays and on Saturdays only, one of 12 staff members (rotating) and
two RRS nurses were on RRS duty. The electronic medical record system included ten
triggering variables and the response time for the RRS team was not reported.
Kollef et al.,(127) reported on a RRS of a registered nurse, a second or third year internal
medicine resident and a respiratory therapist, where from 2012 onwards the RRS team
nurse member was established as a dedicated position without other clinical
responsibilities. The RRS was activated by nursing staff between 2006 and 2008 and in 2009
could be triggered by real time clinical deterioration alerts as well as by nursing staff based
on derangements in a number of vital sign parameters. The RRS nurse carried a pager to
which alerts were sent and had a 20 minute response time.
Ludikhuize et al.,(80) described a RRT comprised of an ICU nurse and a physician who was
trained in fundamental critical care. A MEWS of greater than or equal to three was the
trigger for escalation where the nurse was to directly call the physician using SBAR. The
Clinical & Cost-effectiveness of the National Early Warning System (NEWS): Systematic Review Update
Health Research Board – Collaboration in Ireland for Clinical Effectiveness Reviews
220
physician was to respond within 30 minutes, and the RRT was to be triggered after
assessment if required. Moroseos et al.,(130) reported on a primary and secondary RRT. The
primary RRT included a designated STAT (Latin for ‘immediately) or ICU nurse along with the
charge respiratory therapist. The secondary response team included a medical ICU fellow
from 7.30am until 5.30pm and a medical ICU resident (year three) at other times of the day,
seven days a week. The RRT could be activated by staff or the patient’s family members by
directly calling the STAT page operator when one or more of the clinical criteria to qualify
for RRT were met which included staff or family concern as well as physiological criteria. No
response time was reported.
Morris et al.,(96) described the feasibility of implementing RRTs in two different hospitals.
The Wrexham hospital RRT consisted of two groups of specialist nurses. The first were
critical care outreach nurses (working closely with the CCU from 7.30am - 9pm, Monday to
Friday) and the second were a group of advanced nurse practitioners who formed part of
the hospital night team. The London hospital operated a 24/7 RRT led by a nurse consultant
and included nine critical care outreach nurses. The RRT was activated when a MEWS score
of greater than or equal to three was reported for a patient. The response time was not
reported.
Pattison et al.,(98) described a CCOT which consisted of eight nurses (no other details
reported). A MEWS of greater than three was the trigger for referral to the CCOT, and no
response time was reported. Scherr et al.,(53) included two hospitals. The RRT in both
included a nurse practitioner, an ICU registered nurse and a respiratory therapist. In cases
where the nurse practitioner was not available, a clinical associate physician or intensivist
was to respond to RRT calls. One hospital operated 24/7 whilst the other hospital’s RRT
operated 12 hours a day. The triggers for escalation included changes in level of
consciousness, breathing issues, BP issues, staff concern, heart rate issues and airway
concerns. No response time was reported. Shah et al.,(136) reported on a RRT led by an
experienced critical care nurse and respiratory therapist. The triggers for escalation included

Clinical & Cost-effectiveness of the National Early Warning System (NEWS): Systematic Review Update
Health Research Board – Collaboration in Ireland for Clinical Effectiveness Reviews
221
derangements in vital sign parameters, change in mental status and staff concern. The
response time for the RRT was not reported.
The MET in Mullany et al.,(39) included an ICU nurse, ICU medical officer and a general
medical trainee. Three different MEWS criteria (greater than or equal to four, six or eight)
triggered three different responses (1-the nurse to contact the nurse unit manager for
review, 2-the nurse to contact the nurse unit manager and the registrar and, 3-triggered the
MET). Review was necessary within 30 minutes. Massey et al.,(46) examined a two-tier RRS.
An after-hours clinical team co-ordinator (service provided by six experienced critical care
nurses) was introduced in 2008 to assist clinicians throughout the hospital and was
activated by nursing staff in the hospital after-hours (14.00 hours – 07.30 hours, 7 days a
week). The second tier of the RRS, the MET was activated by the after-hours clinical team
co-ordinator if a patient continued to deteriorate. Criteria for activation of the clinical team
co-ordinator service included derangements in vital signs and a response time to escalation
was not reported. Sebat et al.,(157) introduced a general ward conventional RRS in 2005,
which consisted of a bedside nurse, a critical care trained registered nurse, respiratory
therapist, pharmacist and a lab technician. Changes in any two of activation criteria (which
included vital signs predominantly as well as some laboratory criteria) activated the RRT. An
optimal response time was not reported (Table 8.1).
8.3.3 Composite of emergency response systems
One study(134) included ten different hospitals where the composition of the emergency
response teams varied. The majority included critical care registered nurses, respiratory
therapists, ED registered nurses, and medical doctors. Across the ten hospitals, anyone
could activate the emergency response system, and the response time ranged between five
minutes and 15 minutes (Table 8.1).

Clinical & Cost-effectiveness of the National Early Warning System (NEWS): Systematic Review Update
Health Research Board – Collaboration in Ireland for Clinical Effectiveness Reviews
222
8.4 Primary outcomes
8.4.1 Mortality
In total, 26 of the 32 studies examined the effectiveness of emergency response systems on
mortality with 13 reporting a significant effect on mortality (In total, 12 out of these 13
studies showed a significant reduction in mortality post intervention whilst one study
showed a significant increase in mortality).(125)
Two interrupted time series studies were included and neither showed a significant
reduction in mortality. In a study by Howell et al.,(115) the risk of overall in-hospital mortality
did not differ significantly between the intervention period and the baseline period. In the
intervention period, the mortality rate was 1.95% (95% CI 1.86%–2.04%), compared with
2.08% (95% CI 1.97%–2.19%) in the baseline period (p=0.07). There were no significant
differences in adjusted (p=0.09) and time-trend analyses (p=0.2). Rothberg et al.,(133)
investigated the effect of a doctor-led MET on mortality. Mortality remained unchanged
throughout the study period (2004-2009) at 22 per 1,000 admissions.
24 before-after observational studies were included and 14 reported a significant effect on
mortality (13/14 showed a significant reduction in mortality while one study showed a
significant increase in mortality).
Seven studies(63, 71, 95, 119, 124, 134, 157) reported a significant reduction in-hospital mortality
before-after RRT introduction, with Davis et al.(124) reporting a decrease from (2.1% to 1.7%,
[p<0.001]) and Sabahi et al.,(63) reporting a reduction from 73.2% to 66.2%, (a relative risk
reduction of 16%, [p=0.004]). A retrospective study by Moon et al.,(95) considered two
hospitals (Freeman hospital [FH] and the Royal Victoria Hospital [RVH]). In FH, before the
Critical Care Outreach Service (CCOS), the number of in-hospital mortalities was 750 per
year compared to 697 per year afterwards, a 7.1% reduction (p<0.0001). In the RVH the
number of in-hospital mortalities was 952 per year before and 906 per year afterwards, a
2.3% decrease (no tests for statistical significance reported). In a Beitler et al.,(119) hospital

Clinical & Cost-effectiveness of the National Early Warning System (NEWS): Systematic Review Update
Health Research Board – Collaboration in Ireland for Clinical Effectiveness Reviews
223
wide mortality decreased from 15.5 per 1,000 (before) to 13.7 per 1,000 after RRT
implementation (p=0.004). In absolute terms, the number of hospital deaths decreased by
139 (95% CI 68-210). In-hospital mortality, in a study by Al-Qahtani et al.,(71) reduced from
pre (22.5 per 1,000) to post RRT intervention (20.2 per 1,000), (p<0.0001). Sebat et al.,(157)
investigated the effect of a 4-arm RRS intervention on the unadjusted hospital mortality rate
in a single US hospital. Pre-intervention the unadjusted hospital mortality rate was 3.7%.
Post-intervention this reduced to 3.2% (p<0.001). Salvatierra et al.,(134) investigated in-
hospital mortality in a total of ten hospitals including more than 470,000 patients. Six out 10
of the hospitals showed a reduction in mortality post-RRT, while four did not. Overall there
was a 24% reduction in risk of in-hospital mortality, (p<0.001).
Six studies(53, 72, 80, 128, 129, 136) reported no significant difference in-hospital mortality, before
and after RRT introduction. In Moriarty et al.,(129) before the RRT was introduced, the
hospital mortality rate was 1.5% compared to after where it was 1.6% (p=0.30). In a
retrospective study by Mathukia et al.,(128) 272 patients were admitted to the medical,
telemetry and step-down wards of a community hospital. Before the RRT the inpatient
mortality rate was 2.3% compared to 1.2% after (no tests for statistical significance
reported). In a prospective multicentre study by Ludikhuize et al.,(80) the death rate in 12
Dutch hospitals before RRT implementation was 20.4 per 1,000 admissions compared to
17.7 per 1,000 admission after RRT implementation (p=0.05). In a study by Scherr et al.,(53)
two hospital RRTs were compared. In hospital A, the RRT operated 24 hours a day and was
nurse-practitioner-led. In hospital B, the RRT operated 12 hours a day and was intensivist-
led. In both hospitals, no significant reduction in hospital mortality was reported before or
after the RRT was introduced (Hospital A p=0.17, Hospital B p=0.06). In a study by Kim et
al.,(72) in a Korean hospital, before RRT implementation the mean in-hospital mortality rate
was 1.38 per 1,000 compared to 1.33 per 1,000 after (p=0.32). Shah et al.,(136) investigated
overall hospital mortality before and after a RRS was introduced in two hospitals. Pre-RRT
the overall hospital mortality rate was 2.4%, and 2.15% overall post-RRT, (p=0.05).

Clinical & Cost-effectiveness of the National Early Warning System (NEWS): Systematic Review Update
Health Research Board – Collaboration in Ireland for Clinical Effectiveness Reviews
224
In a study by Gonçales et al.,(50) a significant reduction in all-cause mortality from 16.3 per
1,000 discharges before the introduction of a physician led code yellow RRT to after 14.3 per
1,000, (p=0.03) was reported. Segon et al.,(135) investigated the effect of a RRT. Before RRT
there was a 3.1% mortality rate (439 of 14,013 admissions), and after RRT this dropped to
2.9% (417 of 14,333), (p=0.27). In a retrospective cohort study by Kollef et al.,(127) including
over 163,000 patients, the mortality rate before-RRT implementation was 2.87 per 1,000
compared to 2.22 per 1,000 post-RRT (p=0.002).
Jung et al.,(62) investigated the effect of a 24/7 intensivist-led RRT in four French hospitals
(one RRT-hospital and three non-RRT hospitals) on unexpected mortality (defined as non-
DNR, non-palliative deaths). In the RRT hospital, the unexpected mortality rate pre-
intervention was 21.9 per 1000 discharges, post-intervention this reduced significantly to
17.4 per 1,000 discharges (p=0.002). The unexpected mortality rate was not significantly
reduced post-intervention in the three non-RRT hospitals (p=0.38, p=0.16, p=0.40). The
authors also looked at the overall mortality rates and the findings were similar with a
significant reduction in overall mortality in the RRT hospital (p=0.012) post-intervention and
no significant reduction in the three non-RRT hospitals (p=0.19, p=0.066, p=0.97). In a
retrospective study by Kansal et al.,(38) there was a 20% decrease in unexpected deaths
before (0.8 per 1,000) and after (0.6 per 1,000) RRT implementation, however this reduction
was not significant (p=0.41).
In a retrospective study by Karpman et al.,(125) the authors compared mortality in patients
transferred from the ward to ICU and patients transferred from non-ward locations (e.g. ED,
theatre) to ICU. The hospital mortality rate in ward to ICU patients was 19.4% pre-RRT and
20.9% post-RRT (p=0.18). The hospital mortality rate in non-ward to ICU patients was 7.7%
pre-RRT and 8.8% post-RRT (p=0.006), which was a significant increase in mortality rates.
The ICU mortality rate in ward to ICU patients was 10.5% pre-RRT and 10.2% post-RRT,
(p=0.72). The ICU mortality rate in non-ward to ICU patients was 4.3% pre-RRT and 4.9%
post-RRT, (p=0.06).

Clinical & Cost-effectiveness of the National Early Warning System (NEWS): Systematic Review Update
Health Research Board – Collaboration in Ireland for Clinical Effectiveness Reviews
225
Karvellas et al.,(52) compared three different time periods in a retrospective cohort study,
the effect of an intensivist-led (IL) MET which operated 8am-4pm, Monday to Friday and a
non-IL MET which operated outside of these hours and the rate of in-hospital mortality.
Period one was the control period before a MET was in place and there was no difference
between mortality rates between the planned IL-MET hours (30.8%) and non-IL MET hours
(30.9%), (p=0.97). Period two was when a partial MET was in place (introduction of MET
team covering part of the hospital without a dedicated intensivist) and no significant
difference was found between non-IL MET hours (31.4%) and IL-MET hours (34.6%), p=0.44.
Period three was when a hospital-wide IL-MET was implemented. No significant difference
between non-IL MET hours (35.9%) and IL-MET hours (30.1%) was found in terms of
mortality (p=0.10). When comparing period 1 (control, no MET) to period 3 (full MET in
place) there was no significant difference for in-hospital mortality (p=0.20).
In a retrospective single centre study by Joshi et al.,(45) the authors investigated the effect of
a two-tier RRS on overall hospital mortality. In the before period, the overall hospital
mortality rate was 1.56% (95% CI 1.43%-1.69%). After the RRS intervention, this increased to
1.74% (95% CI 1.60%-1.89%), p=0.055. The authors also reported on ICU mortality in ICU-
based admissions only and the findings were similar with an insignificant increase in
mortality (before 13.7%, after 13.8%, p=0.93).
In a retrospective cohort study by Moroseos et al.,(130) the number of deaths before and
after RRT implementation was compared. Before, there were 4.5 per 1,000 admissions
compared to 3.3 per 1,000 admissions after the RRT was introduced (p=0.11). Mullany et
al.,(39) investigated the all-cause mortality rate before and after the introduction of a RRT in
over 300,000 observations from an Australian tertiary referral hospital. Before, the all-cause
mortality rate was 14 per 1,000 admissions and after, it reduced to 11.8 per 1,000
admissions (p=0.003). Simmes et al.,(81) investigated the effects of a two-tier MET in a group
of 1,376 surgical patients. The reduction in the number of unexpected deaths before and
Clinical & Cost-effectiveness of the National Early Warning System (NEWS): Systematic Review Update
Health Research Board – Collaboration in Ireland for Clinical Effectiveness Reviews
226
after the MET was found not to be significant (Before 0.36%, after 0.17%, OR 0.42, 95% CI
0.11-1.59), (Table 8.1).
8.4.2 Cardiac arrest
In total, 18 of the 32 studies examined the effectiveness of emergency response systems on
cardiac arrest, with 12 of the studies reporting a significant reduction in cardiac arrests.(38, 39,
45, 50, 53, 62, 63, 71, 72, 80, 81, 95, 119, 124, 127, 128, 133, 157)
A single ITS study by Rothberg et al.,(133) which investigated the effect of an intensivist-led
MET on cardiac arrests showed it did not change significantly (p=0.98).
Seventeen before-after observational studies were included with eleven reporting a
significant reduction in cardiac arrests.
Four studies(71, 119, 128, 160) considered out of ICU cardiopulmonary arrests (CPAs) and all
found a significant reduction following the implementation of an RRT. In a study by Beitler
et al.,(119) out of ICU CPAs decreased from 3.3 per 1,000 before to 1.6 per 1,000 after RRT
implementation (p<0.001). In Davis et al.,(124) non-ICU CPAs were pre 2.7% and post 1.1%
RRT introduction, (p<0.0001). Mathukia et al.,(128) in a retrospective study observed that
before the RRT the non-ICU code blue cardiac arrest rate was 0.05 per 100 patient days
compared to 0.02 per 100 patient days after (p<0.01). A RRT study in Saudi Arabia by Al-
Qahtani et al.,(71) yielded a significant reduction in non-ICU CPAs pre (1.4 per 1,000) and post
RRT intervention (0.9 per 1,000), p<0.001.
Two studies(45, 50) considered cardiorespiratory arrests (CRAs). In a study by Gonçales et
al.,(50) a significant reduction in CRAs per 1,000 discharges was reported from 3.54 per 1,000
before to 1.69 per 1,000 (p<0.0001) after the introduction of a physician-led code yellow
RRT. A significant reduction in CRAs per 1,000 deaths was also reported. In a retrospective,
single centre study by Joshi et al.,(45) the authors measured the impact of a two-tier RRS,
before the rate of CRAs was 1.0 per 1,000 admissions, compared to afterwards where it was
0.7 per 1,000 admissions (p=0.09).

Clinical & Cost-effectiveness of the National Early Warning System (NEWS): Systematic Review Update
Health Research Board – Collaboration in Ireland for Clinical Effectiveness Reviews
227
Six studies considered cardiac arrests(38, 39, 80, 81, 95, 157) before and after the introduction of a
RRT with four studies showing a significant reduction and two studies showing no change.
Sebat et al.,(157) investigated the effect of a RRS, pre-intervention the rate of cardiac arrest
was 3.1 per 1,000 discharges which reduced significantly to 2.4 per 1,000 post-intervention
(p=0.04). In a prospective multicentre before-after study by Ludikhuize et al.,(80) the cardiac
arrest rate in 12 Dutch hospitals was investigated before and after RRT implementation.
Before the rate was 1.94 per 1,000 admissions compared to 1.22 per 1,000 admission after
RRT implementation (p=0.02). A retrospective study by Moon et al.,(95) compared in two
hospitals (Freeman hospital [FH] and the Royal Victoria Hospital [RVH]) before and after the
introduction of a Critical Care Outreach Service (CCOS). In FH, before the CCOS, the number
of cardiac arrests was 767 per year compared to 584 per year afterwards (p<0.0001). In the
RVH the number of cardiac arrests was 723 per year before and 669 per year afterwards, a
7.5% absolute decrease (p<0.0001). Mullany et al.,(39) investigated rates before and after the
introduction of a RRT, across a single Australian tertiary referral hospital, in over 300,000
observations. Before the cardiac arrest rate was 5.5 per 1,000 admissions. After the cardiac
arrest rate reduced to 3.3 per 1,000 admissions (p<0.001). In a retrospective study by Kansal
et al.,(38) there was no significant reduction in cardiac arrests from before RRT
implementation (1.3 per 1,000) to after (0.95 per 1,000) (p=0.25). Simmes et al.,(81)
investigated the effects of a two-tier MET in a group of 3,786 surgical patients. No
significant reduction in the number of cardiac arrests before and after the MET was found
(before 0.29%, after 0.12%, OR 0.38, 95% CI [0.09-1.73]).
Three studies(53, 72, 127) considered CPA rates before and after RRT implementation. In a study
by Kim et al.,(72) in a Korean hospital. Before RRT implementation the mean CPA rate was
1.60 per 1,000 compared to 1.23 per 1,000 after (p=0.02). They also compared CPA rates
during RRS operating times, where a pulmonologist was on duty weekdays, and RRS non-
operating times, where one of 12 staff members made up of MDT doctors were on duty for
the RRS. During RRS operating times a significant difference was found in CPA rates before
(0.82 per 1,000) and after (0.49 per 1,000), (p=0.001). No difference was found during RRS

Clinical & Cost-effectiveness of the National Early Warning System (NEWS): Systematic Review Update
Health Research Board – Collaboration in Ireland for Clinical Effectiveness Reviews
228
non-operating time (p=0.73). In a retrospective cohort study by Kollef et al.,(127) including
over 163,000 patients, the number of CPAs before-RRT implementation was 57 compared to
35 post-RRT (p=0.006). In a study by Scherr et al.,(53) two hospital RRTs were compared. In
hospital A, the RRT operated 24 hours a day and was nurse-practitioner-led. In hospital B,
the RRT operated 12 hours a day and was intensivist-led. In both hospitals, no significant
reduction in CPAs was reported before and after the RRT was introduced (Hospital A p=0.39,
Hospital B p=0.84).
In a study by Jung et al.,(62) the effect of a 24/7 intensivist-led RRT on non-ICU cardiac arrests
was compared in four hospitals (one RRT-based hospital and three non-RRT hospitals) in
France. Pre-intervention in the RRT hospital the rate of non-ICU cardiac arrests per 1,000
discharges was 2.6, compared to 1.8 per 1,000 afterwards (p=0.09). Two out of the three
non-RRT hospitals reported insignificant increases in non-ICU cardiac arrests (Hospital 1:
p=0.08; Hospital 2: p=0.044; Hospital 3: p=0.71) post intervention.
Sabahi et al.,(63) investigated the effect of a RRT on unexpected cardiac arrests in a study in
Iran. Before the RRT was introduced there were 431 unexpected cardiac arrests compared
to after when there was 349 cardiac arrests, a relative risk reduction of 19%, p=0.003, (Table
8.1).
8.4.3 Length of stay (LOS)
Seven of the 32 studies examined the effectiveness of emergency response systems on LOS
with three reporting a significant reduction in LOS.(39, 45, 52, 62, 72, 125, 127)
Two studies,(62, 127) considered the median LOS before and after the introduction of an RRT.
A study by Jung et al.,(62) investigated the effect of a 24/7 intensivist-led RRT in four French
hospitals (one RRT-based hospital and three non-RRT hospitals). In the RRT-based hospital,
median LOS pre-intervention was 5 days (IQR 2-10 days), remaining unchanged post-
intervention (median LOS 5 days, IQR 2-10 days, p=0.09). In a retrospective cohort study by
Kollef et al.,(127) including over 163,000 patients, the median hospital LOS before-RRT
Clinical & Cost-effectiveness of the National Early Warning System (NEWS): Systematic Review Update
Health Research Board – Collaboration in Ireland for Clinical Effectiveness Reviews
229
implementation was 3.79 days (IQR 2.02-6.81 days) compared to 3.10 days (IQR 1.75-5.82)
post-RRT (p=0.001).
In a retrospective before-after observational study by Karpman et al.,(125) the authors
compared ICU LOS and hospital LOS in patients transferred from the ward to ICU and
patients transferred from non-ward locations (e.g. ED, theatre) to ICU. In patients
transferred from ward to ICU, the ICU LOS was a median of three days (IQR 2-5 days) pre-
RRT and a median of three days (IQR 2-4 days) post-RRT, (p<0.001). In patients transferred
from non-ward to ICU, the ICU LOS was a median of two days (IQR 2-4 days) pre-RRT and a
median of two days (IQR 2-3 days) post-RRT, (p<0.001). Hospital LOS was not significantly
different in patients transferred from ward to ICU patients (p=0.34) but reduced in patients
transferred from non-ward (emergency department, operating room and other hospitals) to
ICU from a median of six days pre-RRT to five days post-RRT (p<0.001).
Karvellas et al.,(52) compared three different time periods in a retrospective cohort study,
and the effect of an intensivist-led (IL) MET which operated 8am-4pm, Monday to Friday
and a non-IL MET which operated outside of these hours and ICU LOS. Period one was the
control period before a MET team was in place, there was no difference in median ICU LOS
between the planned IL-MET hours (5 days, IQR 2-9 days) and non-IL MET hours (5 days, IQR
2-10 days), (p=0.92). Period two was when a partial MET was in place and no significant
difference was found between non-IL MET hours (5 days, IQR 2-9 days) and IL-MET hours (5
days, IQR 3-10 days), (p=0.44). Period three was when a hospital-wide IL-MET was
implemented. No significant difference between non-IL MET hours (5 days, IQR 2-11 days)
and IL-MET hours (5 days, 3-9 days) was found in terms of ICU LOS (p=0.87), and no
significant difference was found between period 1 (control, no MET) and period three (full
MET), (p=0.20). The authors also investigated hospital LOS. There was no significant
difference between the three time periods for IL-MET hours and non-IL MET hours.
In a study by Kim et al.,(72) the authors compared ICU LOS and hospital LOS before and after
RRT implementation in a Korean hospital in patients admitted with CPA. Before, the mean

Clinical & Cost-effectiveness of the National Early Warning System (NEWS): Systematic Review Update
Health Research Board – Collaboration in Ireland for Clinical Effectiveness Reviews
230
ICU LOS was 11.3 days, compared to 8.3 days after (p=0.14). No significant difference in-
hospital LOS was found before or after the RRT implementation (p=0.59).
Mullany et al.,(39) investigated hospital LOS before and after the introduction of a RRT in
over 300,000 observations from an Australian tertiary referral hospital. Before, the average
hospital LOS was 5.9 days compared to 4.9 days after the RRT (no statistical test results
reported). In a retrospective single centre study by Joshi et al.,(45) the authors investigated
the effect of a two-tier RRS on the median ICU LOS and the overall hospital LOS. Post-RRS
intervention, the median ICU LOS increased significantly (p=0.02), and the overall hospital
LOS reduced significantly from 5.65 days to 4.93 days (p<0.001),(Table 8.1).
8.4.4 Transfer or admission to the ICU
In total, 14 of the 32 studies examined the effectiveness of emergency response systems on
transfer or admission to the ICU(38, 39, 45, 53, 62, 71, 72, 80, 81, 95, 128-130, 135) with five studies
reporting a significant effect on the outcome (two studies reported a significant reduction(71,
130) and three studies reported a significant increase(62, 81, 129) in transfer or admission to the
ICU).
Seven studies(38, 39, 45, 53, 62, 81, 129) considered the effect on unplanned ICU admission rates
following RRT implementation with three finding a significant increase in the admission rate.
Jung et al.,(62) investigated the effect of a 24/7 intensivist-led RRT in four French hospitals
(one RRT-based hospital and three non-RRT hospitals) on the rate of unplanned ICU
admissions. A significant increase in unplanned ICU admissions was found in the RRT-based
hospital (pre: 45.7 per 1,000 discharges, post: 52.8 per 1,000 discharges, p=0.002). No
significant changes in unplanned ICU admissions were reported in the three non-RRT
hospitals. Moriarty et al.,(129) reported before the RRT was introduced, the unplanned ICU
admission rate was 13.7 per 1,000 floor days compared to after where this increased to 15.2
transfers per 1,000 floor days (p<0.001). Simmes et al.,(81) investigated the effects of a two-
tier MET in surgical patients. A significant increase in the number of unplanned ICU

Clinical & Cost-effectiveness of the National Early Warning System (NEWS): Systematic Review Update
Health Research Board – Collaboration in Ireland for Clinical Effectiveness Reviews
231
admissions before and after the MET was found (before 2.47%, after 4.15%, OR 1.66, 95% CI
[1.07-2.55]). In a retrospective, single centre study by Joshi et al.,(45) the authors compared
the rate of unplanned ICU admissions before and after a two-tier RRS was introduced.
Before the rate was 5.8 per 1,000 admissions, after the rate increased to 6.5 per 1,000
admissions (p=0.11). In a retrospective study by Kansal et al.(38), there was no significant
reduction in unplanned ICU or HDU admissions before (2.7 per 1,000) and after (2.5 per
1,000) RRT implementation (p=0.61). Mullany et al.,(39) investigated the introduction of a
RRT in over 300,000 observations from an Australian tertiary referral hospital, before the
number of unplanned ICU admissions were 41 and after it trebled to 121 admissions per
year. In a study by Scherr et al.,(53) two hospital RRTs were compared. In hospital A, the RRT
operated 24 hours a day and was nurse-practitioner-led. In hospital B, the RRT operated 12
hours a day and was intensivist-led. In both hospitals, no significant reduction in unplanned
ICU admission was reported before and after the RRT was introduced (Hospital A: p=0.21,
Hospital B: p=0.10).
Two studies(130, 135) considered the unexpected or unplanned ICU transfer rate, with one
reporting a significant decrease. Segon et al.,(135) investigated the effect of a RRT, before RRT
there was a 15.8% unexpected ICU transfer rate (295 of 1,866 admissions), after RRT this
dropped to 15.5% (258 of 1,663), (p=0.80). In a retrospective cohort study by Moroseos et
al.,(130) before, there were 52 per 1,000 unplanned ICU transfers compared to 42 per 1,000
transfers after the RRT was introduced (p=0.01).
Two studies(71, 128) considered all ICU transfers, with one reporting a significant decrease. A
RRT study by Al-Qahtani et al.,(71) found a significant reduction in ICU transfers following
RRT, pre (8.7 per 1,000) and post RRT intervention (7.3 per 1,000), (p<0.0001). Mathukia et
al.,(128) in a retrospective study of 272 patients admitted to the medical, telemetry and step-
down wards of a community hospital, reported that before the RRT the ICU transfer rate
was 72% compared to 50% after RRT implementation (no statistical tests reported).

Clinical & Cost-effectiveness of the National Early Warning System (NEWS): Systematic Review Update
Health Research Board – Collaboration in Ireland for Clinical Effectiveness Reviews
232
Three studies(72, 80, 95) considered all ICU admissions. In a prospective multicentre study by
Ludikhuize et al.,(80) the ICU admission rate in 12 Dutch hospitals was investigated before
and after RRT implementation. Before, the rate was 19.8 per 1,000 admissions compared to
17.1 per 1,000 admission after RRT implementation (p=0.09). In a study by Kim et al.,(72) in a
Korean hospital, no significant difference was in admission to the ICU before and after RRT
implementation (p=0.11). In a retrospective study by Moon et al.,(95) that compared in two
hospitals (Freeman hospital [FH] and the Royal Victoria Hospital [RVH]) before and after the
introduction of a Critical Care Outreach Service (CCOS). In FH, before the CCOS, the number
of ICU admissions was 857 per year compared to 1,135 per year afterwards, a 32% increase
(statistical test not reported). In the RVH the number of ICU admissions was not reported
(Table 8.1).
8.5 Secondary outcomes
8.5.1 Clinical deterioration in sub-populations
Two observational studies examined the effectiveness of emergency response systems on
clinical deterioration in a sub-population with one reporting a significant reduction in the
outcomes as a result of the emergency response system intervention.(51, 98)
Hayani et al.,(51) included 814 hematopoietic stem cell transplant recipients in a before-after
observational study where a RACE emergency response team was implemented. The
authors looked at the non-relapse mortality by day 100 after transplant which was 10.2%
pre-RACE team implementation and 8.8% post-RACE team implementation (p=0.62). The
authors looked at the non-relapse mortality by day 100 after transplant in allogeneic
recipients only (non-identical donors) which was 22.5% pre-RACE team implementation and
18.2% post-RACE team implementation (p=0.25). The ICU admission rate pre and post
implementation was not significantly different in this subpopulation of transplant patients
(p=0.44), (Table 8.1).

Clinical & Cost-effectiveness of the National Early Warning System (NEWS): Systematic Review Update
Health Research Board – Collaboration in Ireland for Clinical Effectiveness Reviews
233
Pattison et al.,(98) investigated three and six month mortality in 407 episodes of CCOT
referral in 318 cancer patients. A MEWS greater than three was the trigger for CCOT
referral. Three and six-month mortality was significantly associated with a higher MEWS at
referral (p=0.02, p=0.01 respectively). The mean MEWS at referral to the CCOT was 3.76
(95% CI 3.49-3.99), with untimely referrals associated with lower survival to discharge
(p=0.004) and three and six month mortality (p=0.004, p=0.03 respectively), (Table 8.1).
8.5.2 Patient Reported Outcome Measures (PROMs)
One before-after study included a PROMs outcome and reported no significant effect on the
outcome (i.e. quality of life was not improved).(82) Simmes et al.,(82) investigated health-
related quality of life (HRQOL) which was measured using the EuroQol 5-dimensions (EQ-
5D)(161) and EuroQol visual analogue scale (EQ-VAS)(162) questionnaires before and after the
introduction of a MET in a group of surgical patients (all patients were included with only
2.8% before and 4.5% after experiencing an unplanned admission to the ICU). There was no
difference in HRQOL at three months (p=0.54) or six months (p=0.29) following surgery
using the EQ-5D index, nor with the EQ-VAS tool at three (p=0.28) and six months (p=0.80)
post surgery (Table 8.1).
8.5.3 Post-hoc identified outcomes
8.5.3.1 Composite Outcomes
Three before-after observational studies examined the effectiveness of emergency response
systems on a composite of serious events with one reporting a significant reduction.(38, 46, 80)
In a retrospective uncontrolled before-after observational study by Kansal et al.,(38) there
was no significant reduction in the composite outcome (defined as unexpected death,
cardiac arrest or unplanned admission to the ICU or HDU) before (3.8 per 1,000) and after
(3.2 per 1,000) RRT implementation (p=0.28). In a retrospective before-after observational
study by Massey et al.,(46) the authors investigated the effect of a two-tier RRS on major
events (a composite outcome defined as unplanned admission to the ICU, death, or cardiac

Clinical & Cost-effectiveness of the National Early Warning System (NEWS): Systematic Review Update
Health Research Board – Collaboration in Ireland for Clinical Effectiveness Reviews
234
arrest). A significant increase of any major event was found post-intervention (p=0.01). The
authors also looked at serious events (a composite outcome defined as myocardial
infarction, deep vein thrombosis, pulmonary embolism, cerebral vascular accidents,
operating theatre, adverse drug reaction, hospital accident/injury, HCAI/sepsis, other
adverse events and major adverse events as defined previously). Pre-intervention the rate
of serious events was 32/150 (21.3%). Post-intervention the rate of serious events was
36/150 (24.7%), (p=0.58) In a study by Ludikhuize et al.,(80) a composite outcome of death,
cardiac arrest and ICU admission before and after RRT implementation was investigated.
Before the rate was 37.14 per 1,000 admissions compared to 32.92 per 1,000 admission
after RRT implementation (p=0.04). (Table 8.1).
8.5.3.2 Resource utilisation (number of code blue calls or RRT calls)
Eleven of the 32 studies examined the effectiveness of emergency response systems on the
number of code blue calls or RRT calls and seven reported a significant effect of the
emergency response system intervention.(38, 45, 80, 117, 127, 128, 130, 133, 135, 136, 157) Three out of the
seven studies showed a significant reduction in code calls and four of the studies showed a
significant increase in RRT calls post intervention.
A single ITS study was included and reported a significant reduction in the number of code
calls as a result of the emergency response system intervention. Rothberg et al.,(133)
investigated the effect of an intensivist-led MET on the number of code calls. Pre-MET there
were 7.3 per 1,000 (95% CI 5.81-9.16). Post-MET this dropped to 4.21 per 1,000 (95% CI
3.42-5.18), (p<0.0001). There was a significant reduction in the number of code calls outside
of critical care before and after the MET (p=0.008), in the number of code calls for medical
crises (p<0.0001) and in the number of code calls within critical care (Table 8.1).
There were ten before- after observational studies of which six reported a significant effect
of the emergency response team (three of which reported a significant increase in RRT/MET
calls and two of which reported a significant reduction in code calls).

Clinical & Cost-effectiveness of the National Early Warning System (NEWS): Systematic Review Update
Health Research Board – Collaboration in Ireland for Clinical Effectiveness Reviews
235
In a retrospective before-after observational study by Kansal et al.,(38) there was a 50%
increase in the number of rapid response calls before (14.3 per 1,000) and after (21.2 per
1,000) RRT implementation (p<0.001). Segon et al.,(135) investigated the effect of a RRT. Pre-
RRT the number of code blue calls was 3.09 per 1,000 admissions. Post-RRT this dropped to
2.89 per 1,000 admissions, (p=0.14). Sebat et al.,(157) reported the number of RRT calls per
1,000 discharges before and after a four-arm RRS intervention. Pre-intervention there were
10.2 RRT calls per 1,000 discharges, post-intervention this increased significantly to 48.8 RRT
calls per 1,000 discharges (p<0.001). In a prospective multicentre study by Ludikhuize et
al.,(80) the number of RRT calls in 12 Dutch hospitals was investigated before and after
formal RRT implementation. Before the rate was 6.8 per 1,000 admissions (95% CI 6.2-7.5)
compared to 7.3 per 1,000 admissions (6.4-8.3) after RRT implementation (statistical test
not reported). In a retrospective QIP study by Albert et al.,(117) the authors reported a 33%
reduction in the number of code blue calls and a 50% increase in RRT calls six months after
implementation of the RRT which included an electronic MEWS system (no statistical tests
reported). In a retrospective cohort study by Kollef et al.,(127) which included over 163,000
patients, the number of RRT activations before a formal RRT was implemented was 72
compared to 370 post-RRT, with a significant year on year increase (p<0.001).
The number of RRT calls was reported by Mathukia et al.,(128) in a retrospective before-after
observational study of patients admitted to the medical, telemetry and step-down wards of
a community hospital. Before the RRT was formally implemented the number of RRT calls
was 0.3 per 100 patient days compared to 0.48 per 100 patient days after (p<0.01). In a
retrospective study by Moroseos et al.,(130) the number of code blue activations (defined as
respiratory arrest or cardiopulmonary arrest) before and after RRT implementation was
compared. Before, there were 10 per 1,000 admissions compared to 4 per 1,000 admissions
after the RRT was introduced (p=0.04).
Shah et al.,(136) investigated the number of code calls before and after a RRS was introduced
in two hospitals. Pre-RRS there were 0.83 code calls per 1,000 admissions. This increased to

Clinical & Cost-effectiveness of the National Early Warning System (NEWS): Systematic Review Update
Health Research Board – Collaboration in Ireland for Clinical Effectiveness Reviews
236
0.98 per 1,000 admissions (overall post-RRS), p=0.30. Joshi et al.,(45) reported a significant
reduction in RRT calls per 1,000 admissions after a two-tier RRS was introduced (pre:
48/1000, post 11/1000, p<0.001), (Table 8.1).
8.5.3.3 Other objective patient-related positive and negative outcomes
Morris et al.,(96) in a retrospective observational cohort study following RRT activation,
looked at a number of positive outcomes (timely ICU admission [<4 hours]; alive on the
ward and no longer triggering; died with terminal care pathway and had DNAR; alive with
DNAR and documented treatment limitations and other [new unrelated RRT trigger, chronic
condition leading to continuous trigger, discharged]). They also looked at negative outcomes
(delayed ICU admission [>4 hours]; still triggering; CPA; outcome unknown or lost to follow-
up). Day one post-RRT 75% of patients had a positive outcome, of the negative outcomes
15.8% were still triggering and 0.7% had a CPA (Table 8.1). Day three post RRT activation,
90% of patients had a positive outcome compared to 10% who had a negative outcome. Day
seven post RRT activation 88% of patients had a positive outcome compared to 12% of
patients having a negative outcome. In this study the absence of a simple tool for auditing
and benchmarking was highlighted as hampering development of effective RRTs. This
study’s matrix of outcomes gives RRTs an opportunity to quantify failure-to-rescue with
minimal additional administrative workload. With its ability to classify and measure
frequency of clinical outcomes, the tool could facilitate quality initiatives in clinical networks
to improve the safety of deteriorating patients on general wards.
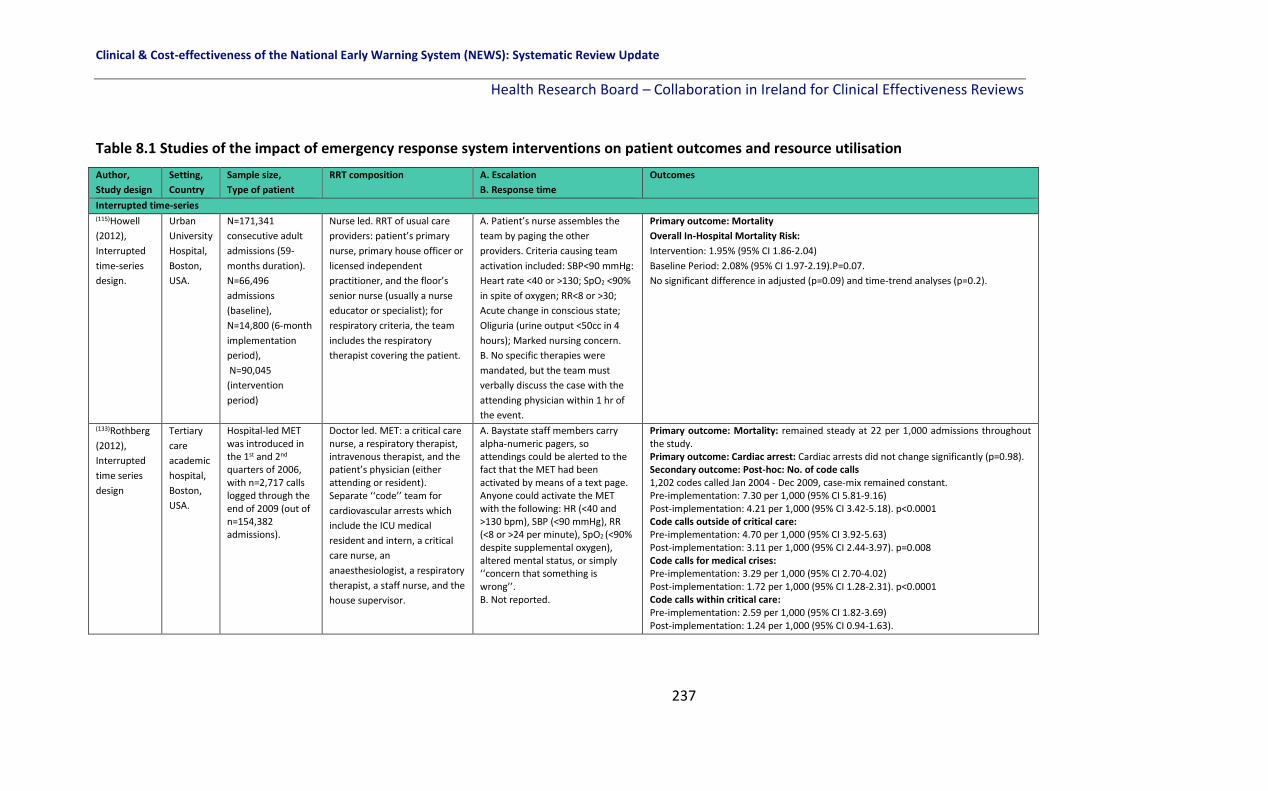
Clinical & Cost-effectiveness of the National Early Warning System (NEWS): Systematic Review Update
Health Research Board – Collaboration in Ireland for Clinical Effectiveness Reviews
237
Table 8.1 Studies of the impact of emergency response system interventions on patient outcomes and resource utilisation
Author,
Study design
Setting,
Country
Sample size,
Type of patient
RRT composition A. Escalation
B. Response time
Outcomes
Interrupted time-series (115)Howell
(2012),
Interrupted
time-series
design.
Urban
University
Hospital,
Boston,
USA.
N=171,341
consecutive adult
admissions (59-
months duration).
N=66,496
admissions
(baseline),
N=14,800 (6-month
implementation
period),
N=90,045
(intervention
period)
Nurse led. RRT of usual care
providers: patient’s primary
nurse, primary house officer or
licensed independent
practitioner, and the floor’s
senior nurse (usually a nurse
educator or specialist); for
respiratory criteria, the team
includes the respiratory
therapist covering the patient.
A. Patient’s nurse assembles the
team by paging the other
providers. Criteria causing team
activation included: SBP<90 mmHg:
Heart rate <40 or >130; SpO2 <90%
in spite of oxygen; RR<8 or >30;
Acute change in conscious state;
Oliguria (urine output <50cc in 4
hours); Marked nursing concern.
B. No specific therapies were
mandated, but the team must
verbally discuss the case with the
attending physician within 1 hr of
the event.
Primary outcome: Mortality
Overall In-Hospital Mortality Risk:
Intervention: 1.95% (95% CI 1.86-2.04)
Baseline Period: 2.08% (95% CI 1.97-2.19).P=0.07.
No significant difference in adjusted (p=0.09) and time-trend analyses (p=0.2).
(133)Rothberg
(2012),
Interrupted
time series
design
Tertiary
care
academic
hospital,
Boston,
USA.
Hospital-led MET was introduced in the 1st and 2nd quarters of 2006, with n=2,717 calls logged through the end of 2009 (out of n=154,382 admissions).
Doctor led. MET: a critical care nurse, a respiratory therapist, intravenous therapist, and the patient’s physician (either attending or resident). Separate ‘‘code’’ team for
cardiovascular arrests which
include the ICU medical
resident and intern, a critical
care nurse, an
anaesthesiologist, a respiratory
therapist, a staff nurse, and the
house supervisor.
A. Baystate staff members carry alpha-numeric pagers, so attendings could be alerted to the fact that the MET had been activated by means of a text page. Anyone could activate the MET with the following: HR (<40 and >130 bpm), SBP (<90 mmHg), RR (<8 or >24 per minute), SpO2 (<90% despite supplemental oxygen), altered mental status, or simply ‘‘concern that something is wrong’’. B. Not reported.
Primary outcome: Mortality: remained steady at 22 per 1,000 admissions throughout the study. Primary outcome: Cardiac arrest: Cardiac arrests did not change significantly (p=0.98). Secondary outcome: Post-hoc: No. of code calls 1,202 codes called Jan 2004 - Dec 2009, case-mix remained constant. Pre-implementation: 7.30 per 1,000 (95% CI 5.81-9.16) Post-implementation: 4.21 per 1,000 (95% CI 3.42-5.18). p<0.0001 Code calls outside of critical care: Pre-implementation: 4.70 per 1,000 (95% CI 3.92-5.63) Post-implementation: 3.11 per 1,000 (95% CI 2.44-3.97). p=0.008 Code calls for medical crises: Pre-implementation: 3.29 per 1,000 (95% CI 2.70-4.02) Post-implementation: 1.72 per 1,000 (95% CI 1.28-2.31). p<0.0001 Code calls within critical care: Pre-implementation: 2.59 per 1,000 (95% CI 1.82-3.69) Post-implementation: 1.24 per 1,000 (95% CI 0.94-1.63).

Clinical & Cost-effectiveness of the National Early Warning System (NEWS): Systematic Review Update
Health Research Board – Collaboration in Ireland for Clinical Effectiveness Reviews
238
Table 8.1 Studies of the impact of emergency response system interventions on patient outcomes and resource utilisation [continued]
Author, Study design
Setting, Country
Sample size, Type of patient
RRT composition A. Escalation B. Response time
Outcomes
Uncontrolled Before-after observational studies (71)Al-Qahtani
(2013),
Before (Jan 2006 – Nov 2007), -after (Dec 2007-Dec 2010) RRT uncontrolled observational study
Tertiary care academic hospital (900-bed), Saudi Arabia
N=98,391 patients (pre-RRT) and N=157,804 (post-RRT). All medical-surgical patients
Intensivist-led, ICU fellow or registrar, critical care nurse, respiratory therapist.
A. Triggered by any HCP via an overhead call or pager. Triggers:
threatened airway, RR ≤ 8 or ≥ 30, SpO2 ≤ 90% , FiO2 ≥ 50% or ≥ 6
L/min), SBP ≤ 90 or ≥ 200, HR ≤40 or ≥130, urine output ≤100 mL
over 4 hrs for patients with indwelling urinary catheter, ≥2 points
on GCS or repeated seizures, or staff concern.
B. Within a max of 15 mins.
Primary: Total hospital mortality
Pre: 2,214 (22.5 per 1,000) Post: 3,191 (20.2 per 1,000), p<0.0001.
Primary: Ward mortality
Pre: 1,912 (19.4 per 1,000), Post: 2,829 (17.9 per 1,000), p<0.006.
Primary: Non-ICU cardiopulmonary arrests
Pre: 133 (1.4 per 1,000), Post: 144 (0.9 per 1,000), p<0.001.
Primary: ICU transfer
Pre: 856 (8.7 per 1,000), Post: 1158 (7.3 per 1,000), p<0.0001.
Jung et al
(2016),(62)
Before - after
intervention
study.
4 hospitals of Montpe-llier regional health-care centre, France.
N=117,466 patients admitted to the medical-surgical wards between July 2010 and Dec 2011 (pre-RRT) of 3 control hospitals with no RRT and N=43,605 patients admitted from July 2012 to Dec 2013 (post-RRT) in 1 RRT hospital.
24/7 intensivist-led RRT comprised of: an ICU resident and either an ICU fellow or an attending physician. An ICU nurse could be part of the team if requested by the attending physician.
A. Single activation criterion: HR <40/min, >140/min; SBP <80 mmHg; Cardiac arrest; RR <8/min, >30/min, Pulse oximetry <90% with O2 above 6l/min; Respiratory distress in a tracheotomised patient, Respiratory arrest; Coma; Sudden change in level of consciousness; Seizure B. 5 mins in the case of a code blue and 20 mins in other situations.
Primary outcome: Unexpected mortality (non-DNR, non-palliative) RRT hospital: Pre: 21.9 per 1,000 discharges Post: 17.4 per 1,000 discharges (p=0.002) Three control hospitals: Hospital 1: Pre:14.3 per 1,000 discharges Post: 15.4 per 1,000 discharges (p=0.38) Hospital 2: Pre:24.9 per 1,000 discharges Post:22.5 per 1,000 discharges (p=0.16) Hospital 3: Pre: 22.1 per 1,000 discharges Post: 23.8 per 1,000 discharges (p=0.40) Primary outcome: Overall mortality RRT hospital: Pre: 39.6 per 1,000 discharges; Post: 34.6 per 1,000 discharges (p=0.012) Three control hospitals: Hospital 1: Pre: 16.7 per 1,000 discharges; Post: 18.4 per 1,000 discharges (p=0.19) Hospital 2: Pre: 28.6 per 1,000 discharges; Post: 25.2 per 1,000 discharges (p=0.066) Hospital 3: Pre: 29.0 per 1,000 discharges; Post: 29.0 per 1,000 discharges (p=0.97)

Clinical & Cost-effectiveness of the National Early Warning System (NEWS): Systematic Review Update
Health Research Board – Collaboration in Ireland for Clinical Effectiveness Reviews
239
Table 8.1 Studies of the impact of emergency response system interventions on patient outcomes and resource utilisation [continued]
Author,
Study design
Setting,
Country
Sample size,
Type of
patient
RRT
composition
A. Escalation
B. Response time
Outcomes
Uncontrolled Before-after observational studies
Jung et al. (continued)
Primary outcome: Non-ICU cardiac arrest (per 1,000 discharges) RRT hospital: Pre:2.; Post: 1.8 (p=0.093) Three control hospitals: Hospital 1: Pre:3.5; Post: 4.6 (p=0.080) Hospital 2: Pre: 3.3; Post: 2.1 (p=0.044) Hospital 3: Pre:10.2; Post: 10.8 (p=0.71) Primary outcome: Unplanned ICU admission (per 1,000 discharges) RRT hospital: Pre:45.7; Post: 52.8 (p=0.002) Three control hospitals: Hospital 1: Pre: 51; Post: 55.3 (p=0.054) Hospital 2: Pre: 60.2 ; Post:55.6 (p=0.34) Hospital 3: Pre: 126.9; Post:122.0 (p=0.24) Primary outcome: Median hospital LOS (days) RRT hospital: Pre: 5 (2-10); Post: 5(2-10), (p=0.09) Three control hospitals: Hospital 1: Pre: 4 (2-8), Post: 4 (2-8), (p<0.001) Hospital 2: Pre: 3 (2-7), Post: 3 (2-6), (p<0.001) Hospital 3: Pre: 4 (2-8), Post: 4 (2-8), (p=0.36)

Clinical & Cost-effectiveness of the National Early Warning System (NEWS): Systematic Review Update
Health Research Board – Collaboration in Ireland for Clinical Effectiveness Reviews
240
Table 8.1 Studies of the impact of emergency response system interventions on patient outcomes and resource utilisation [continued]
Author,
Study design
Setting,
Country
Sample size,
Type of patient
RRT composition A. Escalation
B. Response time
Outcomes
Uncontrolled Before-after observational studies (38)Kansal
(2012),
Retrospective
uncontrolled
before-after
observational
study.
John
Hunter
tertiary
Hospital,
Australia.
N=375 patients with a RRT
call before the intervention
(Jun – Oct 2009) and N=582
patients after (Jun – Oct
2010). Adult patients.
Doctor led. An ICU
senior resident
medical officer, a
designated ICU nurse
and medical registrar,
and supervised by an
ICU consultant or ICU
senior registrar.
A. Two tier escalation system with early and late calling criteria. Early warning calling criteria: RR 5-10 or 25-30 breaths/min; SpO2 90-95% and/or increase in oxygen requirement; poor peripheral circulation, pulse rate 40-50 or 120-140 beats/min; systolic BP 90-100 or 180-200 mmHg; Decrease in level of consciousness from A (Alert) to V (voice, rousable only by voice) in the AVPU scale; Blood glucose level -4 mmol/L, body temp<35.5 or >38.5, increasing blood loss, anuria, failure to void in 24 hrs or urine output <200ml over 8 hrs; polyuria >200mL/hr for 2 hrs in the absence of diuretics; increasing pain including chest pain.
Late warning calling criteria; All respiratory and cardiac arrests; airway obstruction; seizures; arterial blood gas: PaO2 <60 mmHg, PaCO2 > 60 mmHg, pH <7.2 or base excess < - 5mmol/L; venous blood gas PvCO2 >65mmHg, pH <7.2; RR <5 or >30; SpO2 <90% and or increase in oxygen requirement; pulse rate <40 or > 140/min; systolic BP <90 mmHg or > 200 mmHg; unresponsive to verbal commands or sudden fall in level of consciousness of >= 2 points on the Glasgow Coma Scale; Blood Glucose Level <1 mmol/L; serious concern by any staff member. B. Presence of any 1 of the early warning signs triggered the 1st tier of clinical review by the ward team, which must be attended to within 30 mins. Delayed clinical review, progression to or occurrence of a late warning sign at any time triggered the second-tier escalation, which was a rapid-response call.
Primary outcome: Unexpected death: Before: 0.8 per 1,000, After: 0.6 per 1,000, 20% decrease, p=0.41 Primary outcome: Cardiac Arrest Before: 1.3 per 1,000, After: 0.95 per 1,000, 26% decrease, p=0.25. Primary outcome: Unplanned admission to the ICU or HDU: Before: 2.7 per 1,000, After: 2.5 per 1,000, p=0.61. Secondary outcome: Post hoc: Rapid response calls: Before (14.3 per 1,000), After (21.2 per 1,000), 50% increase. p<0.001. Secondary outcome: Post hoc: Composite rate (unexpected death, cardiac arrest or unplanned admission to ICU or HDU): Before (3.8 per 1,000), After (3.2 per 1,000), 16% decrease, p=0.28.

Clinical & Cost-effectiveness of the National Early Warning System (NEWS): Systematic Review Update
Health Research Board – Collaboration in Ireland for Clinical Effectiveness Reviews
241
Table 8.1 Studies of the impact of emergency response system interventions on patient outcomes and resource utilisation [continued]
Author, Study design
Setting, Country
Sample size, Type of patient
RRT composition A. Escalation B. Response time
Outcomes
Uncontolled Before-after observational studies (125)Karpman (2013), Retrospective before-after observational study.
2 ICUs, Minnesota, USA.
N=4,890 medical/ surgical patients transferred from the hospital ward to 2 ICUs and n=15,855 patients admitted from ‘non-ward’ locations.
Doctor led.An intensivist, a critical care fellow and nurse, a respiratory therapist, each worked in 1 of the 2 study ICUs.
A. Calling criteria: staff concern, SpO2 <90%, HR <40 or >130 beats per minute; systolic BP <90 mmHg, RR <10 or >28 breaths per minute; acute chest pain; change in conscious state; new onset of symptoms suggestive of stroke. B. Not reported.
Primary outcome: Mortality [WARD TO ICU PATIENTS] Hospital mortality: pre-RRT: 478 (19.4%), post-RRT (507 (20.9%), p=0.18 ICU Mortality: pre-RRT: 259 (10.5%), post-RRT (247 (10.2%), p=0.72. Primary outcome: ICU LOS: pre-RRT median 3 days (IQR 2-5), post-RRT 3 days (IQR 2-4), p<0.001; Hospital LOS: pre-RRT median 11 days (IQR 6-22), post-RRT 11 days (IQR 6-21), p=0.34. Primary outcome: Mortality [NON-WARD TO ICU PATIENTS, (ED, operating theatre, other hospitals)]. Hospital mortality: pre-RRT: 630 (7.7%), post-RRT 674 (8.8%), p=0.006; ICU Mortality: pre-RRT: 355 (4.3%), post-RRT 376 (4.9%), p=0.06. Primary outcome: ICU LOS: pre-RRT median 2 days (IQR 2-4), post-RRT 2 days (IQR 2-3), p<0.001; Hospital LOS: pre-RRT median 6 days (IQR 3-12), post-RRT 5 days (IQR 2-10), p≤0.001.
(80)Ludikhuize (2015), Prospective before-after multi-centre intervention study (COMET)
12 Dutch hospitals, The Nether-lands
N=166,569 patients admitted to medical and surgical wards Apr 2009 and Nov 2011. MEWS and SBAR and RRT implemented
Nurse led. An ICU nurse and a physician who was at least trained in fundamental critical care.
A. MEWS <3: follow local guidelines. MEWS ≥3: nurse to directly call the physician using SBAR. B. Physician responds within 30
mins. After assessment direct
activation of RRT or within one
hr of assessment determine
the effect of treatment.
Primary outcome: Mortality (per 1,000): Before: 20.4 (95% CI 18.7-22.0) After: 17.7 (95% CI 16.2-19.2), p=0.05 Primary outcome: Cardiac arrest (per 1,000 admissions): Before: 1.94 (95% CI 1.43-2.46) After: 1.22 (95% CI 90.82-1.61), p=0.02 Primary outcome: Admission to the ICU: Before: 19.8 (95% CI 18.1-21.6) After: 17.1 (95% CI 15.5-18.6), p=0.09 Secondary outcome: post-hoc: Composite outcome (death, cardiac arrest, ICU admission): Before: 37.14 (95% CI, 34.94–39.34) After: 32.92 (95% CI, 30.88–34.95), p=0.04 Secondary outcome: post hoc: RRT calls (per 1,000 admissions): Before: 6.8 (95% CI 6.2-7.5) After: 7.3 (95% CI 6.4-8.3).
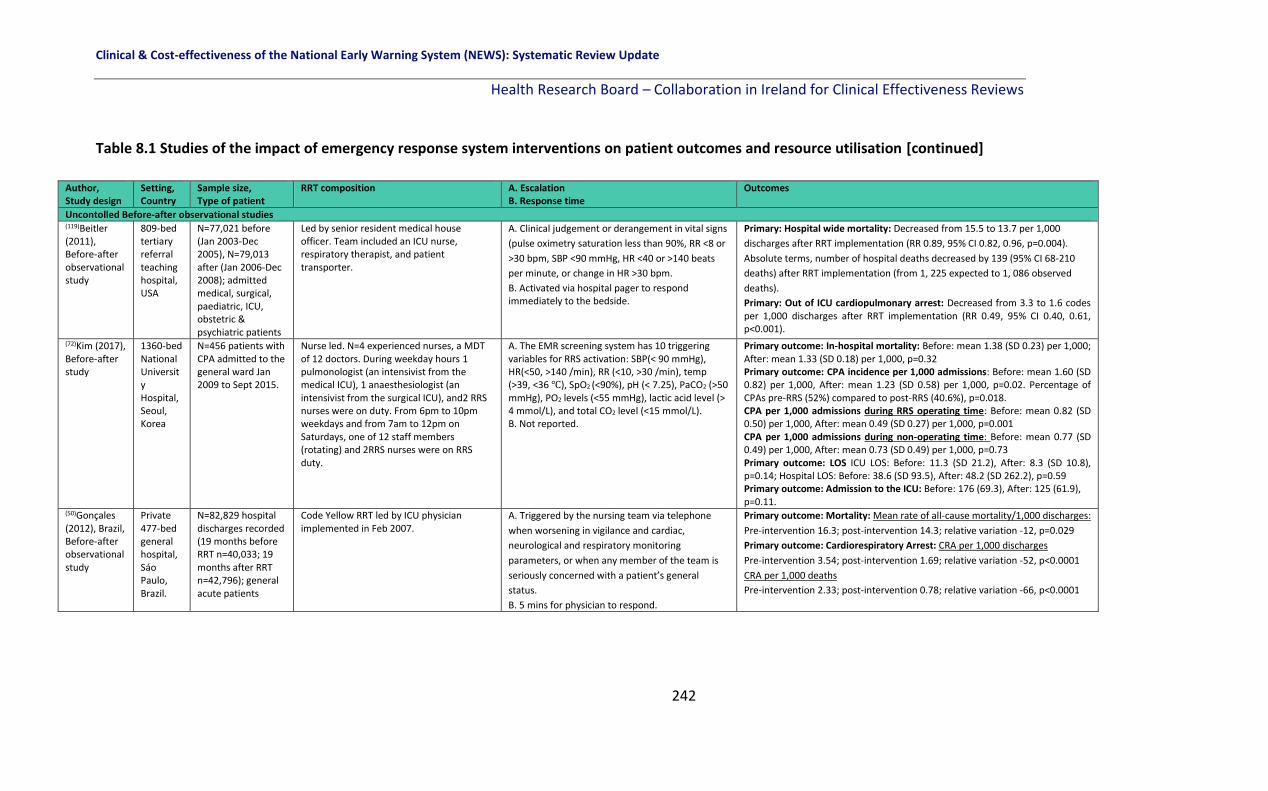
Clinical & Cost-effectiveness of the National Early Warning System (NEWS): Systematic Review Update
Health Research Board – Collaboration in Ireland for Clinical Effectiveness Reviews
242
Table 8.1 Studies of the impact of emergency response system interventions on patient outcomes and resource utilisation [continued]
Author, Study design
Setting, Country
Sample size, Type of patient
RRT composition A. Escalation B. Response time
Outcomes
Uncontolled Before-after observational studies (119)Beitler (2011), Before-after observational study
809-bed tertiary referral teaching hospital, USA
N=77,021 before (Jan 2003-Dec 2005), N=79,013 after (Jan 2006-Dec 2008); admitted medical, surgical, paediatric, ICU, obstetric & psychiatric patients
Led by senior resident medical house officer. Team included an ICU nurse, respiratory therapist, and patient transporter.
A. Clinical judgement or derangement in vital signs
(pulse oximetry saturation less than 90%, RR <8 or
>30 bpm, SBP <90 mmHg, HR <40 or >140 beats
per minute, or change in HR >30 bpm.
B. Activated via hospital pager to respond immediately to the bedside.
Primary: Hospital wide mortality: Decreased from 15.5 to 13.7 per 1,000
discharges after RRT implementation (RR 0.89, 95% CI 0.82, 0.96, p=0.004).
Absolute terms, number of hospital deaths decreased by 139 (95% CI 68-210
deaths) after RRT implementation (from 1, 225 expected to 1, 086 observed
deaths).
Primary: Out of ICU cardiopulmonary arrest: Decreased from 3.3 to 1.6 codes per 1,000 discharges after RRT implementation (RR 0.49, 95% CI 0.40, 0.61, p<0.001).
(72)Kim (2017), Before-after study
1360-bed National University Hospital, Seoul, Korea
N=456 patients with CPA admitted to the general ward Jan 2009 to Sept 2015.
Nurse led. N=4 experienced nurses, a MDT of 12 doctors. During weekday hours 1 pulmonologist (an intensivist from the medical ICU), 1 anaesthesiologist (an intensivist from the surgical ICU), and2 RRS nurses were on duty. From 6pm to 10pm weekdays and from 7am to 12pm on Saturdays, one of 12 staff members (rotating) and 2RRS nurses were on RRS duty.
A. The EMR screening system has 10 triggering variables for RRS activation: SBP(< 90 mmHg), HR(<50, >140 /min), RR (<10, >30 /min), temp (>39, <36 ℃), SpO2 (<90%), pH (< 7.25), PaCO2 (>50 mmHg), PO2 levels (<55 mmHg), lactic acid level (> 4 mmol/L), and total CO2 level (<15 mmol/L). B. Not reported.
Primary outcome: In-hospital mortality: Before: mean 1.38 (SD 0.23) per 1,000; After: mean 1.33 (SD 0.18) per 1,000, p=0.32 Primary outcome: CPA incidence per 1,000 admissions: Before: mean 1.60 (SD 0.82) per 1,000, After: mean 1.23 (SD 0.58) per 1,000, p=0.02. Percentage of CPAs pre-RRS (52%) compared to post-RRS (40.6%), p=0.018. CPA per 1,000 admissions during RRS operating time: Before: mean 0.82 (SD 0.50) per 1,000, After: mean 0.49 (SD 0.27) per 1,000, p=0.001 CPA per 1,000 admissions during non-operating time: Before: mean 0.77 (SD 0.49) per 1,000, After: mean 0.73 (SD 0.49) per 1,000, p=0.73 Primary outcome: LOS ICU LOS: Before: 11.3 (SD 21.2), After: 8.3 (SD 10.8), p=0.14; Hospital LOS: Before: 38.6 (SD 93.5), After: 48.2 (SD 262.2), p=0.59 Primary outcome: Admission to the ICU: Before: 176 (69.3), After: 125 (61.9), p=0.11.
(50)Gonçales (2012), Brazil, Before-after observational study
Private 477-bed general hospital, Sáo Paulo, Brazil.
N=82,829 hospital discharges recorded (19 months before RRT n=40,033; 19 months after RRT n=42,796); general acute patients
Code Yellow RRT led by ICU physician implemented in Feb 2007.
A. Triggered by the nursing team via telephone
when worsening in vigilance and cardiac,
neurological and respiratory monitoring
parameters, or when any member of the team is
seriously concerned with a patient’s general
status.
B. 5 mins for physician to respond.
Primary outcome: Mortality: Mean rate of all-cause mortality/1,000 discharges:
Pre-intervention 16.3; post-intervention 14.3; relative variation -12, p=0.029
Primary outcome: Cardiorespiratory Arrest: CRA per 1,000 discharges
Pre-intervention 3.54; post-intervention 1.69; relative variation -52, p<0.0001
CRA per 1,000 deaths
Pre-intervention 2.33; post-intervention 0.78; relative variation -66, p<0.0001

Clinical & Cost-effectiveness of the National Early Warning System (NEWS): Systematic Review Update
Health Research Board – Collaboration in Ireland for Clinical Effectiveness Reviews
243
Table 8.1 Studies of the impact of emergency response system interventions on patient outcomes and resource utilisation [continued]
Author, Study design
Setting, Country
Sample size, Type of patient
RRT composition A. Escalation B. Response time
Outcomes
Uncontrolled Before-after observational studies (128)Mathukia (2015), Retrospective before-after observational study
Easton comm-unity academic hospital, PA, USA.
N=272 patients admitted to all medical wards, telemetry and step-down units before (2010-2011) and N=454 after (2012-2014) MEWS protocol for escalation added. QIP data used to analyse data.
Doctor led. A hospitalist attending, a
third-year medical ICU resident, on-
call 1st and 2nd year medical residents,
and a surgical resident on-call, in
addition to a respiratory therapist,
and an ICU nurse.
A. Score 0-2: Continue routine monitoring of vital signs. Score 3: Continue 4 hourly vital sign monitoring and calculate MEWS score. If patient remains at ‘3’ for 3 consecutive readings, call the charge nurse to assess patient. Score 4: Inform charge nurse and patient’s physician. The charge nurse assesses the patients and notifies the nurse manager of patient’s status. Increase vital sign monitoring to 2-hr intervals and calculate the MEWS score. Measure intake and output and notify charge nurse if urinary output falls below 100 mL every 4 hours. Score 5: Inform physician and request assessment. Increase frequency of vital sign monitoring including pulse oximetry to hourly. If patient remains at ‘5’ for 3 consecutive readings, request transfer to higher level of care. Score ‘6+’: Call RRT and physician immediately. Transfer to higher level of care. B. No time reported.
Primary outcome: Inpatient mortality: Before: 2.3%, After: 1.2%. Primary outcome: Non-ICU code blue cardiac arrest: Before: 0.05 per 100 patient days, After: 0.02 per 100 patient days, (p<0.01) Primary outcome: Transfer to ICU: Before: 72%, After: 50% Secondary outcome: post hoc: RRT calls: Before: 0.3 per 100 patient days, After: 0.48 per 100 patient days (p<0.01)
(95)Moon (2011), Retrospective before-after observational study.
Freeman Hospital (FH) and Royal Victoria Hospital (RVH), Newcastle, UK.
N=213,117 before (2002-2005) and N=235,516 after (2006-2009), admitted to the ICU after receiving CPR.
Doctor led. Critical Care Outreach
Service (CCOS) established in 2001
consisting of 6 week-day sessions for
consultant intensivists, 2 senior ICU
nurses (1.5 whole time equivalents or
WTEs). Initially the service directly
supported geographically separate
high dependency unit (HDU) and the
hospital’s surgical wards. From Aug
2003 (when a new ICU opened) the
service expanded to cover other ward
areas and with 6.5 WTEs in 2005
became 24/7.
A. MEWS 1: 4-hourly observations, MEWS 2: 1-hourly observations, MEWS 3-5: minimum 1-hourly observations, MEWS>5 OR MEWS 3 in a single category OR MEWS<5 but serious concern: ½ hourly observations. B. MEWS 2: SHO within 30 mins, MEWS 3-5: SHO within 30 mins, continues to trigger: SPR within 30 mins. MEWS>5 OR MEWS 3 in a single category OR MEWS<5 but serious concern: SPR action within 30 mins – continues to trigger – home team consultant and ITU consultants called.
FH: Primary outcome: hospital deaths Before: 750/year (n=3,001); After: 697/year (n=2,789), a 7.1% reduction, p<0.0001. Primary outcome: Cardiac arrest: Before: 767/year, After: 584, p<0.0001 Primary outcome: Admissions to the ICU: Before: 857/year, After: 1,135/year RVH: Primary outcome: Hospital deaths Before: 952/year (n=3709), After: 906/year (n=3622), a 2.3% reduction. Primary outcome: Cardiac arrest: Before: 723 year, After: 669/year, p<0.0001, 7.5% decrease.

Clinical & Cost-effectiveness of the National Early Warning System (NEWS): Systematic Review Update
Health Research Board – Collaboration in Ireland for Clinical Effectiveness Reviews
244
Table 8.1 Studies of the impact of emergency response system interventions on patient outcomes and resource utilisation [continued]
Author, Study design
Setting, Country
Sample size, Type of patient
RRT composition A. Escalation B. Response time
Outcomes
Uncontrolled Before-after observational studies (129)Moriarty (2014), Before (Sept 2005-Aug 2006)-after (Mar 2008-Dec 2010) observational study.
2 acute care hospitals: the Mayo Centre, Rochester, the inpatient Mayo Clinic Psychiatry and Psychology Treatment centre, USA
All inpatients discharged between Sept 1st 2005 and 31st Dec 2010. N not reported.
Critical care nurse, critical
care fellow and respiratory
therapist. Supervised 24/7
by an in-house attending
level intensivist.
A. Any care provider may activate the RRT based on concern or physiologically-based criteria. B. Not reported.
Primary outcome: Hospital mortality rate: Before: 1.5%, After: 1.6% (p=0.30). Primary outcome: Unplanned ICU admission rate: Before: 13.7 transfers per 1,000 floor days, After: 15.2 transfers per 1,000 floor days (p<0.001)
(51)Hayani (2011), Retrospective before-after observational study
Ottawa University teaching hospital, Canada.
N=814 patients with hematopoietic stem cell transplants (HSCT), (n=520 pre-RACE team, n=294 post-RACE team).
Nurse led. A critical care nurse, respiratory therapist and medical doctor. A staff intensivist is available during 0800–1700 and a senior resident or fellow is available at night and on weekends with the support of a staff intensivist.
A. RACE calls were initiated by any HCP using specific criteria: 1)
Airway Threatened, stridor, excessive secretions; 2) Breathing
RR<=8/min or >=30/min; 3) Circulation systolic BP <90 or
>200mmHg, or drop of >40mmHg, HR <40/min or >130/min, 4)
Level of Consciousness Decreased or GCS reduced by >2 points;
5) SpO2 <90% on 50% FiO2, or patient requires at least 6 l/min
supplemental O2; 6) Urine output <100 c.c. over 4 h (except
dialysis patients); 7) Staff ‘worried’, about patient, needs
assistance, failure to respond to therapy.
B. The RACE team responds to all urgent ward-based calls and provides follow-up care to all patients previously admitted to ICU for at least 2 days after discharge from ICU.
Secondary outcome: Clinical deterioration in a sub-population Non-relapse mortality by day 100 after transplant: Pre-RACE: 26 (10.2%); Post-RACE: 53 (8.8%), p=0.62 Non-relapse mortality by day 100 after transplant in allogeneic recipients (non-identical donors): Pre-RACE: 22.5% ; Post-RACE: 18.2%, p=0.25 Admission to the ICU Pre-RACE: 64 (12.3%);Post-RACE: 42 (14.3%), p=0.44
(39)Mullany (2016), Retrospective observational before-after study.
Prince Charles 630-bed tertiary university referral hospital, Brisbane, Australia.
N=161,153 observations from July 2008- Dec 2012. Pre-MET n=44,505 observations, post-MET n=116,648.
Nurse led. MET team: ICU nurse, ICU medical officer, general medical trainee. CAT team included: 2 clinicians and cardiology trainees.
A. MEWS≥4 – Nurse to contact nurse unit manager for review; MEWS≥6 – Nurse to contact nurse unit manager, nurse to contact registrar for review; MEWS ≥8 - Nurse to contact nurse unit manager and MET. B. Review within 30 mins.
Primary outcome: All-cause hospital mortality rate: Before: 14/1,000, After 11.8/1,000 (absolute change 2.2/1,000, 95% CI 1-3.5/1,000, p=0.003). Primary outcome: In-hospital cardiac arrest rate: Before 5.5/1,000, After 3.3/1,000 (absolute change 2.2/1,000, 95% CI 1.4-3, p≤0.001). Primary outcome: Hospital LOS: Before 5.9 days, After: 4.9 overall. Primary outcome: unplanned ICU admission: Before: 41 admissions, After 121 admissions However average LOS in the ICU decreased from 140 hours (before) to 95 hours (after).

Clinical & Cost-effectiveness of the National Early Warning System (NEWS): Systematic Review Update
Health Research Board – Collaboration in Ireland for Clinical Effectiveness Reviews
245
Table 8.1 Studies of the impact of emergency response system interventions on patient outcomes and resource utilisation [continued]
Author, Study design
Setting, Country
Sample size, Type of patient
RRT composition A. Escalation B. Response time
Outcomes
Uncontrolled Before-after observational studies
Massey et al
(2015),(46)
Retrospective
before-after
observational
study.
480-bed
Gold Coast
Hospital, a
tertiary
teaching
hospital
based in
Queenslan
d, Australia
N=150 adult general
medical ward
patients admitted
Jan –Mar 2008 (pre-
RRS intervention)
and N=150
randomly selected
patients admitted
between August –
October 2008 (post
RRS intervention –
introduction of an
after-hours Clinical
Team Co-ordinator
in July 2008)
Nurse led. The after-hours Clinical Team Co-Ordinator (CTC) service was provided by six experienced acute care nurses who supported ward nurses and other members of the multi-disciplinary team A high capability
team is physician-
led. The Medical
Emergency Team
(MET)is an example
of a high capability
team
A. Two-tiered RRS. The after-hours Clinical Team Co-ordinator was introduced in 2008 to provide a rapid response to assist clinicians throughout the hospital. The after-hours Clinical Team Co-ordinator was the first tier of the RRS and was activated by nursing staff in the hospital after-hours (14.00 hrs – 7.30 hrs, 7 days a week). The second tier of the hospital’s RRS was the MET. The after-hours Clinical Team Co-ordinator activated the MET if a patient continued to deteriorate and required further escalation of care. The after-hours Clinical Team Co-ordinator service was provided by 6 experienced critical care nurses who supported ward nurses and other members of the multidisciplinary team after hours to respond to patient deterioration. Criteria for activation: Drop of GCS of >2; SpO2 <90%, SBP <90mmHg, Temp >38.0 or <35.0; Urinary output <0.5ml/kg/h; RR>25 or <10; HR >110 or <50 BPM. B. Not reported.
Secondary outcome post-hoc: Major events (including unplanned admission to the ICU, death and cardiac arrest) Unplanned admission to the ICU: Pre: 7 (4.6%) Post: 8 (5.3%) Death: Pre: 0 (0%) Post: 6 (4.0%) Cardiac arrest: Pre: 0 (0%) Post: 4 (2.6%), p=0.01 (of major adverse event) Secondary outcome post hoc composite outcomes: defined as myocardial infarction, DVT, PE, cerebral vascular accident, operating theatre, adverse drug reaction, hospital accident/injury, HCAI/sepsis, other adverse event, major adverse event. Pre: 32/150 (21.3%); Post: 36/150 (24.7%), p=0.58
(63)Sabahi
(2012),
Prospective
before-after
intervention
study.
300-bed
private
hospital,
Tehran,
Iran.
N=25,348
admissions before
RRT (2008) and
N=28,024 after
(2010).
Doctor led. 1
doctor, 1 senior
intensive care nurse
and 1 staff nurse
A. Criteria for RRT activation displayed prominently in each ward. RRT was activated by a pager call and by a public announcement internal communication call C Code to Ward X. Criteria: Airway Respiratory Distress, Wheezing, Congestion Breathing RR > 24 /min, RR < 8 /min, Saturation O2 < 90% on O2, FiO2 > 50%, Circulation Systolic BP < 90 mm-Hg, HR < 40/min, HR > 130/min, Significant Bleeding, Neurologic Changes in Consciousness Seizure, Other Chest Pain Uncontrolled pain, Restlessness. B. RRT initiated and completed a variety of therapeutic, investigational and procedural interventions. No specific time frame given.
Primary outcome: In-hospital deaths: Before: 274 (73.2%) After: 231 deaths (66.2%), Relative Risk Reduction, 16%; p=0.004. Primary outcome: Unexpected cardiac Arrest: Before: 431 After: 349, Relative Risk Reduction 19%; p=0.003.

Clinical & Cost-effectiveness of the National Early Warning System (NEWS): Systematic Review Update
Health Research Board – Collaboration in Ireland for Clinical Effectiveness Reviews
246
Table 8.1 Studies of the impact of emergency response system interventions on patient outcomes and resource utilisation [continued]
Author, Study design
Setting, Country
Sample size, Type of patient
RRT composition A. Escalation B. Response time
Outcomes
Uncontrolled Before-after observational studies (134)Salvatierra
(2014),
Before-after
observational
study.
Ten acute tertiary care hospitals, Washington, USA.
N=235,718 31-months before RRT and N=235,344 31-months after RRT. Study period Sept 2001 – Dec 2009.
Team compositions varied between the 10 hospitals: including critical care registered nurses, respiratory therapists, ED registered nurses, and medical doctors.
A. Anyone could escalate across all 10 hospitals including staff, carer or family concerns. B. Response times of between 5 mins and 15 mins across the 10 hospitals.
Primary outcome: In-hospital mortality: 6/10 hospitals showed a decrease in mortality post RRT, while four hospitals did not. Overall: RR: 0.76 (0.72-0.80), p<0.001.
Sebat et al
(2018),(157)
prospective
single-centre
before-after
study
Adult general nursing units at a 500-bed community regional hospital, California, USA
N=28,914 medical/surgical patients admitted during the control period consisting of 24 months (Jan 2008– Dec 2009), and N=39,802 patients admitted during the 33-month intervention period (Jan 2011, to Sept 2013).
Nurse led. In 2005 the hospital implemented a general ward conventional RRS, which consisted of the bedside nurse, a critical care trained RN (CCRN), respiratory therapist, pharmacist, and lab technician.
A. Changes in any 2 of the following activated the RRT: SBP<90, RR <6 or >20, altered LOC, pain and SpO2 <90%, Capillary refill >3 secs, urinary output <30mL/hr or 100mL/4hr or 300 mL/12 hr; Base deficit or lactic acid >-5 meg or LA > 2.0 meq, Temp <36 degrees Celsius. Intervention changed the RRS to a 4-arm RRS including 1) afferent arm [expansion of vital signs, changes in nursing policies for escalation, mandatory education programme]; 2) Efferent arm [expansion of the RRT to include a critical care RN and standardised procedures were developed]; 3) Quality assurance arm: complete data collection and system compliance and improvement implemented; 4) Administrative arm [expanded in personnel and scope] B. Not reported.
Primary outcome: Cardiac arrest per 1,000 discharges Pre-intervention: 3.1 per 1,000 Post-intervention: 2.4 per 1,000, p=0.04 Primary outcome: Unadjusted hospital mortality rate Pre-intervention: 3.7% Post-intervention: 3.2%, p<0.001 Secondary outcome post hoc : Resource utilisation RRT calls per 1,000 discharges Pre-intervention: 10.2 per 1,000 Post-intervention: 48.8 per 1,000, p<0.001
(135)Segon (2014), Before-after intervention study.
367-bed community teaching hospital, USA.
N=213 RRT calls. Medical and surgical patients admitted Jan 2004 to Apr 2006.
Doctor led. An admitting senior resident in the ICU, an ICU nurse, and a respiratory therapist.
A. Criteria for activating RRT: Acute change in HR to <40 beats/min or >130 beats/min, Change in SBP <90 mm Hg, Acute change in RR <6 breaths/min or >30 breaths/min, Change in breathing pattern (regularity/depth), Acute change in pulse oximetry (<90% SpO2 on oxygen), Acute decrease in urine output, New onset/prolonged seizures, Unexplained change in mental status, Nursing concern or Family concern regarding patient status B. No response time given. Team members carried a dedicated rapid response pager
that was signed out before each shift. All activations of the rapid response were
recorded in the rapid response log, which was signed by the senior resident and was
collected and reviewed in monthly rapid response team meetings.
Primary outcome: Mortality: Pre-intervention: 3.1% (439 of 14,013) Post-intervention: 2.9% (417 of 14,333), p=0.27. Primary outcome: Unexpected ICU transfers Pre-intervention: 15.8% (295 of 1,866) Post-intervention: 15.5% (258 of 1,663), p=0.80. Secondary outcome: Post-hoc: Number of code blue calls: Pre-intervention: 3.09 per 1,000 Post-intervention: 2.89 per 1,000 discharges per year (p=0.14).
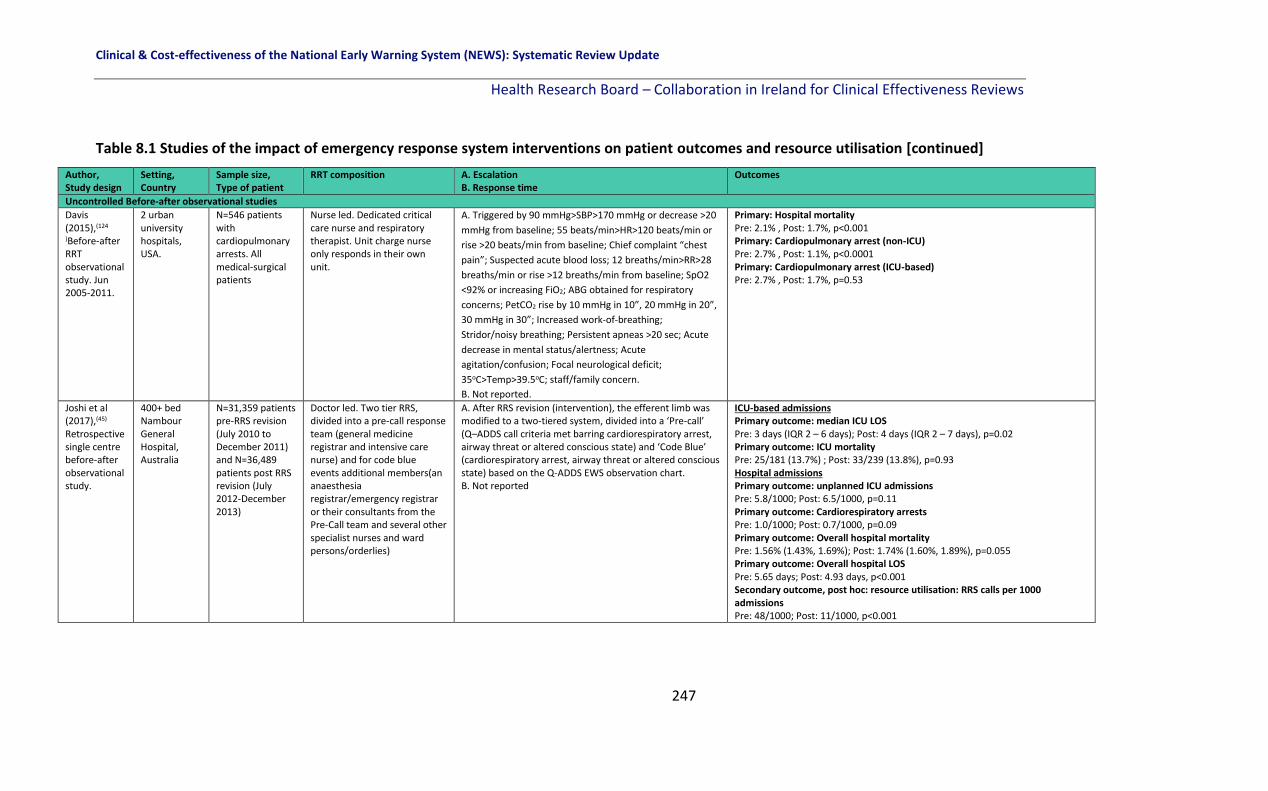
Clinical & Cost-effectiveness of the National Early Warning System (NEWS): Systematic Review Update
Health Research Board – Collaboration in Ireland for Clinical Effectiveness Reviews
247
Table 8.1 Studies of the impact of emergency response system interventions on patient outcomes and resource utilisation [continued]
Author, Study design
Setting, Country
Sample size, Type of patient
RRT composition A. Escalation B. Response time
Outcomes
Uncontrolled Before-after observational studies
Davis (2015),(124
)Before-after RRT observational study. Jun 2005-2011.
2 urban university hospitals, USA.
N=546 patients with cardiopulmonary arrests. All medical-surgical patients
Nurse led. Dedicated critical care nurse and respiratory therapist. Unit charge nurse only responds in their own unit.
A. Triggered by 90 mmHg>SBP>170 mmHg or decrease >20
mmHg from baseline; 55 beats/min>HR>120 beats/min or
rise >20 beats/min from baseline; Chief complaint “chest
pain”; Suspected acute blood loss; 12 breaths/min>RR>28
breaths/min or rise >12 breaths/min from baseline; SpO2
<92% or increasing FiO2; ABG obtained for respiratory
concerns; PetCO2 rise by 10 mmHg in 10”, 20 mmHg in 20”,
30 mmHg in 30”; Increased work-of-breathing;
Stridor/noisy breathing; Persistent apneas >20 sec; Acute
decrease in mental status/alertness; Acute
agitation/confusion; Focal neurological deficit;
35oC>Temp>39.5oC; staff/family concern.
B. Not reported.
Primary: Hospital mortality Pre: 2.1% , Post: 1.7%, p<0.001 Primary: Cardiopulmonary arrest (non-ICU) Pre: 2.7% , Post: 1.1%, p<0.0001 Primary: Cardiopulmonary arrest (ICU-based) Pre: 2.7% , Post: 1.7%, p=0.53
Joshi et al (2017),(45) Retrospective single centre before-after observational study.
400+ bed Nambour General Hospital, Australia
N=31,359 patients pre-RRS revision (July 2010 to December 2011) and N=36,489 patients post RRS revision (July 2012-December 2013)
Doctor led. Two tier RRS, divided into a pre-call response team (general medicine registrar and intensive care nurse) and for code blue events additional members(an anaesthesia registrar/emergency registrar or their consultants from the Pre-Call team and several other specialist nurses and ward persons/orderlies)
A. After RRS revision (intervention), the efferent limb was modified to a two-tiered system, divided into a ‘Pre-call’ (Q–ADDS call criteria met barring cardiorespiratory arrest, airway threat or altered conscious state) and ‘Code Blue’ (cardiorespiratory arrest, airway threat or altered conscious state) based on the Q-ADDS EWS observation chart. B. Not reported
ICU-based admissions Primary outcome: median ICU LOS Pre: 3 days (IQR 2 – 6 days); Post: 4 days (IQR 2 – 7 days), p=0.02 Primary outcome: ICU mortality Pre: 25/181 (13.7%) ; Post: 33/239 (13.8%), p=0.93 Hospital admissions Primary outcome: unplanned ICU admissions Pre: 5.8/1000; Post: 6.5/1000, p=0.11 Primary outcome: Cardiorespiratory arrests Pre: 1.0/1000; Post: 0.7/1000, p=0.09 Primary outcome: Overall hospital mortality Pre: 1.56% (1.43%, 1.69%); Post: 1.74% (1.60%, 1.89%), p=0.055 Primary outcome: Overall hospital LOS Pre: 5.65 days; Post: 4.93 days, p<0.001 Secondary outcome, post hoc: resource utilisation: RRS calls per 1000 admissions Pre: 48/1000; Post: 11/1000, p<0.001

Clinical & Cost-effectiveness of the National Early Warning System (NEWS): Systematic Review Update
Health Research Board – Collaboration in Ireland for Clinical Effectiveness Reviews
248
Table 8.1 Studies of the impact of emergency response system interventions on patient outcomes and resource utilisation [continued]
Author, Study design
Setting, Country
Sample size, Type of patient
RRT composition A. Escalation B. Response time
Outcomes
Uncontrolled Before-after observational studies (53)Scherr (2012), Before-after observational study.
267-bed community general hospital (A) and 259-bed community general hospital (B). Canada
N=255 adults with a RRT call in both hospitals. Included medical, surgical and small sample of obstetric and paediatric patients.
Nurse led. RRT in both hospitals was to include a NP, an ICU RN, and a respiratory therapist. In cases where the NP was absent a clinical associate physician or intensivist was to respond to RRT calls. ICU attending physicians were always available for consultation.
A. Hospital A RRT operated 24 hrs a day whilst Hospital B RRT operated 12 hrs a day. Triggers for RRT call included: change in level of consciousness, breathing issues, blood pressure issues, worried about patient as condition deterioration noted, heart rate issues, and airway concerns B. No response time reported or action plan.
Hospital A: Primary outcome: CPA: Before: 2.52 per 1,000, After: 1.68 per 1,000, p=0.39 Primary outcome: Unplanned ICU admissions: Before: 6.52 per 1,000, After: 6.13 per 1,000, p=0.21. Primary outcome: Hospital mortality: Before: 37.83 per 1,000, After: 41.74 per 1,000, p=0.17.
Hospital B: Primary outcome: CPA: Before: 2.7 per 1,000 discharges, After: 2.6 per 1,000, p=0.84 Primary outcome: Unplanned ICU admissions: Before: 10.9 per 1,000, After: 7.12 per 1,000, p=0.10. Primary outcome: Hospital mortality: Before: 29.43 per 1,000, After: 24.95 per 1,000, p=0.06.
(81)Simmes (2012), Retrospective before-after observational study.
University hospital, The Netherlands.
N=1,376 (before 2-tier MET, Jan to Dec 2006) and n=2,410 (after 2-tier MET, Apr 2007 – Apr 2009), general surgery patients.
Physician-led team including a critical care physician and a critical care nurse and was accessible 24/7.
A. The RRS included a 2-tiered MET calling protocol. In the 1st tier, nurses had to call the ward physician immediately if one of the EWS criteria was met: RR<8 or >30 per minute, SpO2<90%, SBP<90 or >200 mmHg, HR<40 or >130 per minute, a decrease of 2 points in the eye, motor, verbal (EMV) score or if the nurse felt worried about the patient’s condition. B. The ward physician had to evaluate the patient at the bedside within 10 min. In the second tier the ward physicians activated the MET immediately if a serious situation existed or if the patient did not stabilize after an initial intervention.
Primary outcome: Unexpected deaths: Before: 0.36% (5/1,376), After: 0.17% (4/2,410), OR 0.42, 95% CI 0.11-1.59. Primary outcome: Cardiac arrest: Before: 0.29% (4/1,367), After: 0.12% (3/2,410), OR 0.38, 95% CI 0.09-1.73. Primary outcome: Unplanned ICU admissions: Before: 2.47% (34/1,376), After: 4.15% (100/2,410), OR 1.66, 95% CI 1.07-2.55.

Clinical & Cost-effectiveness of the National Early Warning System (NEWS): Systematic Review Update
Health Research Board – Collaboration in Ireland for Clinical Effectiveness Reviews
249
Table 8.1 Studies of the impact of emergency response system interventions on patient outcomes and resource utilisation [continued]
Author, Study design
Setting, Country
Sample size, Type of patient
RRT composition A. Escalation B. Response time
Outcomes
Uncontrolled Before-after observational studies (82)Simmes (2013), Prospective before-after observational study
University hospital, The Netherlands
A convenience sample of 518 of 1,376 eligible patients (before MET) was screened for participation and 2,549 of 2,410 patients (after MET). Surgical patients.
The MET included a critical care physician and a critical care nurse. The RRS system was introduced in Jan 2007 and was fully operational by Apr 2007. The system required ward nurses to systematically observe and record patient’s vital signs at least three times daily.
A. If nurses felt worried about a patient’s condition or observed abnormal vital indicators, and then they were instructed to immediately call the ward physician. Abnormal vital indicators included RR<8 or >30 per minute, SpO2 <90%, SBP<90 or >200 mm Hg, HR<40 or >130 per minute, and a decrease of 2 points in the eye, motor, and verbal (EMV) score, GCS. B. Once called, the ward physician was required to evaluate the patient at bedside within 10 mins and to immediately call the MET if the patient’s condition was serious or if the patient did not stabilise after an initial intervention.
Secondary outcome: PROMS: Health-related quality of life (HRQOL) which was measured using the EuroQol 5 dimensions (EQ-5D) and EuroQol visual analogue scale (EQ-VAS) questionnaires. EQ-5D index 0.72 versus 0.73, p=0.54 at 3 months following surgery, 0.70 versus 0.72, p=0.29 at 6 months following surgery. EQ-VAS mean scores 67 versus 65, p=0.28 at 3 months following surgery 67 versus 67, p=0.80 at 6 months following surgery.

Clinical & Cost-effectiveness of the National Early Warning System (NEWS): Systematic Review Update
Health Research Board – Collaboration in Ireland for Clinical Effectiveness Reviews
250
Table 8.1 Studies of the impact of emergency response system interventions on patient outcomes and resource utilisation [continued]
Author, Study design
Setting, Country
Sample size, Type of patient
RRT composition A. Escalation B. Response time
Outcomes
Uncontrolled Observational cohort studies (52)Karvellas (2011), Retrospective cohort study.
University of Alberta Hospital, Canada.
N=1,920 patient admissions between Jul 2002 – Dec 2009 to the ICU.
Intensivist-led (IL) MET implemented Feb 2007, 8am-4pm, Monday-Friday. Outside of these hours, the 24hr non-IL-MET team was led by the resident, nurse or respiratory therapist, who consulted the on-call consultant intensivist.
A. Any HCP could activate MET. Calling criteria included: acute change to RR (<8 or >36 breaths/min), acute change in SpO2 <90%, HR (<40, >140 beats/min), systolic BP <90 mmHg, change in level of consciousness, staff concern. B. Response expected within 15 mins. MET performs a rapid assessment, orders appropriate diagnostic tests and initiates treatment as necessary. Within 30 mins a decision is to be made on whether the patient should be transferred to ICU or safely managed on the ward.
Primary outcome: In-hospital mortality: Period 1 – CONTROL- NO MET TEAM (N=479) Non-IL-MET hours: n=104 (30.9%)IL-MET hours: 44 (30.8%), p=0.97. Period 2 – PARTIAL MET TEAM (N=640) Non-IL-MET hours: n=143 (31.4%) IL-MET hours: N=64 (34.6%), p=0.44. Period 3 – HOSPITAL WIDE IL MET TEAM (N=801) Non-IL-MET hours: n=195 (35.9%) IL-MET hours: N=78 (30.1%), p=0.10. Comparison between Period 1 and 3: p=0.24 Primary outcome: ICU-LOS Period 1 – CONTROL- NO MET TEAM (N=479) Non-IL-MET hours: 5 (2-10 days) IL-MET hours: 5 (2-9 days), p=0.92. Period 2 PARTIAL MET TEAM (N=640) Non-IL-MET hours: 5 (2-9 days) IL-MET hours: 5 (3-10 days), p=0.44. Period 3 HOSPITAL WIDE IL-MET TEAM (N=801) Non-IL-MET hours: 5 (2-11 days) IL-MET hours: 5 (3-9 days), p=0.87. Comparison between Period 1 and 3: p=0.20
Primary outcome: Hospital-LOS: Period 1 – CONTROL- NO MET TEAM (N=479) Non-IL-MET hours: 25 (13-47 days) IL-MET hours: 26 (13-54 days), p=0.53. Period 2 PARTIAL MET TEAM (N=640) Non-IL-MET hours: 25 (14-51 days) IL-MET hours: 28 (14-52 days), p=0.43. Period 3 HOSPITAL WIDE IL-MET TEAM (N=801) Non-IL-MET hours: 28 (14-55 days) IL-MET hours: 29 (15-55 days), p=0.53. Comparison between Period 1 and 3: p=0.06

Clinical & Cost-effectiveness of the National Early Warning System (NEWS): Systematic Review Update
Health Research Board – Collaboration in Ireland for Clinical Effectiveness Reviews
251
Table 8.1 Studies of the impact of emergency response system interventions on patient outcomes and resource utilisation [continued]
Author, Study design
Setting, Country
Sample size, Type of patient
RRT composition A. Escalation B. Response time
Outcomes
Uncontrolled Observational cohort studies (127)Kollef (2017), Retrospective observational cohort study.
Barnes-Jewish Hospital, a 1250-bed academic hospital, Missouri, USA.
N=163,311 consecutive patients admitted to 8 adult general wards.
Nurse led. A registered nurse, a 2nd or 3rd-year internal medicine resident, and a respiratory therapist. Prior to 2011, the RRS nurse was pulled from the staff of one of the hospital’s ICUs in a rotating manner to respond to RRS calls as they occurred. Starting in 2012, the RRS team nurse member was established as a dedicated position without other clinical responsibilities.
A. RRS activations between 2006 and 2008 were initiated by the nursing staff on the general medicine units as part of routine nursing practice. Starting in 2009, RRS activations could be initiated by the nursing staff as well as by real-time clinical deterioration alerts (RTCDAs). B. The RRS nurse carries a hospital-issued mobile phone to which the RTCDAs were sent and was instructed to respond to all alerts within 20 mins of their receipt. The RRS nurse would initially evaluate the alerted patient using the MEWS and make further clinical and triage decisions based on those criteria and discussions with the RRS physician or the patient’s treating physicians.
Primary outcome: Hospital mortality: Before (2003): 2.87 per 1,000, After (2014): 2.22 per 1,000. Year-to-year decrease from 2003-2014, (p=0.002). Primary outcome: Cardiopulmonary arrests (CPAs): Before (2005): 57, After (2014): 35. Year-to-year decrease from **2005-2014, (p=0.006). Primary outcome: Hospital LOS: 2003 Median LOS: 3.79 days (IQR 2.02, 6.81), 2014 Median LOS: 3.10 days (IQR1.75, 5.82). Year-to-year decrease from 2003-2014, (p=0.001). Secondary outcomes: post-hoc: RRS activations: Activations 2006: n=72, Activations 2014: n=370. Significant increase year on year (r=0.939, p<0.001).
(130)Moroseos (2014), Retrospective cohort using historical controls study design.
413-bed county teaching hospital, USA.
N=7,092 admissions before RRT (Jan 2000-Dec 2004) and N=9,357 admissions after (Jan 2007-Dec 2011), Burn surgery/acute care ward.
Nurse led. The RRT system comprises primary and secondary response teams. The primary response consists of a designated STAT or ICU nurse along with the charge respiratory therapist. The secondary response team includes a medical ICU fellow from 7:30 am until 5:30 pm and a medical ICU R3 at other times of the day, 7 days a week
A. A patient may exhibit one or more of the clinical symptoms to qualify for RRT activation. When a nurse or a patient’s family member was concerned about the condition of a patient or felt that a patient needs immediate intervention secondary to the presence of early warning signs, they could call the RRT by dialling the STAT page operator. Criteria included: Airway: Stridor—noisy airway; Breathing: RR: <12 or >32, Increased effort to breathe; O2: sat <92 with increased O2 Requirements; ABG orders for respiratory concerns; Chest pain; Circulation: HR <55 or >120; SBP <90 or >170 Transfusion >4U PRBC in last 24 hr; Decrease in HCT by more than 6 points in last 24 hr; Temp change <35 or >39.5°C; Conscious state Agitation, restlessness; B. The patient’s primary team is notified simultaneously and the RRT members concurrently gather at the patient’s bedside.
Primary outcome: Mortality: Total Deaths per 1,000 admissions Before RRT: 4.5, After RRT: 3.3 p=0.11 Primary outcomes: unplanned ICU transfers: Before RRT: 52 per 1,000, After RRT: 42 per 1,000, p=0.01. Secondary outcome post-hoc: Code blue activations (defined as respiratory arrest or cardiopulmonary arrest requiring tracheal intubation and/or chest compressions). Code Blue Activations: Before RRT: 10 per 1,000 admissions, After RRT: 4 per 1,000 admissions p=0.04
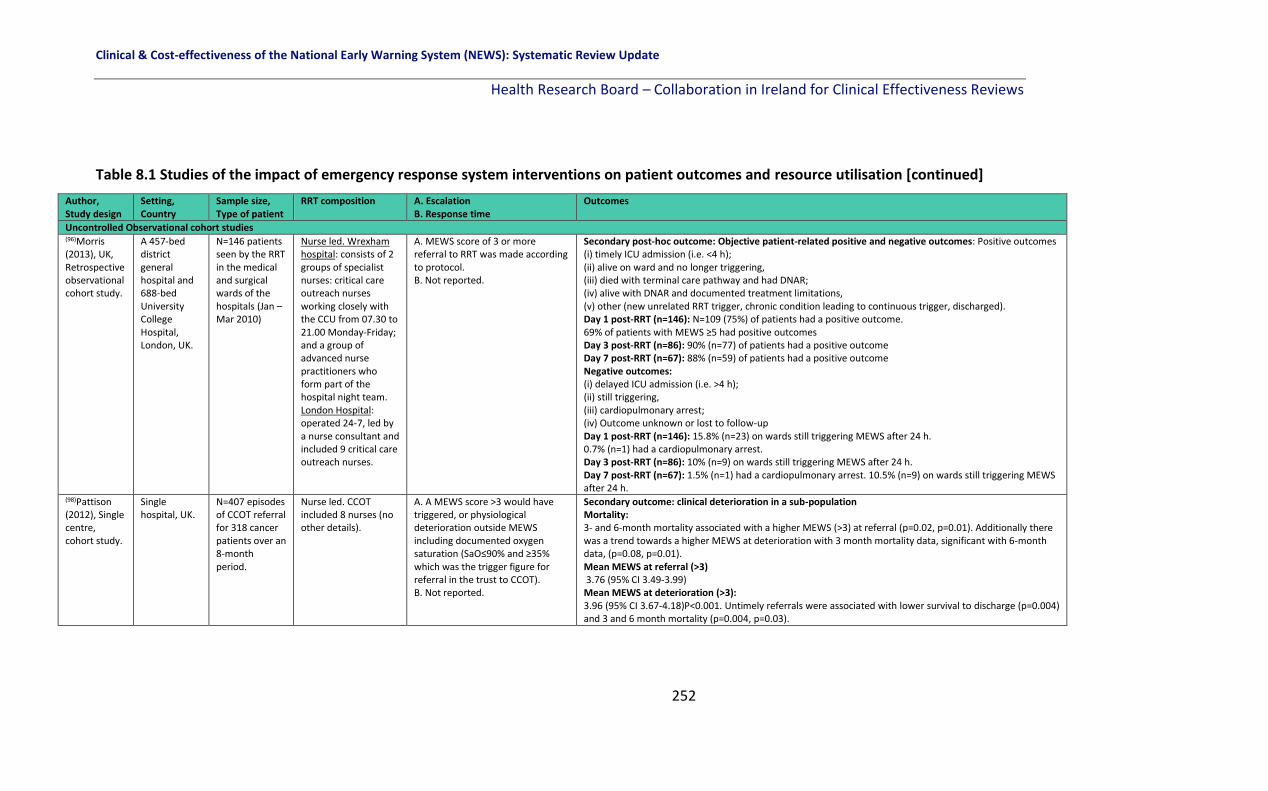
Clinical & Cost-effectiveness of the National Early Warning System (NEWS): Systematic Review Update
Health Research Board – Collaboration in Ireland for Clinical Effectiveness Reviews
252
Table 8.1 Studies of the impact of emergency response system interventions on patient outcomes and resource utilisation [continued]
Author, Study design
Setting, Country
Sample size, Type of patient
RRT composition A. Escalation B. Response time
Outcomes
Uncontrolled Observational cohort studies (96)Morris (2013), UK, Retrospective observational cohort study.
A 457-bed district general hospital and 688-bed University College Hospital, London, UK.
N=146 patients seen by the RRT in the medical and surgical wards of the hospitals (Jan – Mar 2010)
Nurse led. Wrexham hospital: consists of 2 groups of specialist nurses: critical care outreach nurses working closely with the CCU from 07.30 to 21.00 Monday-Friday; and a group of advanced nurse practitioners who form part of the hospital night team. London Hospital: operated 24-7, led by a nurse consultant and included 9 critical care outreach nurses.
A. MEWS score of 3 or more referral to RRT was made according to protocol. B. Not reported.
Secondary post-hoc outcome: Objective patient-related positive and negative outcomes: Positive outcomes (i) timely ICU admission (i.e. <4 h); (ii) alive on ward and no longer triggering, (iii) died with terminal care pathway and had DNAR; (iv) alive with DNAR and documented treatment limitations, (v) other (new unrelated RRT trigger, chronic condition leading to continuous trigger, discharged). Day 1 post-RRT (n=146): N=109 (75%) of patients had a positive outcome. 69% of patients with MEWS ≥5 had positive outcomes Day 3 post-RRT (n=86): 90% (n=77) of patients had a positive outcome Day 7 post-RRT (n=67): 88% (n=59) of patients had a positive outcome Negative outcomes: (i) delayed ICU admission (i.e. >4 h); (ii) still triggering, (iii) cardiopulmonary arrest; (iv) Outcome unknown or lost to follow-up Day 1 post-RRT (n=146): 15.8% (n=23) on wards still triggering MEWS after 24 h. 0.7% (n=1) had a cardiopulmonary arrest. Day 3 post-RRT (n=86): 10% (n=9) on wards still triggering MEWS after 24 h. Day 7 post-RRT (n=67): 1.5% (n=1) had a cardiopulmonary arrest. 10.5% (n=9) on wards still triggering MEWS after 24 h.
(98)Pattison (2012), Single centre, cohort study.
Single hospital, UK.
N=407 episodes of CCOT referral for 318 cancer patients over an 8-month period.
Nurse led. CCOT included 8 nurses (no other details).
A. A MEWS score >3 would have triggered, or physiological deterioration outside MEWS including documented oxygen saturation (SaO≤90% and ≥35% which was the trigger figure for referral in the trust to CCOT). B. Not reported.
Secondary outcome: clinical deterioration in a sub-population Mortality: 3- and 6-month mortality associated with a higher MEWS (>3) at referral (p=0.02, p=0.01). Additionally there was a trend towards a higher MEWS at deterioration with 3 month mortality data, significant with 6-month data, (p=0.08, p=0.01). Mean MEWS at referral (>3) 3.76 (95% CI 3.49-3.99) Mean MEWS at deterioration (>3): 3.96 (95% CI 3.67-4.18)P<0.001. Untimely referrals were associated with lower survival to discharge (p=0.004) and 3 and 6 month mortality (p=0.004, p=0.03).

Clinical & Cost-effectiveness of the National Early Warning System (NEWS): Systematic Review Update
Health Research Board – Collaboration in Ireland for Clinical Effectiveness Reviews
253
Table 8.1 Studies of the impact of emergency response system interventions on patient outcomes and resource utilisation [continued]
Author, Study design
Setting, Country
Sample size, Type of patient
RRT composition A. Escalation B. Response time
Outcomes
Uncontrolled Observational cohort studies (136)Shah (2011), Retrospective cohort study.
2 Texan hospitals, USA. Pre-intervention: Jan 2005-Sept 2005; Post intervention- Apr 2006-Dec 2006; Post intervention2:Jan 2007 – Sept 2007; Post intervention: Oct 2007-Jun 2008
N=231,305 patient days (70,208 pre, 161,097 post), N=16,244 admissions (pre), N=41,145 (post).
Nurse led. Code team is composed of three senior internal medicine residents, an anaesthesiology resident, 2 critical care nurses, and a respiratory therapist. It provides 24-h/7-d assistance for patients with CPA. After reviewing the composition of RRS at different hospitals reported in the literature, the Committee formalised an RRT composed of an experienced critical care nurse and a respiratory therapist.
A. The trigger points for activation were similar to those reported in the literature: RR >24/min, SpO2
<90%, HR>130/min, SBP<90 mmHg, change in mental status, or a concerned staff member, increase in FiO2
>50% or threatened airway. Staff members on all inpatient facilities were educated on the triggers for RRT activation. B. Not reported.
Primary outcome: Overall hospital mortality: Pre-intervention: 2.4% Post intervention1: 2.06% Post intervention2: 1.94% Post intervention3: 2.46% Total post-intervention: 2.15%, p=0.05 Secondary outcome: Post-hoc: Codes/1,000 patient days Pre-intervention: 0.83 per 1,000 Post intervention1: 0.97 Post intervention2: 1.07 Post intervention3: 0.89 Total post-intervention: 0.98, p=0.30
(117)Albert (2011), Retrospective observational cohort QIP study
2 telemetry units, tertiary teaching hospital, USA
N=140 patients with code blue or RRT calls.
Nurse-led RRT including intensive care unit (ICU) resident, the medical ICU (MICU) charge nurse, and the respiratory therapist.
A. An electronic MEWS score of 3 or more was the trigger for action by nursing staff for referral to the RRT. B. Not reported but once reviewed, re-assess within 4 hours again.
Secondary outcome: post hoc: Number of code blue calls and RRT calls: 33% reduction in code blue calls 6-months after MEWS and RRT and 50% increase in RRT calls.
Key: ABG: Arterial blood gas; AVPU: Alert, voice, pain, unresponsive; CAT: Cardiac Arrest Team; CCOS/T: Critical care outreach service/team; CCU: Critical care Unit; CPA: Cardio pulmonary arrest; CPR: Cardiopulmonary resuscitation; CRA: Cardio-respiratory arrest; DNR: Do not resuscitate; ED: Emergency Department; EMR: Electronic medical record; EMV: Eye, Motor, Verbal; FiO2: Inspired oxygen; GCS: Glasgow coma scale; HCP: Healthcare professional; HDU: High dependency unit; HR: Heart rate; HRQOL: Health-Related Quality of Life; ICU: Intensive care unit; IL: Intensivist-led; LOS: Length of stay; MEWS: modified early warning score; MET: Medical emergency team; MICU: medical ICU; NP: Nurse practitioner; PRBC: Packed red blood cells; PROMS: Patient Reported Outcome Measures; QIP: Quality improvement project; RACE: Rapid assessment clinical evaluation; RN: Registered Nurse; RR: Respiratory rate; RR: Relative risk; RRT/S: Rapid response team/system; RTCDA: Real-time clinical deterioration alerts; SAE: Serious adverse event; SBAR: Situation, background, assessment, response; SBP: Systolic blood pressure; SpO2: Oxygen saturation; SPR: Specialist Registrar; VAS: Visual analogue scale; WTE: Whole Time Equivalent

Clinical & Cost-effectiveness of the National Early Warning System (NEWS): Systematic Review Update
Health Research Board – Collaboration in Ireland for Clinical Effectiveness Reviews
254
8.6 Methodological quality
A number of different study designs were included (interrupted time series and before-after
observational studies) in this chapter of the systematic review and therefore the
methodological quality was appraised using different tools. The quality of included studies is
presented according to the different study designs.
8.6.1 Interrupted time series studies
The Cochrane Effective Practice and Organisation of Care (EPOC) tool was used to assess
methodological quality of the two interrupted time series (ITS) studies(115, 133) assessing
seven risk of bias domains.
The two ITS studies included were deemed to have a low risk of bias overall (in six out of the
seven domains), (Figure 8.1).(115, 133)
Figure 8.1 Risk of bias summary for ITS studies of EWS interventions and deterioration in
adults in acute health care settings
Intervention independent of other changes
Both studies were classified as having an unclear risk of bias in relation to the intervention
being independent of other changes.(115, 133) Rothberg et al.(133) acknowledged that it was an
observational study and cannot account for other confounders relating to temporal trends
in the hospital. However, their long time window of time allowed them to examine trends

Clinical & Cost-effectiveness of the National Early Warning System (NEWS): Systematic Review Update
Health Research Board – Collaboration in Ireland for Clinical Effectiveness Reviews
255
over several years and for two years prior to implementation of the MET, there was no
decline at all in the rate of code calls, followed by an immediate and sustained drop after
implementation. However, other interventions, including ventilator-associated pneumonia
bundles, sepsis bundles, and advanced cardiac life support simulation training were also
implemented at different times during the study period. Howell et al. (115) stated that there
were likely to be unmeasured confounders that influence the risk of death. For example,
other patient safety programs undoubtedly contributed to the effect, as confirmed by time-
related mortality reductions independent of the intervention. The attempt to control for
time trends and other confounders through multivariable methods, and their results suggest
an independent effect of the intervention (Figure 8.2).
Intervention unlikely to affect data collection
Both studies had a low risk of bias as the intervention was unlikely to affect data collection.
Howell et al.(115) used a hospital administrative database and Rothberg et al.(133) used forms
which were routinely completed by the nurses after a MET event before and after the
intervention was implemented (Figure 8.2).
Knowledge of the allocated interventions adequately prevented (blinding)
Both studies had a low risk of bias (even though they were not blinded or randomised) as
objective outcome measures such as mortality were used (Figure 8.2).(115, 133)
Incomplete outcome data (attrition)
One study had a low risk of bias as all participants were accounted for.(115) The other study
made no clear statement of follow-up or missing data and provided no study flow diagram
(Figure 8.2).(133)

Clinical & Cost-effectiveness of the National Early Warning System (NEWS): Systematic Review Update
Health Research Board – Collaboration in Ireland for Clinical Effectiveness Reviews
256
Figure 8.2 Risk of bias graph for included ITS studies of EWS interventions and
deterioration in adults in acute health care settings
8.6.2 Before-after studies
The Newcastle Ottawa Scale quality appraisal tool(26) was used for the 23 before-and-after
observational studies and the seven observational cohort studies. We rated the quality of
the studies (good, fair and poor) by awarding stars in each domain following the guidelines
of the Newcastle–Ottawa Scale as described in section 2.4.3.
There were 23 before-after observational studies and seven observational cohort studies.(38,
39, 45, 46, 50-53, 62, 63, 71, 72, 80-82, 95, 96, 98, 117, 119, 124, 125, 127-130, 134-136) Of these, 17 studies were
considered ‘good quality’ overall and received six, seven or eight stars across the different
domains of selection, comparability and outcome.(45, 50-52, 62, 63, 71, 72, 80, 95, 119, 125, 127, 129, 130, 134,
136) Three studies were considered ‘fair quality’ overall and received five stars again across
the different domains of selection, comparability and outcome.(38, 53, 81) Ten studies were
rated as ‘poor quality’ overall receiving four or less stars across the domains of selection,
comparability and outcome.(39, 46, 82, 96, 98, 117, 124, 128, 135, 157)
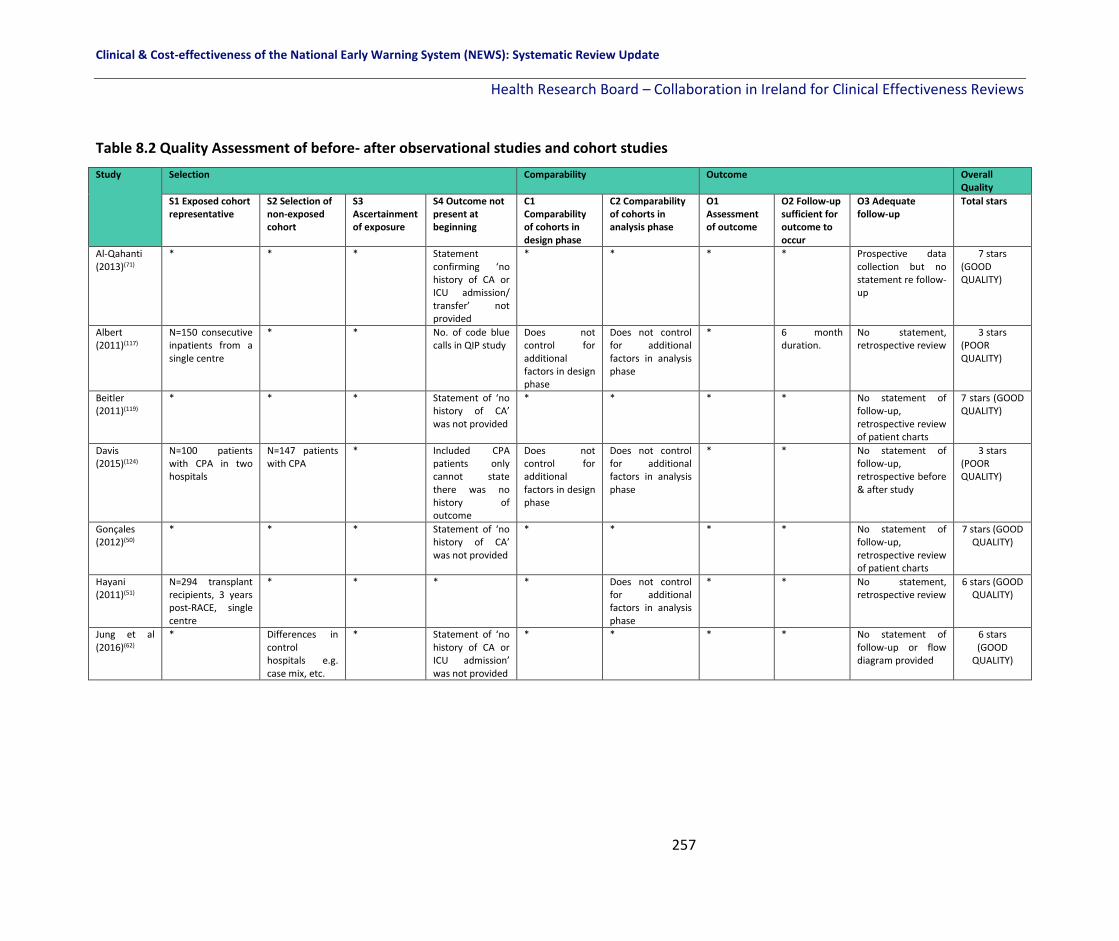
Clinical & Cost-effectiveness of the National Early Warning System (NEWS): Systematic Review Update
Health Research Board – Collaboration in Ireland for Clinical Effectiveness Reviews
257
Table 8.2 Quality Assessment of before- after observational studies and cohort studies
Study Selection Comparability Outcome Overall Quality
S1 Exposed cohort representative
S2 Selection of non-exposed cohort
S3 Ascertainment of exposure
S4 Outcome not present at beginning
C1 Comparability of cohorts in design phase
C2 Comparability of cohorts in analysis phase
O1 Assessment of outcome
O2 Follow-up sufficient for outcome to occur
O3 Adequate follow-up
Total stars
Al-Qahanti (2013)(71)
* * * Statement confirming ‘no history of CA or ICU admission/ transfer’ not provided
* * * * Prospective data collection but no statement re follow-up
7 stars (GOOD QUALITY)
Albert (2011)(117)
N=150 consecutive inpatients from a single centre
* * No. of code blue calls in QIP study
Does not control for additional factors in design phase
Does not control for additional factors in analysis phase
* 6 month duration.
No statement, retrospective review
3 stars (POOR QUALITY)
Beitler (2011)(119)
* * * Statement of ‘no history of CA’ was not provided
* * * * No statement of follow-up, retrospective review of patient charts
7 stars (GOOD QUALITY)
Davis (2015)(124)
N=100 patients with CPA in two hospitals
N=147 patients with CPA
* Included CPA patients only cannot state there was no history of outcome
Does not control for additional factors in design phase
Does not control for additional factors in analysis phase
* * No statement of follow-up, retrospective before & after study
3 stars (POOR QUALITY)
Gonçales (2012)(50)
* * * Statement of ‘no history of CA’ was not provided
* * * * No statement of follow-up, retrospective review of patient charts
7 stars (GOOD QUALITY)
Hayani (2011)(51)
N=294 transplant recipients, 3 years post-RACE, single centre
* * * * Does not control for additional factors in analysis phase
* * No statement, retrospective review
6 stars (GOOD QUALITY)
Jung et al (2016)(62)
* Differences in control hospitals e.g. case mix, etc.
* Statement of ‘no history of CA or ICU admission’ was not provided
* * * * No statement of follow-up or flow diagram provided
6 stars (GOOD
QUALITY)

Clinical & Cost-effectiveness of the National Early Warning System (NEWS): Systematic Review Update
Health Research Board – Collaboration in Ireland for Clinical Effectiveness Reviews
258
Table 8.2 Quality Assessment of before- after observational studies and cohort studies [continued]
Study Selection Comparability Outcome Overall Quality
S1 Exposed cohort representative
S2 Selection of non-exposed cohort
S3 Ascertainment of exposure
S4 Outcome not present at beginning
C1 Comparability of cohorts in design phase
C2 Comparability of cohorts in analysis phase
O1 Assessment of outcome
O2 Follow-up sufficient for outcome to occur
O3 Adequate follow-up
Total stars
Kansal (2012)(38)
* * * Statement of ‘no history of CA or ICU transfer/ admission ’ was not provided
* Does not control for additional factors.
* 5 months before & after RRT
No statement of follow-up, retrospective review of patient charts
5 stars (FAIR QUALITY)
Karpman (2013)(125)
* * * * * Does not control for additional factors
* * No statement of follow-up, retrospective review of patient charts
7 stars (GOOD QUALITY)
Karvellas (2011)(52)
* * * * * Does not control for additional factors
* * No statement of follow-up, retrospective review of patient charts
7 stars (GOOD QUALITY
Kim (2017)(72)
* * * Statement of ‘no history of ICU transfer/ admission ’ was not provided
* * * * No statement of follow-up, retrospective review of patient charts
7 stars (GOOD QUALITY)
Kollef (2017)(127)
* * * Statement of ‘no history of CA’ was not provided
* * * * No statement of follow-up, retrospective review of patient charts
7 stars (GOOD
QUALITY)
Ludikhuize (2015)(80)
* * * Statement confirming ‘no history of CA or ICU admission/ transfer’ not provided
* * * 5 months post RRT
* 7 stars (GOOD
QUALITY)
Mathukia (2015)(128)
No details provided
No details provided
* Statement of ‘no history of CA or ICU transfer/ admission ’ was not provided
Does not control for additional factors in design phase
Does not control for additional factors in analysis phase
* * No statement on follow-up. QIP project
3 stars (POOR
QUALITY)

Clinical & Cost-effectiveness of the National Early Warning System (NEWS): Systematic Review Update
Health Research Board – Collaboration in Ireland for Clinical Effectiveness Reviews
259
Table 8.2 Quality Assessment of before- after observational studies and cohort studies [continued]
Study Selection Comparability Outcome Overall Quality
S1 Exposed cohort representative
S2 Selection of non-exposed cohort
S3 Ascertainment of exposure
S4 Outcome not present at beginning
C1 Comparability of cohorts in design phase
C2 Comparability of cohorts in analysis phase
O1 Assessment of outcome
O2 Follow-up sufficient for outcome to occur
O3 Adequate follow-up
Total stars
Moon (2011)(95)
* * * Statement of ‘no history of CA or ICU transfer/ admission ’ was not provided
* Does not control for additional factors in analysis phase
* * Retrospective analysis
6 stars (GOOD QUALITY)
Moriarty (2014)(129)
* * * Statement of ‘no history of ICU transfer/ admission ’ was not provided
* Does not control for additional factors in analysis phase
* * Retrospective analysis
6 stars (GOOD QUALITY)
Moroseos (2014)(130)
* * * Statement of ‘no history of ICU transfer/ admission ’ was not provided
* * * * No statement on follow-up, retrospective review
7 stars (GOOD QUALITY)
Morris (2013)(96)
Snapshot audit of 146 patients
* * Composite of positive and negative outcomes
Does not control for additional factors in design phase
Does not control for additional factors in analysis phase
* 7 days for outcome, study 10 weeks
* 4 stars (POOR QUALITY)
Mullany (2016)(39)
* Massive expansion in hospital post-intervention.
* Statement of ‘no history of CA or ICU transfer/ admission ’ was not provided
Does not control for additional factors in design phase
Does not control for additional factors in analysis phase
* * No statement of follow-up, retrospective review of patient charts
4 stars (POOR
QUALITY)
Pattison (2012)(98)
Small sample of cancer patients, single hospital
No description. * * Does not control for additional factors in design phase
Does not control for additional factors in analysis phase
* Study 8 months in duration.
* 4 stars (POOR
QUALITY)
Sabahi (2012)(63)
* * * Statement confirming ‘no history of CA’ not provided
* Does not control for additional factors in analysis phase
* * * 7 stars (GOOD
QUALITY)
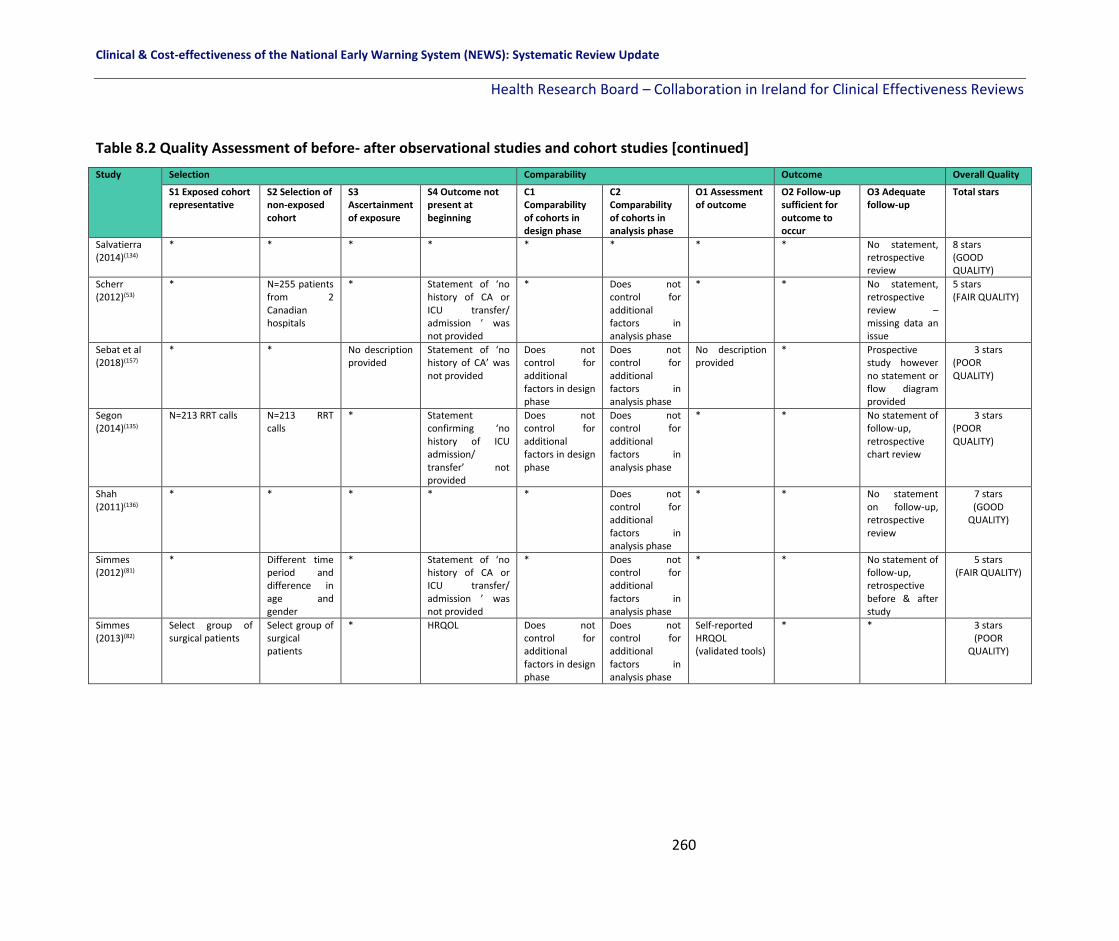
Clinical & Cost-effectiveness of the National Early Warning System (NEWS): Systematic Review Update
Health Research Board – Collaboration in Ireland for Clinical Effectiveness Reviews
260
Table 8.2 Quality Assessment of before- after observational studies and cohort studies [continued]
Study Selection Comparability Outcome Overall Quality
S1 Exposed cohort representative
S2 Selection of non-exposed cohort
S3 Ascertainment of exposure
S4 Outcome not present at beginning
C1 Comparability of cohorts in design phase
C2 Comparability of cohorts in analysis phase
O1 Assessment of outcome
O2 Follow-up sufficient for outcome to occur
O3 Adequate follow-up
Total stars
Salvatierra (2014)(134)
* * * * * * * * No statement, retrospective review
8 stars (GOOD QUALITY)
Scherr (2012)(53)
* N=255 patients from 2 Canadian hospitals
* Statement of ‘no history of CA or ICU transfer/ admission ’ was not provided
* Does not control for additional factors in analysis phase
* * No statement, retrospective review – missing data an issue
5 stars (FAIR QUALITY)
Sebat et al (2018)(157)
* * No description provided
Statement of ‘no history of CA’ was not provided
Does not control for additional factors in design phase
Does not control for additional factors in analysis phase
No description provided
* Prospective study however no statement or flow diagram provided
3 stars (POOR QUALITY)
Segon (2014)(135)
N=213 RRT calls N=213 RRT calls
* Statement confirming ‘no history of ICU admission/ transfer’ not provided
Does not control for additional factors in design phase
Does not control for additional factors in analysis phase
* * No statement of follow-up, retrospective chart review
3 stars (POOR QUALITY)
Shah (2011)(136)
* * * * * Does not control for additional factors in analysis phase
* * No statement on follow-up, retrospective review
7 stars (GOOD
QUALITY)
Simmes (2012)(81)
* Different time period and difference in age and gender
* Statement of ‘no history of CA or ICU transfer/ admission ’ was not provided
* Does not control for additional factors in analysis phase
* * No statement of follow-up, retrospective before & after study
5 stars (FAIR QUALITY)
Simmes (2013)(82)
Select group of surgical patients
Select group of surgical patients
* HRQOL Does not control for additional factors in design phase
Does not control for additional factors in analysis phase
Self-reported HRQOL (validated tools)
* * 3 stars (POOR
QUALITY)

Clinical & Cost-effectiveness of the National Early Warning System (NEWS): Systematic Review Update
Health Research Board – Collaboration in Ireland for Clinical Effectiveness Reviews
261
Table 8.2 Quality Assessment of before- after observational studies and cohort studies [continued]
Study Selection Comparability Outcome Overall Quality
S1 Exposed cohort representative
S2 Selection of non-exposed cohort
S3 Ascertainment of exposure
S4 Outcome not present at beginning
C1 Comparability of cohorts in design phase
C2 Comparability of cohorts in analysis phase
O1 Assessment of outcome
O2 Follow-up sufficient for outcome to occur
O3 Adequate follow-up
Total stars
Massey et al (2015)(46)
N=150 consecutive inpatients from a single centre
* * Statement of ‘no history of CA, etc.’ was not provided
Does not control for additional factors in design phase
Does not control for additional factors in analysis phase
* 3 month duration
No statement, retrospective review
3 stars (POOR QUALITY)
Joshi et al (2017)(45)
* * * Statement of ‘no history of ICU admission or CA’ was not provided
* Does not control for additional factors in analysis phase
* * No statement, retrospective review
6 stars (GOOD QUALITY)
Key: CA: Cardiac Arrest; HRQOL: Health Rrelated Quality of Life; ICU: Intensive Care Unit.

Clinical & Cost-effectiveness of the National Early Warning System (NEWS): Systematic Review Update
Health Research Board – Collaboration in Ireland for Clinical Effectiveness Reviews
262
8.7 Certainty of the evidence
We assessed the overall certainty of the evidence where appropriate for question 2 of the
review (How effective are the emergency response systems in terms of improving key patient
outcomes in adult (non-pregnant) patients in acute healthcare setting?). A narrative
summary of findings table was created using GRADEpro software for the following primary
outcomes: Mortality, cardiac arrest, LOS, and transfer or admission to the ICU.
Overall, the certainty of the evidence is ‘very low’ owing to a high risk of bias in the various
study designs, a high risk of confounding in the observational studies, imprecision and
inconsistency in the results probably owing to the heterogeneous nature of the EWS
interventions applied as well as the variety of single centre settings in various countries
where the findings may not be applicable to other health care settings (Table 8.2).

Clinical & Cost-effectiveness of the National Early Warning System (NEWS): Systematic Review Update
Health Research Board – Collaboration in Ireland for Clinical Effectiveness Reviews
263
Table 8.2 Summary of findings table for key outcomes in the effectiveness of emergency
response systems
Emergency response systems compared to usual care/ other emergency response systems for physiological deterioration
Patient or population: physiological deterioration Setting: Acute healthcare settings Intervention: emergency response systems Comparison: usual care/ other emergency response systems
Outcomes Impact № of participants (studies)
Certainty of the evidence (GRADE)
Mortality Mortality was reported in a variety of different ways in the included studies. In addition, the intervention (emergency response systems) also varied in terms of team compositions, triggers for escalation, response times and operating times (full-time or part-time). 14/25 studies included showed a significant effect on mortality after the emergency response system was introduced (13/14 showed a significant reduction in mortality and 1/14 showed a significant increase in mortality). In total, 11/25 studies included showed no reduction in mortality after the emergency response system was introduced.
2,617,122 (26 studies including 24 before-after observational studies, 2 interrupted-time series studies)
⨁◯◯◯ VERY LOW a,b,c,d
Cardiac arrest Cardiac arrest was reported in a variety of different ways in the included studies. In addition, the intervention (emergency response systems) also varied in terms of team compositions, triggers for escalation, response times and operating times (full-time or part-time). 12/18 studies showed a significant reduction in cardiac arrest rates after the emergency response system was introduced, while 6/18 studies reported no reduction in cardiac arrests.
1,878,003 (18 studies including 17 before-after observational studies and 1 interrupted-time series study)
⨁◯◯◯ VERY LOW a,b,c,d
Length of stay (LOS)
LOS was included in 7 studies (as ICU-LOS or hospital LOS). 4/7 studies found no reduction in the mean or median LOS, while 3/7 studies reported a significant reduction in LOS after the emergency response system was introduced.
576,504 (7 before-after observational studies)
⨁◯◯◯ VERY LOW b,c,d
Transfer or admission to the ICU
In 14 studies the effect of emergency response systems on ICU transfer or ICU admission was examined. Five of these 14 studies reported a significant effect on the outcome (2/5 studies showed a significant reduction in ICU transfer or admission rates and 3/5 studies showed a significant increase in ICU transfer or admission rates). Nine out of the 14 studies reported no significant effect on ICU admission or transfer rates.
1,284,311 (14 before-after observational studies)
⨁◯◯◯ VERY LOW a,b,c,d
*The risk in the intervention group (and its 95% confidence interval) is based on the assumed risk in the comparison group and the relative effect of the intervention (and its 95% CI). CI: Confidence interval

Clinical & Cost-effectiveness of the National Early Warning System (NEWS): Systematic Review Update
Health Research Board – Collaboration in Ireland for Clinical Effectiveness Reviews
264
Emergency response systems compared to usual care/ other emergency response systems for physiological deterioration
Patient or population: physiological deterioration Setting: Acute healthcare settings Intervention: emergency response systems Comparison: usual care/ other emergency response systems
Outcomes Impact № of participants (studies)
Certainty of the evidence (GRADE)
GRADE Working Group grades of evidence High certainty: We are very confident that the true effect lies close to that of the estimate of the effect Moderate certainty: We are moderately confident in the effect estimate: The true effect is likely to be close to the estimate of the effect, but there is a possibility that it is substantially different Low certainty: Our confidence in the effect estimate is limited: The true effect may be substantially different from the estimate of the effect Very low certainty: We have very little confidence in the effect estimate: The true effect is likely to be substantially different from the estimate of effect
8.8 Discussion
There were 32 studies included in this part of the review investigating the effectiveness of
emergency response systems (efferent limb) on patient outcomes and resource utilisation.
The evidence from the review is inconclusive with very low certainty due to the very low
methodological quality of the studies included. Twenty-six studies including 2,617,122
patients investigated the effect of various emergency response systems on mortality.
Thirteen out of the 26 studies showed a significant effect on mortality after the emergency
response system was introduced (12/13 showed a reduction and 1/13 showed an increase
in mortality). However, 13 studies showed no change in mortality rates as a result of the
emergency response system. Eighteen studies including 1,878,003 patients examined the
effectiveness of emergency response systems on cardiac arrest. Twelve out the 18 studies
showed a significant reduction in cardiac arrests while six studies showed no change as a
result of the emergency response systems. LOS was included in seven studies with a total of
576,504 patients. Four out seven studies found no reduction in the LOS and three reported
a significant reduction in mean or median LOS as a result of the emergency response
system. Fourteen studies including 1,284,311 patients examined the effectiveness of
emergency response systems on ICU transfer or admission. Five studies showed a significant
effect on ICU transfers or admissions (two showed a reduction and three showed an
Explanations
a. High risk of bias in the nRCTs b. Observational studies (retrospective cohort studies, before-after observational studies) - risk of bias and confounding c. Inconsistency due to the heterogeneous emergency response systems included (nurse-led, intensivist-led, part-time, full-time) and varying patient populations included d. Imprecision relating small sample sizes including the possibility of a small or no effect
Clinical & Cost-effectiveness of the National Early Warning System (NEWS): Systematic Review Update
Health Research Board – Collaboration in Ireland for Clinical Effectiveness Reviews
265
increase in ICU transfers or admissions). The certainty of the evidence overall was deemed
to be very low across all the studies.
The lack of high quality evidence to evaluate the effect of EWS interventions on patient
outcomes is due to a number of factors. These include a wide variation in the EWS
interventions used (for example for the emergency response systems interventions the
team composition varied, the parameters to activate the emergency response team varied
and the operating times varied from study to study); the definition of the outcomes varied
across studies (for example mortality, which was reported as simply ‘death’, in-hospital
mortality, unexpected death and mortality at three months); the population included varied
and there were small sample sizes and low event rates in some studies. All of these add
significant heterogeneity to the review findings and as a result a meta-analysis was not
possible.
Future research is needed to address limitations highlighted in this review. Ideally study
designs of a more rigorous methodological quality are needed, preferably RCTs. A
standardised approach to the EWS interventions used and the outcomes included are
warranted.
8.9 Conclusion
The evidence from the studies which look at EWS interventions in terms of emergency
response systems and their effect on improving the detection and management of
physiological deterioration in adult patients in acute settings is of poor quality overall. The
findings are contrasting owing to the heterogeneous nature of the interventions included
and the very low methodological quality of the study designs included.

Clinical & Cost-effectiveness of the National Early Warning System (NEWS): Systematic Review Update
Health Research Board – Collaboration in Ireland for Clinical Effectiveness Reviews
266
9 Results: Effectiveness of EWS educational interventions for the identification of physiological deterioration in adult (non-pregnant) patients in acute health care settings (Q3)
9.1 Chapter overview
This chapter in the systematic review update focusses on the literature pertinent to
question 3 of the review, “What education programmes have been established to train HCPs
relating to the implementation of EWSs or track and trigger systems for the detection of or
timely identification of physiological deterioration in adult (non-pregnant) patients in acute
health care settings?”. The characteristics of included studies are described as well as the
findings from each study for the effectiveness of EWS educational intervention on the a
priori defined primary and secondary outcomes as well as any post-hoc identified outcomes.
The methodological quality is discussed according to the various study designs and a
summary of the evidence for the primary outcomes is presented in a summary of findings
table where appropriate.
9.2 Characteristics of included studies
This systematic review is an update of previous work by a team based in UCC(2) who
published their findings in 2017 on the effectiveness of educational interventions for the
identification of physiological deterioration in adult patients in acute health care
settings.(163) The team’s systematic search of the literature was until November 2015 and
resulted in 10 studies eligible for inclusion.(164-173)
Our systematic review update included 9 of these 10 studies (excluding the study by
Kyriacos et al.,(165) as it was conducted in South Africa which is not a very high or high HDI
country), and identified a further 14 studies. This resulted in a total of 23 studies eligible for
inclusion.
The studies were conducted in Australia,(39, 164, 174, 175) Belgium,(48) the USA,(157, 168, 171, 172, 176)
Singapore,(166, 167, 177-181) the Netherlands,(169) France,(62) and the UK.(170, 173, 182, 183) These

Clinical & Cost-effectiveness of the National Early Warning System (NEWS): Systematic Review Update
Health Research Board – Collaboration in Ireland for Clinical Effectiveness Reviews
267
included seven RCTs,(166-168, 177-180) one non randomised control trial,(169) fourteen before-
and-after studies,(39, 48, 62, 157, 164, 170-174, 176, 181, 183, 184) and one interrupted time series
study.(164, 175) The majority of the 23 studies took place in hospitals across one or more
wards,(39, 48, 62, 157, 164, 167, 169, 170, 172, 174, 175, 179-183) five studies were based in universities
(including simulation labs),(166, 168, 176-178) one study was based between a hospital and
adjacent academic simulation suite,(171) and one study was based in a psychiatric in-patient
setting.(173)
Sample size varied from 19 participants(173) to 161,153 patient observations (39) and was not
reported in one study.(182) Participants were nurses only in 13 studies,(46, 48, 164, 167, 169, 171, 173-
176, 179-181, 183) nursing students in four studies,(166, 168, 177, 178) and a mix of staff (including
nurses, doctors, healthcare assistants) in six studies.(39, 62, 157, 170, 172, 182) (Table 9.1) Data
collection methods varied according to study design and included review of patient records
(manual or via the hospital information system, prospective and retrospective),(39, 48, 62, 157,
164, 170, 172, 174, 175, 182) administration of pre-test and post-test questionnaires or surveys, (46,
166-168, 171, 173, 176-181, 183) and deteriorating patient case examples.(169)
Education programmes varied and included validated packages such as COMPASS® and
FIRST2ACT in three studies,(39, 174, 175) or education programmes specific to the individual
hospitals including training on SBAR/ISBAR tools, documentation of vital signs, simulation
scenarios, ABCDE training and use of RAPIDS or e-RAPIDS in 20 studies.(48, 62, 157, 164, 166-173, 176-
183) Fifteen were delivered face-to-face,(48, 62, 157, 164, 168-170, 172, 173, 175-178, 182, 183) two were
online (web-based) only,(180, 181) and six were blended (including online and face-to-face
components),(39, 166, 167, 171, 174, 179) (Table 9.1).

Clinical & Cost-effectiveness of the National Early Warning System (NEWS): Systematic Review Update
Health Research Board – Collaboration in Ireland for Clinical Effectiveness Reviews
268
Table 9.1 Characteristics of studies included in Q3 (Educational interventions)
Study Authors
(Year)
Country
(a) Sample
(b) Setting
(c) Data Collection
(d) Education Programme
(e) Mode of Delivery
(f) Type of Participants
(g) Other information
RCTs
Liaw (2011),(177)
Liaw (2012).(178)
Singapore
RCT
(a) N=31 (65% of eligible population) nursing students.
Randomised using fish bowl method after baseline data
collection (n=15 intervention, n=16 control group).
(b) Simulation lab of the National University of Singapore.
(c) Baseline and post-test simulation performances were
measured using a validated tool (RAPIDs). Participants
completed a pre-test questionnaire followed by a post-
test questionnaire a week after the intervention.
(d) RAPIDS simulation-based programme including SBAR
and ABCDE.
(e) Face-to-face programme.
(f) Student nurses in third year.
(g) Briefing of RAPIDS simulation programme to begin and
study guide given to all students. Followed by a 6-hour
session of 4 simulation scenarios (each 1 ½ hours) delivered
in a standardised way. A 53 item MCQ to assess knowledge
in managing deteriorating patients was completed pre and
post-test.
Liaw (2014).(166)
Singapore.
RCT
(a) N=97 nursing students invited to participate. N=57
recruited (N=31 intervention, N=26 control), randomised
using a random number table.
(b) Simulation lab of the National University of Singapore.
(c) Participants completed baseline assessment and post-
test questionnaires at 1-2 days post intervention and 2.5
months post intervention. Simulation videotaped and
assessed using RAPIDs tool.
(d) RAPIDS simulation-based programme including SBAR
and ABCDE.
(e) Blended programme.
(f) Student nurses in third year.
(g) Baseline evaluation of clinical performance using
mannequin simulation. Intervention group received a 2-
hour fully automated virtual patient simulation individually.
Control group received mannequin-based simulation in
groups of 6. Five simulation scenarios (acute coronary
syndrome, hypoglycaemia, hypovolemic shock, sepsis and
septic shock).
Liaw (2015),(167)
Liaw (2016).(179)
Singapore.
RCT
(a) N=67 registered nurses. N=35 randomised using a
computerized random number generator to intervention
group, n=32 to control.
(b) General ward units of an acute tertiary hospital in
Singapore.
(c) Research staff observed and rated performance using
the RAPIDs validated tool. Conducted Nov to December
2013. A week after pre-test and intervention, participants
were re-tested for clinical performance using a validated
tool.
(d) RAPIDS simulation-based programme including ISBAR
and ABCDE to guide nurses in managing patient
deterioration.
(e) Blended delivery.
(f) Registered nurses with <5 years’ experience.
(g) Baseline evaluation of all participants’ clinical
performance in a simulated clinical setting. Followed by 3
hours of web-based simulation for the intervention group
only and a survey of their perceptions of the simulation
programme.
Liaw (2017)(180)
Singapore.
RCT
(a) N=64 ENs recruited between Nov 2013 and Jan 2014.
Randomised using a computer generated list of random
numbers.
(b) Centre of Healthcare Simulation at an acute care,
tertiary hospital, at the University of Singapore.
(c) Following baseline evaluation, experimental group
received a web-based educational intervention. Pre-post
assessment of skills and knowledge were evaluated with
a simulated scenario and a MCQ knowledge
questionnaire. Post-tests were 1 week post intervention.
(d) e-RAPIDS with 3 key learning activities: video animation
(11 minutes on patient deterioration), multimedia
instructional material (using ABCDE and ISBAR) and virtual
patient simulation (5 different scenarios of patient
deterioration).
(e) Online
(f) ENs
(g) Training lasted 2 ½ to 3 hours.
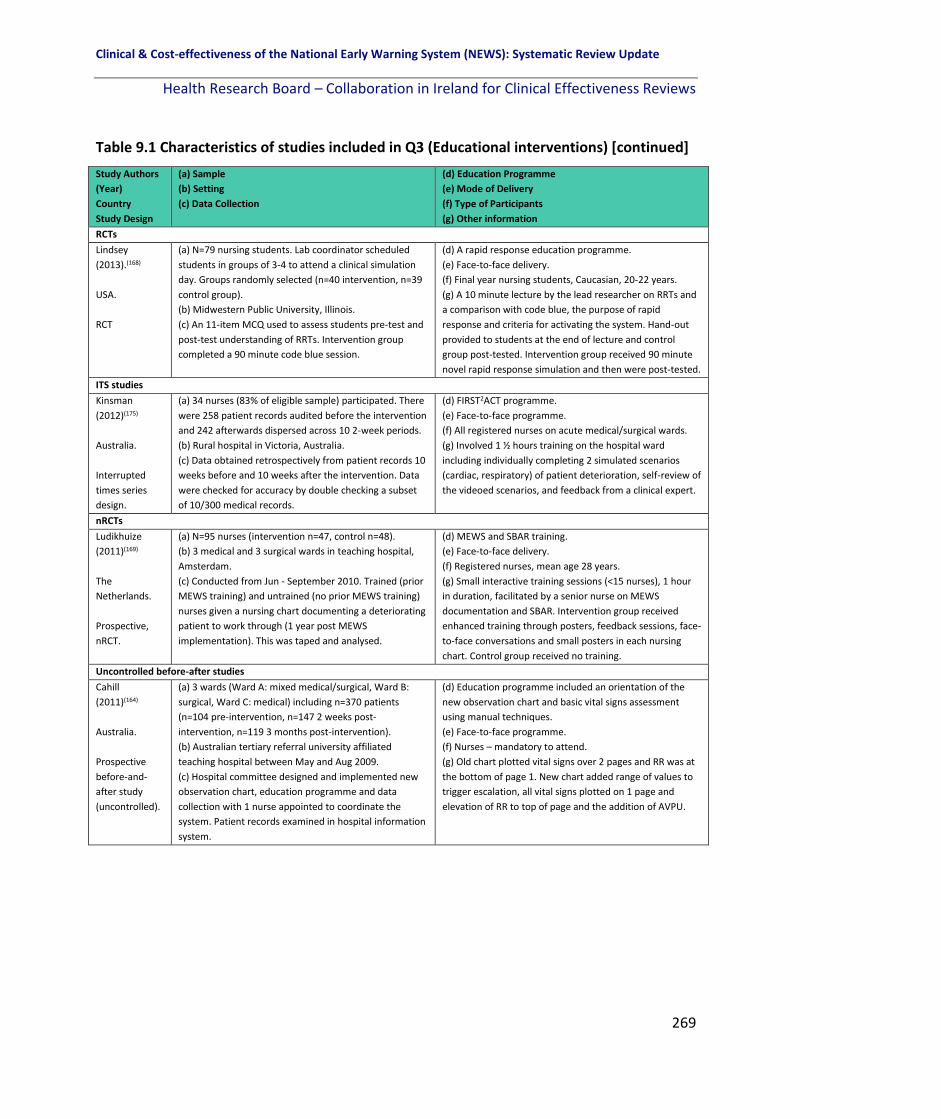
Clinical & Cost-effectiveness of the National Early Warning System (NEWS): Systematic Review Update
Health Research Board – Collaboration in Ireland for Clinical Effectiveness Reviews
269
Table 9.1 Characteristics of studies included in Q3 (Educational interventions) [continued]
Study Authors
(Year)
Country
Study Design
(a) Sample
(b) Setting
(c) Data Collection
(d) Education Programme
(e) Mode of Delivery
(f) Type of Participants
(g) Other information
RCTs
Lindsey
(2013).(168)
USA.
RCT
(a) N=79 nursing students. Lab coordinator scheduled
students in groups of 3-4 to attend a clinical simulation
day. Groups randomly selected (n=40 intervention, n=39
control group).
(b) Midwestern Public University, Illinois.
(c) An 11-item MCQ used to assess students pre-test and
post-test understanding of RRTs. Intervention group
completed a 90 minute code blue session.
(d) A rapid response education programme.
(e) Face-to-face delivery.
(f) Final year nursing students, Caucasian, 20-22 years.
(g) A 10 minute lecture by the lead researcher on RRTs and
a comparison with code blue, the purpose of rapid
response and criteria for activating the system. Hand-out
provided to students at the end of lecture and control
group post-tested. Intervention group received 90 minute
novel rapid response simulation and then were post-tested.
ITS studies
Kinsman
(2012)(175)
Australia.
Interrupted
times series
design.
(a) 34 nurses (83% of eligible sample) participated. There
were 258 patient records audited before the intervention
and 242 afterwards dispersed across 10 2-week periods.
(b) Rural hospital in Victoria, Australia.
(c) Data obtained retrospectively from patient records 10
weeks before and 10 weeks after the intervention. Data
were checked for accuracy by double checking a subset
of 10/300 medical records.
(d) FIRST2ACT programme.
(e) Face-to-face programme.
(f) All registered nurses on acute medical/surgical wards.
(g) Involved 1 ½ hours training on the hospital ward
including individually completing 2 simulated scenarios
(cardiac, respiratory) of patient deterioration, self-review of
the videoed scenarios, and feedback from a clinical expert.
nRCTs
Ludikhuize
(2011)(169)
The
Netherlands.
Prospective,
nRCT.
(a) N=95 nurses (intervention n=47, control n=48).
(b) 3 medical and 3 surgical wards in teaching hospital,
Amsterdam.
(c) Conducted from Jun - September 2010. Trained (prior
MEWS training) and untrained (no prior MEWS training)
nurses given a nursing chart documenting a deteriorating
patient to work through (1 year post MEWS
implementation). This was taped and analysed.
(d) MEWS and SBAR training.
(e) Face-to-face delivery.
(f) Registered nurses, mean age 28 years.
(g) Small interactive training sessions (<15 nurses), 1 hour
in duration, facilitated by a senior nurse on MEWS
documentation and SBAR. Intervention group received
enhanced training through posters, feedback sessions, face-
to-face conversations and small posters in each nursing
chart. Control group received no training.
Uncontrolled before-after studies
Cahill
(2011)(164)
Australia.
Prospective
before-and-
after study
(uncontrolled).
(a) 3 wards (Ward A: mixed medical/surgical, Ward B:
surgical, Ward C: medical) including n=370 patients
(n=104 pre-intervention, n=147 2 weeks post-
intervention, n=119 3 months post-intervention).
(b) Australian tertiary referral university affiliated
teaching hospital between May and Aug 2009.
(c) Hospital committee designed and implemented new
observation chart, education programme and data
collection with 1 nurse appointed to coordinate the
system. Patient records examined in hospital information
system.
(d) Education programme included an orientation of the
new observation chart and basic vital signs assessment
using manual techniques.
(e) Face-to-face programme.
(f) Nurses – mandatory to attend.
(g) Old chart plotted vital signs over 2 pages and RR was at
the bottom of page 1. New chart added range of values to
trigger escalation, all vital signs plotted on 1 page and
elevation of RR to top of page and the addition of AVPU.

Clinical & Cost-effectiveness of the National Early Warning System (NEWS): Systematic Review Update
Health Research Board – Collaboration in Ireland for Clinical Effectiveness Reviews
270
Table 9.1 Characteristics of studies included in Q3 (Educational interventions) [continued]
Study Authors
(Year)
Country
Study Design
(a) Sample
(b) Setting
(c) Data Collection
(d) Education Programme
(e) Mode of Delivery
(f) Type of Participants
(g) Other information
Uncontrolled before -after studies
De Meester
(2013)(48)
Belgium.
Before-and-
after study
(uncontrolled).
(a) N=425 nurses involved in direct care for patients on
medical and surgical wards.
(b) Antwerp University tertiary referral hospital between
July 2010 and Mar 2012.
(c) Pre-intervention was 10 months between July 2010
and Apr 2011. Post-intervention was 10 months between
May 2011 - Mar 2012. Participants completed
communication tool and hospital information system
used to identify cases. MEWS introduced in Nov 2009.
(d) SBAR and ABCDE training.
(e) Face-to-face programme.
(f) Nurses.
(g) 2-hour training session on SBAR and communication-
related errors, followed by 4-hour lesson on the ABCDE
algorithm, critical thinking for all nurses (delivered by 2
reference nurses from each ward who received advance
training).
Hammond
(2013)(174)
Australia.
Prospective
before-and-
after
intervention
study
(uncontrolled).
(a) N=69 ICU cases before MEWS and n=70 after. 2
groups of hospital observation charts (24 hours post-ICU
discharge and 24 hr preceding unplanned admissions to
ICU).
(b) Tertiary referral teaching hospital in Brisbane with
588 beds and 21 ICU beds.
(c) Pre implementation study period (Nov 2009) and post
implementation study period (Feb 2010). Data recorded
before and after MEWS for 24 hours only from patient
records.
(d) COMPASS ®.
(e) Blended programme.
(f) Nurses – all staff had to complete the education
programme.
(g) 3 phases to programme: 1) training CD to work through
independently, 2) Online quiz, 3) 2-hour face-to-face
session including ISBAR.
Jung (2016)(62)
France.
Before-after
study.
(a) N=137,251 patients. Pre-intervention: N=68,086
admitted to the medical-surgical wards July 2010 to Dec
2011 of 3 control hospitals with no RRT. Post-RRT
N=69,165 patients admitted July 2012 to Dec 2013 in 1
RRT hospital. Sample of HCPs trained not reported.
(b) 4 hospitals of Montpellier regional healthcare centre.
(c) RRT intervention in 1 hospital compared to 3 control
hospitals (non-RRT). RRT data retrospectively analysed.
RRT intervention consisted of an intensivist-led RRT
activated by a single criterion along with education.
(d) Education included displaying posters, bedside
simulation-based training courses using manikins, practical
educational sessions and information through the local
hospital newspaper to recognise the listed criteria foe
activating the RRT.
(e) Face-to-face
(f) Ward residents, doctors and nurses
(g) During a 6 month period the RRT criterion were
presented to the medical and nursing teams.
Liaw (2016)(181)
Singapore.
Before-after
intervention
study.
(a)N=99 nurses (85% participation rate) participated
(n=64 registered nurses and n=35 ENs)
(b) 1 surgical ward and 1 medical ward, acute care 991-
bed tertiary hospital at a University.
(c) Data collected at the Centre for Healthcare Simulation
from June 1 to Aug 14 2014. Nurses and ENs individually
brought into a room with a computer to complete the 3
part training. Examination was in the form of a 30-item
MCQ before and after the training. Participants
completed the Instructional Material Motivational Survey
immediately after the training to assess their thoughts on
the training. Behavioural change was assessed in a self-
reported questionnaire 3-4 months after e-RAPIDS
training. Clinical records on cases triggered by nurses
from the 2 study wards were checked by an investigator
for frequency and type over a period of 6 months pre-
(Dec 2013 to May 2014) and 6 months post intervention
(Aug 2014 to Feb 2015)
(d) e-RAPIDS web-based training with 3 parts including an
animated video focusing on early detection of changes in
vital signs; a study guide presented using multimedia
instructional materials [text, illustration, audio of lung
sounds] on using the ABCDE and ISBAR mnemonics and a
virtual simulation with five scenarios on deteriorating
patients.
(e) Online
(f) Registered nurses and enrolled nurses from the surgical
and medical wards
(g) Training lasted 2 ½ to 3 hours

Clinical & Cost-effectiveness of the National Early Warning System (NEWS): Systematic Review Update
Health Research Board – Collaboration in Ireland for Clinical Effectiveness Reviews
271
Table 9.1 Characteristics of studies included in Q3 (Educational interventions) [continued]
Study Authors
(Year)
Country
Study Design
(a) Sample
(b) Setting
(c) Data Collection
(d) Education Programme
(e) Mode of Delivery
(f) Type of Participants
(g) Other information
Uncontrolled before -after studies
McDonnell
(2012)(183)
UK.
Before-after
intervention
study.
(a) N=322 nurses from 12 wards included.
(b) 500+ bed District general hospital in the UK.
(c) Questionnaire (scale of 1-10) used to examine
knowledge and confidence in recognition and
management of deteriorating patients 6 weeks before
and after an intervention. Data collected in 2009. 84%
(271/322) of eligible staff attended training and
completed before questionnaires. 77% (247/322)
completed after questionnaires. Paired responses was
66% (213/322)
(d) Education programme: information on the
recognition/response to deteriorating patients, an
overview of the new charts, the new EWS and graded
response algorithm.
(e) Face-to-face
(f) Nurses (RNs and UNs).
(g) Delivered by the CCOT nurse, 30-45 minutes.
Ozekcin
(2015)(171)
USA.
Before-and-
after study
(uncontrolled).
(a) N=35 nurses working on the ward a minimum of 6
months.
(b) 3 cardiac surgical universal care units of a university
hospital based within the northeast USA, and a medical
simulation suite of a medical school adjacent to the
hospital.
(c) Project included a pre-test post-test descriptive
survey (14 –item MCQ). E-learning module and pre-test
surveys were assessable on the hospital database to
staff. Project took place over 4 weeks with 10 simulation
sessions (3-5 nurses in each session).
(d) 2-phase educational programme (e-learning module and
simulation scenarios).
(e) Blended delivery.
(f) Registered nurses.
(g) E-learning module, a simulated scenario allowing
participants to observe cardiovascular and respiratory
changes over a short period and permitted to respond with
critical actions. Followed by a group debriefing session.
SBAR incorporated to both phases of the education training
and a clinical nurse specialist devised the education
programme based on the PDSA framework.
Rose (2015)(172)
USA.
Quality
Improvement
Project (QIP)
before-and-
after study
(uncontrolled).
(a) N=108 core staff members participated voluntarily.
(b) Small 120 bed community hospital with a successfully
implemented RRT 2 years prior.
(c) QIP ran from Mar – Nov 2013. 3 non-critical care units
included. Effectiveness of staff education programme on
eMEWS measured in 2 90-day phases (pre- and post-
intervention).
(d) One-on-one or small group education related to
eMEWS.
(e) Face-to-face delivery.
(f) Nurses, healthcare assistants and respiratory therapists.
(g) 3-minute intense education presentation. Included
strategies to rescue the patient, the significance of MEWS a
decision support tools and documentation of eMEWS
(electronic and manual).
Schubert
(2012) (176)
USA.
Before-and-
after
intervention
study
(uncontrolled).
(a) N=58 nurses
(b) Simulation lab of a Midwestern U.S University
hospital.
(c) Failure to rescue knowledge test (comprised of 9
MCQs with a range of scores from 0-9), and the Learning
Transfer Tool (LTT), an instrument to assess nurses’ skills
in overall critical thinking (with 13 self-assess items) were
administered before, immediately after and 2 weeks
after the simulation. Pre-test demographic data,
including level of education, years of experience as a
nurse, and any previous simulation exposure, were
collected.
(d) Simulation-based intervention.
(e) Face-to-face delivery.
(f) Nurses attending an annual education day.
(g) Groups of 3 nurses with supportive personnel who
facilitated the simulation (clinical nurse specialist as the
observer/debriefing leader, nurse educator as the
mannequin operator, and the project coordinator as the
physician). Nurses completed the post-test MCQ and were
given a self-addressed, stamped envelope with instructions
to complete and return post-test2 in 2 weeks.

Clinical & Cost-effectiveness of the National Early Warning System (NEWS): Systematic Review Update
Health Research Board – Collaboration in Ireland for Clinical Effectiveness Reviews
272
Table 9.1 Characteristics of studies included in Q3 (Educational interventions) [continued]
Study Authors
(Year)
Country
Study Design
(a) Sample
(b) Setting
(c) Data Collection
(d) Education Programme
(e) Mode of Delivery
(f) Type of Participants
(g) Other information
Uncontrolled before -after studies
Sebat
(2018)(157)
USA
Prospective
single-centre
before-after
study
(a) N=28,914 medical/surgical patients admitted during
the control period 24 months (Jan 2008– Dec 2009), and
N=39,802 patients admitted during the 33-month
intervention period (Jan 2011 - Sept 2013). N=650 nurses
on the units completed education. The number of other
staff who completed education was not reported.
(b) Adult general nursing units at a 500-bed community
regional hospital, California
(c) Data collected pre-and post-post intervention
consisting of: changing the RRS to a 4-arm RRS including
1) expansion of vital signs, changes in nursing policies for
escalation, mandatory education programme; 2)
expansion of the RRT to include a critical care RN and
development of standardised procedures; 3) Complete
data collection and system compliance and improvement
implemented; 4) expanded in personnel and scope.
(d) Education of nursing assistants on taking and reporting
vital signs accurately; 4 hour education programme for RNs
on recognising at risk patients earlier using 10 vital signs
(including 45 minute video, classroom case study
presentations, at risk mock patient simulation scenarios
and written examination [required to pass]). RRT ward
debriefing sessions post-event. Medical staff education
included presentations at staff meetings, grand rounds and
at all medical staff committees. RRT received advanced
cardiac life support training, ventilation, infusion, pump,
pharmacologic and specific invasive intervention (VIPPS)
approach training, case studies and mock RRT alerts.
(e) Face-to-face
(f) Mandatory nurse, physician and nursing assistant
training.
(g)-
Shaddel
(2014)(173)
UK.
Before-and-
after
intervention
study
(uncontrolled).
(a) N=19 psychiatric nurses.
(b) The assessment and treatment learning disability unit
and in 2 forensic psychiatric units in the UK.
(c) Nurses completed a pre-MEWS implementation
survey and a post-MEWS implementation survey.
(d) MEWS form introduced to a mental health unit.
(e) Face-to-face delivery.
(f) Nurses with a minimum of 6 months experience and a
max of 20 years nursing experience.
(g) Nurses received 15 minutes training on MEWS and then
completed the post-intervention questionnaire on 2 case
studies of deterioration.
Wood
(2015).(182)
UK.
Prospective
before-and-
after study
(uncontrolled).
(a) Not reported how many staff received training or how
many files were audited.
(b) Nottingham University Teaching Hospital across 3
sites.
(c) A service improvement project commenced in 2013. 3
key phases: 1) Staff engagement and defining the ward
culture), 2) 5 multifaceted high impact interventions, 3)
Fortnightly case note audit. There were 5 key targets
identified for improvement within the hospital.
(d) Multi-faceted education programme including case
studies, mock audit and patient scenarios as teaching
material.
(e) Face-to-face delivery.
(f) Doctors (foundation year, core trainees and specialist
trainees) and nurses (adult and paediatric nurses) with
support from senior nurses.
(g) ‘EWS focus fortnight’: delivered in each area
concentrating on poor performing wards first to improve
and achieve the 5 key targets. ‘Standardised EWS training’
and mandatory attendance, followed by personalised
clinical feedback to support staff to take ownership of their
actions.

Clinical & Cost-effectiveness of the National Early Warning System (NEWS): Systematic Review Update
Health Research Board – Collaboration in Ireland for Clinical Effectiveness Reviews
273
Table 9.1 Characteristics of studies included in Q3 (Educational interventions) [continued]
Study Authors
(Year)
Country
Study Design
(a) Sample
(b) Setting
(c) Data Collection
(d) Education Programme
(e) Mode of Delivery
(f) Type of Participants
(g) Other information
Uncontrolled before -after studies
Mullany
(2016).(39)
Australia.
Retrospective
before-after
observational
study.
(a) N=161,153 separations and n=1,994 hospital deaths in
the study period from July 2008-Dec 2012. Pre-
intervention period included 44,505 separations and
post-intervention period included 116,648 separations.
(b) Prince Charles Hospital, tertiary university-affiliated
hospital, Brisbane.
(c) Dec 2009 the MET team commenced and a general
observation chart incorporating MEWS and MET criteria
were introduced. Real audit data of vital signs and
escalation used in ward education and meetings pre-
intervention (2008-2009) and post-intervention (2010-
2012).
(d) COMPASS ® education programme.
(e) Blended delivery.
(f) Doctors (90% of junior staff trained) and nurses (60% of
nursing staff trained).
(g) Ward observation chart re-designed with vital sign
variables colour-coded to identify variation from the
normal range and calculation of MEWS. Minimum
frequency of vital sign measurement mandated. COMPASS
education package and e-learning package and a 2-hour
face-to-face small group format using ISBAR.
Key: AVPU: Alert, Voice, Pain, Unconscious; MEWS: Modified Early Warning System; SBAR: Situation, Background, Assessment, Response;
ABCDE: Airway, Breathing, Circulation, Disability, and Exposure; ICU: Intensive Care Unit; ISBAR: Identify, Situation, Background,
Assessment, Response; RRT: Rapid Response team; RAPIDS: Rescuing a Patient in Deteriorating Situations; MCQ: Multiple Choice
Question; eMEWS: electronic MEWS.
9.3 Findings
The outcomes reported varied from study to study, and were dependent on the aims of the
particular study. The findings are discussed according to a priori defined primary outcomes
(including increase in knowledge and performance; effect on patient outcomes and
improved patient rescue strategies) and secondary outcomes (improved documentation of
patient observation and improved compliance) as well as any other outcomes reported in
the studies and identified post-hoc (communication, collaboration and perception).
9.3.1 Primary outcomes
9.3.1.1 Increase in knowledge and performance
9.3.1.1.1 Knowledge
Eight of the 23 studies looked at an increase in knowledge post-educational intervention, all
of which showed a significant effect of the intervention (that is staff knowledge was
improved post-intervention).

Clinical & Cost-effectiveness of the National Early Warning System (NEWS): Systematic Review Update
Health Research Board – Collaboration in Ireland for Clinical Effectiveness Reviews
274
These included four RCTs (two of these RCTs considered nursing students(168, 178) with the
other two investigating the effect on registered or enrolled nurses performance).(167, 179) The
interventions consisted of web-based simulation programmes in two of the RCTs,(167, 179)
with two considering lab based simulations. (168, 178)
Four uncontrolled before- after studies examined the effectiveness of EWS educational
interventions on knowledge. These included a mannequin-based simulation intervention in
nurses,(176) a 2-phase educational programme (e-learning module and simulation scenarios)
in nurses,(171) a web-based e-RAPIDS simulation intervention tested in 99 registered nurses
and enrolled nurses(181) and an educational intervention consisting of the provision of
information on detecting deterioration and responding appropriately as well as training on
the new observation chart in a group of 322 nurses from 12 different wards,(185) (Appendix
6).
9.3.1.1.2 Performance and confidence
Ten of the 23 studies looked at performance and or confidence post-educational
intervention, all of which reported a significant effect of the intervention (i.e. an increase in
performance and or confidence).
These included five RCTs of varying interventions: RAPIDS simulation-based training in
student nurses,(166, 178) web-based simulation in a group of 67 registered nurses,(167, 179) and a
web-based simulation intervention in a group of 64 enrolled nurses.(180) A single nRCT (a
quasi experimental trial)(169) measured performance in registered nurses who were trained
in the use of a MEWS and SBAR. Four before-after studies examined the effectiveness of
EWS educational interventions on performance. Interventions included a 2-phase
educational programme (e-learning module and simulation scenarios) in nurses, (171)
introducing MEWS to psychiatric nurses in an in-patient mental health setting,(173) registered
nurses and enrolled nurses using a web-based simulation educational intervention,(181) and

Clinical & Cost-effectiveness of the National Early Warning System (NEWS): Systematic Review Update
Health Research Board – Collaboration in Ireland for Clinical Effectiveness Reviews
275
an educational intervention consisting of the provision of information on detecting
deterioration and responding appropriately as well as training on the new observation chart
in a group of 322 nurses from 12 different wards,(183) (Appendix 6).
9.3.1.2 Effect on patient outcomes
Eight of the 23 studies looked at the effect on patient outcomes post-educational
intervention overall, with five reporting a significant effect of the intervention.
No RCTs were identified.
A single ITS study by Kinsman et al.,(175) reported no significant effect of the intervention on
patient outcomes including no change in the administration of oxygen therapy to patients
post-mannequin based simulation intervention as well as no difference between MET
criteria calls pre-intervention post-intervention.
Seven before- after studies included patient outcomes, of which five reported a significant
effect of the intervention (which may include an improvement or worsening of the patient
outcomes including serious adverse events [SAEs]).
De Meester et al.(48) investigated SAEs including unexpected deaths, unplanned admission to
the ICU, mortality, LOS, and cardiac arrest team calls for ten months before and after SBAR
training. There were 4.4 SAEs per 1,000 admissions pre-intervention and 6.7 SAEs per 1,000
admissions post-intervention (p<0.05), a worsening of patient outcomes. There were 16
unexpected deaths (0.99 per 1,000 admissions) pre-intervention and five unexpected deaths
(0.34 per 1,000 admissions) post-intervention (a relative risk reduction (RRR) of -227%, 95%
confidence interval (CI) -793%, -20%), p<0.001. Unplanned admission to the ICU increased
from 51 (13.1 per 1,000 admissions) pre-intervention to 105 (14.8 per 1,000 admissions)
post-intervention (RRR of 50%, 95% CI 30%, 64%), p=0.001. There was no significant
difference in mortality, LOS or cardiac arrest team calls pre- and post-intervention.

Clinical & Cost-effectiveness of the National Early Warning System (NEWS): Systematic Review Update
Health Research Board – Collaboration in Ireland for Clinical Effectiveness Reviews
276
Rose et al.,(172) was an American-based QIP, retrospective uncontrolled before-after study
including 108 core staff members. The investigators measured the effect of one-on-one
small group education sessions on patient outcomes for 90 days before and after the
intervention. The patient RRT survival rate remained unchanged before (23, 100%) and after
the intervention (17, 100%). The post RRT transfer rate was 11 (43%) before and 10 (64%)
after. The number of RRT calls before (n=23) decreased after the intervention (n=17) (no
rates or statistical data provided within the study).
Wood et al.,(182) looked at unscheduled admissions to the ICU before and for 12 months
after an educational intervention and found that a mean EWS score of 7 prompted
admission to critical care for adults and that consultant involvement was present in 51% of
adult cases. These limited data suggest that for the sickest adult patients, observations
often improve following initial medical intervention and that early review within working
hours may prevent deterioration and need for escalation out of hours. It also shows there
was a trend towards more timely admission to critical care for the adult patient when the
ward consultant had been involved in the escalation process.
Sebat et al.,(157) compared cardiac arrests, hospital mortality and RRT calls per 1,000
discharges 24 months before and 33 months after a four part RRT-intervention (one
component of which was an educational intervention). A significant reduction in cardiac
arrests per 1,000 discharges was found (pre intervention: 3.1 per 1,000, post intervention:
2.4 per 1,000, p=0.04); a significant reduction in the unadjusted hospital mortality rate (pre-
intervention: 3.7%; post-intervention 3.2%, p<0.001) and a significant increase in the
number of RRT calls per 1,000 discharges (pre-intervention: 10.2 per 1,000; post-
intervention 48.8 per 1,000, p<0.001) were reported.
Liaw et al.,(181) reported the number of RRT calls before and after a web-based educational
intervention on two different wards and found a significant increase on the medical ward
(pre: 8.96%, post 14.58%, p<0.001) but not on the surgical ward (pre: 1.97%, post: 1.23%,
p=0.15).

Clinical & Cost-effectiveness of the National Early Warning System (NEWS): Systematic Review Update
Health Research Board – Collaboration in Ireland for Clinical Effectiveness Reviews
277
Jung et al.,(62) investigated the effect of an educational intervention in four different French
hospitals (the RRT intervention hospital and three non-RRT control hospitals) and found
significant reductions post-intervention in the RRT hospital for unexpected mortality
(p=0.002), overall mortality (p=0.012) and unplanned ICU admissions (p=0.002). No
significant difference was found in cardiac arrests (p=0.093) or median hospital LOS
(p=0.09).
Mullany et al.,(39) looked at the effect of COMPASS© training on patient outcomes including
the all-cause hospital mortality rate which decreased from 14 per 1,000 observations pre
intervention to 11.8 per 1,000 post intervention (absolute change 2.2 per 1,000, 95% CI 1-
3.5 per 1,000, p=0.003). In addition, the hospital standardised mortality ratio was 95.7 on
average for the two year period of 2008 to 2009. It fell 11% in the first six months after
implementation and fell again in 2011 and 2012 and by the second half of 2012 was 66 (a
31% total decline over 3 years). The in-hospital cardiac arrest calls rate decreased from 5.5
per 1,000 observations before the introduction of the MET to 3.3 per 1,000 observations
after(absolute change 2.2 per 1,000, 95% CI 1.4-3, p=<0.001). Emergency ICU admissions
following emergency calls increased from 41 admissions in 2009 to 121 admissions in 2012.
However average length of stay in the ICU decreased from 140 hours in 2009 to 95 hours in
2012. Hospital LOS: average decreased from 5.9 days in 2009 to 4.7 days in 2012. Finally,
MET calls increased from 8.3 per 1,000 separations in 2010 to 9.1 per 1,000 in 2011 and
11.3 per 1,000 in 2012, an increase of approximately one call per month every two months
(Appendix 6).
9.3.1.3 Improved patient rescue strategies
No study looked at improved patient rescue strategies post-educational intervention.

Clinical & Cost-effectiveness of the National Early Warning System (NEWS): Systematic Review Update
Health Research Board – Collaboration in Ireland for Clinical Effectiveness Reviews
278
9.3.2 Secondary outcomes
9.3.2.1 Improved documentation of patient observations
Eight of the 23 studies looked at the improvement in documentation of patient observations
post-educational intervention with all eight studies reporting a significant effect of the
intervention.
Two RCTs(179, 180) (one in a group of registered nurses, the other in a group of 64 enrolled
nurses) investigated the effect of a web-based e-RAPIDs educational intervention on
documentation of vital signs in a simulation-based assessment one week after training. Both
studies found no difference in documentation of BP or SpO2 post-intervention and a
significant improvement in RR and HR documentation.
A single nRCT by Ludikhuize et al.,(169) of 95 registered nurses, investigated the nurse
reported measurement of vital signs and a MEWS. Trained nurses were given a patient case
chart and asked what vital signs they would request (measure) in reality. Pulse, BP,
temperature and SpO2 were the most requested vital sign parameters (78-84% in both
groups). In total, 53% of trained nurses reported that they would request RR, compared to
25% of non-trained nurses, p=0.025). Fifty percent of all nurses reported they would request
pain measurement using a visual analogue scale. Of the trained nurses, only 4 (11%)
determined and calculated the MEWS correctly.
A single ITS study by Kinsman et al.(175) showed that unsatisfactory pain score charting
decreased by -0.179 points (range 0-9 points on a 9-item MCQ test) post-intervention
(p=0.003). Unsatisfactory frequency of observations decreased -0.112 points post-
intervention, (p=0.009) and observation frequency improved in medical (p=0.003) but not in
surgical patients (p=0.403).
Four uncontrolled before- after studies examined the effectiveness of EWS educational
interventions on documentation of patient observations, with all four showing a significant
effect of the intervention (i.e. an improvement in documentation).

Clinical & Cost-effectiveness of the National Early Warning System (NEWS): Systematic Review Update
Health Research Board – Collaboration in Ireland for Clinical Effectiveness Reviews
279
Cahill et al.,(164) and Hammond et al.(174) both looked at the improvement in the
documentation of a ‘full set’ of vital signs. Cahill et al.,(164) reported an improvement from
pre-intervention (47.6%) to two weeks post-intervention (96.3%) and remaining at three
months post-intervention (96.4%). The documentation of RR (which is consistently the least
documented vital sign) improved from 47.8% pre-intervention to 97.8% two weeks post-
intervention and remained at 98.5% three months post-intervention. Documentation of BP,
SpO2 and HR remained consistently high pre- and post-intervention. Hammond et al.(174)
reported on improvements three months post-intervention in two groups (1, ICU discharge
patients, 2, Unplanned ICU admissions). In the ICU discharge patients group there was a
statistically significant increase post intervention (210%, 95% CI (148% - 288%), p<0.01).
Single parameter documentation significantly increased for temperature (25.5%, 95% CI
8.1%-45.7%, p=0.003) and urine output (which was not on the chart pre-implementation)
increased to 103% (95% CI 80.0%-129.7%), p=<0.001). Documentation for systolic and
diastolic BP, HR, RR and SpO2 did not significantly increase. In the unplanned ICU admissions
group and the full observation set (7 parameters) post intervention there was a 44%
increase in documentation (95% CI 2.6% - 102.1%), p=0.04). When looking at single
parameter documentation only urine output significantly increased: 26.9%, (95% CI 2.5%-
57.1%), p=<0.03.
In another uncontrolled pre-post intervention study by Rose et al.,(172)
undocumented eMEWS scores were reported: pre-intervention (11, 49%), post intervention
(0, 0%) and an eMEWS score (with a range of 0-6) mean of 2.3 (SD 1.79) pre-intervention
and a mean of 3.2 (SD 1.79) post-intervention.
A study by Merriel et al.,(170) measured documentation of patient observations in a sample
of junior doctors and junior and senior nurses. The documentation of individual EWS scores
were calculated correctly 93% of the time over six months pre-implementation and 94% of
the time over six months post-implementation, Relative Risk 1.01 (95% CI (1.00, 1.03),
p=<0.05). At admission all EWS scores were calculated correctly for a patient’s admission

Clinical & Cost-effectiveness of the National Early Warning System (NEWS): Systematic Review Update
Health Research Board – Collaboration in Ireland for Clinical Effectiveness Reviews
280
pre-implementation 55% of the time and post-implementation 68% of the time, Relative
Risk 1.24 (95% CI (1.07, 1.44), p<0.01). There was no significant difference with regard to
completion of at least one set of required observations (e.g. at least BP) pre-implementation
(68%) and post-implementation (79%), Relative Risk 1.2 (95% CI (1.09, 1.32), p=<0.01). The
study also measured how often observations were performed as per the EWS guidelines and
found that fewer than half were documented as per the EWS guidelines pre-implementation
(46%), increasing post-implementation to 59% , Relative Risk 1.33, (95% CI 1.13, 1.57)
(Appendix 6).
9.3.2.2 Improved compliance
Two of the 23 studies looked at improved compliance post-educational intervention with
both reporting a significant effect of the intervention (i.e. improved compliance), both were
before- after studies.
A study by Wood et al.,(182) looked at compliance with an EWS in a single university hospital
in the UK. They had five targets and achieved four out the five in a one year period. 1)
Observations done four hourly: Quarter 1 (65%), Quarter 4 (96%) [Target (75%) achieved]; 2)
EWS correctly scored and added up: Quarter 1 (88%), Quarter 4 (93%) [Target (95%) not
achieved]; 3) Frequency of observations increased appropriately: Quarter 1 (36%), Quarter 4
(50%) [Target (35%) achieved]; 4) NURSING escalation correct: Quarter 1 (22%), Quarter 4
(57%) [Target (35%) achieved]; and 5) Medical escalation correct: Quarter 1 (31%), Quarter
4, (37%) [Target (35%) achieved].
A retrospective observational study with before (two years) and after (three years)
intervention comparisons by Mullany et al.,(39) measured compliance with appropriate
frequency of vital signs. Following introduction of monthly ward-based audits, compliance
with correct frequency of vital signs rapidly rose to above the target of 90%. Completeness
of vital signs increased from a mean of 60% in 2010 to 70% in 2011. The intervention
resulted in progressive improvement in compliance to 86% in December 2012 and the 90%

Clinical & Cost-effectiveness of the National Early Warning System (NEWS): Systematic Review Update
Health Research Board – Collaboration in Ireland for Clinical Effectiveness Reviews
281
target was reached in March 2013. The addition of escalation documentation by nurses to
monthly audits in 2011 improved this from 79% to 90% by 2012.
9.3.3 Other post-hoc identified outcomes
9.3.3.1 Communication, collaboration and perception
Four of the 23 studies looked at communication, collaboration or perception, with all four
reporting a significant effect of the intervention (i.e. an improvement in communication,
collaboration or perception).
Two RCTS were included. An RCT by Liaw et al.,(177) investigated the use of the ABCDE and
SBAR tools alongside simulation to improve communication and handover which reported
significant effects of the intervention. The intervention group mean total ABCDE domain
score (which ranges from 0-36) increased significantly between baseline (mean 10.37, SD
2.48) and one week post-intervention (mean 20.13, SD 3.29, p=0.001). No significant
difference was found in the control group (baseline mean 10.22, SD 2.39; post-intervention
mean 11.22, SD 2.25). Significant increases were found in the following individual ABCDE
domains in the intervention group: Airway; Breathing; and Circulation. No significant
increases were found in the other two domains (Disability, Examine). The total SBAR score
for communication in the intervention group, in the RCT by Liaw et al.,(177) also significantly
increased between baseline (mean 8.47, SD 1.62) and post intervention (mean 11.77, SD
2.83), (p=0.01). However, the intervention group did not show any significant improvement
on the post-test scores for individual SBAR subscales except Assessment. The control group
showed a significant improvement in the post-test score for the ‘global rating performance’
(baseline mean 3.34, SD 1.45), post score mean (3.84, SD 1.35), (p=0.05) but not for the rest
of the SBAR domains. A further RCT by Liaw et al.,(180) investigating the effect of a web-
based simulation tool as well as the use of ISBAR and ABCDE communication tools found a
significant improvement in the intervention group in a simulation-based assessment one
week after training (p<0.001) and no change in the control group (p>0.05). A significant
between group comparison was found (p<0.01).
Clinical & Cost-effectiveness of the National Early Warning System (NEWS): Systematic Review Update
Health Research Board – Collaboration in Ireland for Clinical Effectiveness Reviews
282
An nRCT by Ludikhuize et al.,(169) provided SBAR training to the intervention group of
registered nurses and reported mixed results. The results showed that only 1 (4%) of the
trained nurses used SBAR to communicate with the physician. In addition, measured
parameters were only communicated to the physician in 60% of phone calls. Where it was
measured, RR was communicated twice as frequently by trained nurses than by non-trained
nurses (83% versus 40%). In the four cases where MEWS was calculated (11% of trained
nurses), one nurse (2%) followed the protocol correctly and called the physician (but did not
mention MEWS). Two nurses took no action and one checked the patient again at a later
time. With regards to communicating with and notifying the physician: 24 nurses (67%) in
the trained group and 12 (43%) in the non-trained group contacted the physician
immediately (p=0.059). When Ward C was excluded (due to demographic differences), 67%
of trained nurses and 22% of non-trained nurses notified a physician (p=0.037).
A single before- after study by De Meester et al.,(48) looked at communication, collaboration
and perception post-educational intervention using the Communication, Collaboration and
Critical Thinking Quality Patient Outcomes Survey Tool (CCCT). This tool provides a
transformed score ranging from 0-100. Nurses total score pre-intervention was 58.6 (31-97)
and increased to 63.9 (25-97) post-intervention, (p≤0.001). Collaboration increased from
pre-intervention (56.2, 0-100) to post-intervention (62.2, 17-100), p≤0.001. Communication
with the physician significantly increased from pre-intervention (62.9, 20-100) to post-
intervention (68.9, 13-100), (p≤0.001). Overall perception of communication significantly
improved between pre-intervention (55.3, 0-89) and post-intervention 58.4, 0-100, p=0.042)
among nurses (Appendix 6)

Clinical & Cost-effectiveness of the National Early Warning System (NEWS): Systematic Review Update
Health Research Board – Collaboration in Ireland for Clinical Effectiveness Reviews
283
9.4 Methodological quality
A number of different study designs were included (RCTs, non-RCTs, interrupted time series,
and before-after observational studies) in this systematic review update and therefore the
methodological quality was appraised using different tools. The quality of included studies is
presented according to the different study designs.
9.4.1 RCTs
The Cochrane risk of bias tool(23) was used to appraise the methodological quality of the
seven RCTs(166-168, 177-180). Overall, six of the seven trials had a low risk of bias.(166, 167, 177-180)
One trial(168) had a high risk of bias due to unclear random sequence generation, lack of
allocation concealment, lack of blinding, incomplete outcome data, and other bias (
Figure 9.1, Figure 9.2).
Figure 9.1 Risk of bias summary for RCTs of educational interventions and deterioration in
adults in acute health care settings

Clinical & Cost-effectiveness of the National Early Warning System (NEWS): Systematic Review Update
Health Research Board – Collaboration in Ireland for Clinical Effectiveness Reviews
284
Figure 9.2 Risk of bias graph for included RCTs of educational interventions and
deterioration in adults in acute health care settings
9.4.1.1 Allocation
Random sequence generation and allocation concealment
Six of the trials described the method of sequence generation used and allocation
concealment and had a low risk of bias.(166, 167, 177-180) One trial did not describe the method
sequence generation or allocation concealment and so had an unclear risk of bias.(168)
9.4.1.2 Blinding participants and personnel (performance bias)
Five of the trials had a low risk of bias for blinding of participants.(166, 167, 177-179) Two trials
had a high risk of bias as it stated that participants were told they were receiving the
intervention.(168, 180) Blinding of personnel was low risk in four trials,(166, 167, 179, 180) two trials
had an unclear risk of blinding for personnel as it was not stated,(177, 178) and one trial had a
high risk of bias for blinding of personnel (investigators were aware of who received the
intervention).

Clinical & Cost-effectiveness of the National Early Warning System (NEWS): Systematic Review Update
Health Research Board – Collaboration in Ireland for Clinical Effectiveness Reviews
285
9.4.1.3 Detection bias
All seven trials had a low risk of detection bias (outcomes were scored independently by
two assessors using a validated tool and inter-rater reliability was high,(166, 167, 177-180) or pre-
test and post-test surveys were scored using a Scantron machine.(168)
9.4.1.4 Incomplete outcome data
Five of the trials described loss to follow-up and accounted for participants.(166, 167, 177-179)
Two trials had an unclear risk of bias for attrition as they did not report any details regarding
attrition bias(168) or why participants were excluded.(180)
9.4.1.5 Selective reporting
All seven trials had a low risk of bias for selective outcome reporting and provided results
for the pre-specified outcomes.(166-168, 177-180)
9.4.1.6 Other potential sources of bias
Two trials had a low risk of bias for ‘other potential sources of bias’.(177, 178) Four trials had a
high risk of other bias. One trial was unable to control for differences between the
comparison (virtual vs. mannequin-based simulation, i.e. comparison confounded) and for
confidentially and contamination between the two post-test time points.(166) Another trial
reported that the quality of the evidence could be limited by the ‘no-intervention control’
group but given that the study is looking at the development of a new web-based learning
programme for hospital nurses, the no-intervention controlled study is still considered
valuable in the early stages of an innovation.(167) In this same trial and another trial(179) the
first author was the owner and developer of the simulation software. The trial by Lindsey et
al.(168) used a convenience sample and reported that external validity may have been
threatened by the interaction of the pre-test and the educational intervention as well as the
fact that multiple educational interventions were used sequentially, which may have
confounded the results. One trial had an unclear risk of bias as the author developed the e-
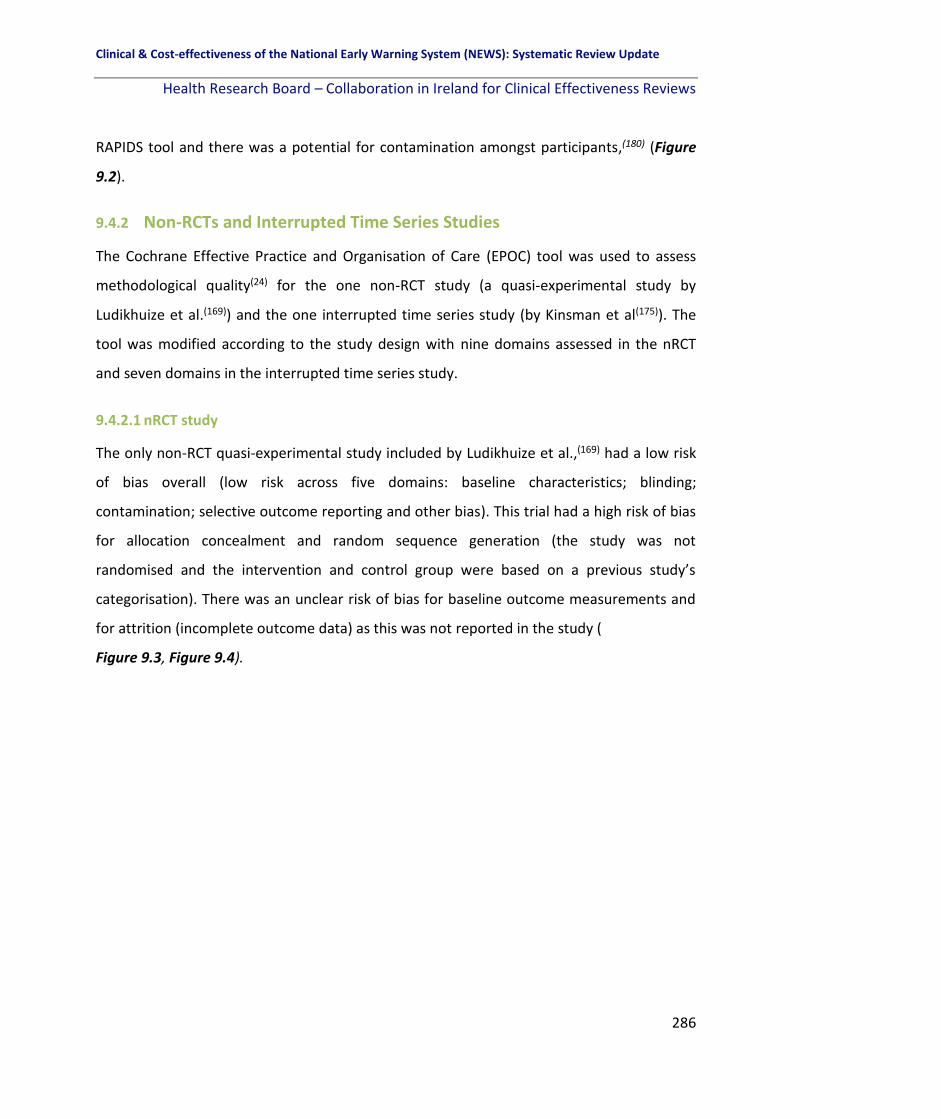
Clinical & Cost-effectiveness of the National Early Warning System (NEWS): Systematic Review Update
Health Research Board – Collaboration in Ireland for Clinical Effectiveness Reviews
286
RAPIDS tool and there was a potential for contamination amongst participants,(180) (Figure
9.2).
9.4.2 Non-RCTs and Interrupted Time Series Studies
The Cochrane Effective Practice and Organisation of Care (EPOC) tool was used to assess
methodological quality(24) for the one non-RCT study (a quasi-experimental study by
Ludikhuize et al.(169)) and the one interrupted time series study (by Kinsman et al(175)). The
tool was modified according to the study design with nine domains assessed in the nRCT
and seven domains in the interrupted time series study.
9.4.2.1 nRCT study
The only non-RCT quasi-experimental study included by Ludikhuize et al.,(169) had a low risk
of bias overall (low risk across five domains: baseline characteristics; blinding;
contamination; selective outcome reporting and other bias). This trial had a high risk of bias
for allocation concealment and random sequence generation (the study was not
randomised and the intervention and control group were based on a previous study’s
categorisation). There was an unclear risk of bias for baseline outcome measurements and
for attrition (incomplete outcome data) as this was not reported in the study (
Figure 9.3, Figure 9.4).
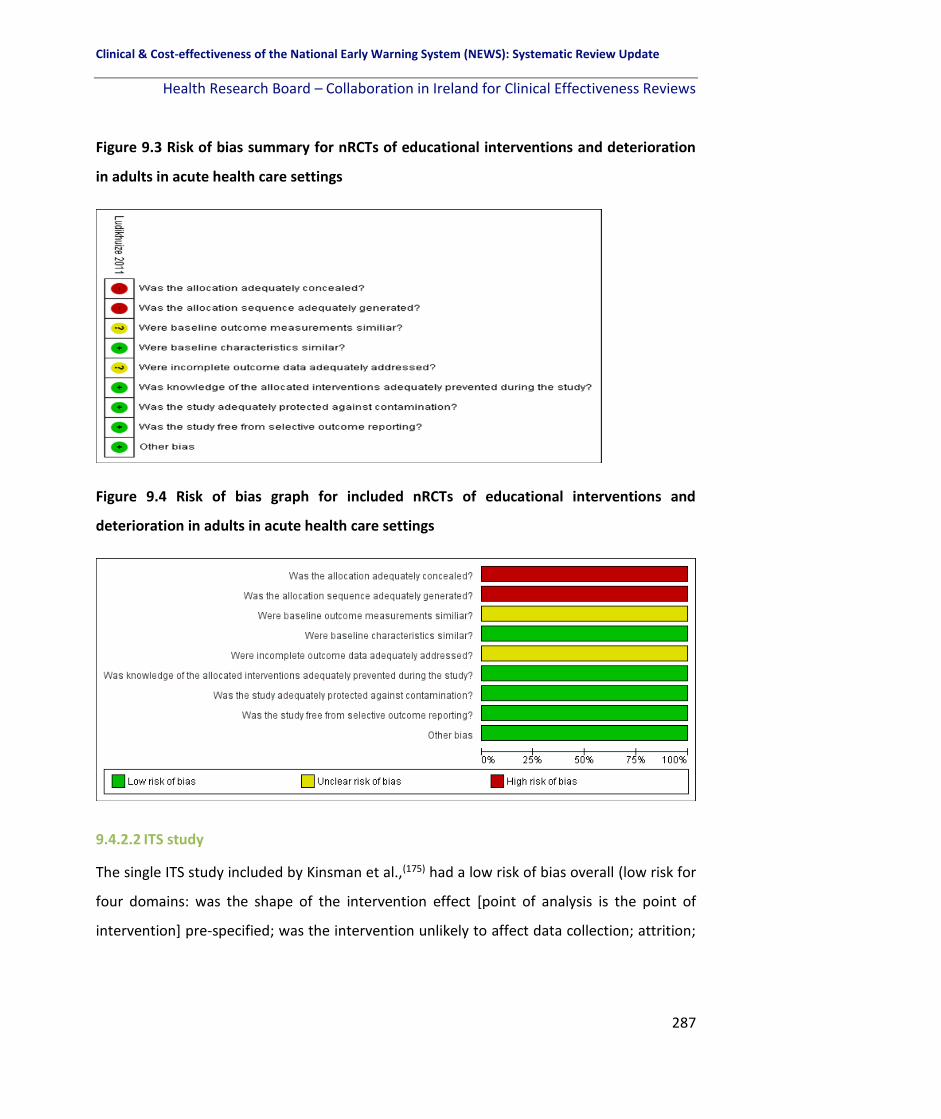
Clinical & Cost-effectiveness of the National Early Warning System (NEWS): Systematic Review Update
Health Research Board – Collaboration in Ireland for Clinical Effectiveness Reviews
287
Figure 9.3 Risk of bias summary for nRCTs of educational interventions and deterioration
in adults in acute health care settings
Figure 9.4 Risk of bias graph for included nRCTs of educational interventions and
deterioration in adults in acute health care settings
9.4.2.2 ITS study
The single ITS study included by Kinsman et al.,(175) had a low risk of bias overall (low risk for
four domains: was the shape of the intervention effect [point of analysis is the point of
intervention] pre-specified; was the intervention unlikely to affect data collection; attrition;

Clinical & Cost-effectiveness of the National Early Warning System (NEWS): Systematic Review Update
Health Research Board – Collaboration in Ireland for Clinical Effectiveness Reviews
288
and selective outcome reporting). There was a high risk of bias for blinding (study was not
blinded or randomised and all nurses received the intervention). There was an unclear risk
of bias for the intervention being independent of other changes. However, the authors state
that “the issue of contamination of the sample was considered and contributed to our
design to invite participation from an entire roster of nurses from a single ward and to
encapsulate measurements from medical records to that ward”. There was an unclear risk
of bias for other bias (seasonality may have been an issue), (Figure 9.5, Figure 9.6).
Figure 9.5 Risk of bias summary for ITS studies of educational interventions and
deterioration in adults in acute health care settings
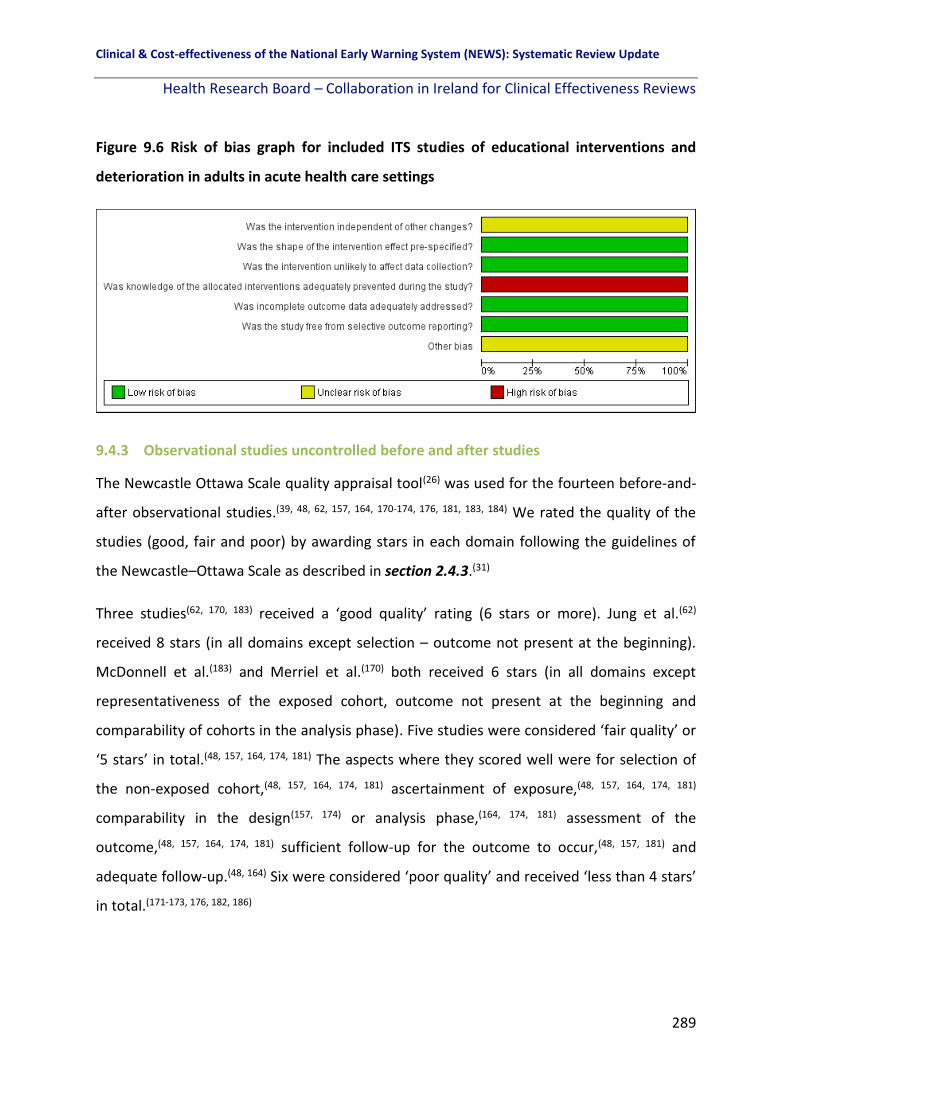
Clinical & Cost-effectiveness of the National Early Warning System (NEWS): Systematic Review Update
Health Research Board – Collaboration in Ireland for Clinical Effectiveness Reviews
289
Figure 9.6 Risk of bias graph for included ITS studies of educational interventions and
deterioration in adults in acute health care settings
9.4.3 Observational studies uncontrolled before and after studies
The Newcastle Ottawa Scale quality appraisal tool(26) was used for the fourteen before-and-
after observational studies.(39, 48, 62, 157, 164, 170-174, 176, 181, 183, 184) We rated the quality of the
studies (good, fair and poor) by awarding stars in each domain following the guidelines of
the Newcastle–Ottawa Scale as described in section 2.4.3.(31)
Three studies(62, 170, 183) received a ‘good quality’ rating (6 stars or more). Jung et al.(62)
received 8 stars (in all domains except selection – outcome not present at the beginning).
McDonnell et al.(183) and Merriel et al.(170) both received 6 stars (in all domains except
representativeness of the exposed cohort, outcome not present at the beginning and
comparability of cohorts in the analysis phase). Five studies were considered ‘fair quality’ or
‘5 stars’ in total.(48, 157, 164, 174, 181) The aspects where they scored well were for selection of
the non-exposed cohort,(48, 157, 164, 174, 181) ascertainment of exposure,(48, 157, 164, 174, 181)
comparability in the design(157, 174) or analysis phase,(164, 174, 181) assessment of the
outcome,(48, 157, 164, 174, 181) sufficient follow-up for the outcome to occur,(48, 157, 181) and
adequate follow-up.(48, 164) Six were considered ‘poor quality’ and received ‘less than 4 stars’
in total.(171-173, 176, 182, 186)

Clinical & Cost-effectiveness of the National Early Warning System (NEWS): Systematic Review Update
Health Research Board – Collaboration in Ireland for Clinical Effectiveness Reviews
290
Table 9.3 Quality Assessment of before-and-after studies
Study Selection Comparability Outcome Overall Quality
S1 Exposed
cohort
representative
S2 Selection
of non-
exposed
cohort
S3
Ascertainment
of exposure
S4 Outcome not
present at beginning
C1
Comparability of
cohorts in
design phase
C2
Comparability
of cohorts in
analysis phase
O1
Assessment
of outcome
O2 Follow-up
sufficient for
outcome to occur
O3 Adequate
follow-up
Total stars
Cahill
(2011)(164) One tertiary
hospital,
Australia.
*
*
Documentation of
vital signs being
measured before the
intervention.
*
Non-
randomised,
uncontrolled,
study.
*
Only 3 months
post intervention. *
5 *
(FAIR QUALITY)
De Meester
(2013) (48) Single hospital,
Belgium. *
*
Cannot say the
outcomes of interest
did not exist pre-
intervention.
Confounding is
an issue. Confounding is
an issue. *
*
*
5 *
(FAIR QUALITY)
Hammond
(2013)(174) One tertiary
hospital,
Australia, ICU
patients
*
*
Documentation of
vital signs being
measured before the
intervention.
*
*
*
Only 3 months
post intervention,
for a period of 24
hours only – small
ICU sample size.
Not reported. 5 *
(FAIR QUALITY)
Jung et al (2016)(62)
* * * Statement of ‘no
history of CA or ICU
admission’ was not
provided
* * * * * 8 *
(GOOD QUALITY)
McDonnell et al (2012)(183)
N=247 nurses
drawn from a
single hospital
* * Cannot state this
categorically.
* Does not
control for
additional
factors in
analysis phase
* * * 6* (GOOD QUALITY)

Clinical & Cost-effectiveness of the National Early Warning System (NEWS): Systematic Review Update
Health Research Board – Collaboration in Ireland for Clinical Effectiveness Reviews
291
Table 9.3 Quality Assessment of before-and-after studies [continued]
Study Selection Comparability Outcome Overall Quality
S1 Exposed
cohort
representative
S2 Selection of non-
exposed cohort
S3
Ascertainme
nt of
exposure
S4 Outcome not
present at
beginning
C1
Comparability of
cohorts in
design phase
C2 Comparability
of cohorts in
analysis phase
O1
Assessment
of outcome
O2 Follow-up
sufficient for
outcome to occur
O3
Adequate
follow-up
Total stars
Sebat et al (2018)(157)
One regional
hospital
* * Statement of ‘no
history of CA’ was
not provided
* Does not control
for additional
factors in analysis
phase
* * Prospective
study
however no
flow
diagram
provided
5 *
(FAIR QUALITY)
Shaddel
(2014)(173) Single
psychiatric unit,
UK.
Nurses completed
pre-test survey and
post-test survey –
no control group.
Self-reported
survey post
training
*
Confounding is
an issue.
Confounding is an
issue.
Self-
completed
post-
intervention
survey.
Immediately after
training.
Not
reported.
1 *
(POOR QUALITY)
Wood
(2015)(182) Single hospital,
UK) *
*
Cannot say the
outcomes of
interest did not
exist pre-
intervention.
Confounding is
an issue.
Confounding is an
issue. *
*
Not
reported.
4 *
(POOR QUALITY)
Key: ICU: Intensive Care Unit; LOS: Length of Stay; MCQ: Multiple Choice Questionnaire; eMEWS; Electronic Modified Early Warning Score

Clinical & Cost-effectiveness of the National Early Warning System (NEWS): Systematic Review Update
Health Research Board – Collaboration in Ireland for Clinical Effectiveness Reviews
292
9.5 Certainty of the evidence
We assessed the overall certainty of the evidence where appropriate. A narrative summary
of findings table was created using GRADEpro software for the following primary outcomes:
knowledge and performance/confidence. Patient outcomes were not included as these
were reported in very heterogeneous ways (for example as SAEs,(48) oxygen therapy
administered,(9) MET calls,(175) all-cause hospital mortality,(39) RRT survival rate,(172) and
unscheduled ICU admissions(182)). Overall the certainty of the evidence is very low owing to
a high risk of bias in the various study designs, a high risk of confounding and the overall
generalisability of the results as all of the studies were conducted in single centre settings in
various countries where the findings may not be applicable to other health care settings (
The effectiveness of educational interventions in detecting physiological deterioration in adult (non-pregnant) patients in acute health care settings
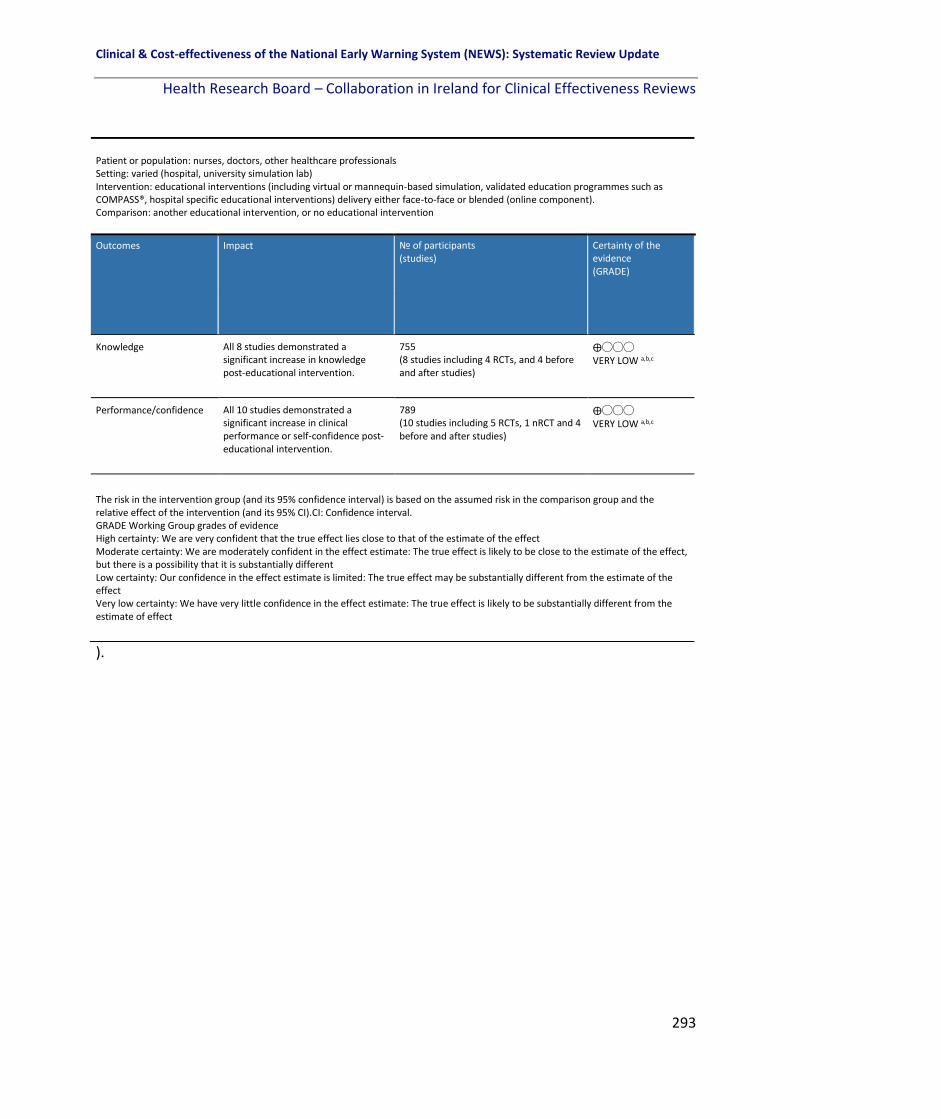
Clinical & Cost-effectiveness of the National Early Warning System (NEWS): Systematic Review Update
Health Research Board – Collaboration in Ireland for Clinical Effectiveness Reviews
293
).
Patient or population: nurses, doctors, other healthcare professionals Setting: varied (hospital, university simulation lab) Intervention: educational interventions (including virtual or mannequin-based simulation, validated education programmes such as COMPASS®, hospital specific educational interventions) delivery either face-to-face or blended (online component). Comparison: another educational intervention, or no educational intervention
Outcomes Impact № of participants (studies)
Certainty of the evidence (GRADE)
Knowledge All 8 studies demonstrated a significant increase in knowledge post-educational intervention.
755 (8 studies including 4 RCTs, and 4 before and after studies)
⨁◯◯◯ VERY LOW a,b,c
Performance/confidence All 10 studies demonstrated a significant increase in clinical performance or self-confidence post-educational intervention.
789 (10 studies including 5 RCTs, 1 nRCT and 4 before and after studies)
⨁◯◯◯ VERY LOW a,b,c
The risk in the intervention group (and its 95% confidence interval) is based on the assumed risk in the comparison group and the relative effect of the intervention (and its 95% CI).CI: Confidence interval. GRADE Working Group grades of evidence High certainty: We are very confident that the true effect lies close to that of the estimate of the effect Moderate certainty: We are moderately confident in the effect estimate: The true effect is likely to be close to the estimate of the effect, but there is a possibility that it is substantially different Low certainty: Our confidence in the effect estimate is limited: The true effect may be substantially different from the estimate of the effect Very low certainty: We have very little confidence in the effect estimate: The true effect is likely to be substantially different from the estimate of effect

Clinical & Cost-effectiveness of the National Early Warning System (NEWS): Systematic Review Update
Health Research Board – Collaboration in Ireland for Clinical Effectiveness Reviews
294
Table 9.2 Summary of finding table for the quality of the evidence
The effectiveness of educational interventions in detecting physiological deterioration in adult (non-pregnant) patients in acute health care settings
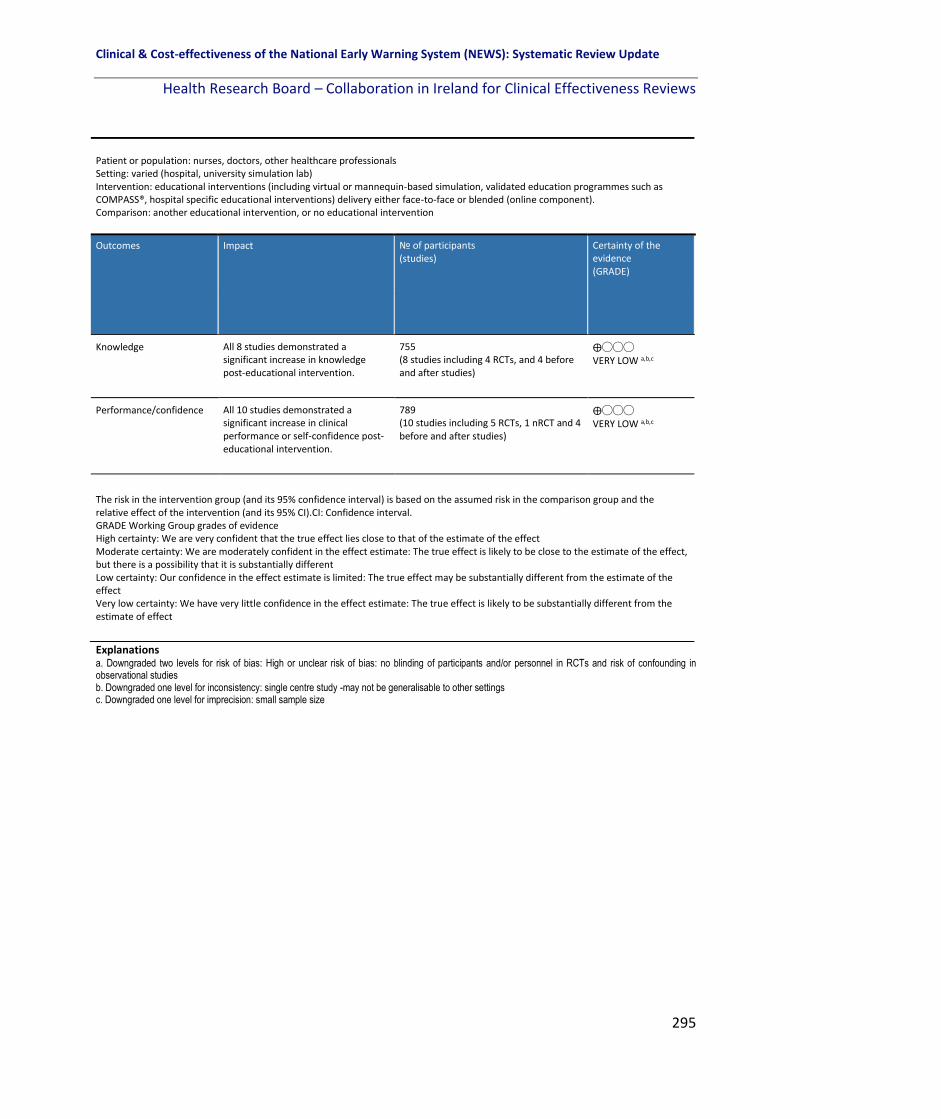
Clinical & Cost-effectiveness of the National Early Warning System (NEWS): Systematic Review Update
Health Research Board – Collaboration in Ireland for Clinical Effectiveness Reviews
295
Explanations a. Downgraded two levels for risk of bias: High or unclear risk of bias: no blinding of participants and/or personnel in RCTs and risk of confounding in observational studies b. Downgraded one level for inconsistency: single centre study -may not be generalisable to other settings c. Downgraded one level for imprecision: small sample size
Patient or population: nurses, doctors, other healthcare professionals Setting: varied (hospital, university simulation lab) Intervention: educational interventions (including virtual or mannequin-based simulation, validated education programmes such as COMPASS®, hospital specific educational interventions) delivery either face-to-face or blended (online component). Comparison: another educational intervention, or no educational intervention
Outcomes Impact № of participants (studies)
Certainty of the evidence (GRADE)
Knowledge All 8 studies demonstrated a significant increase in knowledge post-educational intervention.
755 (8 studies including 4 RCTs, and 4 before and after studies)
⨁◯◯◯ VERY LOW a,b,c
Performance/confidence All 10 studies demonstrated a significant increase in clinical performance or self-confidence post-educational intervention.
789 (10 studies including 5 RCTs, 1 nRCT and 4 before and after studies)
⨁◯◯◯ VERY LOW a,b,c
The risk in the intervention group (and its 95% confidence interval) is based on the assumed risk in the comparison group and the relative effect of the intervention (and its 95% CI).CI: Confidence interval. GRADE Working Group grades of evidence High certainty: We are very confident that the true effect lies close to that of the estimate of the effect Moderate certainty: We are moderately confident in the effect estimate: The true effect is likely to be close to the estimate of the effect, but there is a possibility that it is substantially different Low certainty: Our confidence in the effect estimate is limited: The true effect may be substantially different from the estimate of the effect Very low certainty: We have very little confidence in the effect estimate: The true effect is likely to be substantially different from the estimate of effect

Clinical & Cost-effectiveness of the National Early Warning System (NEWS): Systematic Review Update
Health Research Board – Collaboration in Ireland for Clinical Effectiveness Reviews
296
9.6 Discussion
This systematic review update of the effectiveness of educational interventions to improve
the detection of physiological deterioration in adult (non-pregnant) patients in acute health
care settings included 23 studies. Evidence from the review suggests that educational
interventions (including mannequin- or virtual-based simulation, validated programmes
such as COMPASS® or FIRST2ACT, or hospital specific programmes) succeed in increasing
healthcare staff (predominantly nursing staff) knowledge, clinical performance and self-
confidence to recognise and manage a deteriorating patient, at least in the short term. The
evidence also shows improvements in the documentation of vital signs and the use of EWS
post-educational intervention, but was mixed for the effect on patient outcomes including
ICU admission, length of stay and cardiac arrest. Communication (through the use of
standardised tools such as ISBAR, SBAR and ABCDE) between nurses and doctors in relaying
a deteriorating patient and escalation improved post-training in the majority of the 23
studies in the short term at least (i.e. immediately post-intervention).
There is however a lack of high quality evidence to evaluate the effect of EWS educational
programmes due to a number of factors. These include small sample size, a variation in the
educational programmes (interventions) used (validated programmes such as COMPASS®,
simulation, local hospital specific educational programmes), differences in how the effect of
the intervention is measured (self-reported compared with using a validated tool such as
RAPIDs or retrospective review of patient records and observation charts), duration of
follow-up of the outcomes (immediately post-intervention, three or six months later), the
definition of outcomes, how they were reported and the variety of outcomes examined
varied from study to study. The settings varied also (some were in hospitals while others
were in simulated non-clinical settings).
Future research is needed to address limitations highlighted in this review. Ideally study
designs of a more rigorous methodological quality are needed, preferably further RCTs
where blinding is maintained, including a large sample size of a range of HCPs and not just

Clinical & Cost-effectiveness of the National Early Warning System (NEWS): Systematic Review Update
Health Research Board – Collaboration in Ireland for Clinical Effectiveness Reviews
297
nurses to minimise bias. A standardised approach to the educational interventions used, the
measurement of their effect (using a validated tool) and a core set of outcomes (with
standardised definitions, which can be objectively measured with a focus on important
clinical outcomes for example length of stay or ICU transfers) are warranted.
9.7 Conclusion
The findings from the studies included which look at educational interventions and their
effect on healthcare staff and improving the detection and management of physiological
deterioration in adult patients in acute settings are of poor quality overall. However,
educational interventions typically resulted in a short term improvement in knowledge,
clinical performance, self-confidence, documentation of vital signs and nurse-physician
communication.
Clinical & Cost-effectiveness of the National Early Warning System (NEWS): Systematic Review Update
Health Research Board – Collaboration in Ireland for Clinical Effectiveness Reviews
298
10 Findings from the economic literature on the implementation of EWSs or track and trigger systems for the detection of acute physiological deterioration in adult (non-pregnant) patients in acute health care settings.
10.1 Chapter overview
This chapter in the systematic review update focusses on the literature relevant to question
four of the review, “What are the findings from the economic literature on cost-
effectiveness; cost-impact and resources involved with the implementation of EWSs or track
and trigger systems for the detection of or timely identification of physiological deterioration
in adult (non-pregnant) patients in acute health care settings?” The characteristics of the
included studies are described as well as the findings from each study reported, and the
methodological quality and transferability of the included studies is assessed. In accordance
with national health technology assessment (HTA) guidelines, the costs from previous
economic evaluations were adjusted and are presented in 2017 euro.(21)
10.2 Characteristics of the economic studies included in the review
In total, three studies were eligible for inclusion. These included one health technology
assessment (HTA) on the implementation of an electronic NEWS,(3) one budget impact
analysis (BIA) as part of National Clinical Guideline (NCG) No. 1 (The NEWS)(4) and one
costing study.(5) Two studies were conducted in Ireland,(3, 4) and one in the Netherlands.(5)
Two of the studies included the NEWS, (3, 4) and one included the implementation of a rapid
response system (RRS).(5) The populations included acute adult inpatients,(3) acute medical
patients,(4) and surgical patients.(5) Hospital or ICU length of stay (LOS) were the key clinical
outcomes included (Table 10.1).

Clinical & Cost-effectiveness of the National Early Warning System (NEWS): Systematic Review Update
Health Research Board – Collaboration in Ireland for Clinical Effectiveness Reviews
299
Table 10.1 Characteristics of studies included in the economic systematic review
Study author (year), country
Intervention Design (no. of studies)
Condition(s) or population targeted
Type of economic evaluation
Clinical Outcomes
(3) HIQA (2015), Ireland
Electronic NEWS
Systematic review with BIA (n=3)
Acute hospital, adult in-patient services excluding maternity and paediatrics
HTA including a BIA using data from a UK study to estimate costs.
Hospital LOS
(4) NCEC (2013), Ireland
NEWS Systematic review with BIA (n=2)
Adult acute medical patient
BIA Reduction in ICU bed days
(5) Simmes (2014), The Netherlands
Implementation of a RRS
Before-after study
Surgical patients >3 days post major surgery
Costing study ICU LOS
Key: HIQA: Health Information and Quality Authority; NCEC: National Clinical Effectiveness Committee; NEWS: National Early Warning Score; NCG: National Clinical Guideline; RRS: Rapid Response System; BIA: Budget Impact Analysis; AMU: Acute Medical Unit; HTA: Health Technology Assessment; ICU: Intensive Care Unit; LOS: Length of stay.
10.3 Results
A narrative synthesis of the results is presented given the heterogeneous nature of the
economic studies included.
10.3.1 HIQA 2015 Health Technology Assessment of the implementation of an electronic
EWS
The HTA conducted by HIQA in 2015(3) on the use of information technology for early
warning and clinical handover systems evaluated the resources that would be required to
introduce an electronic EWS in an Irish hospital (530-bed) setting compared to no EWS, as
well as the resources gained (reduced hospital LOS). Data from a UK study by Jones et al.,(88)
were used to estimate reductions in LOS by applying them to Irish LOS data. The results
showed average LOS on a general ward was reduced by 28.9% (CI 18.6% - 40.3%) and ICU
average LOS by 40.3% (4.6% - 76%), leading to additional national hospital capacity of
802,096 bed days per annum relative to a total capacity of 2.8 million acute hospital bed

Clinical & Cost-effectiveness of the National Early Warning System (NEWS): Systematic Review Update
Health Research Board – Collaboration in Ireland for Clinical Effectiveness Reviews
300
days per annum and 30,628 ICU bed-days per annum relative to a total capacity of 76,000
ICU bed days per annum (Table 10.2). This was considered an efficiency gain rather than a
monetary saving as the beds would be used for other patients. The electronic EWS was also
found to be 1.6 times faster than a paper EWS leading to a reduction in staff time spent
recording vital signs (not included in BIA as opportunity savings). The costs of changing to an
electronic EWS were examined over a five year period from a healthcare system
perspective. Resources were split into technology-based costs (hardware, software and
integration fees) and implementation costs (staff, education, clinical leadership and project
management). Two types of license fees were examined (annual fee and once off payment)
with the annual licence fee being the best value for money: €1,017,880 (€1,042,614) per site
compared to €1,332,272 million euros per site (€1,364,646) over five years. The HTA
indicated there is some evidence that the implementation of electronic EWS has
contributed to reduced mortality rates and a change in general and ICU LOS (which varied
from a minimal relative reduction up to 40.3% and 76% reductions, respectively). Improved
efficiency and accuracy of recording vital sign parameters, compliance with escalation
protocols and significant user (clinician) satisfaction were also reported. However, as the
quality of the included studies of effectiveness was variable and the interventions
performed in a range of healthcare jurisdictions with a variety of outcomes measured, the
ability to generalise the findings to the Irish healthcare context may be limited (Table 10.2).
10.3.2 NCEC 2013 NEWS NCG No.1
A budget impact analysis (BIA) was conducted for the original NEWS NCG No. 1 in 2013,(1) to
assess the costs of implementing the NEWS and the accompanying multidisciplinary
COMPASSTM educational programme. Taking a healthcare perspective initial implementation
costs (staff education and material) as well as on-going intervention costs (staff and non-
staff costs) were included in the BIA. Initial costs (these were the one off costs incurred
during the initial roll out of the COMPASS© education programme nationally) were
estimated at 7.47 million euros (most of this was related to staff costs to attend training and

Clinical & Cost-effectiveness of the National Early Warning System (NEWS): Systematic Review Update
Health Research Board – Collaboration in Ireland for Clinical Effectiveness Reviews
301
was therefore an opportunity cost, cost year was not reported) with on-going costs
estimated at 425,000 euros annually. Additional resources would be required due to the
expected increase in response rate triggers, but no cost estimates were provided within the
BIA. Annual savings were reported at 4.2 million euros (reduction in ICU bed days from
cardiac respiratory arrests based on a single study, estimates not reported in study) in
efficiency savings rather than monetary gains (Table 10.2).
10.3.3 Simmes 2014 Implementation of a RRS
The costs before and after the introduction of a RRS (which consisted of a clinician-led MET
triggered by a single-parameter EWS) on a surgical ward in a Dutch hospital were estimated
in a cost analysis study by Simmes et al.(5) The RRS was associated with a significant absolute
increase in ICU admissions (from 2.5% – 4.2%) without a decrease in severity of illness
(mean APACHE II score 17.5 versus 17.6) and median ICU LOS (3.5 days versus 3 days, P =
0.94) and a 0.25% absolute reduction in cardiac arrest. There was no change in-hospital LOS
as a result of implementing the RRS. Mean cost per patient of the RRS was €26.87 euros
(€28.46), including implementation and maintenance (1%), training (3%), nursing time (8%),
MET consults (2%) and extra unplanned ICU days (85%). A scenario analysis was also
performed, whereby the APACHE II score was reduced to 14. This reduced the mean daily
RRS costs per patient by over 60%, even when MET consults had increased by one third and
ICU admissions by one fifth. In this scenario analysis mean RRS costs per patient day were
reduced by €16.69 (62%) to €10.18 (€10.78); MET costs increased by €0.19 to €0.76 and
costs for extra unplanned ICU days decreased by €16.90 to €5.99. The scenario analysis
demonstrated that reducing the APACHE II score to 14, whereby less severely ill patients are
referred to ICU, could reduce costs. Overall, RRS costs (including implementation,
maintenance, training, nurse time and MET consultations) were considered low by Simmes
et al.,(5) but the costs for extra unplanned ICU days after implementation of the RRS were
high (Table 10.2).
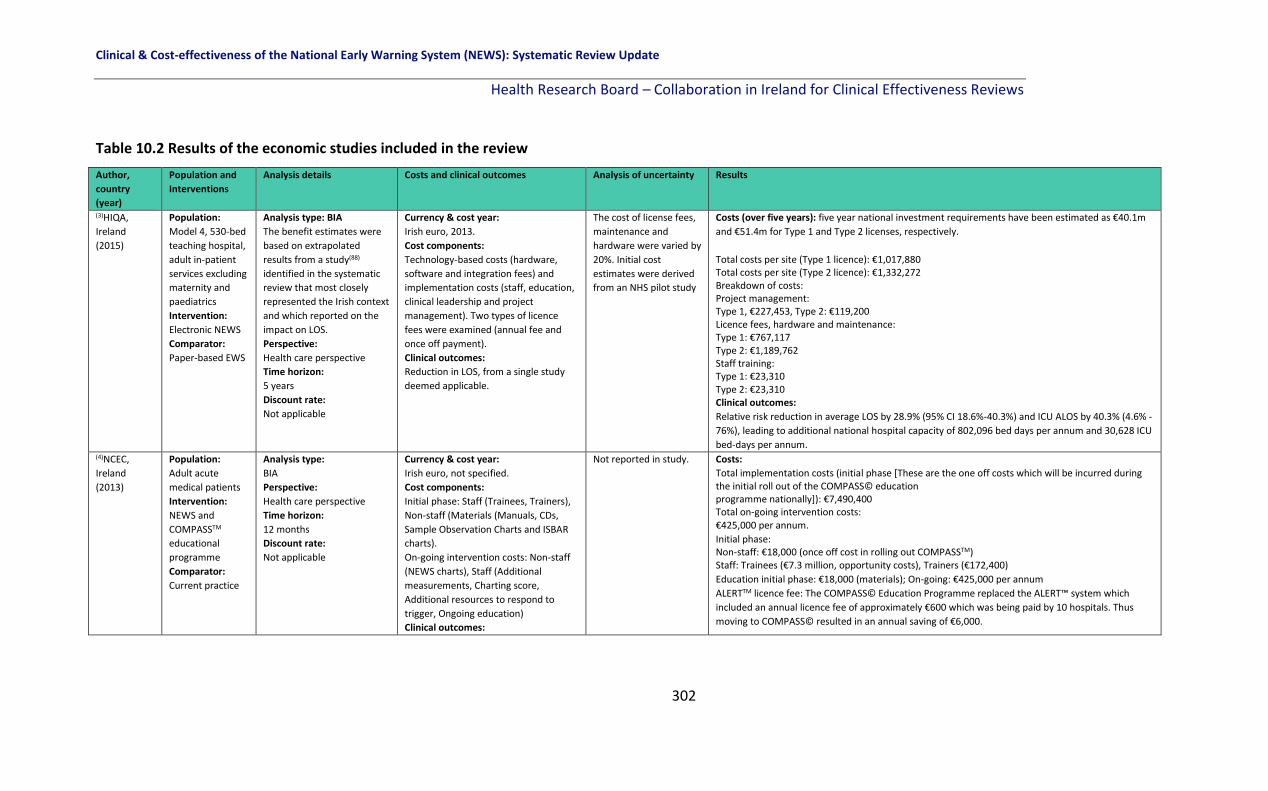
Clinical & Cost-effectiveness of the National Early Warning System (NEWS): Systematic Review Update
Health Research Board – Collaboration in Ireland for Clinical Effectiveness Reviews
302
Table 10.2 Results of the economic studies included in the review
Author,
country
(year)
Population and
Interventions
Analysis details Costs and clinical outcomes Analysis of uncertainty Results
(3)HIQA,
Ireland
(2015)
Population:
Model 4, 530-bed
teaching hospital,
adult in-patient
services excluding
maternity and
paediatrics
Intervention:
Electronic NEWS
Comparator:
Paper-based EWS
Analysis type: BIA
The benefit estimates were
based on extrapolated
results from a study(88)
identified in the systematic
review that most closely
represented the Irish context
and which reported on the
impact on LOS.
Perspective:
Health care perspective
Time horizon:
5 years
Discount rate:
Not applicable
Currency & cost year:
Irish euro, 2013.
Cost components:
Technology-based costs (hardware,
software and integration fees) and
implementation costs (staff, education,
clinical leadership and project
management). Two types of licence
fees were examined (annual fee and
once off payment).
Clinical outcomes:
Reduction in LOS, from a single study
deemed applicable.
The cost of license fees,
maintenance and
hardware were varied by
20%. Initial cost
estimates were derived
from an NHS pilot study
Costs (over five years): five year national investment requirements have been estimated as €40.1m
and €51.4m for Type 1 and Type 2 licenses, respectively.
Total costs per site (Type 1 licence): €1,017,880 Total costs per site (Type 2 licence): €1,332,272 Breakdown of costs: Project management: Type 1, €227,453, Type 2: €119,200 Licence fees, hardware and maintenance: Type 1: €767,117 Type 2: €1,189,762 Staff training: Type 1: €23,310 Type 2: €23,310 Clinical outcomes:
Relative risk reduction in average LOS by 28.9% (95% CI 18.6%-40.3%) and ICU ALOS by 40.3% (4.6% -
76%), leading to additional national hospital capacity of 802,096 bed days per annum and 30,628 ICU
bed-days per annum. (4)NCEC,
Ireland
(2013)
Population:
Adult acute
medical patients
Intervention:
NEWS and
COMPASSTM
educational
programme
Comparator:
Current practice
Analysis type:
BIA
Perspective:
Health care perspective
Time horizon:
12 months
Discount rate:
Not applicable
Currency & cost year:
Irish euro, not specified.
Cost components:
Initial phase: Staff (Trainees, Trainers),
Non-staff (Materials (Manuals, CDs,
Sample Observation Charts and ISBAR
charts).
On-going intervention costs: Non-staff
(NEWS charts), Staff (Additional
measurements, Charting score,
Additional resources to respond to
trigger, Ongoing education)
Clinical outcomes:
Not reported in study. Costs:
Total implementation costs (initial phase [These are the one off costs which will be incurred during the initial roll out of the COMPASS© education programme nationally]): €7,490,400 Total on-going intervention costs: €425,000 per annum.
Initial phase: Non-staff: €18,000 (once off cost in rolling out COMPASSTM) Staff: Trainees (€7.3 million, opportunity costs), Trainers (€172,400)
Education initial phase: €18,000 (materials); On-going: €425,000 per annum
ALERTTM licence fee: The COMPASS© Education Programme replaced the ALERT™ system which
included an annual licence fee of approximately €600 which was being paid by 10 hospitals. Thus
moving to COMPASS© resulted in an annual saving of €6,000.

Clinical & Cost-effectiveness of the National Early Warning System (NEWS): Systematic Review Update
Health Research Board – Collaboration in Ireland for Clinical Effectiveness Reviews
303
Author,
country
(year)
Population and
Interventions
Analysis details Costs and clinical outcomes Analysis of uncertainty Results
ICU bed days
Clinical outcomes:
€4.2 million per annum (reduction in ICU bed days, CRAs) (5)Simmes,
The
Netherlands
(2014)
Population:
Surgical patients >3 days post major surgery. There were 1,376 patients in period 1 (before, 1 year) and 2,410 patients in period 2 (after, 2 years). Intervention:
Implementation
of a RRS
Comparator:
1,376 patients in
period 1 (before,
1 year).
Analysis type:
Costing study.
Perspective:
Health care perspective
Time horizon:
24 months.
Discount rate:
Not applicable.
Currency & cost year:
Dutch Euro, 2009
Cost components:
Training, staff, MET consults,
Coordination and continuation costs
Clinical outcomes:
LOS, Unanticipated ICU admissions, ICU
LOS
A scenario analysis was
performed, where the
APACHE II score was
reduced to 14, whereby
less severely ill patients
were referred to ICU.
This reduced the mean
daily RRS costs per
patient by over 60%,
even when MET consults
had increased by one
third and ICU admissions
by one fifth.
Scenario analysis: mean
costs per patient day
were €10.18.
Costs:
Mean RRS costs were €26.87 per patient-day. Which consisted of Implementation: €0.33 (1%) Training: €0.90 (3%) Nursing time spent on extended observation of vital signs: €2.20 (8%) MET consults: €0.57 (2%) Increased number of unplanned ICU days after RRS implementation: €22.87 (85%) Total coordination and continuation cost of RRS: €3,618 per annum. (Additional workload coordination: 1 x nurse hour per week: €1,568; and continuation 20 nurse
hours per year and 10 doctor hours per year: €2,050)
Training total: €27,291 or €0.90 per patient day (3% of mean RRS cost per day).
Clinical outcomes:
A non-significant decrease in cardiac arrest and/or unexpected death from 0.5% to 0.25% (statistical
tests not provided).
A significant increase in the number of unplanned ICU admissions after implementation (2.5% versus
4.2%), without a decrease in severity of illness (mean APACHE II score 17.5 versus 17.6) and median
ICU LOS (3.5 days versus 3days, P = 0.94)
Hospital LOS was unchanged
Key: HIQA: Health information and Quality Authority; NCEC: National Clinical Effectiveness Committee; RRS: Rapid Response System; MET: Medical Emergency Team; LOS: Length of stay;
ICU: Intensive Care Unit.

Clinical & Cost-effectiveness of the National Early Warning System (NEWS): Systematic Review Update
Health Research Board – Collaboration in Ireland for Clinical Effectiveness Reviews
304
10.4 Methodological quality and transferability
The quality of the included studies was assessed by two reviewers using the CHEC-list tool
(The Consensus Health Economic Criteria list)(27) and the transferability of included studies
was assessed using the ISPOR tool (International Society for Pharmacoeconomics and
Outcomes Research).(28) Where the criteria were applicable to the included studies, the
quality of the studies was judged to be good overall. However, given that the studies were
not full economic evaluations, a number of the criteria were not relevant or applicable. In
addition, some of the costs reported are based on findings from a single hospital or trial
which may not be transferable to the Irish setting, given the heterogeneity of such settings.
10.4.1 CHEC-list quality appraisal
The 19-item CHEC-list tool was applied to the three included studies, including two BIAs and
one costing study. The majority of the CHEC-list items were adequately described in all three
studies. Competing alternatives were not reported in the NCEC BIA (item 2).(1) Important
and relevant costs for each alternative were not included in the costing study (Item 7).(5) An
incremental analysis of costs and outcomes of alternatives was not performed in any of the
studies (Item 13) and discounting was not applicable to any of the three studies (Item 14).
Sensitivity analyses were only reported in the HIQA BIA (Item 15).(3) None of the studies
discussed the generalisabilty of the results to other settings or patient groups (Item 17). One
study did not report on conflicts of interest (Item 18).(5) Ethical issues were not applicable to
all three studies (Item 19) (Table 10.3).
10.4.2 ISPOR transferability tool
The 11-item ISPOR tool was used to assess the included studies transferability based on the
relevance and credibility (validation, model design, data, analysis, reporting, interpretation
of results and conflict of interest). For the ‘relevance’ domain, all three studies were
deemed to have suitable and relevant populations (item 1), no missing critical interventions
(item 2), no missing outcomes (item 3), and were deemed to be based in an appropriate

Clinical & Cost-effectiveness of the National Early Warning System (NEWS): Systematic Review Update
Health Research Board – Collaboration in Ireland for Clinical Effectiveness Reviews
305
setting (item 4). For the ‘credibility’ domain, as none of the studies included full economic
models (there were two BIAs and one costing study) the model specific items on the
checklist were not applicable as a result (items 1, 2 and 3 in validation). For design (item 4),
the costing study was not applicable as there was no model included,(5) whilst the two BIAs
were judged to be appropriate. For data (item 5), and analysis (items 6 and 7) the HIQA
BIA(3) was deemed appropriate as the data included was based on a systematic review and
included an analysis of uncertainty, whilst the two other studies were deemed inappropriate
given the data were from a single study which may not be transferable and provided no
uncertainty analyses. For reporting (item 8) and interpretation (item 9) all three studies
provided adequate information. A conflicts of interest statement (item 10) was not reported
in the costing study(5) and item 12 (steps taken to address any conflicts of interests) was not
applicable to all three studies (Table 10.4).

Clinical & Cost-effectiveness of the National Early Warning System (NEWS): Systematic Review Update
Health Research Board – Collaboration in Ireland for Clinical Effectiveness Reviews
306
Table 10.3 CHEC-list quality appraisal of included economic studies
Quality appraisal using the Consensus on Health Economics Criteria (CHEC)
Item
HIQA
(2015)
NCEC
(2013)
Simmes
(2014)
1. Is the study population clearly described?
2. Are competing alternatives clearly described?
3. Is a well-designed research question posed in answerable form?
4. Is the economic study design appropriate to the stated objective?
5. Is the chosen time horizon appropriate to include relevant costs and consequences?
6. Is the actual perspective chosen appropriate?
7. Are all important and relevant costs for each alternative identified?
8. Are all costs measured appropriately in physical units?
9. Are costs valued appropriately?
10. Are all important and relevant outcomes for each alternative identified?
11. Are all outcomes measured appropriately?
12. Are outcomes valued appropriately?
13. Is an incremental analysis of costs and outcomes of alternatives performed?
14. Are all future costs and outcomes discounted appropriately?
15. Are all important variables, whose values are uncertain, appropriately subjected to sensitivity analysis?
16. Do the conclusions follow from the data reported?
17. Does the study discuss the generalizability of the results to other settings and patient/ client groups?
18. Does the article indicate that there is no potential conflict of interest of study researcher(s) and funder(s)?
19. Are ethical and distributional issues discussed appropriately?
Key: = Yes, category considered; = No, category not considered; =Not applicable

Clinical & Cost-effectiveness of the National Early Warning System (NEWS): Systematic Review Update
Health Research Board – Collaboration in Ireland for Clinical Effectiveness Reviews
307
Table 10.4 ISPOR Transferability assessment of included economic studies
Transferability using the ISPOR tool HIQA
(2015)
NCEC
(2013)
Simmes
(2014)
Relevance
1. Is the population relevant? Yes Yes Yes
2. Are any critical interventions missing? No No No
3. Are any relevant outcomes missing? No No No
4. Is the context (settings and circumstances) applicable? Yes Yes Yes
Credibility
Validation
1. Is external validation of the model sufficient to make the results credible for your decision? NA NA NA
2. Is internal verification of the model sufficient to make its results credible for your decision? NA NA NA
3. Does the model have sufficient face validity to make its results credible for your decision? Yes Yes NA
Design
4. Is the design of your model adequate for your decision problem? Yes Yes No
Data
5. Are the data used in populating the model suitable for your decision problem? Yes No No
Analysis
6. Were the analyses performed using the model adequate to inform your decision problem? Yes No No
7. Was there an adequate assessment of the effects of uncertainty? Yes No No
Reporting
8. Was the reporting of the model adequate to inform your decision problem? Yes Yes Yes
Interpretation
9. Was the interpretation of results fair and balanced? Yes Yes Yes
Conflict of interest
10. Were there any potential conflicts of interest? No No NR
11. If there were potential conflicts of interest, were steps taken to address these? NA NA NA
Key: NA=Not applicable (no model); NR=Not reported

Clinical & Cost-effectiveness of the National Early Warning System (NEWS): Systematic Review Update
Health Research Board – Collaboration in Ireland for Clinical Effectiveness Reviews
308
10.5 Discussion
There is a dearth of economic literature on EWSs in adult non-pregnant patients in the acute
health care setting to detect physiological deterioration, as evidenced by this systematic
review. Of the three included studies, there were no full economic evaluations of EWSs in
adult patients in acute settings. There was however a HTA on electronic EWS, one BIA on
EWS, and one costing study (on the implementation of a single parameter-based RRS and
the associated costs). In addition, some of the costs and clinical outcomes reported are
based on findings from a single hospital or trial, also the currency of the studies may be an
issue with no new studies identified during this review update. Thus they may not be
transferable to the current Irish setting. The studies included however suggest that EWS
have the potential to improve patient outcomes including ICU and hospital LOS and thus
reduce health care costs (including potential reduction in cardiac arrests, avoidance of ICU
admissions or reduced LOS for example). There is a need to assess the cost-effectiveness of
EWSs and a full economic evaluation is warranted. Difficulties in obtaining reliable data
however (Chapters 5-7), are a significant barrier.
10.6 Conclusion
EWSs, despite the lack of economic data on their cost-effectiveness, have been
implemented in many healthcare systems in a number of different countries including
Ireland, the UK, America and Australia. Further research is warranted to assess the cost-
effectiveness of EWSs given the increasing demands on health systems worldwide.
Clinical & Cost-effectiveness of the National Early Warning System (NEWS): Systematic Review Update
Health Research Board – Collaboration in Ireland for Clinical Effectiveness Reviews
309
11 Comparison of the effectiveness of modified EWSs (e.g. CREWS) to the NEWS for the detection of acute physiological deterioration in specific adult subpopulations in acute health care settings
11.1 Chapter overview
This chapter of the systematic review focusses on the literature pertinent to review
question five, “Are modified EWSs [e.g. CREWS] more effective than the NEWS for the
detection or timely identification of physiological deterioration in specific adult
subpopulations in acute health care settings?”. Two specific sub-populations were eligible
for inclusion: 1) Frail older adults (must be defined with a validated frailty scale for
inclusion); 2) Adults with chronic respiratory conditions including chronic hypoxia, chronic
hypoxaemia, chronic physiological abnormalities, pulmonary fibrosis or chronic obstructive
pulmonary disease (COPD). The effectiveness of any modified EWS in these two populations
was compared to the NEWS only.
11.2 Characteristics of included studies
Following a systematic search of the literature (please refer to Chapter 3, 3.1), there were
four studies eligible for inclusion in this specific review question, all of which included
patients with chronic respiratory conditions which compared a modified EWS (NEWS2,
CREWS, S-NEWS, and CROS) to the NEWS.(13, 60, 111, 187)
Three studies were conducted in the UK(13, 114, 192) and one in Denmark.(86) All four studies
had retrospective cohort designs and all were conducted within hospitals.(13, 60, 111, 187) The
sample size ranged from 196 patients(13) to 251,266 patients.(192) One study compared the
CREWS modified EWS to the NEWS, (13) the second study compared NEWS2 to the NEWS,(192)
the third study compared the CROS, CREWS and S-NEWS to the NEWS,(86) and the fourth
study compared the CREWS and S-NEWS to the NEWS.(114) All of the modified EWSs had the
same seven parameters as the NEWS and differed only in the weighting assigned to the
SpO2 parameter (Table 11.1, Table 11.2).

Clinical & Cost-effectiveness of the National Early Warning System (NEWS): Systematic Review Update
Health Research Board – Collaboration in Ireland for Clinical Effectiveness Reviews
310
Table 11.1 Characteristics of EWSs (modified EWSs versus the NEWS) for the detection of acute physiological deterioration in adults with chronic respiratory
conditions in acute health care settings Author, country
No of parameters, Name of EWSs
Parameters included in EWSs Paper based or electronic
Recording of parameters
Aggregate EWS, score
RR SpO2 FiO2 SBP HR AVPU Temp Other –specify modification/ difference in weighting of scores
Eccles (2014),(13) UK
NEWS vs.
7-item CREWS
x x x X x x x Target SpO2: 94-98% Paper-based Not reported Yes (0-3)
x x x X x x x Target SpO2: 88-92% Yes (0-3)
Hodgson (2017)(111), UK
News vs. CREWS vs. S-NEWS
Parameters not reported within study
Electronic Not reported Not reported
Pedersen (2018),(60) Denmark
NEWS vs.
CROS vs.
CREWS vs.
S-NEWS
x x x X x x x Electronic Semi-automatic Yes (0-3)
x x x X x x x Option for doctors to apply acceptable chronic value limits to all parameters except temperature for individual patients. NEWS variable values within the acceptable chronic value limits do not generate points. NEWS variable values outside the acceptable chronic limits generate the full NEWS points for that variable value.
x x x X x x x Points as in NEWS, except modified score for SpO2 in patients with chronic hypoxaemia (88-92%)
x x x X x x x Points as in NEWS, except modified score for SpO2 based on an individual target range in patients with chronic hypoxaemia. (usually 88-92%)
Pimental (2018),(187) UK
NEWS vs.
NEWS2
x x x X x x x Electronic Time and date stamped Yes (0-3)
x x x X x x x Differs in weights assigned to SpO2 only (below 88%)
Key: EWS: Early warning system; CREWS: Chronic respiratory EWS; CROS: Capital Region of Denmark NEWS Orverride System; S-NEWS: Salford NEWS; NEWS: National early warning score; RR: Respiratory rate; SpO2: Oxygen saturation; FiO2: Inspired oxygen; SBP: Systolic blood pressure; HR: Heart rate; AVPU: Alert, voice, pain, unresponsive; Temp: Temperature.

Clinical & Cost-effectiveness of the National Early Warning System (NEWS): Systematic Review Update
Health Research Board – Collaboration in Ireland for Clinical Effectiveness Reviews
311
Table 11.2 Comparison of the effectiveness of modified EWSs to the NEWS in adults with chronic respiratory conditions sub-populations Author, study design
Setting, Country
A. Sample size and details B. Data collection C. Model
AUROC, outcome Sensitivity, Specificity, Outcome PPV,NPV, Outcome Identifying optimal threshold cut-offs, Outcome
Eccles (2014),(13) Retrospective cohort study
2 NHS district general hospitals, UK.
A. N=196 admission to the respiratory ward between Aug - Oct 2012. B. Data obtained from medical notes and observation charts with NEWS scores recorded prospectively. Patients split into 2 groups: CH patients (with target SpO2 of 88-92%) and oxygen patients (O), those with SpO2 target saturations of 94-98%. The CREWS score was then retrospectively applied for comparison. C.AUC with 95% CI
Primary outcome: 30-day mortality CH patients NEWS: AUC 0.88 (95% CI 0.79-0.96); CH patients CREWS: AUC 0.91 (95% CI 0.85-0.98); All patients NEWS: AUC 0.83 (95% CI 0.70-0.96); O patients NEWS: AUC 0.75 (95% CI 0.52-0.98)
Hodgson
(2017),(111)
Observational
retrospective
cohort study
2 UK
hospitals.
A: N=39,470 patients admitted between Mar
2012 and Feb 2014 (n=2,361 admissions in 942
individuals with an acute exacerbation of
COPD (AECOPD) and n=37,109 non-COPD
admissions in 20,415 comparison patients)
B. NEWS calculated automatically using
handheld electronic devices and compared to
the CREWS and S-NEWS to predict inpatient
mortality.
C: AUROC analysis
Primary outcome: Inpatient mortality
First admissions:
AECOPD cohort: NEWS=AUC 0.74 (95% CI 0.66-0.82) CREWS=AUC 0.72 (95% CI 0.63 to 0.80) S-NEWS=AUC 0.62 (95% CI 0.53 to 0.70). AMU cohort NEWS=AUC 0.77 (95% CI 0.75 to 0.78)
All inpatient episodes
AECOPD cohort
NEWS=AUC 0.69 (95% CI 0.64 to 0.75), CREWS=AUC 0.70 (95% CI 0.64 to 0.75) S-NEWS=AUC 0.67 (95% CI 0.61 to 0.72). AMU cohort NEWS=AUC 0.75 (95% CI 0.74 to 0.76)
Primary outcome: Inpatient mortality
For AECOPD cohort, for their first admission, using Score ≥5 COPD: NEWS: Sen 76% (61 to 88) Spec 57% (54 to 61) CREWS: Sen 48% (32 to 64) Spec 88% (85 to 90) S-NEWS: Sen 24% (12 to 39) Spec 91% (89 to 93) For AMU cohort, for their first admission, using Score ≥5 COPD: NEWS: Sen 43% (40 to 46) Spec 90% (90 to 91) For AECOPD cohort, for their first admission, using Score ≥7 COPD: NEWS: Sen 60% (43 to 74) Spec 80% (77 to 83) CREWS: Sen 13% (6 to 23) Spec 96% (95 to 97) S-NEWS: Sen 14% (5 to 29) Spec 95% (94 to 97) For AMU cohort, for their first admission, using Score ≥7 COPD: NEWS: Sen 25% (23 to 28) Spec 96% (96 to 97)
Primary outcome: Inpatient mortality
For AECOPD cohort, for their first admission, using Score ≥5 COPD: NEWS: PPV 8% (5 to 11) 98% (97 to 99) CREWS: PPV 15% (10 to 23) NPV 97% (96 to 98) S-NEWS: PPV 11% (5 to 19) NPV 96% (95 to 97) For AMU cohort, for their first admission, using Score ≥5 COPD: NEWS: PPV 17% (16 to 19) NPV 97% (97 to 97) For AECOPD cohort, for their first admission, using Score ≥7 COPD: NEWS: PPV 12% (8 to 18) NPV 98% (96 to 99) CREWS: PPV 21% (10 to 37) NPV 93% (91 to 95) S-NEWS: PPV 12% (5 to 25) NPV 96% (95 to 97) For AMU cohort, for their first admission, using Score ≥7 COPD: 25% (22 to 28) NPV 96% (96 to 97)
-

Clinical & Cost-effectiveness of the National Early Warning System (NEWS): Systematic Review Update
Health Research Board – Collaboration in Ireland for Clinical Effectiveness Reviews
312
Table 11.2 Comparison of the effectiveness of modified EWSs to the NEWS in adults with chronic respiratory conditions sub-populations [continued]
Author, study design
Setting, Country
A. Sample size and details B. Data collection C. Model
AUROC, outcome Sensitivity, Specificity, Outcome PPV,NPV, Outcome Identifying optimal threshold cut-offs, Outcome
Pedersen
(2018),(60)
Retrospective
cohort study
Single hospital in Copenhagen, Denmark
A. N=11,266 patients with
a diagnosis of chronic
respiratory disease (COPD
or chronic hypoxaemia)
recorded during 2014.
B. All complete NEWS
records were used in the
data analysis and
compared to CROS, CREWS
and S-NEWS (modified
EWS) to predict 48-hour
mortality and ICU
admission.
C: AUROC analysis.
Outcome: 48-hour mortality
NEWS: AUC 0.85 (95% CI 0.85-0.86)
CROS: AUC 0.82 (95% CI 0.82-0.83)
CREWS: AUC 0.85 (95% CI 0.84-0.85)
S-NEWS: AUC 0.84 (95% CI 0.84-0.85)
Outcome: ICU admission
NEWS: AUC 0.79 (95% CI 0.78-0.79)
CROS: AUC 0.81 (95% CI 0.81-0.82)
CREWS: AUC 0.81 (95% CI 0.80-0.81)
S-NEWS: AUC 0.79 (95% CI 0.78-0.80)
Outcome: 48-hour mortality (6+ points) NEWS: Sen: 73.1 (95% CI 71.7-74.4) Spec: 81.8 (95%CI 81.7-81.9) CROS: Sen: 53.4%; Spec: 90% CREWS: Sen: 60.7%; Spec: 88.4% S-NEWS: Sen: 68.3%; Spec: 83.0% (95% CIs not reported for modified EWSs) Outcome: ICU admission (6+ points) NEWS: Sen: 60.7% (95% CI 59.3-62.1) Spec: 81.7 (95%CI 81.6-81.8) CROS: Sen: 52.4%; Spec: 90.1% CREWS: Sen: 54.1%; Spec: 88.4% S-NEWS: Sen: 59.1%; Spec: 83.0% Applying any of the NEWS modifications resulted in lower sensitivities and NPV, and higher specificities and PPV, when using a total score of 9 as cut-off levels. Only results for scores of 6 presented.
Outcome: 48-hour mortality (6 + points) NEWS: PPV :4.0 (95%CI 3.9-4.2) NPV: 99.7 (95%CI 99.6-99.7) CROS: PPV: 5.3%; NPV: 99.5% CREWS: PPV: 5.2%; NPV: 99.5% S-NEWS: PPV: 4.0%; NPV: 99.6% Outcome: ICU admission (6 + points) NEWS: PPV: 3.9% (95%CI 3.7-4.0) NPV: 99.4% (95%CI 99.4-99.4) CROS: PPV: 6.0%; NPV: 99.4% CREWS: PPV: 5.3%; NPV: 99.4% S-NEWS: PPV: 4.0%; NPV: 99.4%
-

Clinical & Cost-effectiveness of the National Early Warning System (NEWS): Systematic Review Update
Health Research Board – Collaboration in Ireland for Clinical Effectiveness Reviews
313
Table 11.2 Comparison of the effectiveness of modified EWSs to the NEWS in adults with chronic respiratory conditions sub-populations [continued] Author, study design
Setting, Country
A. Sample size and details B. Data collection C. Model
AUROC, outcome Sensitivity, Specificity, Outcome PPV,NPV, Outcome Identifying optimal threshold cut-offs, Outcome
Pimentel
(2018),(187)
Multicentre,
retrospective
cohort study
5 acute hospitals from 2 UK NHS Trusts, UK.
A.N=251,266 adult acute
admissions Jan 2012 and
Dec 2016.
B. Data were obtained
from completed adult
admissions who were
not fit enough to be
discharged alive on the
day of admission with at
least 1 complete set of
vital signs recorded.
Divided into 3 groups: 1)
Patients with recorded
type II respiratory failure
(T2RF) [n=1,394], 2)
Patients at risk of T2RF
(n=48,898), and 3)
Patients not at risk of
T2RF (n=202,094).
C. AUROC analysis
Primary outcome: in-hospital death with 24-hours
Patients with documented T2RF: NEWS: AUC 0.86 (95% CI 0.85-0.88); NEWS2: AUC 0.84
(95%CI 0.83-0.85)
Patients at risk of T2RF: NEWS: AUC 0.88 (95% CI 0.88-0.88); NEWS2: AUC 0.86 (95%CI
0.86-0.86)
Patients not at risk of T2RF (control) NEWS: AUC 0.91 (95%CI 0.910-0.91); NEWS2: AUC
0.89 (95% CI 0.89-0.89)
Primary outcome: unanticipated ICU admission
Patients with documented T2RF: NEWS: 0.81 (0.79 - 0.83); NEWS2: 0.82 (0.80 - 0.84)
Patients at risk of T2RF: NEWS: 0.81 (0.81 - 0.82); NEWS2: 0.81 (0.81 - 0.82)
Patients not at risk of T2RF (control) NEWS: 0.84 (0.84 - 0.84); NEWS2: 0.83 (0.83 - 0.84)
Primary outcome: Cardiac arrest
Patients with documented T2RF: NEWS: 0.70 (0.65 - 0.75); NEWS2: 0.71 (0.66 - 0.75)
Patients at risk of T2RF: NEWS: 0.76 (0.74 - 0.77); NEWS2: 0.74 (0.73 - 0.75)
Patients not at risk of T2RF (control) NEWS: 0.78 (0.78 - 0.79); NEWS2: 0.77 (0.76 - 0.78)
Secondary outcome post hoc: SAE (composite of death, ICU admission or cardiac arrest)
Documented T2RF NEWS: 0.83 (0.82 - 0.85); NEWS2: 0.83 (0.82 - 0.84)
At risk T2RF NEWS: 0.86 (0.85 - 0.86); NEWS2: 0.84 (0.84 - 0.85)
Patients not at risk of T2RF (control) NEWS: 0.88 (0.88 - 0.88); NEWS2: 0.87 (0.86 -
0.87)
Primary outcome: in-hospital
death within 24 h
Documented T2RF
Score>5 / Score>7
NEWS: Sen 90.7 / 73.9, Spec 57.8 /
88.8
NEWS2: Sen 80.9 / 60.1, Spec 68.8 /
87.3
At risk T2RF
Score>5 / Score>7
NEWS: Sen 78.5 / 57.6, Spec 82.4 /
93.9
NEWS2: Sen 73.2 / 51.8, Spec 80.6 /
83.6
Patients not at risk of T2RF
(control)
Score>5 / Score>7
NEWS: Sen 72.0 / 51.7, Spec 93.6 /
98.1
NEWS2: Sen 73.5 / 54.5, Spec 87.4 / 95.7
Primary outcome: in-
hospital death within 24
h
Documented T2RF
Score>5 / Score>7
NEWS: PPV 2.5 / 4.6
NEWS2: PPV 3.0 / 5.3
At risk T2RF
Score>5 / Score>7
NEWS: PPV 3.2 / 6.6
NEWS2: PPV 2.7 / 5.7
Patients not at risk of
T2RF (control)
Score>5 / Score>7
NEWS: PPV 5.0 / 11.2
NEWS2: PPV 2.7 / 5.7
Outcome: in-hospital death
within 24-hours
Patients with documented
T2RF: NEWS2 at cut-offs of 5
&7 reduces absolute staff
workload by approximately
11% and 5% respectively,
reduces sensitivity by
approximately 10% and 14%.
For patients at risk of T2RF,
NEWS2 at cut-offs of 5 and 7
does not significantly
decrease staff workload, but
reduces sensitivity by 5-6%.
Finally, if used in error for
patients not at risk of T2RF
at the suggested cut-offs,
NEWS2 is slightly more
sensitive than NEWS but, to achieve this, risks doubling the workload.
Key: AECOPD: Acute exacerbation of chronic obstructive respiratory disease; AMU: Acute Medical Unit; AUC: Area under the curve; CH: Chronic hypoxaemia; COPD: Chronic Obstructive Pulmonary Disease; CREWS: Chronic respiratory EWS; CROS: Capital Region of Denmark NEWS Override System; ICU: Intensive Care Unit; NEWS: National early warning score; NHS: National Health Service; NPV: Negative predictive value; O: oxygen; PPV: Positive predictive value; SAE: Serious Adverse Events; S-NEWS: Salford NEWS; Sen: Sensitivity; Spec: Specificity; T2RF: Type 2 Respiratory Failure; UK: United Kingdom

Clinical & Cost-effectiveness of the National Early Warning System (NEWS): Systematic Review Update
Health Research Board – Collaboration in Ireland for Clinical Effectiveness Reviews
314
11.3 Primary outcomes
11.3.1 Mortality
All four studies compared modified EWSs to the NEWS for the detection of mortality and
the findings varied.
Eccles et al.,(13) investigated 30-day mortality in 196 patients who were split into two groups:
chronic hypoxaemia (CH) patients (with target SpO2 of 88-92%) and oxygen patients (O),
those with SpO2 target saturations of 94-98%. For CH patients the CREWS score was
retrospectively applied for comparison to the NEWS. The CREWS was superior to the NEWS
in CH patients at predicting 30-day mortality (AUC 0.91 versus AUC 0.88, respectively)
though confidence intervals for estimates overlapped suggesting the difference may not be
statistically significant.
Hodgson et al.,(111) compared the NEWS to the modified CREWS and S-NEWS in 39,470
patient admissions, who were divided into two groups: 2,361 admissions in 942 individuals
with an acute exacerbation of COPD (AECOPD) and 37,109 non-COPD admissions in 20,415
comparison patients. The NEWS had a slightly better ability to predict inpatient mortality
(AUC 0.74, 95% CI 0.66-0.82) than the CREWS (AUC 0.72, 95% CI 0.63-0.80) and a clearer
advantage over the S-NEWS (AUC 0.62, 95% CI 0.53-0.70) in the AECOPD cohort using first
admissions only, however the 95% confidence intervals overlap (Table 11.2).
Pedersen et al.,(60) compared the NEWS to three modified EWSs (the CREWS, S-NEWS and
CROS) in 11,266 patients with a diagnosis of chronic respiratory disease (COPD or chronic
hypoxaemia) to predict 48-hour mortality. The NEWS (AUC 0.85, 95% CI 0.85-0.86), modified
CREWS (AUC 0.85, 95% CI 0.84-0.85) and the S-NEWS (AUC 0.84, 95% CI 0.84-0.85) had
similar predictive ability, and the NEWS was slightly superior to the CROS EWS (AUC 0.82,
95% CI 0.82-0.83) and. In addition, applying any of the NEWS modifications typically resulted
in lower sensitivities and NPVs, and higher specificities and PPVs, both when using a total
score of 6 or 9.
Pimental et al.,(187) compared the NEWS to NEWS2 in a cohort of 251,266 adult admissions
split into three different groups: those with documented type two respiratory failure (T2RF)
[n=1,394]; those at risk of T2RF [n=48,898]; and those not at risk of T2RF [n=202,094]. The
performance of NEWS and NEWS2 was compared for in-hospital death within 24 hours in
each group. The NEWS (AUC 0.86, 95% CI 0.85-0.87) had marginally better discriminatory

Clinical & Cost-effectiveness of the National Early Warning System (NEWS): Systematic Review Update
Health Research Board – Collaboration in Ireland for Clinical Effectiveness Reviews
315
ability than the NEWS2 (AUC 0.84, 95% CI 0.83-0.85) in patients with documented T2RF,
although the 95% confidence intervals overlap. This was also true for those patients at risk
of T2RF (NEWS AUC 0.88 vs. NEWS2 AUC 0.86).
11.3.2 Cardiac arrest
One study by Pimental et al.,(187) compared a modified EWS to the NEWS for the detection
of cardiac arrest. The NEWS and NEWS2 had similar discriminatory ability in patients with
documented T2RF (AUC 0.701, and 0.706, respectively) and in patients at risk of T2RF (AUC
0.756, and 0.741, respectively (Table 11.2).
11.3.3 Length of stay
None of the four studies compared modified EWSs to the NEWS for the detection of LOS.
11.3.4 Transfer or admission to the intensive care unit
Two of the four studies compared modified EWSs to the NEWS for the detection of transfer
or admission to the ICU with both showing similar discriminatory ability between the
modified EWSs and the NEWS.(60, 187)
Pimental et al.,(187) showed that the NEWS and NEWS2 had similar discriminatory ability in
predicting unanticipated ICU admission in patients with documented T2RF (AUC 0.81, and
0.82, respectively) and in patients at risk of T2RF (AUC 0.81, and 0.81, respectively).
Pedersen et al.,(60) compared the NEWS, CROS, CREWS and S-NEWS in Danish patients with
COPD or chronic hypoaemia. The findings were similar between the NEWS (AUC 0.79) and
the modified EWSs (CROS AUC 0.81, CREWS AUC 0.81 and S-NEWS AUC 0.79) in predicting
ICU admission.
11.4 Secondary outcomes
11.4.1 Clinical deterioration in a sub-population
None of the four studies reported on this outcome.
11.4.2 Patient reported outcome measures
None of the four studies reported on this outcome.

Clinical & Cost-effectiveness of the National Early Warning System (NEWS): Systematic Review Update
Health Research Board – Collaboration in Ireland for Clinical Effectiveness Reviews
316
11.4.3 Post-hoc identified outcomes
11.4.3.1 Serious adverse events (SAEs)
One study compared a modified EWS to the NEWS for the detection of SAEs. Pimental et
al.,(187) defined a composite outcome of in-hospital death within 24 hours, unanticipated ICU
admission or cardiac arrest (a combination of the review’s primary outcomes). The NEWS
and NEWS2 had similar discriminatory ability in predicting SAEs in patients with
documented T2RF (AUC 0.83, and 0.83, respectively) and in patients at risk of T2RF (AUC
0.86, and 0.84, respectively).
11.5 Methodological quality
The QUADAS II tool(29) was used to assess the quality of the four retrospective cohort studies
included. This tool had four risk of bias domains (patient selection, index test, reference
standard and flow and timing) and three applicability domains (patient selection, index test
and reference standard). Overall, the studies were classified as having a low risk of bias
(Figure 11.1).
Figure 11.1 Risk of bias graph for the comparison of the effectiveness of modified EWSs to
the NEWS for detecting physiological deterioration in adults with chronic respiratory
conditions
Risk of bias domain: Patient selection
Three out of the four included studies had a low risk of bias for patient selection.(60, 111, 187)
Eccles et al.,(13) had an unclear risk of bias for patient selection. The study included patients
from two respiratory wards but it was unclear from the study whether a case-control design
was avoided (which is preferable) as the patients were split into two groups based on
oxygen saturations.
Clinical & Cost-effectiveness of the National Early Warning System (NEWS): Systematic Review Update
Health Research Board – Collaboration in Ireland for Clinical Effectiveness Reviews
317
Risk of bias domain: Index test
Three out of the four included studies had a low risk of bias for the index test.(60, 111, 187)
Eccles et al.,(13) had an unclear risk of bias for the index test. The CREWS was applied
retrospectively and it is unclear whether this was done without knowledge of the reference
standard test results.
Risk of bias domain: Reference standard
All four studies had a low risk of bias for the reference standard.(13, 86, 114, 192)
Risk of bias domain: Flow and timing
All four studies had a low risk of bias for flow and timing. The patients were all accounted
for in the analysis.(13, 86, 114, 192)
Applicability domain: Patient selection
Two out of the four studies had a low risk of bias in the applicability domain.(111, 187) Two
studies had an unclear risk of bias,(13,86 for applicability of patient selection. Both included
sub-populations of patients with chronic respiratory conditions.
Applicability domain: Index test
Two of the four studies had a low risk of bias for the index test applicability.(111, 187) Two
studies had an unclear risk of bias for the applicability of the index test. The modified EWSs
were only applied to patients with respiratory conditions and may not be applicable to all
adult patients.(13, 86)
Applicability domain: Reference standard
All four studies had a low risk of bias for the applicability of the reference standard (Figure
11.2).(13, 60, 111, 187)

Clinical & Cost-effectiveness of the National Early Warning System (NEWS): Systematic Review Update
Health Research Board – Collaboration in Ireland for Clinical Effectiveness Reviews
318
Figure 11.2 Risk of bias summary for the comparison of the effectiveness of modified
EWSs to the NEWS for detecting physiological deterioration in adults with chronic
respiratory conditions
11.6 Certainty of the evidence
We assessed the overall quality of the evidence where appropriate. A narrative summary of
findings table was created using GRADEpro software for the primary outcomes included in
the four studies: mortality, cardiac arrest and transfer or admission to the ICU. Overall, the
certainty of the evidence was very low. This is due to the fact that the evidence was from
four observational cohort studies using modified EWSs leading to a higher risk of bias and
confounding and further validation in large scale prospective studies is required (Table
11.3).

Clinical & Cost-effectiveness of the National Early Warning System (NEWS): Systematic Review Update
Health Research Board – Collaboration in Ireland for Clinical Effectiveness Reviews
319
Table 11.3 Summary of findings table for the comparison of the effectiveness of modified
EWSs to the NEWS in adults with chronic respiratory conditions
Modified EWSs compared to NEWS for detecting acute physiological deterioration in adults with chronic respiratory conditions
Patient or population: detecting acute physiological deterioration in adults with chronic respiratory conditions
Setting: Acute health care settings
Intervention: Modified EWSs
Comparison: NEWS
Outcomes Impact № of participants (studies)
Certainty of the evidence (GRADE)
Mortality Four studies included a comparison of modified EWSs to the NEWS in a sub-population of patients with respiratory conditions. These modified EWSs included: the CREWS (3 studies), NEWS2 (1 study), CROS (1 study) and S-NEWS (2 studies).
The modified EWSs had similar discriminatory ability to the NEWS and further evaluation of the relationship between SpO2 values, oxygen therapy and risk should be investigated further before wide-scale adoption of modified EWSs.
302,198 (4 observational cohort studies)
⨁◯◯◯
VERY LOW a
Cardiac arrest One study examined cardiac arrest comparing the ability of the modified EWS NEWS2 to the NEWS in a large UK hospital sample.
The NEWS had an AUC of 0.701 and the NEWS2 had an AUC of 0.706 in predicting cardiac arrest in a sample of patients with type 2 respiratory failure. Further evaluation of the relationship between SpO2 values, oxygen therapy and risk should be investigated further before wide-scale adoption of modified EWSs.
251,266 (1 observational cohort study)
⨁◯◯◯
VERY LOW a, b
ICU admission or transfer
Two studies examined ICU admission or transfer when comparing modified EWSs to the NEWS.
The NEWS and NEWS2 had similar discriminatory ability in the sample of type 2 respiratory failure patients included in Pimental et al (NEWS AUC 0.81, NEWS2 AUC 0.82)
The NEWS (AUC 0.79), CROS (AUC 0.81), CREWS (AUC 0.81) and S-NEWS (AUC 0.79) had similar predictive ability of ICU admission in the sample of patients with chronic respiratory disease included in Pedersen et al. in a Danish hospital.
262,532 (2 observational cohort studies)
⨁◯◯◯ VERY LOW a
GRADE Working Group grades of evidence High certainty: We are very confident that the true effect lies close to that of the estimate of the effect Moderate certainty: We are moderately confident in the effect estimate: The true effect is likely to be close to the estimate of the effect, but there is a possibility that it is substantially different Low certainty: Our confidence in the effect estimate is limited: The true effect may be substantially different from the estimate of the effect Very low certainty: We have very little confidence in the effect estimate: The true effect is likely to be substantially different from the estimate of effect
Explanations a. Downgraded one level for risk of bias - observational cohort studies b. Downgraded one level for imprecision relating to confidence intervals including the possibility of a small or no effect

Clinical & Cost-effectiveness of the National Early Warning System (NEWS): Systematic Review Update
Health Research Board – Collaboration in Ireland for Clinical Effectiveness Reviews
320
11.7 Discussion
For this specific review question assessing the effectiveness of modified EWSs in specific
sub-populations (frail elderly patients with chronic respiratory conditions), four
observational cohort studies were eligible for inclusion. All four studies included patients
with varying respiratory conditions including COPD or chronic hypoxaemia. The studies
compared the predictive ability of modified EWSs including NEWS2, S-NEWS, CREWS and
the Danish CROS to the NEWS. Modifications were largely in the SpO2 weighting and cut-offs
as this has been associated with excessive triggering and increased workload particularly in
patients with chronic respiratory conditions. Overall however, the modified EWSs included
were similar to the NEWS in predicting the primary outcomes of interest.
Further large scale, prospective studies are warranted to validate the findings in this sub-
population of patients with chronic respiratory conditions included in the four studies.
These studies were all observational cohort studies with a greater risk of bias and
confounding as a result. The certainty of the evidence was deemed to be very low.
11.8 Conclusion
The NEWS is based on an EWS designed to maximise both sensitivity (the ability to detect
patients at risk of dying) and specificity (the minimisation of false alarms) for unselected
patients admitted to acute settings. The aim of this review question was to investigate
whether modified EWSs (such as CREWS) can improve specificity and maintain sensitivity in
specific sub-populations where NEWS has been shown to trigger false alarms. The four
included studies of patients with chronic respiratory conditions compared the effectiveness
of four modified EWSs (CREWS, S-NEWS, NEWS2 and CROS) to the NEWS and modified
EWSs were found to be similar in their ability to predict the outcomes of interest. Further
research is warranted to validate the findings from these studies before the widespread
adoption of modified EWSs.

Clinical & Cost-effectiveness of the National Early Warning System (NEWS): Systematic Review Update
Health Research Board – Collaboration in Ireland for Clinical Effectiveness Reviews
321
12 Why do health care professionals fail to escalate as per the NEWS protocol: a thematic analysis
12.1 Chapter overview
Healthcare professionals (HCPs) may encounter a deteriorating patient on a daily basis.
Based on the patient’s early warning score, when this passes a certain threshold, the HCP
should escalate the level of care that is they should activate the emergency response system
(ERS) team. However, we know from previous research that sometimes HCPs do not activate
the ERS.(188, 189) This chapter explores the barriers and facilitators to activating ERS from the
perspective of HCPs. A thematic analysis was conducted and the key themes which were
generated from the literature (categorised into barriers and facilitators of escalation) are
presented.
12.2 Characteristics of included studies
Eighteen qualitative studies were eligible for inclusion with three conducted in Australia,(190-
192) six in the UK,(98, 185, 193-196) five in the USA,(137, 197-200) and one each in Ireland,(201)
Norway,(202) Denmark,(203) and Singapore.(204) To gain an understanding of the barriers and
facilitators to escalation, eight studies used face-to-face interviews,(98, 185, 192, 193, 197, 198, 201,
204) and seven studies used focus groups.(137, 190, 191, 196, 199, 202, 203) Three studies(194, 195, 200)
used a combination of methods including interviews, observations of interactions, and
documentary evidence [protocols and audit data], two of which were conducted in the
same hospital and sample.(194, 195) The first study by Mackintosh (2012)(194) contained 150
hours of observations and used thematic analysis while the second study (Mackintosh,
2014)(195) contained 180 hours of observation and the analysis focused on the structural
conditions that shape delivery of the rapid response drawing on Bourdieu's logic of practice.
Data from both were extracted for this thematic analysis. Ten studies included nurses only
(registered, unregistered),(137, 185, 192, 196, 197, 199, 200, 202-204) three studies includes nurses and
doctors only,(98, 191, 201) and five studies included a mixture of HCPs and staff [nurses,
physicians, administrators, respiratory technicians, health care assistants, safety leads and
managers].(190, 193-195, 198) A total of 599 participants were interviewed across the studies with
sample sizes ranging from six participants(196) to 218 participants.(190) The key study
characteristics are outlined in Table 12.1.
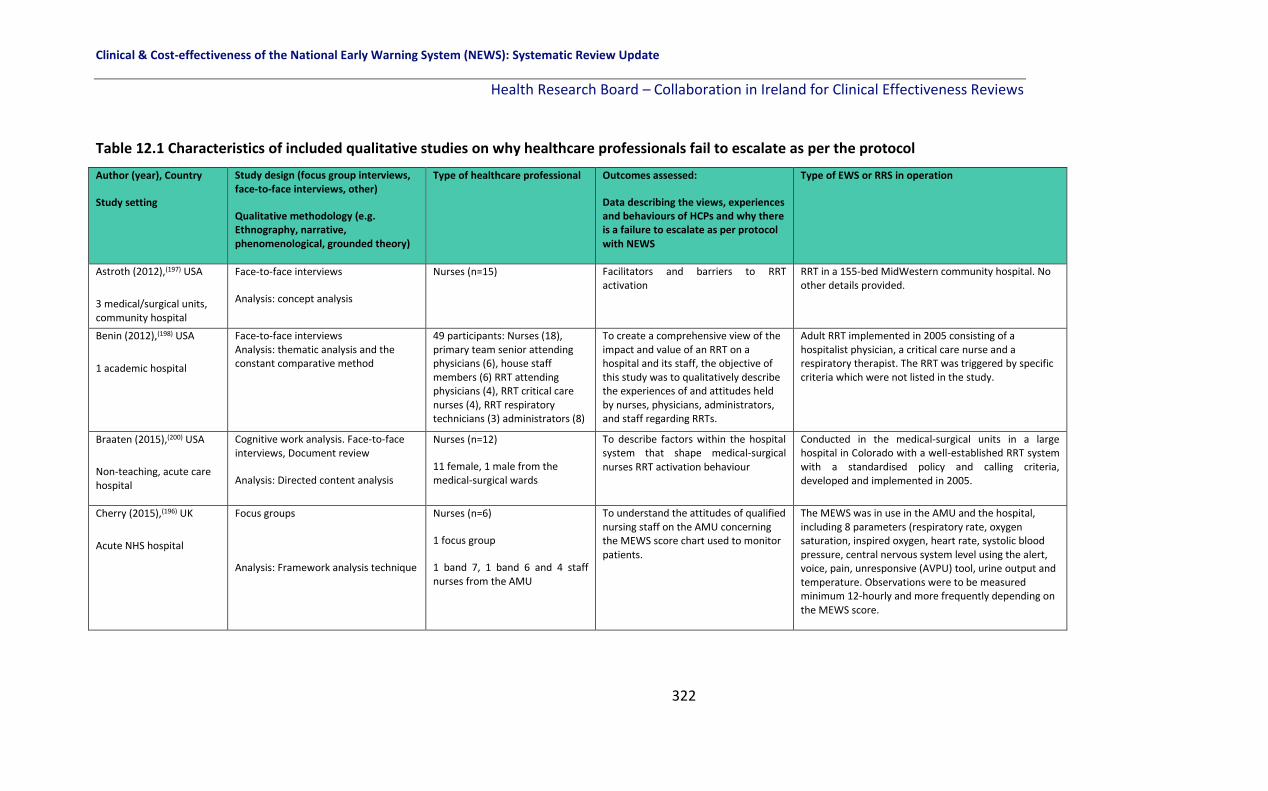
Clinical & Cost-effectiveness of the National Early Warning System (NEWS): Systematic Review Update
Health Research Board – Collaboration in Ireland for Clinical Effectiveness Reviews
322
Table 12.1 Characteristics of included qualitative studies on why healthcare professionals fail to escalate as per the protocol
Author (year), Country
Study setting
Study design (focus group interviews, face-to-face interviews, other)
Qualitative methodology (e.g. Ethnography, narrative, phenomenological, grounded theory)
Type of healthcare professional Outcomes assessed:
Data describing the views, experiences and behaviours of HCPs and why there is a failure to escalate as per protocol with NEWS
Type of EWS or RRS in operation
Astroth (2012),(197) USA
3 medical/surgical units, community hospital
Face-to-face interviews
Analysis: concept analysis
Nurses (n=15) Facilitators and barriers to RRT activation
RRT in a 155-bed MidWestern community hospital. No other details provided.
Benin (2012),(198) USA
1 academic hospital
Face-to-face interviews Analysis: thematic analysis and the constant comparative method
49 participants: Nurses (18), primary team senior attending physicians (6), house staff members (6) RRT attending physicians (4), RRT critical care nurses (4), RRT respiratory technicians (3) administrators (8)
To create a comprehensive view of the impact and value of an RRT on a hospital and its staff, the objective of this study was to qualitatively describe the experiences of and attitudes held by nurses, physicians, administrators, and staff regarding RRTs.
Adult RRT implemented in 2005 consisting of a hospitalist physician, a critical care nurse and a respiratory therapist. The RRT was triggered by specific criteria which were not listed in the study.
Braaten (2015),(200) USA
Non-teaching, acute care hospital
Cognitive work analysis. Face-to-face interviews, Document review
Analysis: Directed content analysis
Nurses (n=12)
11 female, 1 male from the medical-surgical wards
To describe factors within the hospital system that shape medical-surgical nurses RRT activation behaviour
Conducted in the medical-surgical units in a large hospital in Colorado with a well-established RRT system with a standardised policy and calling criteria, developed and implemented in 2005.
Cherry (2015),(196) UK
Acute NHS hospital
Focus groups
Analysis: Framework analysis technique
Nurses (n=6)
1 focus group
1 band 7, 1 band 6 and 4 staff nurses from the AMU
To understand the attitudes of qualified nursing staff on the AMU concerning the MEWS score chart used to monitor patients.
The MEWS was in use in the AMU and the hospital, including 8 parameters (respiratory rate, oxygen saturation, inspired oxygen, heart rate, systolic blood pressure, central nervous system level using the alert, voice, pain, unresponsive (AVPU) tool, urine output and temperature. Observations were to be measured minimum 12-hourly and more frequently depending on the MEWS score.

Clinical & Cost-effectiveness of the National Early Warning System (NEWS): Systematic Review Update
Health Research Board – Collaboration in Ireland for Clinical Effectiveness Reviews
323
Authors, Country
Study setting
Study design (focus group interviews,
face-to-face interviews, other)
Qualitative methodology (e.g.
Ethnography, narrative,
phenomenological, grounded theory)
Type of Healthcare professional Outcomes assessed:
Data describing the views, experiences
and behaviours of HCPs and why there
is a failure to escalate as per protocol
with NEWS
Type of EWS or RRS in operation
Chua (2013),(204) Singapore
1 acute hospital
Face-to-face interviews with critical incident technique (CIT)
Analysis: content analysis
Enrolled nurses (ENs) (n=15)
ENs: non-registered nursing staff provide bedside nursing care and routine vital signs monitoring and convey findings to the registered nurses
Experiences of ENs with the deteriorating patient in pre-cardiac arrest situations.
Strategies to enhance the role of ENs in
detecting and managing ward
deteriorating patients
No system reported but vital signs were used to
detect deterioration.
Elliott (2015),(190) Australia
8 different hospital sites
Focus groups (44) Analysis: thematic analysis
Staff (n=218) (mainly nurses and doctors)
Experiences and views of staff using
ORCs in clinical practice
ORCs based on the ADDS and a RRT with clear
protocols for escalation.
Johnston (2014),(193) UK
3 hospitals across London
Semi-structured interviews
Analysis: Emergent theme analysis
41 participants:
attending/senior resident grade surgeons (16), surgical postgraduate year 1 (11), surgical nurses (6), intensivists (4),
critical care outreach team
members (4)
The current escalation landscape;
When junior doctors and nurses should
escalate care; Information required
prior to senior review; Barriers to
successful escalation of care; Strategies
to improve the escalation process.
Escalation of care across the surgical pathway from
the specialities of General Surgery, Vascular Surgery,
and Urology from 3 London hospitals was examined.
No other details provided.
Table 12.1 Characteristics of included qualitative studies on why healthcare professionals fail to escalate as per the protocol

Clinical & Cost-effectiveness of the National Early Warning System (NEWS): Systematic Review Update
Health Research Board – Collaboration in Ireland for Clinical Effectiveness Reviews
324
Authors, Country
Study setting
Study design (focus group interviews,
face-to-face interviews, other)
Qualitative methodology (e.g.
Ethnography, narrative,
phenomenological, grounded theory)
Type of Healthcare professional Outcomes assessed:
Data describing the views, experiences
and behaviours of HCPs and why there
is a failure to escalate as per protocol
with NEWS
Type of EWS or RRS in operation
Kitto (2015),(191) Australia
4 hospitals
Multiple case study (focus groups)
Conceptual framework: Collective competence and inter-professional conceptual framework Analysis: Directed content analysis & conventional content analysis
89 participants (10 focus groups):
doctors (27), nurses (62)
Medical and nursing staff experiences
of RRS
Explore the reasons why staff members
do not activate the RRS
RRS in 4 different hospitals. No other details provided.
Lydon (2016),(201) Ireland
1 teaching hospital
Mixed Methods, semi-structured interviews
Analysis: Deductive content analysis
30 participants:
Interns [1st year of postgraduate
training](18), Senior NCHDs (2),
Nurses (10)
To examine the perceptions of a
national PTTS among nurses and
doctors and to identify the variables
that impact on intention to comply with
protocol.
A PTTS using the NEWS and ISBAR communication
tool
Mackintosh (2012),(194) UK
2 tertiary teaching hospitals
**Same sample as
Mackintosh (2014)
Ethnography; Observation of
interactions among multi-professional
healthcare staff and patient
management processes; semi-
structured interviews.
Analysis: framework approach
150 hours of observations
35 interviews: Doctors (14), Ward
and critical care nurses (11),
Healthcare assistants (4), Safety
leads and managers (6)
To illuminate the different contextual
processes which contribute to patients’
rescue trajectories and clarify the
benefits and limitations of particular
safety strategies within a pathway of
care for the acutely ill patient.
Five strategies were in use across 2 hospitals.
At Westward, an EWS, escalation protocol,
communication protocol (SBAR) and CCOT (comprised
of nurses, physiotherapists and intensive care
Table 12.1 Characteristics of included qualitative studies on why healthcare professionals fail to escalate as per the protocol
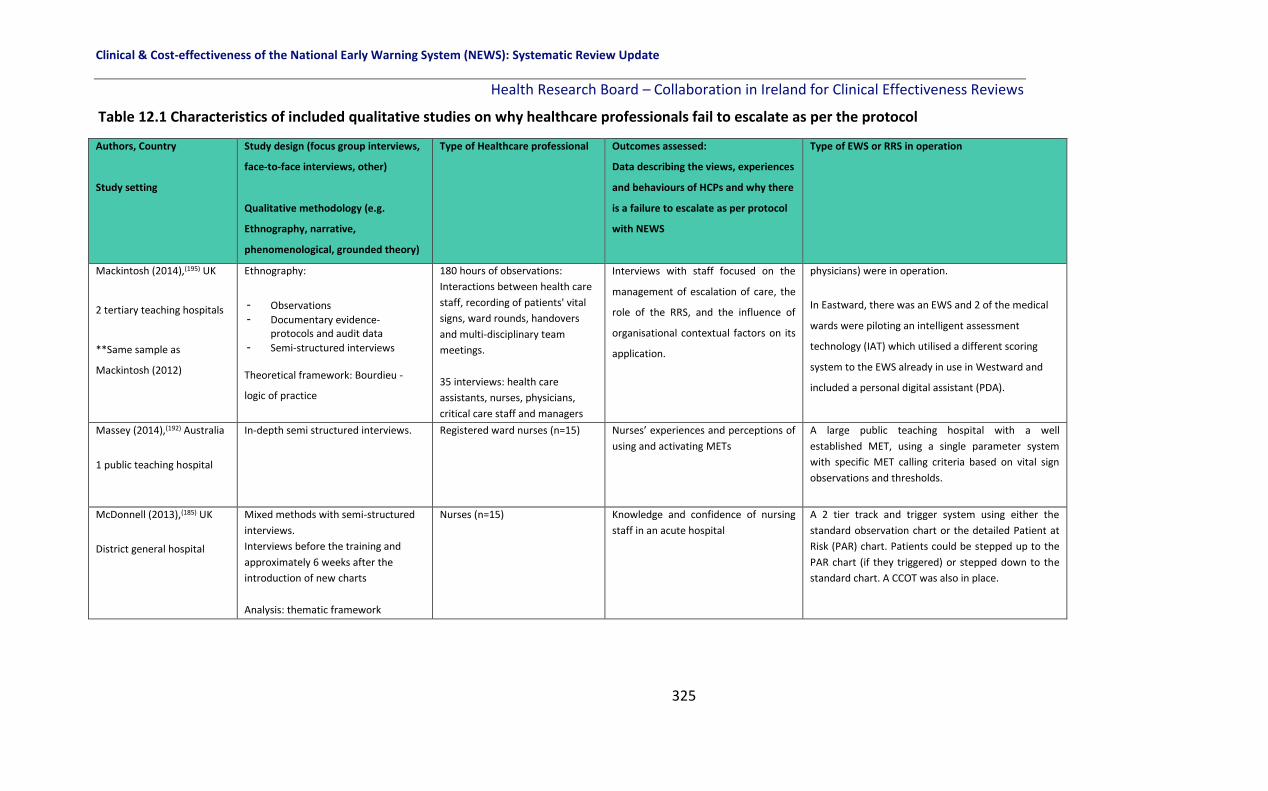
Clinical & Cost-effectiveness of the National Early Warning System (NEWS): Systematic Review Update
Health Research Board – Collaboration in Ireland for Clinical Effectiveness Reviews
325
Authors, Country
Study setting
Study design (focus group interviews,
face-to-face interviews, other)
Qualitative methodology (e.g.
Ethnography, narrative,
phenomenological, grounded theory)
Type of Healthcare professional Outcomes assessed:
Data describing the views, experiences
and behaviours of HCPs and why there
is a failure to escalate as per protocol
with NEWS
Type of EWS or RRS in operation
Mackintosh (2014),(195) UK
2 tertiary teaching hospitals
**Same sample as
Mackintosh (2012)
Ethnography:
- Observations
- Documentary evidence- protocols and audit data
- Semi-structured interviews
Theoretical framework: Bourdieu -
logic of practice
180 hours of observations:
Interactions between health care
staff, recording of patients' vital
signs, ward rounds, handovers
and multi-disciplinary team
meetings.
35 interviews: health care
assistants, nurses, physicians,
critical care staff and managers
Interviews with staff focused on the
management of escalation of care, the
role of the RRS, and the influence of
organisational contextual factors on its
application.
physicians) were in operation.
In Eastward, there was an EWS and 2 of the medical
wards were piloting an intelligent assessment
technology (IAT) which utilised a different scoring
system to the EWS already in use in Westward and
included a personal digital assistant (PDA).
Massey (2014),(192) Australia
1 public teaching hospital
In-depth semi structured interviews. Registered ward nurses (n=15) Nurses’ experiences and perceptions of
using and activating METs
A large public teaching hospital with a well
established MET, using a single parameter system
with specific MET calling criteria based on vital sign
observations and thresholds.
McDonnell (2013),(185) UK
District general hospital
Mixed methods with semi-structured
interviews.
Interviews before the training and
approximately 6 weeks after the
introduction of new charts
Analysis: thematic framework
Nurses (n=15) Knowledge and confidence of nursing
staff in an acute hospital
A 2 tier track and trigger system using either the
standard observation chart or the detailed Patient at
Risk (PAR) chart. Patients could be stepped up to the
PAR chart (if they triggered) or stepped down to the
standard chart. A CCOT was also in place.
Table 12.1 Characteristics of included qualitative studies on why healthcare professionals fail to escalate as per the protocol
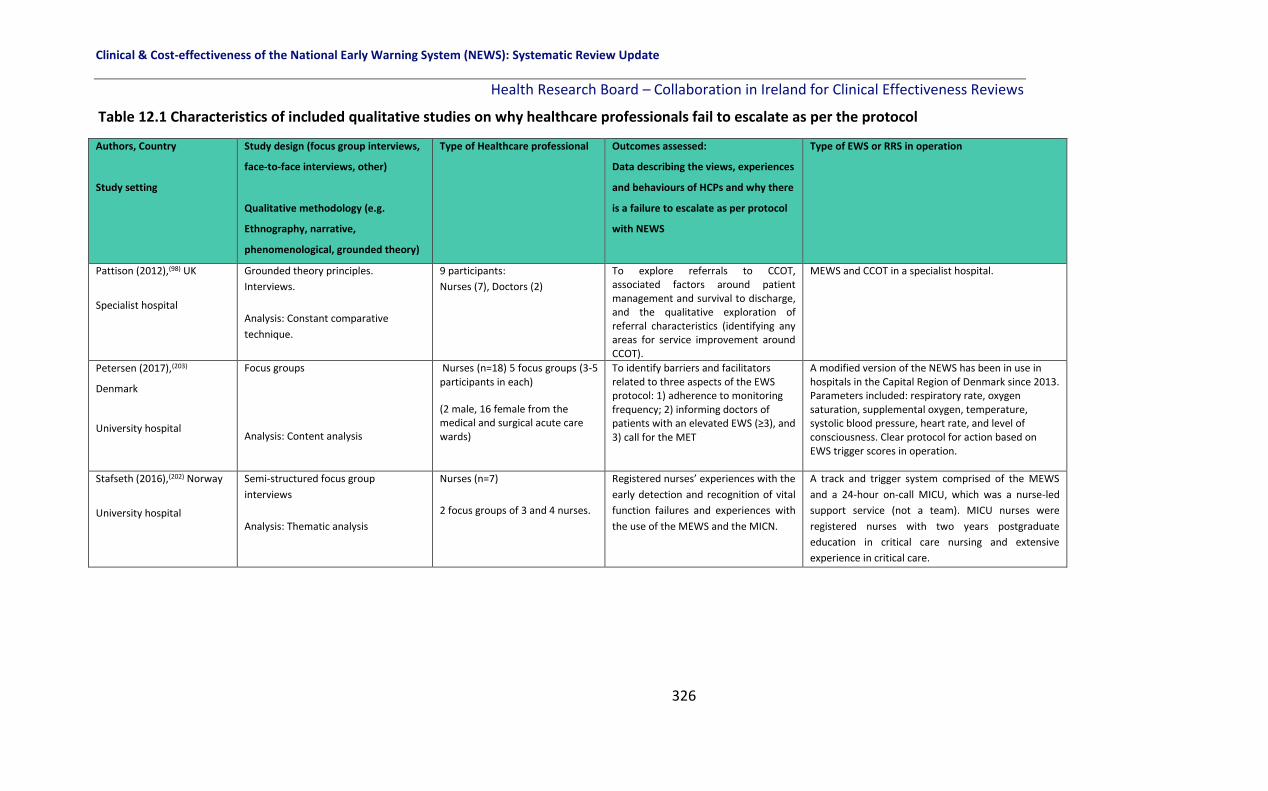
Clinical & Cost-effectiveness of the National Early Warning System (NEWS): Systematic Review Update
Health Research Board – Collaboration in Ireland for Clinical Effectiveness Reviews
326
Authors, Country
Study setting
Study design (focus group interviews,
face-to-face interviews, other)
Qualitative methodology (e.g.
Ethnography, narrative,
phenomenological, grounded theory)
Type of Healthcare professional Outcomes assessed:
Data describing the views, experiences
and behaviours of HCPs and why there
is a failure to escalate as per protocol
with NEWS
Type of EWS or RRS in operation
Pattison (2012),(98) UK
Specialist hospital
Grounded theory principles.
Interviews.
Analysis: Constant comparative
technique.
9 participants:
Nurses (7), Doctors (2)
To explore referrals to CCOT, associated factors around patient management and survival to discharge, and the qualitative exploration of referral characteristics (identifying any areas for service improvement around CCOT).
MEWS and CCOT in a specialist hospital.
Petersen (2017),(203)
Denmark
University hospital
Focus groups
Analysis: Content analysis
Nurses (n=18) 5 focus groups (3-5 participants in each)
(2 male, 16 female from the medical and surgical acute care wards)
To identify barriers and facilitators related to three aspects of the EWS protocol: 1) adherence to monitoring frequency; 2) informing doctors of patients with an elevated EWS (≥3), and 3) call for the MET
A modified version of the NEWS has been in use in hospitals in the Capital Region of Denmark since 2013. Parameters included: respiratory rate, oxygen saturation, supplemental oxygen, temperature, systolic blood pressure, heart rate, and level of consciousness. Clear protocol for action based on EWS trigger scores in operation.
Stafseth (2016),(202) Norway
University hospital
Semi-structured focus group
interviews
Analysis: Thematic analysis
Nurses (n=7)
2 focus groups of 3 and 4 nurses.
Registered nurses’ experiences with the
early detection and recognition of vital
function failures and experiences with
the use of the MEWS and the MICN.
A track and trigger system comprised of the MEWS
and a 24-hour on-call MICU, which was a nurse-led
support service (not a team). MICU nurses were
registered nurses with two years postgraduate
education in critical care nursing and extensive
experience in critical care.
Table 12.1 Characteristics of included qualitative studies on why healthcare professionals fail to escalate as per the protocol

Clinical & Cost-effectiveness of the National Early Warning System (NEWS): Systematic Review Update
Health Research Board – Collaboration in Ireland for Clinical Effectiveness Reviews
327
Authors, Country
Study setting
Study design (focus group interviews,
face-to-face interviews, other)
Qualitative methodology (e.g.
Ethnography, narrative,
phenomenological, grounded theory)
Type of Healthcare professional Outcomes assessed:
Data describing the views, experiences
and behaviours of HCPs and why there
is a failure to escalate as per protocol
with NEWS
Type of EWS or RRS in operation
Stewart (2014),(137) USA
Acute care hospital
Mixed-methods; Focus groups
Analysis: Thematic analysis
Nurses (n=11)
5 focus with between 1 and 4
attendees, providers.
Perceptions of barriers and facilitators
to the use of MEWS at the bedside
The MEWS scoring system was implemented in the
hospitals electronic medical record system in 2011
where a RRS also exists.
Williams (2011),(199) USA
Community hospital
Focus groups
Analysis: Content analysis
Nurses (n=14)
6 focus groups
Staff nurses (6), Nurse clinicians
(2) Supervisor/educators (6)
Thoughts and feelings about shared
and “lived” experiences surrounding
RRT use.
156-bed community hospital with a nurse-led RRT
implemented in 2005. RRT consisted of an ICU
registered nurses, an emergency department
registered nurse and a respiratory therapist.
Hospitalists often responded to RRT calls but were not
obliged to according to hospital protocol.
Key: ADDS: Adult Deterioration Detection System; AMU: Acute Medical Unit; CCOT: Critical Care Outreach Team; CIT: Critical Incident Technique; EN: Enrolled Nurses; EWS: Early Warning System; HCP: Health Care Professional; MEWS: Modified Early Warning System; MET: Medical Emergency Teams; MICN: Mobile Intensive Care Nurse; NCHD: Non Consultant Hospital Doctor; ORC: Observation Response Chart; PTTS: Physiological Track and Trigger System; RRS: Rapid Response System; RRT: Rapid Response Team.
Table 12.1 Characteristics of included qualitative studies on why healthcare professionals fail to escalate as per the protocol

Clinical & Cost-effectiveness of the National Early Warning System (NEWS): Systematic Review Update
Health Research Board – Collaboration in Ireland for Clinical Effectiveness Reviews
328
12.3 Methodology
The method used to synthesise the results from each study was based on the technique of
thematic analysis or synthesis.(205)
Two review team members read all 18 papers a number of times to achieve absorption of
the data. Both review team members manually extracted the text from each study (results
section only) and coded line by line in Excel, and developed initial sub-themes and
overarching themes independently. Following multiple discussions and re-analysis of the
draft themes and sub-themes as well as presentation of the findings to the guideline
development group at a meeting in November 2018, the review team members reached
consensus on the final overarching themes and sub-themes, presented in Figure 12.1.
12.4 Results
Thematic synthesis produced five overarching themes and 22 sub-themes with multiple
interdependencies. These are categorised into barriers (twelve sub-themes) and facilitators
(ten sub-themes) of escalation. These are described for each of the five overarching themes
in section 12.5.1 to section 12.5.2:
▪ Governance
▪ Rapid response team Response
▪ Professional Boundaries
▪ Clinical Experience
▪ Early Warning System (EWS) Parameters.
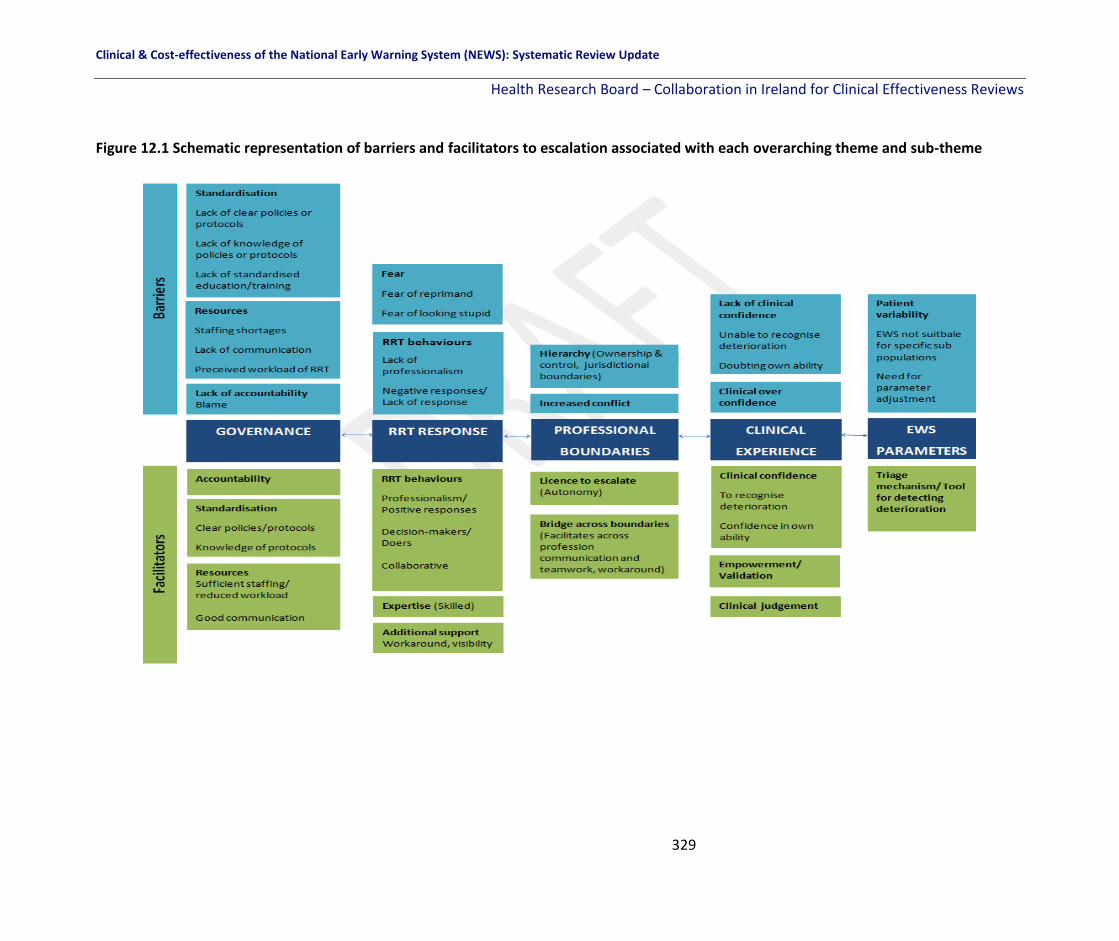
Clinical & Cost-effectiveness of the National Early Warning System (NEWS): Systematic Review Update
Health Research Board – Collaboration in Ireland for Clinical Effectiveness Reviews
329
Figure 12.1 Schematic representation of barriers and facilitators to escalation associated with each overarching theme and sub-theme

Clinical & Cost-effectiveness of the National Early Warning System (NEWS): Systematic Review Update
Health Research Board – Collaboration in Ireland for Clinical Effectiveness Reviews
330
12.5 Synthesis of results
12.5.1 Barriers to escalation
Table 12.2 provides illustrative quotations from either primary study participants or study
authors relating to the ‘barriers’ for each key theme and sub-theme. There was variation in
the relative contribution of each study to the themes and sub-themes.
Governance
‘Governance’ refers to the overall organisational or institutional specific factors affecting
why HCPs fail to escalate, or barriers to escalation. Fourteen papers described governance
issues as factors contributing to a failure to escalate care.(98, 190-198, 200, 201, 203, 204) Three sub-
themes including Standardisation, Resources and Lack of accountability were identified.
‘Standardisation’ was an issue reported in twelve studies.(190-194, 196, 197, 200, 201, 204)
Standardisation included a lack of clear policies or protocols for action which was reported
in four studies(193, 194, 196, 200) and this led to inaction or confusion amongst staff as to who to
call or when. In addition to a lack of clear policies or protocols, ‘standardisation’ included a
lack of knowledge of policies or protocols by staff, reported in six studies.(190-193, 197, 200)
Where staff were not familiar with the correct protocol for escalation this was a barrier to
escalation. Lack of education or training was reported in six studies by participants with no
standardised, or regular training in place.(191, 192, 196, 197, 201, 204)
‘Resources’ were reported as barriers in nine studies(98, 190, 193, 197, 198, 200, 201, 203, 204) whereby
staffing shortages, particularly in conducting the required monitoring of patients, (eight
studies),(98, 190, 193, 198, 200, 201, 203, 204) poor communication systems/protocols (three
studies)(190, 193, 201) and the perceived workload of the RRT (six studies)(98, 190, 193, 197, 201, 204)
were all reported as barriers to escalation: “Perceived busyness of the ICU nurses
discouraged participants from RRT activation. Participants noted that responding RRT
members occasionally talked about how busy they were.”

Clinical & Cost-effectiveness of the National Early Warning System (NEWS): Systematic Review Update
Health Research Board – Collaboration in Ireland for Clinical Effectiveness Reviews
331
‘Lack of accountability’ and a blame culture was a reported sub-theme in three papers.(194,
195, 204) This was particularly the case in settings where health care assistants (HCAs) or
equivalent staff were involved in documenting patient vital signs. HCAs believed there was
often blame put on them by more senior staff when something went wrong. For example,
junior staff described situations where a patient deteriorated and they informed senior
staff, but the senior staff did not escalate care, and then when the patient collapsed or
deteriorated the blame was put on the junior staff member.(194, 195, 204) This lack of
accountability of senior staff was a barrier to these staff in raising concerns about
deterioration.
RRT Response
‘RRT Response’ refers to how the RRT responded when a call for help was made. This key
theme was apparent in ten papers.(191-193, 196-200, 202, 203) Two sub-themes including RRT
behaviours and Fear were identified.
‘RRT behaviours’ were a barrier to escalation or future escalation calls when a ‘lack of
professionalism’ was shown by the RRT to the staff who made the call. This was reported in
eight papers.(191-193, 197, 199, 200, 202, 203) A ‘negative response’ or a total ‘lack of response’ (i.e.
the RRT did not come) was also a barrier to escalation or subsequent escalation reported in
eight papers.(191-193, 196, 197, 199, 202, 203) Participants reported being questioned as to whether
the call to the RRT was necessary, they often reported feeling belittled or criticised and this
negative response was a barrier to subsequent escalation.
Participants reported ‘fear’ was a barrier to escalation in seven papers.(191-193, 197, 198, 200, 203)
‘Fear of reprimand’ by members of the RRT for activating a call was reported by participants
as well as ‘fear of looking stupid or dumb’ to colleagues, both of which were significant
barriers to escalation.

Clinical & Cost-effectiveness of the National Early Warning System (NEWS): Systematic Review Update
Health Research Board – Collaboration in Ireland for Clinical Effectiveness Reviews
332
Professional Boundaries
‘Professional boundaries’ refers to the barriers to escalation that were apparent in the
included studies surrounding hierarchy, power, and jurisdictional control. Ten papers
described professional boundaries as core contributing factors to not escalating.(98, 191-195, 197,
198, 200, 201) Two sub-themes including Hierarchy and Increased conflict were identified.
Participants described having to negotiate hierarchical boundaries in order to escalate care
in eight papers.(191, 193-198, 200) In some instances, participants described being reprimanded
by the patient’s primary ward physician for calling the RRT. The primary ward physician
often felt it was “their patient and their job to look after them” and that the junior staff had
“gone over their head” in calling the RRT.(46, 198) This in turn led to an increase in conflict
between nurses and ward physicians. Calling for help (escalation) also led to increased
conflict among other staff in a number of papers.(98, 191, 192, 194, 197, 198, 201) In particular, the
use of the RRT was often viewed as a jurisdictional shift in responsibility for acutely ill
patients by members of the RRT who felt some nurses “washed their hands” of the
situation. This may contribute to the negative responses of RRT, as described above.
Clinical Experience
‘Clinical experience’ refers to the barriers to escalation specifically related to individual staff
and their level of confidence and ability to detect deterioration, which was reported in six
studies.(98, 192, 193, 197, 200, 203) Two sub-themes including Clinical over confidence and Lack of
clinical confidence were identified.
‘Clinical over confidence’ reported in five papers,(98, 193, 197, 200, 203) was characterised by
participants being overly confident in their clinical ability. Participants expressed confidence
that their clinical judgement was a better gauge of when to escalate care, irrespective of the
EWS, and also that they were better placed to care for their own patient rather than the
RRT.

Clinical & Cost-effectiveness of the National Early Warning System (NEWS): Systematic Review Update
Health Research Board – Collaboration in Ireland for Clinical Effectiveness Reviews
333
In contrast, ‘lack of clinical confidence’, was reported in three studies.(192, 197, 200) Here it was
participants inability to detect deterioration or doubting their own skills and ability to detect
deterioration that led to a delay in escalation or to no escalation.
Early Warning System Parameters
‘EWS Parameters’ refers to the system specific barriers to escalation, which were reported
in eight studies.(137, 185, 190, 194, 195, 201, 203, 204) One sub-theme, Patient variability was identified.
‘Patient variability’ that is the existence of specific groups of patients, for example, those
with chronic obstructive pulmonary disease, was reported as a barrier. For these patients,
who by default fall outside the normal range for the various vital signs, participants reported
either excessive triggering of the EWS or else staff simply ignored the EWS for these
patients. “The inability of the MEWS to tailor alarm settings and limits to accommodate
patients whose vital sign measurements normally fell outside predetermined thresholds was
cited by focus group participants as a major barrier to effective use of the system”.(137) The
need for parameter adjustment was also cited within the patient variability sub-theme:
Participants reported that parameters were rarely reviewed or adjusted and that this was a
continual problem for interns and nurses "If parameters aren’t charted you're expected to
check the observation and inform the intern more than is necessary" (Nurse 4).(201)
The themes of ‘governance’, ‘professional boundaries’, ‘RRT Response’, ‘Clinical Experience’,
and ‘Early Warning System Parameters’ are individual but inter-related barriers to escalation
of care. Each theme may be its own barrier, but when taken together they create an
environment in which escalation of care may occur too late or not occur at all. For example,
a lack of governance such as a lack of clear policies or protocols, or lack of knowledge of
policies or protocols by all staff creates the potential for conflicts in professional boundaries.
This may create a level of ‘fear’ for junior staff, particular those with less clinical confidence,
who experience negative attitudes from both the RRT and primary ward physicians which
contribute to a reluctance to activate the RRT in the future.

Clinical & Cost-effectiveness of the National Early Warning System (NEWS): Systematic Review Update
Health Research Board – Collaboration in Ireland for Clinical Effectiveness Reviews
334
Table 12.2 Key themes of the barriers of escalation amongst healthcare professionals
Key Themes Sub-themes Characteristics of studies from which sub-themes were derived: Type of participant and setting
Illustrative quotations (Italicised text= primary quote from a study participant; non-italicised text=secondary quote from study authors)
Governance Lack of accountability(194,
195, 204) Enrolled nurses (non-registered nurses who assist registered nurses) in 1 Singaporean hospital;(204) HCAs, nurses, physicians, critical care staff and managers in 2 UK hospitals(194, 195)
A few participants strongly reiterated the need for some form of nursing documentation which specified that they had informed the RN-in-charge of patient deterioration. This was to safeguard the ENs from being blamed for not reporting patient deterioration: "The EN should have charting and documentation that indicates this staff nurse had been informed . . . so then at least we know that we’re safe and we don’t get into trouble. (P3)”(204)
Standardisation -Lack of clear policies/protocols(193, 194,
196, 200) -Lack of knowledge of policies/protocols (190-193,
197, 200) -Lack of standardised education/training(191, 192,
196, 197, 201, 204)
HCAs, nurses, physicians, critical care staff and managers in 2 UK hospitals;(194) Senior resident surgeons, surgical postgraduates year 1, intensivists, and critical care outreach team members from 3 UK hospitals;(193) Nurses in 1 US hospital;(197) Mainly doctors and nurses in 8 Australian hospitals;(190) Doctors and nurses in 4 Australian hospitals;(191) Nurses in 1 Australian hospital;(192) Enrolled nurses (non-registered nurses who assist registered nurses) in 1 Singaporean hospital;(204) Year 1 interns, Senior NCHDs and nurses in 1 Irish hospital;(201) Nurses in 1 US hospital; (200) Nurses in 1 UK hospital(196)
“On a number of occasions I've had difficulties contacting a senior because there is no fixed framework for doing so”.(193) “Maybe if we had a clearer-cut criteria on when we do call an RRT and when we wait. You know? . . . People aren’t sure. Do we wait until they get this bad . . . or their O2 requirements are at this level? At what point do we need to call them? . . .” (200) “I think it’s probably a lack of understanding of the MET and how it should be used. People don’t see it as an early intervention thing; I am not sure how you go about changing that. I can see that the patient is deteriorating and I can see that poor decisions are being made and it’s very frustrating, yet a MET is not called because the patient is not sick enough for a MET; it’s amazing”.(192) A few participants stated they had not received any education other than when the RRT was first developed. One nurse indicated she had not attended any RRT educational sessions.(197)
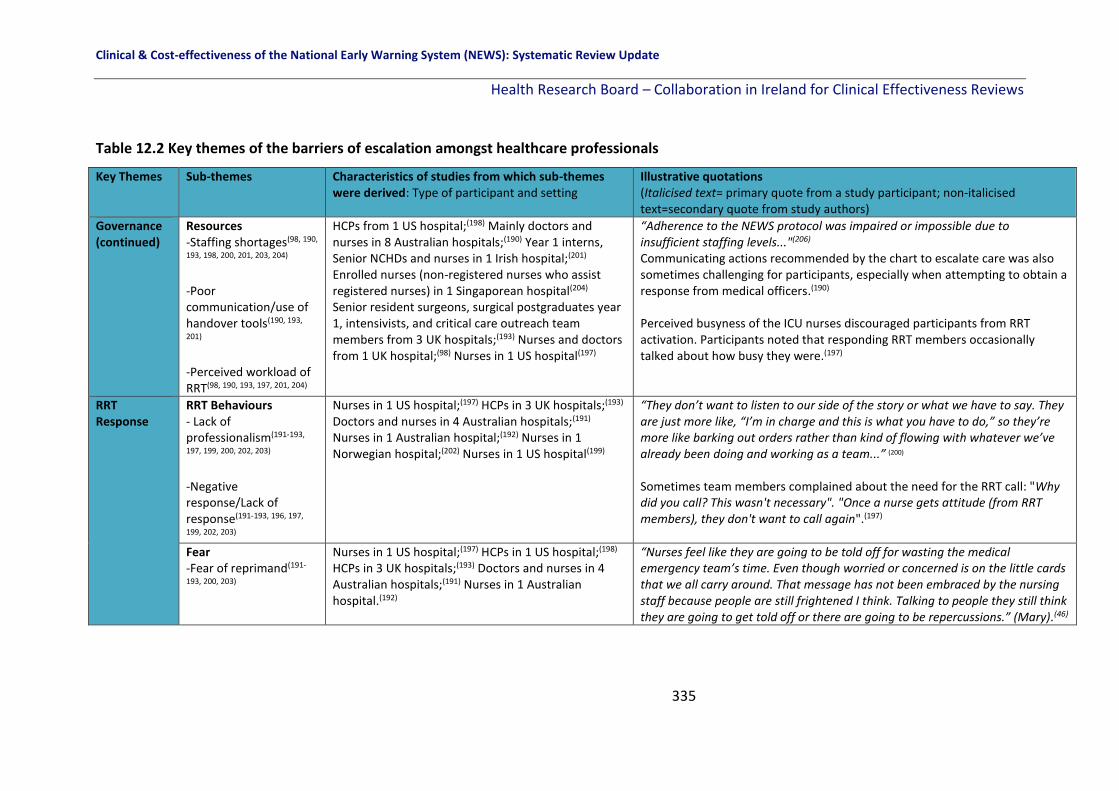
Clinical & Cost-effectiveness of the National Early Warning System (NEWS): Systematic Review Update
Health Research Board – Collaboration in Ireland for Clinical Effectiveness Reviews
335
Table 12.2 Key themes of the barriers of escalation amongst healthcare professionals
Key Themes Sub-themes Characteristics of studies from which sub-themes were derived: Type of participant and setting
Illustrative quotations (Italicised text= primary quote from a study participant; non-italicised text=secondary quote from study authors)
Governance (continued)
Resources -Staffing shortages(98, 190,
193, 198, 200, 201, 203, 204) -Poor communication/use of handover tools(190, 193,
201) -Perceived workload of RRT(98, 190, 193, 197, 201, 204)
HCPs from 1 US hospital;(198) Mainly doctors and nurses in 8 Australian hospitals;(190) Year 1 interns, Senior NCHDs and nurses in 1 Irish hospital;(201) Enrolled nurses (non-registered nurses who assist registered nurses) in 1 Singaporean hospital(204) Senior resident surgeons, surgical postgraduates year 1, intensivists, and critical care outreach team members from 3 UK hospitals;(193) Nurses and doctors from 1 UK hospital;(98) Nurses in 1 US hospital(197)
“Adherence to the NEWS protocol was impaired or impossible due to insufficient staffing levels..."(206) Communicating actions recommended by the chart to escalate care was also sometimes challenging for participants, especially when attempting to obtain a response from medical officers.(190) Perceived busyness of the ICU nurses discouraged participants from RRT activation. Participants noted that responding RRT members occasionally talked about how busy they were.(197)
RRT Response
RRT Behaviours - Lack of professionalism(191-193,
197, 199, 200, 202, 203) -Negative response/Lack of response(191-193, 196, 197,
199, 202, 203)
Nurses in 1 US hospital;(197) HCPs in 3 UK hospitals;(193) Doctors and nurses in 4 Australian hospitals;(191) Nurses in 1 Australian hospital;(192) Nurses in 1 Norwegian hospital;(202) Nurses in 1 US hospital(199)
“They don’t want to listen to our side of the story or what we have to say. They are just more like, “I’m in charge and this is what you have to do,” so they’re more like barking out orders rather than kind of flowing with whatever we’ve already been doing and working as a team...” (200) Sometimes team members complained about the need for the RRT call: "Why did you call? This wasn't necessary". "Once a nurse gets attitude (from RRT members), they don't want to call again".(197)
Fear -Fear of reprimand(191-
193, 200, 203)
Nurses in 1 US hospital;(197) HCPs in 1 US hospital;(198) HCPs in 3 UK hospitals;(193) Doctors and nurses in 4 Australian hospitals;(191) Nurses in 1 Australian hospital.(192)
“Nurses feel like they are going to be told off for wasting the medical emergency team’s time. Even though worried or concerned is on the little cards that we all carry around. That message has not been embraced by the nursing staff because people are still frightened I think. Talking to people they still think they are going to get told off or there are going to be repercussions.” (Mary).(46)

Clinical & Cost-effectiveness of the National Early Warning System (NEWS): Systematic Review Update
Health Research Board – Collaboration in Ireland for Clinical Effectiveness Reviews
336
Table 12.2 Key themes of the barriers of escalation amongst healthcare professionals
Key Themes Sub-themes Characteristics of studies from which sub-themes were derived: Type of participant and setting
Illustrative quotations (Italicised text= primary quote from a study participant; non-italicised text=secondary quote from study authors)
RRT Response (continued)
-Fear of looking stupid(191-193, 197, 198)
This theme is understood as either refusing to activate a MET or pausing before activating a MET. Participants said, “I don’t know if it would be the right thing to do”, “I don’t want to look like an idiot”.(192)
Professional Boundaries
Increased Conflict(98, 191,
192, 194, 197, 198, 201)
Nurses and doctors from 1 UK hospital;(98) Doctors and nurses in 4 Australian hospitals;(191)Nurses in 1 Australian hospital;(192) Year 1 interns, Senior NCHDs and nurses in 1 Irish hospital;(201) HCAs, nurses, physicians, critical care staff and managers in 2 UK hospitals;(194) Nurses in 1 US hospital;(197)HCPs in 1 US hospital(198)
RRT improved morale between nurses and RRT but increased conflict between nurses and physicians.(198) Interns frequently cite the NEWS as a source of conflict between doctors and nurses. For example an intern commented that: "some nurses see NEWS as something where they bring you and then wash their hands - they're rung someone, anyone, so their job is now done" (Intern 5)(201)
Hierarchy (ownership and control, jurisdictional boundaries)(191, 193-198,
200)
Doctors & nurses in 4 Australian hospitals;(191) HCPs in 3 UK hospitals;(193) HCAs, nurses, physicians, critical care staff & managers in 2 UK hospitals;(194) Nurses in 1 US hospital;(197) HCPs in 1 US hospital(195, 198)
“Sometimes they [primary ward physician]….have a bit of an attitude thing, oh I can handle this. This is my patient. I know this patient. I didn’t want a rapid response to be called. You know we get a fair amount of that, but not as much as we did in the beginning. In the beginning....nurses were being yelled at by the primary team....how dare you call a rapid response on my patient... they seem to be more receptive now [SWAT nurse]”.(198)
Clinical Experience
Clinical over confidence(98, 193, 197, 200,
203)
Nurses & doctors from 1 UK hospital;(98) HCPs in 3 UK hospitals;(193) Nurses in 1 US hospital(197)
“Sometimes it’s overconfidence or false confidence that you think you are in control of the situation. . . You could spend slightly less time with a person and then go back to them and realise their condition has changed but not noticed those subtle changes because you haven’t seen them for an hour or so.” (R6, Nurse)(98)
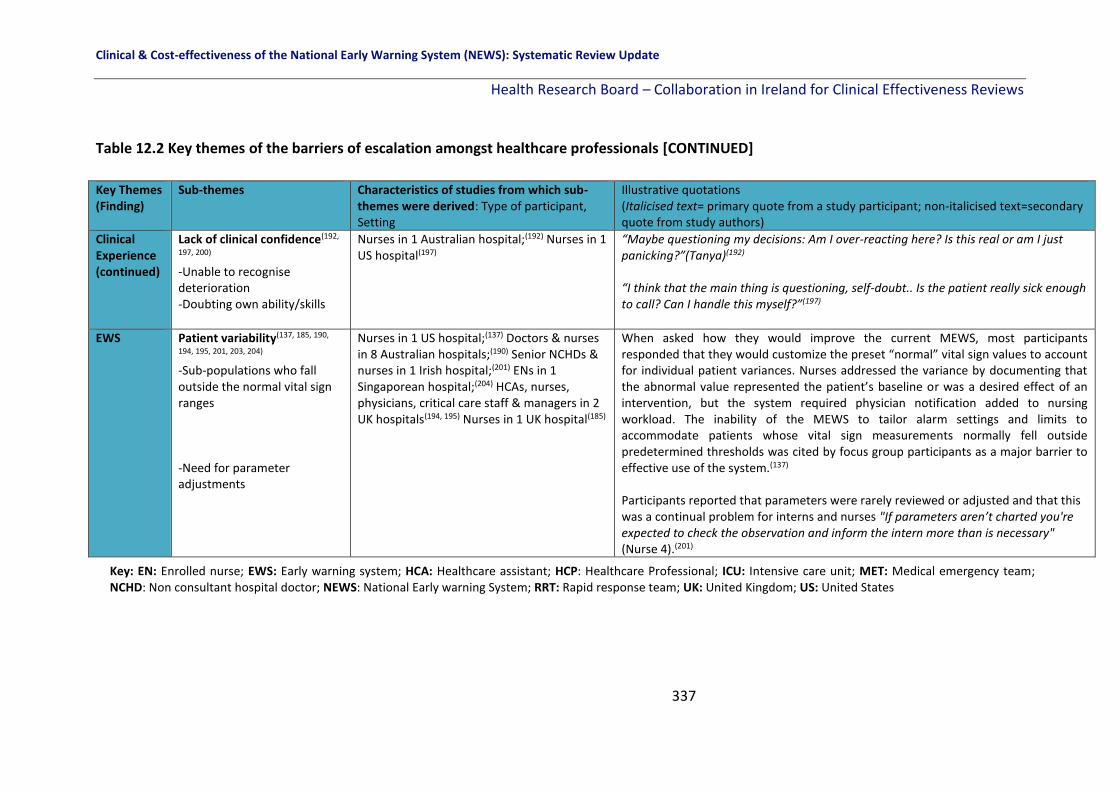
Clinical & Cost-effectiveness of the National Early Warning System (NEWS): Systematic Review Update
Health Research Board – Collaboration in Ireland for Clinical Effectiveness Reviews
337
Table 12.2 Key themes of the barriers of escalation amongst healthcare professionals [CONTINUED]
Key Themes (Finding)
Sub-themes Characteristics of studies from which sub-themes were derived: Type of participant, Setting
Illustrative quotations (Italicised text= primary quote from a study participant; non-italicised text=secondary quote from study authors)
Clinical Experience (continued)
Lack of clinical confidence(192,
197, 200) -Unable to recognise deterioration -Doubting own ability/skills
Nurses in 1 Australian hospital;(192) Nurses in 1 US hospital(197)
“Maybe questioning my decisions: Am I over-reacting here? Is this real or am I just panicking?”(Tanya)(192) “I think that the main thing is questioning, self-doubt.. Is the patient really sick enough to call? Can I handle this myself?”(197)
EWS Patient variability(137, 185, 190,
194, 195, 201, 203, 204) -Sub-populations who fall outside the normal vital sign ranges -Need for parameter adjustments
Nurses in 1 US hospital;(137) Doctors & nurses in 8 Australian hospitals;(190) Senior NCHDs & nurses in 1 Irish hospital;(201) ENs in 1 Singaporean hospital;(204) HCAs, nurses, physicians, critical care staff & managers in 2 UK hospitals(194, 195) Nurses in 1 UK hospital(185)
When asked how they would improve the current MEWS, most participants responded that they would customize the preset “normal” vital sign values to account for individual patient variances. Nurses addressed the variance by documenting that the abnormal value represented the patient’s baseline or was a desired effect of an intervention, but the system required physician notification added to nursing workload. The inability of the MEWS to tailor alarm settings and limits to accommodate patients whose vital sign measurements normally fell outside predetermined thresholds was cited by focus group participants as a major barrier to effective use of the system.(137) Participants reported that parameters were rarely reviewed or adjusted and that this was a continual problem for interns and nurses "If parameters aren’t charted you're expected to check the observation and inform the intern more than is necessary" (Nurse 4).(201)
Key: EN: Enrolled nurse; EWS: Early warning system; HCA: Healthcare assistant; HCP: Healthcare Professional; ICU: Intensive care unit; MET: Medical emergency team; NCHD: Non consultant hospital doctor; NEWS: National Early warning System; RRT: Rapid response team; UK: United Kingdom; US: United States

Clinical & Cost-effectiveness of the National Early Warning System (NEWS): Systematic Review Update
Health Research Board – Collaboration in Ireland for Clinical Effectiveness Reviews
338
12.5.2 Facilitators to escalation
Table 12.3 provides illustrative quotations from primary study participants or study authors
relating to the facilitators of escalation for each key theme and sub-theme. There was
variation in the relative contribution of each study to each theme and sub-theme.
Governance
‘Governance’ was a key theme within ten papers.(98, 137, 185, 190, 193-195, 197, 200, 201) Three sub-
themes of ‘Accountability’, ‘Standardisation’ and ‘Resources’ as facilitators of escalation
among the study participants were identified.
Accountability was a motivating factor in four studies, whereby staff activated the RRT in
order to ‘cover their own backs’ in case something went wrong.(193-195, 201) In this respect,
the RRT was viewed as a safety net by the nurses and they valued the extra support it
provided.
In addition, ‘standardisation’ was reported in seven studies, where clear policies or
protocols for action(185, 190, 194, 195, 197, 200, 201) and participant knowledge of these policies or
protocols for escalation(194, 195, 201) was a key facilitator of escalation. A clear outline of when
to call and who to call, that was communicated to and understood by all staff members, was
a facilitator of escalation.
Resources (that is sufficient staffing levels and good communication such as use of handover
tools) was a key facilitator of escalation in seven studies,(98, 137, 185, 193, 194, 197, 201) as
exemplified here: "There is now a single resident who covers the ward for the week and
twice daily attending ward rounds. I think this has made things better for juniors because
they have a single point of contact who is not going to be off site or in theatre".(193)
RRT Response
The behaviours of RRTs were reported as facilitators of escalation within this key theme in
ten studies.(98, 191, 193, 194, 197-200, 202, 203) Three sub-themes of ‘RRT behaviours’ (including

Clinical & Cost-effectiveness of the National Early Warning System (NEWS): Systematic Review Update
Health Research Board – Collaboration in Ireland for Clinical Effectiveness Reviews
339
professionalism, decision-makers and collaborative), ‘Expertise’ and ‘Additional support’
were identified.
In terms of RRT behaviours, where there was a ‘professional response’ or a ‘positive
reponse’ from the RRT, this encouraged staff to escalate in subsequent events.(193, 197, 200, 202,
203) The RRT were seen as ‘decision-makers’ and ‘doers’ in emergency situations and these
were both facilitators of escalation.(193, 197, 202) The RRT were viewed as collaborative but also
of facilitating collaboration between staff, and this was another facilitator of escalation
within three studies.(98, 199, 202)
In addition to how the RRT behaved, they were also described as being ‘experts’(98, 197, 198, 203)
with specific specialised skills and expertise necessary when a patient deteriorated.
They were also seen as providing ‘additional support’(98, 191, 194, 197-200, 202) in emergency
situations and this was a source of comfort reported by participants.
Professional Boundaries
Professional boundaries as a key theme was included in nine studies.(98, 190-194, 198, 200, 201) This
included the sub-themes of a ‘Licence to escalate’ and a ‘Bridge across boundaries’.
Licence to escalate was where the staff perceived the EWS as tool to enable escalation
across hierarchical and occupational boundaries and was apparent in nine studies,(98, 190-194,
198, 200, 201) as exemplified from the following extracts: “Across both sites the score provided
staff with the licence to escalate care across hierarchical and occupational boundaries”.(194)
"The nurses actually have something they can do about it versus just kind of watching the
patient flounder (hospitalist)".(198) The EWS was used as tool by nurses to establish a
legitimate reason for escalating care to more senior staff without having to seek permission.
This licence created a ‘Bridge across boundaries’. This refers to the view that the EWS
facilitates cross-profession communication and teamwork and is a workaround and means
of getting something done, i.e. getting a patient seen to, and was referenced in four studies.

Clinical & Cost-effectiveness of the National Early Warning System (NEWS): Systematic Review Update
Health Research Board – Collaboration in Ireland for Clinical Effectiveness Reviews
340
(191, 193, 194, 198) "We used to actually use them as a way of getting round a resident or whoever
who really wasn't doing what you know you needed for your patient (Junior nursing, site
2)".(191)
Clinical Experience
Clinical experience was a key theme within 12 studies and included sub-themes of ‘Clinical
confidence’ (to recognise deterioration, confidence in own ability and skills),
‘Empowerment/validation’ and ‘Clinical judgement’.(98, 137, 185, 190-194, 197-201, 203)
Where a staff member had clinical confidence in their own skills and ability and were able to
recognise deterioration, this was a facilitator of escalation. Staff were confident enough to
activate the RRT.(137, 185, 190, 197, 200)
Staff also felt ‘empowered’ by the EWS and the EWS ‘validated’ their reasons for escalation
and calling for help from the RRT and seniors.(185, 190, 191, 193, 194, 198, 199, 201)
‘Clinical judgement’ was a facilitator of escalation in seven studies where staff referred to
the importance of using clinical judgement when a patient deteriorates and not relying on a
score or system alone.(190, 191, 193, 197, 200, 201, 203)
Early Warning System Parameters
The fifth key theme of EWS Parameters included the subtheme of ‘Triage mechanism’ and a
‘Tool for detecting deterioration’.(137, 185, 192, 194, 197, 198, 201, 203)
Staff described using the EWS as a mechanism for triage, to get a patient a higher level of
care and to ensure patient safety. In addition, the EWS was seen as valuable tool for picking
up patient deterioration by staff and optimising patient outcomes. Doctors described using
the system to gauge the severity of a patient's condition for triaging: "When I'm contacted
to review a patient, I use 'NEWS' to prioritise the urgency in which they need to be reviewed
(NCHD 2)".(201)

Clinical & Cost-effectiveness of the National Early Warning System (NEWS): Systematic Review Update
Health Research Board – Collaboration in Ireland for Clinical Effectiveness Reviews
341
Just as the themes of ‘governance’, ‘professional boundaries’, ‘RRT Response’, ‘Clinical
Experience’, and ‘Early Warning System Parameters’ were inter-related in the generation of
barriers to escalation of care, the themes are inter-related in creating facilitators to the
escalation of care. For example, clear governance in terms of policies or protocols, and
knowledge of policies or protocols by all staff decreases the potential for conflicts in
professional boundaries and increases role clarity. This in turn may create a more
collaborative team based approach that provides reassurance and confidence as opposed to
engendering a level of ‘fear’ in junior staff, particularly those with less clinical confidence. All
of which combines to create a climate within which activation of the RRT is more likely to
happen.

Clinical & Cost-effectiveness of the National Early Warning System (NEWS): Systematic Review Update
Health Research Board – Collaboration in Ireland for Clinical Effectiveness Reviews
342
Table 12.3 Key themes of the facilitators of escalation amongst healthcare professionals
Key Themes (Finding)
Sub-themes and references Characteristics of studies from which sub-themes were derived: Type of participant and setting (Reference)
Illustrative quotations (Italicised text= primary quote from a study participant; non-italicised text=secondary quote from study authors)
Governance Accountability(193-195, 201) Senior resident surgeons, surgical postgraduates year 1, intensivists, and critical care outreach team members from 3 UK hospitals;(193) Year 1 interns, Senior NCHDs and nurses in 1 Irish hospital;(201) HCAs, nurses, physicians, critical care staff and managers in 2 UK hospitals(194, 195)
"If you don't follow the NEWS and something goes wrong then the blame rests on you and you've got nothing to back you up…wheras, once you call you're protected"(201)
Standardisation -Clear policies or protocols(185, 190, 194, 195, 197, 200,
201) -Knowledge of protocols/policies(194, 195, 201)
Nurses in 1 US hospital;(197) Mainly doctors and nurses in 8 Australian hospitals;(190) Nurses in 1 UK hospital;(185) Year 1 interns, Senior NCHDs and nurses in 1 Irish hospital;(201) HCAs, nurses, physicians, critical care staff and managers in 2 UK hospitals(194, 195)
"I will continue to use it as I'm currently using it unless the protocol changes as it's a requirement of my job and part of the hospital's policy (Nurse 8)".(201) Both the escalation protocol and the CCOT at Westward promoted uniformity and standardisation with regards to response to the acutely ill patient.(194) “As soon as we get a high score we’re supposed to go straight to the staff nurse and inform them that this patient's observations have been outside normal. And then the staff nurse will inform the doctor and say, ‘this patient's blood pressure is below normal, is x, y, z, so if you could come and review this patient.”(195)
Resources -Sufficient staffing/reduced workload(98, 193, 197, 201) -Good communication(137,
185, 193, 194, 197, 201)
Nurses in 1 US hospital;(197)Nurses and doctors in 1 UK hospital;(98) HCPs from 3 UK hospitals;(193) HCPs from 1 Irish hospital;(201) HCPs from 2 UK hospitals;(194) Nurses from 1 UK hospital;(185) Nurses from 1 US hospital.(137)
"There is now a single resident who covers the ward for the week and twice daily attending ward rounds. I think this has made things better for juniors because they have a single point of contact who is not going to be off site or in theatre" (Surgeon)(193) The team used SBAR, the communication technique approved by the facility…. Standardised language helped participants provide information quickly and accurately.(197)

Clinical & Cost-effectiveness of the National Early Warning System (NEWS): Systematic Review Update
Health Research Board – Collaboration in Ireland for Clinical Effectiveness Reviews
343
Table 12.3 Key themes of the facilitators of escalation amongst healthcare professionals
Key Themes (Finding)
Sub-themes and references Characteristics of studies from which sub-themes were derived: Type of participant and setting (Reference)
Illustrative quotations (Italicised text= primary quote from a study participant; non-italicised text=secondary quote from study authors)
RRT Response RRT Response
RRT Behaviours - Professionalism/Positive responses(193, 197, 200, 202, 203) -Decision-makers/Doers (193,
197, 202) -Collaborative(98, 199, 202)
Nurses in 1 US hospital;(197) HCPs in 3 UK hospitals;(193) Nurses in 1 Norwegian hospital;(202) Nurses and doctors in 1 UK hospital;(98) Nurses in 1 US hospital;(199) HCPs in 1 US hospital;(198) Doctors and nurses in 4 Australian hospitals;(191) HCPs in 2 UK hospitals(194) Nurses in 1 Norwegian hospital;(202) Nurses and doctors in 1 UK hospital;(98) Nurses in 1 US hospital(199)
The approachable style and non-critical attitude of the MICN and their prompt responses in giving advice over the phone or reviewing the situation in person were recurrent comments throughout the interviews.(202) "ICU nurses' expertise is reassuring. They evaluate the situation. They figure out what is going on and decide what to do".(197) ‘‘The MICN did not ‘take over’ the situation, he only confirmed and asked for collaboration by using skills in communication and support and gave us treatment suggestions. We learned and listened; hopefully I can use this knowledge in other situations too’’.(202)
Expertise (Skilled)(98, 197, 198,
203) Nurses and doctors in 1 UK hospital;(98) Nurses in 1 US hospital;(197) HCPs in 1 US hospital(198)
Nurses had a sense of security and of empowerment generated by knowing skilled backup was available immediately through a single phone call.(198)
Additional Support(98, 191, 194,
197-200, 202) Nurses and doctors in 1 UK hospital;(98) Doctors and nurses in 4 Australian hospitals;(191) Nurses in 1 Norwegian hospital;(202) HCPs in 2 UK hospitals;(194) Nurses in 1 US hospital;(197) HCPs in 1 US hospital;(198) Nurses in 1 US hospital(199)
‘. . .an extra pair of eyes and ears for patients who are at risk of deteriorating or are in the process of deteriorating; and really able to bring critical care experience to a ward environment, to support the nurses and doctors on the ward to care for deteriorating patients on the ward. It’s a very supportive role, bringing that extra degree of knowledge and skills that we may not have on the ward to care for the patient.’ (R7, Nurse)(98)

Clinical & Cost-effectiveness of the National Early Warning System (NEWS): Systematic Review Update
Health Research Board – Collaboration in Ireland for Clinical Effectiveness Reviews
344
Table 12.3 Key themes of the facilitators of escalation amongst healthcare professionals [CONTINUED]
Key Themes (Finding)
Sub-themes and references Characteristics of studies from which sub-themes were derived: Type of participant, Setting (no of references)
Illustrative quotations (Italicised text= primary quote from a study participant; non-italicised text=secondary quote from study authors)
Professional Boundaries
Licence to escalate (Autonomy)(98, 190-194, 198, 200, 201)
Nurses and doctors in 1 UK hospital;(98) Mainly doctors and nurses in 8 Australian hospitals;(190) Doctors and nurses in 4 Australian hospitals;(191) Nurses in 1 Australian hospital;(192) Year 1 interns, Senior NCHDs and nurses in 1 Irish hospital;(201) HCPs in 3 UK hospitals;(193) HCPs in 2 UK hospitals;(194) HCPs in 1 US hospital(198)
Across both sites the score provided staff with the licence to escalate care across hierarchical and occupational boundaries.(194) "The nurses actually have something they can do about it versus just kind of watching the patient flounder (hospitalist)"(198)
Bridge Across Boundaries (Facilitates cross-profession communication and teamwork, workaround)(191, 193, 194, 198)
Doctors and nurses in 4 Australian hospitals;(191) HCPs in 3 UK hospitals;(193) HCPs in 2 UK hospitals;(194) HCPs in 1 US hospital(198)
"We used to actually use them as a way of getting round a resident or whoever who really wasn't doing what you know you needed for your patient (Junior nursing, site 2)"(191) The EWS helped with escalation of care across boundaries: "The score is useful….if you're handing over the phone in the middle of the night to someone you've never met before….they don't know your judgement and your experience, so it's kind of a physical....this is quite clear" (Nurse, 5, Westward)(194)
Clinical Experience Clinical
Clinical Confidence(137, 185, 190, 197,
200) -To recognise deterioration -Confidence in own ability and skills
Nurses in 1 US hospital;(197) Nurses and doctors in 8 Australian hospitals;(190) Nurses in 1 UK hospital;(185) Nurses in 1 US hospital(137)
"I'd like to think that it hasn't made any difference to me being able to detect my patient deteriorating (FG I1)" and "I went to nursing school for three years - I know when it is time to ring the doctor" (FG A4)(190) “I never hesitate to call an RRS because I’m afraid I’ll be criticized or made to feel like I couldn’t handle a situation.” (137)

Clinical & Cost-effectiveness of the National Early Warning System (NEWS): Systematic Review Update
Health Research Board – Collaboration in Ireland for Clinical Effectiveness Reviews
345
Table 12.3 Key themes of the facilitators of escalation amongst healthcare professionals [CONTINUED]
Key Themes (Finding)
Sub-themes and references Characteristics of studies from which sub-themes were derived: Type of participant, Setting (no of references)
Illustrative quotations (Italicised text= primary quote from a study participant; non-italicised text=secondary quote from study authors)
Clinical Experience (continued)
Empowerment/validation(185,
190, 191, 193, 194, 198, 199, 201) Mainly doctors and nurses in 8 Australian hospitals;(190) Doctors and nurses in 4 Australian hospitals;(191) Year 1 interns, Senior NCHDs and nurses in 1 Irish hospital;(201) HCPs in 3 UK hospitals;(193) HCPs in 2 UK hospitals;(194) Nurses in 1 UK hospital;(185) HCPs in 1 US hospital;(198) Nurses in 1 US hospital(199)
Availability of the RRT empowered nurses who were able to obtain additional help without having to request permission. "I don't usually hesitate to call. I notify the team of any changes, and if I feel like I need additional nursing support or if I need respiratory support right that minute, I will call an RRT".(198)
Clinical judgement(190, 191, 193,
197, 200, 201, 203) Mainly doctors and nurses in 8 Australian hospitals;(190) Doctors and nurses in 4 Australian hospitals;(191) Year 1 interns, Senior NCHDs and nurses in 1 Irish hospital;(201) HCPs in 3 UK hospitals;(193) Nurses in 1 US hospital(197) Nurses in 1 Australian hospital;(192) Nurses and doctors in 1 UK hospital(203)
Participants referred to the importance of using clinical judgement in tandem with the RRS criteria to guide their assessment and decision-making processes when deliberating whether or not to activate the RRS.(191) “She just had this sweaty clammy look and just going from previous experience again, it was like there is something really not right here.” (R1, Nurse)(98)
EWS Parameters Triage mechanism/Tool for detecting deterioration(137, 185,
192, 194, 197, 198, 201, 203)
Nurses in 1 US hospital;(137) Nurses in 1 Australian hospital;(192) Year 1 interns, Senior NCHDs and nurses in 1 Irish hospital;(201) HCPs in 2 UK hospitals;(194) Nurses in 1 UK hospital;(185) HCPs in 1 US hospital;(198) Nurses in 1 US hospital(197)
Doctors described using the system to gauge the severity of a patient's condition for triaging: "When I'm contacted to review a patient, I use 'NEWS' to prioritise the urgency in which they need to be reviewed (NCHD 2)"(201) All staff valued the training they had received and reported that the T&T helped identify patient deterioration earlier: “We now use it on every single patient that we have on the ward and obviously they all get a score at the end of it, so I think it just rings more alarm bells if you like if a patient is unwell or is deteriorating, whereas just recording a patient’s observations, you know, you might miss something (15) It does highlight patients that are actually deteriorating quicker than you would”.(185)
Key: CCOT: Critical care outreach team; EWS: Early warning system; HCA: Healthcare assistant; HCP: Healthcare Professional; MICN: Mobile intensive care network; NCHD: Non consultant hospital doctor; NEWS: National Early warning System; RRT/S: Rapid response team/system; SBAR: Situation, Background, Assessment, Response; UK: United Kingdom; US: United States

Clinical & Cost-effectiveness of the National Early Warning System (NEWS): Systematic Review Update
Health Research Board – Collaboration in Ireland for Clinical Effectiveness Reviews
346
12.6 Quality appraisal
The Critical Appraisal Skills Programme (CASP) tool for qualitative studies was used to
appraise the quality of the 18 individual studies by two review team members
independently and the overall judgement for each of the 10 CASP questions was agreed by
consensus.(30)
All 18 studies reported a clear statement of the aims. All 18 studies were judged to have
used an appropriate qualitative methodology [e.g. focus groups or interviews], and were
judged to have employed appropriate data collection methods (e.g. interviews or focus
groups or observation techniques or document review). All studies had a clear statement of
the findings and the research was deemed valuable.
Seven out the 18 studies were judged to have a research design appropriate to the study
aims,(98, 191, 192, 195, 200, 201, 204) while in 11 of 18 studies there was insufficient information on
the rationale for the chosen qualitative methodology.(137, 185, 190, 193, 194, 196-199, 202, 203) Thirteen
out of the 18 studies were judged to have a recruitment strategy appropriate to the study
aims (e.g. convenience sampling or purposeful sampling),(98, 185, 190-195, 197, 198, 200, 202, 203) in
four studies there was insufficient information provided.(137, 196, 199, 204) In one study the
recruitment strategy was deemed inappropriate (the study authors used ‘their judgement’
and snowball techniques).(201) Six out 18 studies considered the researcher and participant
relationship within the study,(137, 192, 194, 196, 199, 203) while 11 out the 18 studies did not
consider the researcher-participant relationship and the potential for bias this may
introduce.(98, 185, 190, 191, 193, 195, 198, 200-202, 204) In one study insufficient information was
provided.(197) Seventeen out of the 18 studies reported having ethical approval while in one
study it was unclear.(137) Fifteen out of 18 studies were judged to have rigorous data analysis
(e.g. inductively and deductively coded, content analysis),(98, 137, 185, 191, 192, 194-196, 198-201, 203, 204)
while in two studies there was insufficient (the authors mentioned triangulation but
provided no other details and in the second study no coding framework was provided).(193,

Clinical & Cost-effectiveness of the National Early Warning System (NEWS): Systematic Review Update
Health Research Board – Collaboration in Ireland for Clinical Effectiveness Reviews
347
197) In one study, the analysis was deemed insufficient as there were missing observations
which were not reported.(202)

Clinical & Cost-effectiveness of the National Early Warning System (NEWS): Systematic Review Update
Health Research Board – Collaboration in Ireland for Clinical Effectiveness Reviews
348
Table 12.4 Methodological quality of the included qualitative studies
Study
CASP Question
Clear statement of the aims?
Qualitative methodology appropriate?
Research design appropriate to study aims?
Recruitment strategy appropriate to study aims?
Data collection appropriate?
Researcher & participant relationship considered?
Ethical issues considered?
Rigorous data analysis?
Clear statement of findings?
Is the research valuable?
Astroth (2013)(202)
Yes Yes Can’t tell Yes Yes Can’t tell Yes Can’t tell Yes Yes
Benin (2012)(203)
Yes Yes Can’t tell Yes Yes No Yes Yes Yes Yes
Braaten (2015)(205)
Yes Yes Yes Yes Yes No Yes Yes Yes Yes
Chua (2013)(209)
Yes Yes Yes Can’t tell Yes No Yes Yes Yes Yes
Cherry (2015)(201)
Yes Yes Can’t tell Can’t tell Yes Yes Yes Yes Yes Yes
Elliott (2015)(195)
Yes Yes Can’t tell Yes Yes No Yes Yes Yes Yes
Johnston (2014)(198)
Yes Yes Can’t tell Yes Yes No Yes Can’t tell Yes Yes
Kitto (2015)(196)
Yes Yes Yes Yes Yes No Yes Yes Yes Yes
Lydon (2016)(206)
Yes Yes Yes No Yes No Yes Yes Yes Yes
Mackintosh (2012)(199)
Yes Yes Can’t tell Yes Yes Yes Yes Yes Yes Yes
Mackintosh (2014)(200)
Yes Yes Yes Yes Yes No Yes Yes Yes Yes
Massey (2014)(197)
Yes Yes Yes Yes Yes Yes Yes Yes Yes Yes
McDonnell (2013)(184)
Yes Yes Can’t tell Yes Yes No Yes Yes Yes Yes
Pattison (2012)(101)
Yes Yes Yes Yes Yes No Yes Yes Yes Yes
Petersen (2017)(208)
Yes Yes Can’t tell Yes Yes Yes Yes Yes Yes Yes
Stafseth (2016)(207)
Yes Yes Can’t tell Yes Yes No Yes No Yes Yes
Stewart (2014)(60)
Yes Yes Can’t tell Can’t tell Yes Yes Can’t tell Yes Yes Yes
Williams (2011)(204)
Yes Yes Can’t tell Can’t tell Yes Yes Yes Yes Yes Yes
Key: CASP: Critical analysis skills programme

Clinical & Cost-effectiveness of the National Early Warning System (NEWS): Systematic Review Update
Health Research Board – Collaboration in Ireland for Clinical Effectiveness Reviews
349
12.7 Certainty of the evidence
For the 18 included qualitative studies, the GRADE-CERQual (Confidence in the Evidence
from Reviews of Qualitative research) approach was used to summarise confidence in the
evidence.(37) Four components contribute to an assessment of confidence in the evidence
for each key finding (in this review, the key findings are the five key themes generated from
the thematic analysis): methodological limitations, relevance, coherence, and adequacy of
data. The CERQual components reflect similar concerns to the elements included in the
GRADE approach for assessing the certainty of evidence on the effectiveness of
interventions in previous chapters, however, CERQual considers these issues from a
qualitative perspective. The confidence in the evidence for each key finding (theme) was
graded as high (it is highly likely that the review finding is a reasonable representation of the
phenomenon of interest), moderate (it is likely that the review finding is a reasonable
representation of the phenomenon of interest), low (it is possible that the review finding is
a reasonable representation of the phenomenon of interest), or very low (it is not clear
whether the review finding is a reasonable representation of the phenomenon of interest).
The certainty of the evidence for the key finding “Governance” was moderate in the 16
studies which contributed. The finding was graded as moderate confidence because of
moderate concerns regarding methodological limitations, and minor concerns for both
coherence and adequacy. The certainty of the evidence for the key finding “RRT Response”
was moderate in the 12 studies which contributed. The finding was graded as moderate
confidence because of moderate concerns regarding methodological limitations, and minor
concerns for both coherence and adequacy. The certainty of the evidence for the key finding
“Professional Boundaries” was judged to be high in the 12 studies which contributed. The
finding was graded as high confidence because of moderate concerns regarding
methodological limitations (particularly in relation to lack of reflexivity) and minor concerns
regarding adequacy (rich descriptions of the data were largely were not always provided).
These concerns in the two domains were not strong enough to justify downgrading the

Clinical & Cost-effectiveness of the National Early Warning System (NEWS): Systematic Review Update
Health Research Board – Collaboration in Ireland for Clinical Effectiveness Reviews
350
confidence in the finding. The certainty of the evidence for the key finding “Clinical
Experience” was deemed to be high also in the 14 studies which contributed. The finding
was graded as high confidence because of moderate concerns regarding methodological
limitations (particularly in relation to lack of reflexivity) and minor concerns regarding
adequacy (rich descriptions of the data were largely were not always provided). As
previously, these concerns were not strong enough to justify downgrading the confidence in
the finding. The certainty of the evidence for the key finding “EWS Parameters” was judged
to be moderate in the 11 studies which contributed. The finding was graded as moderate
confidence because of moderate concerns regarding methodological limitations and
coherence and minor concerns regarding adequacy.
Therefore, the overall certainty of the evidence was graded as ‘moderate’. These
assessments are summarised in the summary of qualitative findings (SOQF) table (Table
12.5) and in more detail in the evidence profile (Chapter 14, Section 14.7, Appendix 7).
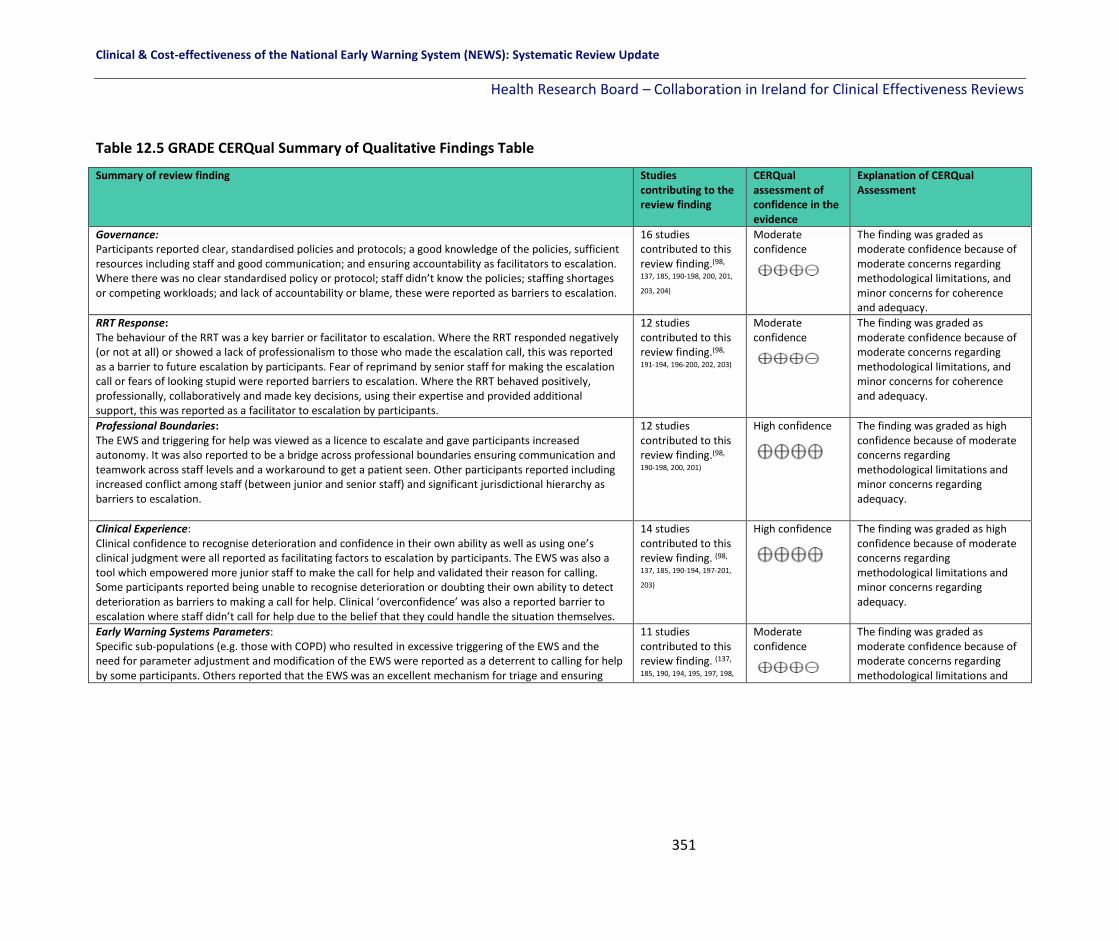
Clinical & Cost-effectiveness of the National Early Warning System (NEWS): Systematic Review Update
Health Research Board – Collaboration in Ireland for Clinical Effectiveness Reviews
351
Table 12.5 GRADE CERQual Summary of Qualitative Findings Table
Summary of review finding Studies contributing to the review finding
CERQual assessment of confidence in the evidence
Explanation of CERQual Assessment
Governance: Participants reported clear, standardised policies and protocols; a good knowledge of the policies, sufficient resources including staff and good communication; and ensuring accountability as facilitators to escalation. Where there was no clear standardised policy or protocol; staff didn’t know the policies; staffing shortages or competing workloads; and lack of accountability or blame, these were reported as barriers to escalation.
16 studies contributed to this review finding.(98,
137, 185, 190-198, 200, 201,
203, 204)
Moderate confidence
The finding was graded as moderate confidence because of moderate concerns regarding methodological limitations, and minor concerns for coherence and adequacy.
RRT Response: The behaviour of the RRT was a key barrier or facilitator to escalation. Where the RRT responded negatively (or not at all) or showed a lack of professionalism to those who made the escalation call, this was reported as a barrier to future escalation by participants. Fear of reprimand by senior staff for making the escalation call or fears of looking stupid were reported barriers to escalation. Where the RRT behaved positively, professionally, collaboratively and made key decisions, using their expertise and provided additional support, this was reported as a facilitator to escalation by participants.
12 studies contributed to this review finding.(98,
191-194, 196-200, 202, 203)
Moderate confidence
The finding was graded as moderate confidence because of moderate concerns regarding methodological limitations, and minor concerns for coherence and adequacy.
Professional Boundaries: The EWS and triggering for help was viewed as a licence to escalate and gave participants increased autonomy. It was also reported to be a bridge across professional boundaries ensuring communication and teamwork across staff levels and a workaround to get a patient seen. Other participants reported including increased conflict among staff (between junior and senior staff) and significant jurisdictional hierarchy as barriers to escalation.
12 studies contributed to this review finding.(98,
190-198, 200, 201)
High confidence
The finding was graded as high confidence because of moderate concerns regarding methodological limitations and minor concerns regarding adequacy.
Clinical Experience: Clinical confidence to recognise deterioration and confidence in their own ability as well as using one’s clinical judgment were all reported as facilitating factors to escalation by participants. The EWS was also a tool which empowered more junior staff to make the call for help and validated their reason for calling. Some participants reported being unable to recognise deterioration or doubting their own ability to detect deterioration as barriers to making a call for help. Clinical ‘overconfidence’ was also a reported barrier to escalation where staff didn’t call for help due to the belief that they could handle the situation themselves.
14 studies contributed to this review finding. (98,
137, 185, 190-194, 197-201,
203)
High confidence
The finding was graded as high confidence because of moderate concerns regarding methodological limitations and minor concerns regarding adequacy.
Early Warning Systems Parameters: Specific sub-populations (e.g. those with COPD) who resulted in excessive triggering of the EWS and the need for parameter adjustment and modification of the EWS were reported as a deterrent to calling for help by some participants. Others reported that the EWS was an excellent mechanism for triage and ensuring
11 studies contributed to this review finding. (137,
185, 190, 194, 195, 197, 198,
Moderate confidence
The finding was graded as moderate confidence because of moderate concerns regarding methodological limitations and

Clinical & Cost-effectiveness of the National Early Warning System (NEWS): Systematic Review Update
Health Research Board – Collaboration in Ireland for Clinical Effectiveness Reviews
352
patients received the care they needed as well as a valued tool for detecting deterioration 201, 203, 204, 207) coherence and minor concerns regarding adequacy.
Key: HCP: Healthcare Professional; RRT: Rapid Response Team; RRS: Rapid Response System; EWS: Early Warning System; COPD: Chronic Obstructive Pulmonary Disease.
High confidence: It is highly likely that the review finding is a reasonable representation of the phenomenon of interest
Moderate confidence: It is likely that the review finding is a reasonable representation of the phenomenon of interest
Low confidence: It is possible that the review finding is a reasonable representation of the phenomenon of interest
Very low confidence: It is not clear whether the review finding is a reasonable representation of the phenomenon of interest

Clinical & Cost-effectiveness of the National Early Warning System (NEWS): Systematic Review Update
Health Research Board – Collaboration in Ireland for Clinical Effectiveness Reviews
353
12.8 Discussion
The aim of this chapter of the review was to explore the qualitative literature to identify the
barriers and facilitators to escalation among healthcare professionals (HCPs) and to try and
answer the question: “why do HCPs fail to call for help, to activate the emergency response
system when a patient is rapidly deteriorating and why do they not follow the protocol as
outlined in the NEWS?”
The systematic search identified 18 qualitative studies from various countries, all conducted
in hospital settings and including nurses only (ten studies), nurses and doctors only (three
studies) or a mix of HCPs and staff (including administrators, management, allied health
professionals, etc.), (six studies). The studies measured participant’s beliefs and opinions on
various EWSs or rapid response systems using mainly face-to-face interviews or focus group
techniques and the total sample size was 599.
A comprehensive thematic analysis resulted in the generation of five key themes as barriers
and facilitators to escalation: Governance, RRT Response, Professional Boundaries, Clinical
Experience and Early Warning Systems. Within these five themes, 22 sub-themes with
multiple interdependencies were identified as presented in Figure 12.1. The certainty of the
evidence using the GRADE CERQual approach was judged to be ‘moderate’ for governance,
RRT response and Early Warning Systems and ‘high’ for professional boundaries and clinical
experience, resulting in a judgement of ‘moderate’ confidence in the evidence overall.
The findings on the role of the emergency response system as a bridge between the ICU or
critical care and the ward is an important one. How the emergency response system is
perceived by different staff (some valued it as additional support and expertise, while others
felt the emergency response system was intruding on ‘their’ care of ‘their’ patient), others
reported that the emergency response system led to conflict between staff (senior staff
reprimanded junior staff for ‘going above their head’ and escalating). Lack of confidence
among staff to detect and recognise deterioration was another element and barrier to

Clinical & Cost-effectiveness of the National Early Warning System (NEWS): Systematic Review Update
Health Research Board – Collaboration in Ireland for Clinical Effectiveness Reviews
354
escalation. Lack of clear protocols and policy as well as regular standardised education
(which for the most part did not require clinicians to attend) was cited as a barrier to
escalation as it led to confusion and uncertainty. Where clear policies and protocols existed
as well as accountability, this was seen as a facilitator to escalation in different
organisations. In addition, when the RRT responded positively and professionally, this
encourages staff to escalate for help in the future.
12.9 Conclusion
Delays in providing care to deteriorating hospitalised patients may increase the likelihood of
adverse events including cardiac arrest and death. Emergency response systems were
implemented to improve the quality and safety of hospital care by providing a group of
clinical experts from various backgrounds the tools to respond quickly when a patient is
escalated to a higher level of care by a member of staff on the ward. This chapter of the
review focusses on why HCPs fail to escalate as per the escalation protocol, and aimed to
identify the barriers and facilitators to escalation from a thematic analysis of the literature.
The five key themes (Governance, RRT Response, Professional Boundaries, Clinical
Experience and Early Warning Systems) and the sub-themes within provide insights to
inform policy-makers and HCPs as well as hospital management about emergency response
system related issues in practice and the need to incorporate changes as a result of these
findings to improve patient care.

Clinical & Cost-effectiveness of the National Early Warning System (NEWS): Systematic Review Update
Health Research Board – Collaboration in Ireland for Clinical Effectiveness Reviews
355
13 Overall Review Discussion
13.1 Discussion
A large number of EWSs have been developed internationally and are currently in use in
adult (non-pregnant) populations to assist in the detection of physiological deterioration at
the bedside. The review included 154 studies with 47 different named EWSs, which
investigated the clinical and cost-effectiveness of EWSs on patient outcomes, the predictive
performance of EWSs as well as qualitative studies on why health care professionals fail to
escalate.
While the certainty of the evidence was low overall positive trends can be seen in relation to
the effectiveness of EWSs. For example, of the studies investigating the effectiveness of the
afferent limb (recognition and escalation of care) of EWSs on mortality over half found a
reduction in mortality as a result of the use of an EWS. Three of seven studies showed a
significant reduction in cardiac arrest rates following the introduction of an EWS. Fourteen
of 25 studies which investigated the effectiveness of emergency response systems
(ERS)(efferent limb) on mortality showed a significant decrease in mortality after
introduction of an ERS. Likewise, in those studies which examined the effectiveness of ERS
on cardiac arrest rates, two thirds showed a significant reduction in cardiac arrests following
ERS introduction.
Studies which explored the effectiveness of EWS educational interventions found that
healthcare professionals’ knowledge, clinical performance and self-confidence in
recognising and managing a deteriorating patient improved at least in the short term.
The review found that there has been no full economic evaluation of EWSs in adult patients
in acute hospital settings. However, the three studies which were identified which
investigated the cost-effectiveness of elements of EWSs suggest that these systems have the
potential to improve patient outcomes including hospital and ICU LOS and thus reduce
health care costs.
Clinical & Cost-effectiveness of the National Early Warning System (NEWS): Systematic Review Update
Health Research Board – Collaboration in Ireland for Clinical Effectiveness Reviews
356
This updated review contained two new research questions the first focusing on the
effectiveness of modified EWSs compared with NEWS in specific adult sub-populations, and
the second addressing why health care professionals fail to escalate care as per the NEWS
escalation protocol.
The sensitivity and specificity of NEWS in specific sub-populations, in particular in patients
with chronic respiratory conditions, is a known problem. The review identified four studies
which compared NEWS with a modified EWS for use in respiratory patient cohorts. This
limited research shows that these modified EWSs (CREWS, S-NEWS, CROS and NEWS2) are
similar to, but not superior to NEWS in predicting mortality, cardiac arrest, LOS or
unplanned admissions to ICU. Further research is warranted to validate the findings from
these studies before the widespread adoption of modified EWSs in specific sub-populations.
Five themes were identified across the 18 studies which explored why healthcare
professionals fail to escalate care in accordance with EWS escalation protocols. Barriers and
facilitators to escalation of care were identified in terms of governance, rapid response
team (RRT) response, professional boundaries, clinical experience and EWS parameters.
Facilitators to escalation of care included standardisation of policies and protocols to
provide clarity of action, for example who to call and when, and the availability of resources
for the provision of an appropriate response to escalation. A positive response from RRT
members encouraged escalation where RRT members were seen as experts who provided
additional clinical support to frontline staff when managing deteriorating patients. The EWS
was also seen as providing nurses with ‘a license’ to escalate care and thus operated as a
kind of ‘bridge across professional boundaries’ through which professional and
organisational hierarchies could be negotiated. Barriers were in the main the converse of
the facilitators identified and while each included theme described its own barrier, taken
together barriers within the five themes had the potential to create an environment in
which escalation of care may occur too late or not at all.

Clinical & Cost-effectiveness of the National Early Warning System (NEWS): Systematic Review Update
Health Research Board – Collaboration in Ireland for Clinical Effectiveness Reviews
357
Throughout the review questions there was considerable heterogeneity in included EWSs.
For instance, with the rapid response systems there was considerable variation in the team
composition, the parameters to activate the emergency response team and the operating
times. This heterogeneity was found across all domains of the EWSs. The parameters
included within EWSs overlapped considerably, with all but one having at least one of the
parameters contained within the NEWS. The majority of the 79 studies, where it was
reported, included electronic rather than paper based EWSs. The majority of the 123 studies
did not report how often parameters were measured (n=83) which can effect performance
of an EWS, and where they did, it varied from study to study. The variation across EWSs
makes it difficult to compare the systems. While nearly all the included studies suggested
that patient outcomes either remained the same or were improved, this must be
interpreted in the context of the evidence being of very low certainty due to poor study
designs and inadequate sample sizes for some of the rarer outcome events.
This review included evidence from a range of different study designs (including RCTs,
interrupted times series, observation cohorts and case-control studies). There is no
suggestion of differing results between those studies with higher quality designs compared
to those with poorer quality designs, however the limited number of RCTs included must be
acknowledged (eleven in total, with seven of these focusing on educational interventions).
The methodological quality of the studies overall across the review questions was poor and
there was a high risk of bias, owing to significant heterogeneity in the interventions and
populations studied. There was moderate certainty in the evidence which addressed the
qualitative question dealing with contextual factors affecting EWS uptake. There was very
low certainty in the evidence overall across the review’s primary outcomes.
13.2 Strengths and limitations of this systematic review
This systematic review was conducted according to the PRISMA reporting guidelines. It is
based on a protocol which was registered on PROSPERO in advance of conducting the
review to ensure transparency and minimise bias in the review process. Specific review

Clinical & Cost-effectiveness of the National Early Warning System (NEWS): Systematic Review Update
Health Research Board – Collaboration in Ireland for Clinical Effectiveness Reviews
358
questions were formulated based on the PICO approach and a priori-defined primary and
secondary outcomes. In addition, an extensive search of the published and unpublished
(grey literature) was conducted using a detailed search strategy and according to the
principles of Boolean logic. Eleven electronic databases, five grey literature databases and
over 30 websites relevant to the review topic and clinical guidelines were searched. In
addition, two reviewers were involved in all stages of the review (screening, data extraction,
quality appraisal and assessing the certainty of the evidence using the GRADE approach),
reducing bias.
However, the review has some limitations which include the eligibility of English language
only studies and the application of a date restriction (given this was an update of a previous
systematic review). As with any systematic review, it is limited by the quality of the studies
included which were poor overall leading the review team to judge the certainty of the
evidence as very low overall for the review’s primary outcomes. Minor deviations from the
review’s protocol are documented in Appendix 9.
13.3 Recommendations for future research
Further research is warranted of a high methodological quality using standardised
definitions of primary outcomes, assessing similar interventions in similar populations in
order to truly measure the impact of the NEWS. Research in the Irish setting is imperative.
13.4 Conclusion
While studies included in this review demonstrate considerable heterogeneity a clear trend
and direction of findings is evident which supports the use of EWSs for the early recognition,
escalation and response to clinical deterioration in adult patients in the acute hospital
setting. Interest in EWSs has grown exponentially in the four years since the last review of
the literature. Clinical leaders at the frontier of this field are driving the evolution and
refinement of EWSs in an attempt to assist healthcare professionals in strengthening
frontline patient safety in the increasingly complex environment of acute healthcare. EWSs

Clinical & Cost-effectiveness of the National Early Warning System (NEWS): Systematic Review Update
Health Research Board – Collaboration in Ireland for Clinical Effectiveness Reviews
359
are relatively new and emerging systems which, as they develop and evolve are introducing
new challenges. EWSs as a field of research is attracting increasing interest which can only
serve to further develop and strengthen these adjuncts for clinical practice.

Clinical & Cost-effectiveness of the National Early Warning System (NEWS): Systematic Review Update
Health Research Board – Collaboration in Ireland for Clinical Effectiveness Reviews
360
References
1. Health Do. The National Early Warning Score (NCEC National Clinical Gudeline No. 1). 2013. 2. Hegarty J, Drummond FJ, Murphy A, Andrews T, Walshe N, McCarthy B, et al. A systematic
review of the clinical & economic literature and a budget impact analysis of any new guideline recommendations to inform the planned update of National Clinical Guideline No. 1 - National Early Warning Score (NEWS) for the Irish health system. Dublin: National Clinical Effectiveness Committee, Department of Health; 2016.
3. HIQA. Health technology assessment of the use of information technology for early warning and clinical handover systems. 2015.
4. Department of Health. National Clinical Guideline No. 1 The National Early Warning Score for Acute Deterioration in Adult (non-pregnant) Populations. 2013.
5. Simmes F, Schoonhoven L, Mintjes J, Adang E, Van Der Hoeven JG. Financial consequences of the implementation of a rapid response system on a surgical ward. Journal of Evaluation in Clinical Practice. 2014;20(4):342-7.
6. Le Lagadec MD, Dwyer T. Scoping review: The use of early warning systems for the identification of in-hospital patients at risk of deterioration. Australian critical care : official journal of the Confederation of Australian Critical Care Nurses. 2017;30(4):211-8.
7. Considine J, Trotter C, Currey J. Nurses' documentation of physiological observations in three acute care settings. Journal of Clinical Nursing. 2016;25(1/2):134-43.
8. Smith GB, Prytherch DR, Meredith P, Schmidt PE, Featherstone PI. The ability of the National Early Warning Score (NEWS) to discriminate patients at risk of early cardiac arrest, unanticipated intensive care unit admission, and death. Resuscitation. 2013;84(4):465-70.
9. Hogan H, Carver C, Zipfel R, Hutchings A, Welch J, Harrison D, et al. Effectiveness of ways to improve detection and rescue of deteriorating patients. British Journal of Hospital Medicine (17508460). 2017;78(3):150-9.
10. Churpek MM, Edelson DP. Moving Beyond Single-Parameter Early Warning Scores for Rapid Response System Activation. Critical Care Medicine. 2016;44(12):2283-5.
11. Health Do. The Irish Paediatric Early Warning System (PEWS) (NCEC National Clinical Guideline No. 12). 2016;2.
12. Health Do. The Irish Maternity Early Warning System (I-MEWS) (NCEC National Clinical Guideline No. 4). 2014.
13. Eccles SR, Subbe C, Hancock D, Thomson N. CREWS: improving specificity whilst maintaining sensitivity of the National Early Warning Score in patients with chronic hypoxaemia. Resuscitation. 2014;85(1):109-11.
14. Moher D, Liberati A, Tetzlaff J, Altman DG. Preferred reporting items for systematic reviews and meta-analyses: the PRISMA statement. Annals of internal medicine. 2009;151(4):264-9, w64.
15. Tong A, Flemming K, McInnes E, Oliver S, Craig J. Enhancing transparency in reporting the synthesis of qualitative research: ENTREQ. BMC medical research methodology. 2012;12(1):181.
16. Caldwell PH, Bennett T, Mellis C. Easy guide to searching for evidence for the busy clinician. Journal of paediatrics and child health. 2012;48(12):1095-100.

Clinical & Cost-effectiveness of the National Early Warning System (NEWS): Systematic Review Update
Health Research Board – Collaboration in Ireland for Clinical Effectiveness Reviews
361
17. Glanville J, Fleetwood K, Yellowlees A, Kaunelis D, Mensinkai S. Development and Testing of Search Filters to Identify Economic Evaluations in MEDLINE and EMBASE. Ottawa: Canadian Agency for Drugs and Technologies in Health. 2009.
18. Price LC, Lowe D, Hosker H, Anstey K, Pearson M, Roberts CM. UK National COPD Audit 2003: impact of hospital resources and organisation of care on patient outcome following admission for acute COPD exacerbation. Thorax. 2006;61(10):837-42.
19. UNDP. United Nations Development Programme: Human Development Report. 2015. 20. CADTH. Grey Matters - a practical search tool for evidence-based medicine. Canadian
Agency for Drugs and Technologies in Health; 2014. 21. HIQA. Guidelines for the Retrieval and Interpretation of Economic Evaluations of Health
Technologies in Ireland. 2014. 22. Higgins JP, Green S. Cochrane Handbook for Systematic Reviews of Interventions The
Cochrane Collaboration; 2011. Available from: www.handbook.cochrane.org. . 23. Higgins JP, Altman DG, Gøtzsche PC, Jüni P, Moher D, Oxman AD, et al. The Cochrane
Collaboration’s tool for assessing risk of bias in randomised trials. Bmj. 2011;343:d5928. 24. (EPOC). CEPaOoC. Suggested risk of bias criteria for EPOC reviews. EPOC Resources for
review authors. 2017 25. Brouwers MC, Kho ME, Browman GP, Burgers JS, Cluzeau F, Feder G, et al. AGREE II:
advancing guideline development, reporting and evaluation in health care. Canadian Medical Association Journal. 2010;182(18):E839-E42.
26. Wells G, Shea B, O’connell D, Peterson J, Welch V, Losos M, et al. The Newcastle-Ottawa Scale (NOS) for assessing the quality if nonrandomized studies in meta-analyses. 2009. Epub Available from: URL: http://www ohri ca/programs/clinical_epidemiology/oxford htm [cited 2009 Oct 19]. 2013.
27. Evers S, Goossens M, De Vet H, Van Tulder M, Ament A. Criteria list for assessment of methodological quality of economic evaluations: Consensus on Health Economic Criteria. International journal of technology assessment in health care. 2005;21(2):240-5.
28. Caro JJ, Eddy DM, Kan H, Kaltz C, Patel B, Eldessouki R, et al. Questionnaire to assess relevance and credibility of modeling studies for informing health care decision making: an ISPOR-AMCP-NPC Good Practice Task Force report. Value in health. 2014;17(2):174-82.
29. Whiting PF, Rutjes AW, Westwood ME, Mallett S, Deeks JJ, Reitsma JB, et al. QUADAS-2: a revised tool for the quality assessment of diagnostic accuracy studies. Annals of internal medicine. 2011;155(8):529-36.
30. Critical Appraisal Skills Programme Qualitative Checklist [Internet]. 2017 [cited December 11th 2017]. Available from: Available at: http://www.casp-uk.net/checklists
31. Sharmin S, Kypri K, Khanam M, Wadolowski M, Bruno R, Mattick RP. Parental Supply of Alcohol in Childhood and Risky Drinking in Adolescence: Systematic Review and Meta-Analysis. International journal of environmental research and public health. 2017;14(3).
32. HIQA. Health Information and Quality Authority. Guidelines for Evaluating the Clinical Effectiveness of Health Technologies in Ireland. 2014.
33. Cassell C, Symon G. Essential guide to qualitative methods in organizational research: Sage; 2004.
34. Attride-Stirling J. Thematic networks: an analytic tool for qualitative research. Qualitative research. 2001;1(3):385-405.
35. GRADEpro. GRADEpro Guideline Development Tool [Software]. In: McMaster University (developed by Evidence Prime IAfgo, editor. 2015.

Clinical & Cost-effectiveness of the National Early Warning System (NEWS): Systematic Review Update
Health Research Board – Collaboration in Ireland for Clinical Effectiveness Reviews
362
36. Schünemann H BJ, Guyatt G, Oxman A, editors. GRADE handbook for grading quality of evidence and strength of recommendations. The GRADE Working Group, 2013 Available at: guidelinedevelopmentorg/handbook. 2013.
37. Lewin S, Glenton C, Munthe-Kaas H, Carlsen B, Colvin CJ, Gülmezoglu M, et al. Using Qualitative Evidence in Decision Making for Health and Social Interventions: An Approach to Assess Confidence in Findings from Qualitative Evidence Syntheses (GRADE-CERQual). PLOS Medicine. 2015;12(10):e1001895.
38. Kansal A, Havill K. The effects of introduction of new observation charts and calling criteria on call characteristics and outcome of hospitalised patients. Critical care and resuscitation : journal of the Australasian Academy of Critical Care Medicine. 2012;14(1):38-43.
39. Mullany DV, Ziegenfuss M, Goleby MA, Ward HE. Improved hospital mortality with a low MET dose: the importance of a modified early warning score and communication tool.(medical emergency team). Anaesthesia and Intensive Care. 2016;44(6):734.
40. Nguyen MT, Woodman RJ, Hakendorf P, Thompson CH, Faunt J. Can the simple clinical score usefully predict the mortality risk and length of stay for a recently admitted patient? Australian Health Review: A Publication Of The Australian Hospital Association. 2015;39(5):522-7.
41. Boulos D, Shehabi Y, Moghaddas JA, Birrell M, Choy A, Giang V, et al. Predictive value of quick Sepsis-Related Organ Failure Scores following sepsis-related Medical Emergency Team calls: a retrospective cohort study. Anaesthesia & Intensive Care. 2017;45(6):688-94.
42. Christofidis MJ, Hill A, Horswill MS, Watson MO. A human factors approach to observation chart design can trump health professionals' prior chart experience. Resuscitation. 2013;84(5):657-65.
43. Christofidis MJ, Hill A, Horswill MS, Watson MO. Observation charts with overlapping blood pressure and heart rate graphs do not yield the performance advantage that health professionals assume: an experimental study. Journal of advanced nursing. 2014;70(3):610-24.
44. Christofidis MJ, Hill A, Horswill MS, Watson MO. Less is more: the design of early-warning scoring systems affects the speed and accuracy of scoring. Journal of advanced nursing. 2015;71(7):1573-86.
45. Joshi K, Campbell V, Landy M, Anstey CM, Gooch R. The effect of Rapid Response System revision on standard and specific intensive care unit outcomes in a regional hospital. Anaesthesia & Intensive Care. 2017;45(3):369-74.
46. Massey D, Aitken LM, Chaboyer W. The impact of a nurse led rapid response system on adverse, major adverse events and activation of the medical emergency team. Intensive & critical care nursing. 2015;31(2):83-90.
47. Christofidis MJ, Hill A, Horswill MS, Watson MO. Observation chart design features affect the detection of patient deterioration: a systematic experimental evaluation. Journal of advanced nursing. 2015;72(1):158-72.
48. De Meester K, Verspuy M, Monsieurs KG, Van Bogaert P. SBAR improves nurse-physician communication and reduces unexpected death: a pre and post intervention study. Resuscitation. 2013;84(9):1192-6.
49. De Meester K, Das T, Hellemans K, Verbrugghe W, Jorens PG, Verpooten GA, et al. Impact of a standardized nurse observation protocol including MEWS after Intensive Care Unit discharge. Resuscitation. 2013;84(2):184-8.

Clinical & Cost-effectiveness of the National Early Warning System (NEWS): Systematic Review Update
Health Research Board – Collaboration in Ireland for Clinical Effectiveness Reviews
363
50. Gonçales PD, Polessi JA, Bass LM, Santos GP, Yokota PK, Laselva CR, et al. Reduced frequency of cardiopulmonary arrests by rapid response teams. Einstein (São Paulo, Brazil). 2012;10(4):442-8.
51. Hayani O, Al-Beihany A, Zarychanski R, Chou A, Kharaba A, Baxter A, et al. Impact of critical care outreach on hematopoietic stem cell transplant recipients: a cohort study. Bone marrow transplantation. 2011;46(8):1138.
52. Karvellas CJ, De Souza IAO, Gibney RTN, Bagshaw SM. Association between implementation of an intensivist-led medical emergency team and mortality. BMJ Quality and Safety. 2012;21(2):152-9.
53. Scherr K, Wilson DM, Wagner J, Haughian M. Evaluating a new rapid response team NP-led versus intensivist-led comparisons. AACN advanced critical care. 2012;23(1):32-42.
54. Bian Y, Xu F, Lv RJ, Wang JL, Cao LJ, Xue L, et al. An early warning scoring system for the prevention of acute heart failure. International journal of cardiology. 2015;183:111-6.
55. Xiao H, Qi H, Wang J, Li X, Ma S, Diao Z, et al. The identification of risk factors for critically ill patients with acute fever and formulation of activation criteria to alert outpatient clinic doctors. Journal of Evaluation in Clinical Practice. 2012;18(4):721-6.
56. Qin Q, Xia Y, Cao Y. Clinical study of a new Modified Early Warning System scoring system for rapidly evaluating shock in adults. Journal of Critical Care. 2017;37:50-5.
57. Bunkenborg G, Samuelson K, Poulsen I, Ladelund S, Akeson J. Lower incidence of unexpected in-hospital death after interprofessional implementation of a bedside track-and-trigger system. Resuscitation. 2014;85(3):424-30.
58. Liljehult J, Christensen T. Early warning score predicts acute mortality in stroke patients. Acta neurologica Scandinavica. 2016;133(4):261-7.
59. Petersen JA, Antonsen K, Rasmussen LS. Frequency of early warning score assessment and clinical deterioration in hospitalized patients: a randomized trial. Resuscitation [Internet]. 2016; 101:[91-6 pp.]. Available from: http://onlinelibrary.wiley.com/o/cochrane/clcentral/articles/284/CN-01264284/frame.html
60. Pedersen NE, Rasmussen LS, Petersen JA, Gerds TA, Østergaard D, Lippert A. Modifications of the National Early Warning Score for patients with chronic respiratory disease. Acta Anaesthesiologica Scandinavica. 2018;62(2):242-52.
61. Martin G, Dupre A, Mulliez A, Prunel F, Slim K, Pezet D. Validation of a score for the early diagnosis of anastomotic leakage following elective colorectal surgery. Journal of visceral surgery. 2015;152(1):5-10.
62. Jung B, Daurat A, De Jong A, Chanques G, Mahul M, Monnin M, et al. Rapid response team and hospital mortality in hospitalized patients. Intensive Care Medicine. 2016;42(4):494-504.
63. Sabahi M, Fanaei SA, Ziaee SA, Falsafi FS. Efficacy of a rapid response team on reducing the incidence and mortality of unexpected cardiac arrests. Trauma Monthly. 2012;17(2):270-4.
64. Zimlichman E, Szyper-Kravitz M, Shinar Z, Klap T, Levkovich S, Unterman A, et al. Early recognition of acutely deteriorating patients in non-intensive care units: Assessment of an innovative monitoring technology. Journal of Hospital Medicine. 2012;7(8):628-33.
65. Ghanem-Zoubi NO, Vardi M, Laor A, Weber G, Bitterman H. Assessment of disease-severity scoring systems for patients with sepsis in general internal medicine departments. Critical Care. 2011;15(2):R95-R.
66. Peris A, Zagli G, Maccarrone N, Batacchi S, Cammelli R, Cecchi A, et al. The use of Modified Early Warning Score may help anesthesists in postoperative level of care selection in emergency abdominal surgery. Minerva anestesiologica. 2012;78(9):1034-8.

Clinical & Cost-effectiveness of the National Early Warning System (NEWS): Systematic Review Update
Health Research Board – Collaboration in Ireland for Clinical Effectiveness Reviews
364
67. Tirotta D, Gambacorta M, La Regina M, Attardo T, Lo Gullo A, Panzone F, et al. Evaluation of the threshold value for the modified early warning score (MEWS) in medical septic patients: a secondary analysis of an Italian multicentric prospective cohort (SNOOPII study). QJM: An International Journal of Medicine. 2017;110(6):369-73.
68. Nishijima I, Oyadomari S, Maedomari S, Toma R, Igei C, Kobata S, et al. Use of a modified early warning score system to reduce the rate of in-hospital cardiac arrest. Journal of intensive care. 2016;4(1):12.
69. Drower D, McKeany R, Jogia P, Jull A. Evaluating the impact of implementing an early warning score system on incidence of in-hospital cardiac arrest. The New Zealand medical journal. 2013;126(1385):26-34.
70. Luís L, Nunes C. Short National Early Warning Score — Developing a Modified Early Warning Score. Australian Critical Care. 2017.
71. Al-Qahtani S, Al-Dorzi HM, Tamim HM, Hussain S, Fong L, Taher S, et al. Impact of an intensivist-led multidisciplinary extended rapid response team on hospital-wide cardiopulmonary arrests and mortality. Critical care medicine. 2013;41(2):506-17.
72. Kim Y, Lee DS, Min H, Choi YY, Lee EY, Song I, et al. Effectiveness Analysis of a Part-Time Rapid Response System During Operation Versus Nonoperation. Critical Care Medicine. 2017;45(6):e592-e9.
73. Jo S, Lee JB, Jin YH, Jeong TO, Yoon JC, Jun YK, et al. Modified early warning score with rapid lactate level in critically ill medical patients: the ViEWS-L score. Emergency medicine journal : EMJ. 2013;30(2):123-9.
74. Yoo JW, Lee JR, Jung YK, Choi SH, Son JS, Kang BJ, et al. A combination of early warning score and lactate to predict intensive care unit transfer of inpatients with severe sepsis/septic shock. Korean Journal of Internal Medicine. 2015;30(4):471-7.
75. Reini K, Fredrikson M, Oscarsson A. The prognostic value of the Modified Early Warning Score in critically ill patients: a prospective, observational study. European Journal of Anaesthesiology (EJA). 2012;29(3):152-7.
76. Etter R, Takala J, Merz TM. Intensive care without walls - introduction of a Medical Emergency Team system in a Swiss tertiary care centre. Swiss medical weekly. 2014;144:w14027.
77. Uppanisakorn S, Bhurayanontachai R, Boonyarat J, Kaewpradit J. National Early Warning Score (NEWS) at ICU discharge can predict early clinical deterioration after ICU transfer. Journal of Critical Care. 2018;43:225-9.
78. van Galen LS, Dijkstra CC, Ludikhuize J, Kramer MH, Nanayakkara PW. A protocolised once a day Modified Early Warning Score (MEWS) measurement is an appropriate screening tool for major adverse events in a general hospital population. PloS one. 2016;11(8):e0160811.
79. Ludikhuize J, Borgert M, Binnekade J, Subbe C, Dongelmans D, Goossens A. Standardized measurement of the Modified Early Warning Score results in enhanced implementation of a Rapid Response System: a quasi-experimental study. Resuscitation. 2014;85(5):676-82.
80. Ludikhuize J, Brunsveld-Reinders AH, Dijkgraaf MG, Smorenburg SM, de Rooij SE, Adams R, et al. Outcomes Associated With the Nationwide Introduction of Rapid Response Systems in The Netherlands. Crit Care Med. 2015;43(12):2544-51.
81. Simmes FM, Schoonhoven L, Mintjes J, Fikkers BG, van der Hoeven JG. Incidence of cardiac arrests and unexpected deaths in surgical patients before and after implementation of a rapid response system. Annals of intensive care. 2012;2(1):20.

Clinical & Cost-effectiveness of the National Early Warning System (NEWS): Systematic Review Update
Health Research Board – Collaboration in Ireland for Clinical Effectiveness Reviews
365
82. Simmes F, Schoonhoven L, Mintjes J, Fikkers BG, van der Hoeven JG. Effects of a rapid response system on quality of life: a prospective cohort study in surgical patients before and after implementing a rapid response system. Health and quality of life outcomes. 2013;11(1):74.
83. Smith T, Den Hartog D, Moerman T, Patka P, Van Lieshout EM, Schep NW. Accuracy of an expanded early warning score for patients in general and trauma surgery wards. The British journal of surgery. 2012;99(2):192-7.
84. van Rooijen CR, de Ruijter W, van Dam B. Evaluation of the threshold value for the Early Warning Score on general wards. The Netherlands journal of medicine. 2013;71(1):38-43.
85. Douw G, Huisman-de Waal G, van Zanten AR, van der Hoeven JG, Schoonhoven L. Nurses' 'worry' as predictor of deteriorating surgical ward patients: A prospective cohort study of the Dutch-Early-Nurse-Worry-Indicator-Score. International journal of nursing studies. 2016;59:134-40.
86. Douw G, Huisman-de Waal G, van Zanten ARH, van der Hoeven JG, Schoonhoven L. Capturing early signs of deterioration: the dutch-early-nurse-worry-indicator-score and its value in the Rapid Response System. Journal Of Clinical Nursing. 2017;26(17-18):2605-13.
87. Durusu TanriÖVer M, HalaÇLi B, SaİT B, ÖCal S, Topelİ A. Daily surveillance with early warning scores help predict hospital mortality in medical wards. Turkish Journal of Medical Sciences. 2016;46(6):1786-91.
88. Jones S, Mullally M, Ingleby S, Buist M, Bailey M, Eddleston JM. Bedside electronic capture of clinical observations and automated clinical alerts to improve compliance with an Early Warning Score protocol. Critical care and resuscitation : journal of the Australasian Academy of Critical Care Medicine. 2011;13(2):83-8.
89. Hollis RH, Graham LA, Lazenby JP, Brown DM, Taylor BB, Heslin MJ, et al. A Role for the Early Warning Score in Early Identification of Critical Postoperative Complications. Annals Of Surgery. 2016;263(5):918-23.
90. Faisal M, Scally A, Elgaali MA, Richardson Dd, Beatson K, Mohammed MA. The National Early Warning Score and its subcomponents recorded within ±24 h of emergency medical admission are poor predictors of hospital-acquired acute kidney injury. Clinical Medicine. 2018;18(1):47-53.
91. Huddart S, Peden CJ, Swart M, McCormick B, Dickinson M, Mohammed MA, et al. Use of a pathway quality improvement care bundle to reduce mortality after emergency laparotomy. The British journal of surgery. 2015;102(1):57-66.
92. Jarvis SW, Kovacs C, Badriyah T, Briggs J, Mohammed MA, Meredith P, et al. Development and validation of a decision tree early warning score based on routine laboratory test results for the discrimination of hospital mortality in emergency medical admissions. Resuscitation. 2013;84(11):1494-9.
93. Jarvis S, Kovacs C, Briggs J, Meredith P, Schmidt PE, Featherstone PI, et al. Aggregate National Early Warning Score (NEWS) values are more important than high scores for a single vital signs parameter for discriminating the risk of adverse outcomes. Resuscitation. 2015;87:75-80.
94. Kovacs C, Jarvis SW, Prytherch DR, Meredith P, Schmidt PE, Briggs JS, et al. Comparison of the National Early Warning Score in non‐elective medical and surgical patients. British Journal of Surgery. 2016;103(10):1385-93.

Clinical & Cost-effectiveness of the National Early Warning System (NEWS): Systematic Review Update
Health Research Board – Collaboration in Ireland for Clinical Effectiveness Reviews
366
95. Moon A, Cosgrove JF, Lea D, Fairs A, Cressey DM. An eight year audit before and after the introduction of modified early warning score (MEWS) charts, of patients admitted to a tertiary referral intensive care unit after CPR. Resuscitation. 2011;82(2):150-4.
96. Morris A, Owen HM, Jones K, Hartin J, Welch J, Subbe CP. Objective patient-related outcomes of rapid-response systems - a pilot study to demonstrate feasibility in two hospitals. Critical care and resuscitation : journal of the Australasian Academy of Critical Care Medicine. 2013;15(1):33-9.
97. Patel MS, Jones MA, Jiggins M, Williams SC. Does the use of a "track and trigger" warning system reduce mortality in trauma patients? Injury. 2011;42(12):1455-9.
98. Pattison N, Eastham E. Critical care outreach referrals: a mixed-method investigative study of outcomes and experiences. Nursing in critical care. 2012;17(2):71-82.
99. Schmidt PE, Meredith P, Prytherch DR, Watson D, Watson V, Killen RM, et al. Impact of introducing an electronic physiological surveillance system on hospital mortality. BMJ Quality & Safety. 2014.
100. Suppiah A, Malde D, Arab T, Hamed M, Allgar V, Morris-Stiff G, et al. The Modified Early Warning Score (MEWS): an instant physiological prognostic indicator of poor outcome in acute pancreatitis. JOP : Journal of the pancreas. 2014;15(6):569-76.
101. Abbott TE, Vaid N, Ip D, Cron N, Wells M, Torrance HD, et al. A single-centre observational cohort study of admission National Early Warning Score (NEWS). Resuscitation. 2015;92:89-93.
102. Badriyah T, Briggs JS, Meredith P, Jarvis SW, Schmidt PE, Featherstone PI, et al. Decision-tree early warning score (DTEWS) validates the design of the National Early Warning Score (NEWS). Resuscitation. 2014;85(3):418-23.
103. Cooksley T, Kitlowski E, Haji-Michael P. Effectiveness of Modified Early Warning Score in predicting outcomes in oncology patients. QJM : monthly journal of the Association of Physicians. 2012;105(11):1083-8.
104. Dawes TR, Cheek E, Bewick V, Dennis M, Duckitt RW, Walker J, et al. Introduction of an electronic physiological early warning system: Effects on mortality and length of stay. British Journal of Anaesthesia. 2014;113(4):603-9.
105. Jarvis S, Kovacs C, Briggs J, Meredith P, Schmidt PE, Featherstone PI, et al. Can binary early warning scores perform as well as standard early warning scores for discriminating a patient's risk of cardiac arrest, death or unanticipated intensive care unit admission? Resuscitation. 2015;93:46-52.
106. Jarvis SW, Kovacs C, Briggs J, Meredith P, Schmidt PE, Featherstone PI, et al. Are observation selection methods important when comparing early warning score performance? Resuscitation. 2015;90:1-6.
107. Subbe CP, Duller B, Bellomo R. Effect of an automated notification system for deteriorating ward patients on clinical outcomes. Critical care (London, England) [Internet]. 2017; 21(1) (no pagination). Available from: http://onlinelibrary.wiley.com/o/cochrane/clcentral/articles/602/CN-01367602/frame.html
108. Fung K, Khan F, Dawson J. The introduction of an integrated early warning score observation chart-a picture paints a thousand words. Journal of patient safety. 2014;10(1):13-9.
109. Farenden S, Gamble D, Welch J. Impact of implementation of the National Early Warning Score on patients and staff. British Journal of Hospital Medicine (17508460). 2017;78(3):132-6.

Clinical & Cost-effectiveness of the National Early Warning System (NEWS): Systematic Review Update
Health Research Board – Collaboration in Ireland for Clinical Effectiveness Reviews
367
110. Abbott TEF, Torrance HDT, Cron N, Vaid N, Emmanuel J. A single-centre cohort study of National Early Warning Score (NEWS) and near patient testing in acute medical admissions. European Journal of Internal Medicine. 2016;35:78-82.
111. Hodgson LE, Dimitrov BD, Congleton J, Venn R, Forni LG, Roderick PJ. A validation of the National Early Warning Score to predict outcome in patients with COPD exacerbation. Thorax. 2017;72(1):23-30.
112. Pimentel MA, Redfern OC, Gerry S, Collins GS, Malycha J, Prytherch D, et al. A comparison of the ability of the National Early Warning Score and the National Early Warning Score 2 to identify patients at risk of in-hospital mortality: A multi-centre database study. Resuscitation. 2018.
113. Smith GB, Prytherch DR, Jarvis S, Kovacs C, Meredith P, Schmidt PE, et al. A Comparison of the Ability of the Physiologic Components of Medical Emergency Team Criteria and the U.K. National Early Warning Score to Discriminate Patients at Risk of a Range of Adverse Clinical Outcomes. Critical Care Medicine. 2016;44(12):2171-81.
114. Jones B. Developing a Vital Sign Alert System. American Journal of Nursing. 2013;113(8):36-46.
115. Howell MD, Ngo L, Folcarelli P, Yang J, Mottley L, Marcantonio ER, et al. Sustained effectiveness of a primary-team–based rapid response system. Critical care medicine. 2012;40(9):2562.
116. Hackmann G, Chen M, Chipara O, Lu C, Chen Y, Kollef M, et al. Toward a Two-Tier Clinical Warning System for Hospitalized Patients. AMIA Annual Symposium Proceedings. 2011;2011:511-9.
117. Albert BL, Huesman L. Development of a modified early warning score using the electronic medical record. Dimensions of Critical Care Nursing. 2011;30(5):283-92.
118. Bailey TC, Chen Y, Mao Y, Lu C, Hackmann G, Micek ST, et al. A trial of a real‐time Alert for clinical deterioration in Patients hospitalized on general medical wards. Journal of hospital medicine. 2013;8(5):236-42.
119. Beitler JR, Link N, Bails DB, Hurdle K, Chong DH. Reduction in hospital-wide mortality following implementation of a rapid response team: A long-term cohort study. Critical Care. 2011:R269.
120. Capan M, Ivy JS, Rohleder T, Hickman J, Huddleston JM. Individualizing and optimizing the use of early warning scores in acute medical care for deteriorating hospitalized patients. Resuscitation. 2015;93:107-12.
121. Churpek MM, Yuen TC, Edelson DP. Predicting clinical deterioration in the hospital: The impact of outcome selection. Resuscitation. 2013;84(5):564-8.
122. Churpek MM, Yuen TC, Huber MT, Park SY, Hall JB, Edelson DP. Predicting cardiac arrest on the wards: a nested case-control study. Chest. 2012;141(5):1170-6.
123. Churpek MM, Yuen TC, Winslow C, Hall J, Edelson DP. Differences in vital signs between elderly and nonelderly patients prior to ward cardiac arrest. Crit Care Med. 2015;43(4):816-22.
124. Davis DP, Aguilar SA, Graham PG, Lawrence B, Sell RE, Minokadeh A, et al. A novel configuration of a traditional rapid response team decreases non–intensive care unit arrests and overall hospital mortality. Journal of hospital medicine. 2015;10(6):352-7.
125. Karpman C, Keegan MT, Jensen JB, Bauer PR, Brown DR, Afessa B. The impact of rapid response team on outcome of patients transferred from the ward to the ICU: A single-center study. Critical Care Medicine. 2013;41(10):2284-91.

Clinical & Cost-effectiveness of the National Early Warning System (NEWS): Systematic Review Update
Health Research Board – Collaboration in Ireland for Clinical Effectiveness Reviews
368
126. Kirkland LL, Malinchoc M, O'Byrne M, Benson JT, Kashiwagi DT, Burton MC, et al. A clinical deterioration prediction tool for internal medicine patients. American journal of medical quality : the official journal of the American College of Medical Quality. 2013;28(2):135-42.
127. Kollef MH, Heard K, Chen Y, Lu C, Martin N, Bailey T. Mortality and Length of Stay Trends Following Implementation of a Rapid Response System and Real-Time Automated Clinical Deterioration Alerts. American journal of medical quality : the official journal of the American College of Medical Quality. 2017;32(1):12-8.
128. Mathukia C, Fan W, Vadyak K, Biege C, Krishnamurthy M. Modified Early Warning System improves patient safety and clinical outcomes in an academic community hospital. Journal of Community Hospital Internal Medicine Perspectives. 2015;5(2):10.3402/jchimp.v5.26716.
129. Moriarty JP, Schiebel NE, Johnson MG, Jensen JB, Caples SM, Morlan BW, et al. Evaluating implementation of a rapid response team: Considering alternative outcome measures. International Journal for Quality in Health Care. 2014;26(1):49-57.
130. Moroseos T, Bidwell K, Rui L, Fuhrman L, Gibran NS, Honari S, et al. Rapid response team implementation on a burn surgery/acute care ward. Journal of Burn Care and Research. 2014;35(1):21-7.
131. Parrish WM, Hravnak M, Dudjak L, Guttendorf J. Impact of a modified early warning score on rapid response and cardiopulmonary arrest calls in telemetry and medical-surgical units.(Continuous Quality Improvement). MedSurg Nursing. 2017;26(1):15.
132. Picker D, Dans M, Heard K, Bailey T, Chen Y, Lu C, et al. A Randomized Trial of Palliative Care Discussions Linked to an Automated Early Warning System Alert. Critical care medicine [Internet]. 2017; 45(2):[234-40 pp.]. Available from: http://onlinelibrary.wiley.com/o/cochrane/clcentral/articles/529/CN-01298529/frame.html.
133. Rothberg MB, Belforti R, Fitzgerald J, Friderici J, Keyes M. Four years' experience with a hospitalist‐led medical emergency team: An interrupted time series. Journal of hospital medicine. 2012;7(2):98-103.
134. Salvatierra G, Bindler RC, Corbett C, Roll J, Daratha KB. Rapid response team implementation and in-hospital mortality. Critical Care Medicine. 2014;42(9):2001-6.
135. Segon A, Ahmad S, Segon Y, Kumar V, Friedman H, Ali M. Effect of a rapid response team on patient outcomes in a community-based teaching hospital. Journal of Graduate Medical Education. 2014;6(1):61-4.
136. Shah SK, Cardenas Jr VJ, Kuo YF, Sharma G. Rapid response team in an academic institution: Does it make a difference? Chest. 2011;139(6):1361-7.
137. Stewart J, Carman M, Spegman A, Sabol VK. Evaluation of the effect of the modified early warning system on the nurse-led activation of the rapid response system. Journal of nursing care quality. 2014;29(3):223-9.
138. Stark AP, Maciel RC, Sheppard W, Sacks G, Hines OJ. An Early Warning Score Predicts Risk of Death after In-hospital Cardiopulmonary Arrest in Surgical Patients. The American surgeon. 2015;81(10):916-21.
139. Umscheid CA, Betesh J, VanZandbergen C, Hanish A, Tait G, Mikkelsen ME, et al. Development, implementation, and impact of an automated early warning and response system for sepsis. J Hosp Med. 2015;10(1):26-31.
140. Alaa AM, Yoon J, Hu S, van der Schaar M. Personalized Risk Scoring for Critical Care Prognosis Using Mixtures of Gaussian Processes. IEEE Transactions on Biomedical Engineering. 2018;65(1):207-18.
Clinical & Cost-effectiveness of the National Early Warning System (NEWS): Systematic Review Update
Health Research Board – Collaboration in Ireland for Clinical Effectiveness Reviews
369
141. Alvarez CA, Clark CA, Zhang S, Halm EA, Shannon JJ, Girod CE, et al. Predicting out of intensive care unit cardiopulmonary arrest or death using electronic medical record data. BMC medical informatics and decision making. 2013;13:28.
142. Bleyer AJ, Vidya S, Russell GB, Jones CM, Sujata L, Daeihagh P, et al. Longitudinal analysis of one million vital signs in patients in an academic medical center. Resuscitation. 2011;82(11):1387-92.
143. Churpek MM, Yuen TC, Park SY, Meltzer DO, Hall JB, Edelson DP. Derivation of a cardiac arrest prediction model using ward vital signs*. Crit Care Med. 2012;40(7):2102-8.
144. Churpek MM, Yuen TC, Edelson DP. Risk stratification of hospitalized patients on the wards. Chest. 2013;143(6):1758-65.
145. Churpek MM, Yuen TC, Park SY, Gibbons R, Edelson DP. Using electronic health record data to develop and validate a prediction model for adverse outcomes in the wards*. Crit Care Med. 2014;42(4):841-8.
146. Churpek MM, Yuen TC, Winslow C, Robicsek AA, Meltzer DO, Gibbons RD, et al. Multicenter development and validation of a risk stratification tool for ward patients. American Journal of Respiratory and Critical Care Medicine. 2014;190(6):649-55.
147. Escobar GJ, Laguardia JC, Turk BJ, Ragins A, Kipnis P, Draper D. Early detection of impending physiologic deterioration among patients who are not in intensive care: Development of predictive models using data from an automated electronic medical record. Journal of Hospital Medicine. 2012;7(5):388-95.
148. Moseson EM, Zhuo H, Chu J, Stein JC, Matthay MA, Kangelaris KN, et al. Intensive care unit scoring systems outperform emergency department scoring systems for mortality prediction in critically ill patients: A prospective cohort study. Journal of Intensive Care. 2014;2(1).
149. Romero-Brufau S, Huddleston JM, Naessens JM, Johnson MG, Hickman J, Morlan BW, et al. Widely used track and trigger scores: are they ready for automation in practice? Resuscitation. 2014;85(4):549-52.
150. Rothman MJ, Rothman SI, Beals IV J. Development and validation of a continuous measure of patient condition using the Electronic Medical Record. Journal of biomedical informatics. 2013;46(5):837-48.
151. Yu S, Leung S, Heo M, Soto GJ, Shah RT, Gunda S, et al. Comparison of risk prediction scoring systems for ward patients: a retrospective nested case-control study. Critical care (London, England). 2014;18(3):R132.
152. Finlay GD, Rothman MJ, Smith RA. Measuring the modified early warning score and the Rothman index: advantages of utilizing the electronic medical record in an early warning system. J Hosp Med. 2014;9(2):116-9.
153. Young RS, Gobel BH, Schumacher M, Lee J, Weaver C, Weitzman S. Use of the modified early warning score and serum lactate to prevent cardiopulmonary arrest in hematology-oncology patients: a quality improvement study. American journal of medical quality : the official journal of the American College of Medical Quality. 2014;29(6):530-7.
154. Churpek MM, Yuen TC, Winslow C, Meltzer DO, Kattan MW, Edelson DP. Multicenter Comparison of Machine Learning Methods and Conventional Regression for Predicting Clinical Deterioration on the Wards. Critical Care Medicine. 2016;44(2):368-74.
155. Churpek MM, Snyder A, Han X, Sokol S, Pettit N, Howell MD, et al. Quick Sepsis-related Organ Failure Assessment, Systemic Inflammatory Response Syndrome, and Early Warning Scores for Detecting Clinical Deterioration in Infected Patients outside the Intensive Care Unit. American Journal Of Respiratory And Critical Care Medicine. 2017;195(7):906-11.

Clinical & Cost-effectiveness of the National Early Warning System (NEWS): Systematic Review Update
Health Research Board – Collaboration in Ireland for Clinical Effectiveness Reviews
370
156. Kipnis P, Turk BJ, Wulf DA, LaGuardia JC, Liu V, Churpek MM, et al. Development and validation of an electronic medical record-based alert score for detection of inpatient deterioration outside the ICU. Journal Of Biomedical Informatics. 2016;64:10-9.
157. Sebat F, Vandegrift MA, Childers S, Lighthall GK. A Novel Bedside-Focused Ward Surveillance and Response System. Joint Commission Journal on Quality & Patient Safety. 2018;44(2):94-100.
158. Tarassenko L, Clifton DA, Pinsky MR, Hravnak MT, Woods JR, Watkinson PJ. Centile-based early warning scores derived from statistical distributions of vital signs. Resuscitation. 2011;82(8):1013-8.
159. Seymour CW, Kahn JM, Cooke CR, Watkins TR, Heckbert SR, Rea TD. Prediction of Critical Illness During Out-of-Hospital Emergency Care. JAMA : the journal of the American Medical Association. 2010;304(7):747-54.
160. Davies O, DeVita MA, Ayinla R, Perez X. Barriers to activation of the rapid response system. Resuscitation. 2014;85(11):1557-61.
161. Balestroni G, Bertolotti G. [EuroQol-5D (EQ-5D): an instrument for measuring quality of life]. Monaldi archives for chest disease = Archivio Monaldi per le malattie del torace. 2012;78(3):155-9.
162. Sach T, Barton G, Doherty M, Muir K, Jenkinson C, Avery A. The relationship between body mass index and health-related quality of life: comparing the EQ-5D, EuroQol VAS and SF-6D. International journal of obesity. 2007;31(1):189.
163. Saab MM, McCarthy B, Andrews T, Savage E, Drummond FJ, Walshe N, et al. The effect of adult Early Warning Systems education on nurses' knowledge, confidence and clinical performance: A systematic review. Journal of advanced nursing. 2017;73(11):2506-21.
164. Cahill H, Jones A, Herkes R, Cook K, Stirling A, Halbert T, et al. Introduction of a new observation chart and education programme is associated with higher rates of vital-sign ascertainment in hospital wards. BMJ Quality and Safety. 2011;20(9):791-6.
165. Kyriacos U, Jelsma J, James M, Jordan S. Early warning scoring systems versus standard observations charts for wards in South Africa: a cluster randomized controlled trial. Trials. 2015;16:103.
166. Liaw SY, Chan SW, Chen FG, Hooi SC, Siau C. Comparison of virtual patient simulation with mannequin-based simulation for improving clinical performances in assessing and managing clinical deterioration: randomized controlled trial. Journal of medical Internet research. 2014;16(9):e214.
167. Liaw SY, Wong LF, Chan SW, Ho JT, Mordiffi SZ, Ang SB, et al. Designing and evaluating an interactive multimedia Web-based simulation for developing nurses' competencies in acute nursing care: randomized controlled trial. Journal of medical Internet research. 2015;17(1):e5.
168. Lindsey PL, Jenkins S. Nursing students' clinical judgment regarding rapid response: the influence of a clinical simulation education intervention. Nursing forum. 2013;48(1):61-70.
169. Ludikhuize J, de Jonge E, Goossens A. Measuring adherence among nurses one year after training in applying the Modified Early Warning Score and Situation-Background-Assessment-Recommendation instruments. Resuscitation. 2011;82(11):1428-33.
170. Merriel A, Nelson Hvd, Merriel S, Bennett J, Donald F, Draycott T, et al. Identifying Deteriorating Patients Through Multidisciplinary Team Training. American Journal of Medical Quality. 2016;31(6):589-95.

Clinical & Cost-effectiveness of the National Early Warning System (NEWS): Systematic Review Update
Health Research Board – Collaboration in Ireland for Clinical Effectiveness Reviews
371
171. Ozekcin LR, Tuite P, Willner K, Hravnak M. Simulation education: early identification of patient physiologic deterioration by acute care nurses. Clinical nurse specialist CNS. 2015;29(3):166-73.
172. Rose MA, Hanna LA, Nur SA, Johnson CM. Utilization of electronic modified early warning score to engage rapid response team early in clinical deterioration. Journal for nurses in professional development. 2015;31(3):E1-7.
173. Shaddel F, Khosla V, Banerjee S. Effects of introducing MEWS on nursing staff in mental health inpatient settings. Progress in Neurology and Psychiatry. 2014;18(2):24-7.
174. Hammond NE, Spooner AJ, Barnett AG, Corley A, Brown P, Fraser JF. The effect of implementing a modified early warning scoring (MEWS) system on the adequacy of vital sign documentation. Australian critical care : official journal of the Confederation of Australian Critical Care Nurses. 2013;26(1):18-22.
175. Kinsman L, Buykx P, Cant R, Champion R, Cooper S, Endacott R, et al. The FIRST(2)ACT simulation program improves nursing practice in a rural Australian hospital. The Australian journal of rural health. 2012;20(5):270-4.
176. Schubert CR. Effect of simulation on nursing knowledge and critical thinking in failure to rescue events. Journal of continuing education in nursing. 2012;43(10):467-71.
177. Liaw SY, Scherpbier A, Klainin-Yobas P, Rethans JJ. Rescuing A Patient In Deteriorating Situations (RAPIDS): An evaluation tool for assessing simulation performance on clinical deterioration. Resuscitation. 2011;82(11):1434-9.
178. Liaw SY, Scherpbier A, Rethans JJ, Klainin-Yobas P. Assessment for simulation learning outcomes: a comparison of knowledge and self-reported confidence with observed clinical performance. Nurse education today. 2012;32(6):e35-9.
179. Liaw SY, Wong LF, Ang SB, Ho JT, Siau C, Ang EN. Strengthening the afferent limb of rapid response systems: an educational intervention using web-based learning for early recognition and responding to deteriorating patients. BMJ quality & safety. 2016;25(6):448-56.
180. Liaw SY, Chng DYJ, Wong LF, Ho JTY, Mordiffi SZ, Cooper S, et al. The impact of a Web-based educational program on the recognition and management of deteriorating patients. Journal of Clinical Nursing. 2017;26(23/24):4848-56.
181. Liaw SY, Wong LF, Lim EY, Ang SB, Mujumdar S, Ho JT, et al. Effectiveness of a Web-Based Simulation in Improving Nurses' Workplace Practice With Deteriorating Ward Patients: A Pre- and Postintervention Study. Journal of medical Internet research. 2016;18(2):e37.
182. Wood SD, Candeland JL, Dinning A, Dow S, Hunkin H, McHale S, et al. Our approach to changing the culture of caring for the acutely unwell patient at a large UK teaching hospital: A service improvement focus on Early Warning Scoring tools. Intensive Crit Care Nurs. 2015;31(2):106-15.
183. McDonnell A, Tod A, Bray K, Bainbridge D, Adsetts D, Walters S. A before and after study assessing the impact of a new model for recognizing and responding to early signs of deterioration in an acute hospital. Journal of advanced nursing. 2013;69(1):41-52.
184. Wood SD, Candeland JL, Dinning A, Dow S, Hunkin H, McHale S, et al. Our approach to changing the culture of caring for the acutely unwell patient at a large UK teaching hospital: A service improvement focus on Early Warning Scoring tools. Intensive & critical care nursing. 2015;31(2):106-15.
Clinical & Cost-effectiveness of the National Early Warning System (NEWS): Systematic Review Update
Health Research Board – Collaboration in Ireland for Clinical Effectiveness Reviews
372
185. McDonnell A, Tod A, Bray K, Bainbridge D, Adsetts D, Walters S. A before and after study assessing the impact of a new model for recognizing and responding to early signs of deterioration in an acute hospital. Journal of advanced nursing. 2012;69(1):41-52.
186. Mullany DV, Ziegenfuss M, Goleby MA, Ward HE. Improved hospital mortality with a low MET dose: the importance of a modified early warning score and communication tool. Anaesthesia & Intensive Care. 2016;44(6):734-41.
187. Pimentel MAF, Redfern OC, Gerry S, Collins GS, Malycha J, Prytherch D, et al. A comparison of the ability of the National Early Warning Score and the National Early Warning Score 2 to identify patients at risk of in-hospital mortality: A multi-centre database study. Resuscitation. 2018;134:147-56.
188. Trinkle RM, Flabouris A. Documenting Rapid Response System afferent limb failure and associated patient outcomes. Resuscitation. 2011;82(7):810-4.
189. Johnston MJ, Arora S, King D, Bouras G, Almoudaris AM, Davis R, et al. A systematic review to identify the factors that affect failure to rescue and escalation of care in surgery. Surgery. 2015;157(4):752-63.
190. Elliott D, Allen E, Perry L, Fry M, Duffield C, Gallagher R, et al. Clinical user experiences of observation and response charts: focus group findings of using a new format chart incorporating a track and trigger system. BMJ quality & safety. 2015;24(1):65-75.
191. Kitto S, Marshall SD, McMillan SE, Shearer B, Buist M, Grant R, et al. Rapid response systems and collective (in) competence: An exploratory analysis of intraprofessional and interprofessional activation factors. Journal of interprofessional care. 2015;29(4):340-6.
192. Massey D, Chaboyer W, Aitken L. Nurses' perceptions of accessing a Medical Emergency Team: a qualitative study. Australian critical care : official journal of the Confederation of Australian Critical Care Nurses. 2014;27(3):133-8.
193. Johnston M, Arora S, King D, Stroman L, Darzi A. Escalation of care and failure to rescue: a multicenter, multiprofessional qualitative study. Surgery. 2014;155(6):989-94.
194. Mackintosh N, Rainey H, Sandall J. Understanding how rapid response systems may improve safety for the acutely ill patient: learning from the frontline. BMJ quality & safety. 2012;21(2):135-44.
195. Mackintosh N, Humphrey C, Sandall J. The habitus of 'rescue' and its significance for implementation of rapid response systems in acute health care. Social science & medicine (1982). 2014;120:233-42.
196. Cherry PG, Jones CP. Attitudes of nursing staff towards a Modified Early Warning System. British Journal Of Nursing (Mark Allen Publishing). 2015;24(16):812-8.
197. Astroth K, M Woith W, Stapleton SJ, Degitz RJ, Jenkins SH. Qualitative exploration of nurses' decisions to activate rapid response teams. Journal of Clinical Nursing. 2013;22(19-20):2876-82.
198. Benin AL, Borgstrom CP, Jenq GY, Roumanis SA, Horwitz LI, Benin AL, et al. Republished: Defining impact of a rapid response team: qualitative study with nurses, physicians and hospital administrators. Postgraduate Medical Journal. 2012;88(1044):575-82.
199. Williams DJ, Newman A, Jones C, Woodard B. Nurses' perceptions of how rapid response teams affect the nurse, team, and system. Journal of nursing care quality. 2011;26(3):265-72.
200. Braaten JS. Hospital System Barriers to Rapid Response Team Activation: A Cognitive Work Analysis. AJN American Journal of Nursing. 2015;115(2):22-33.

Clinical & Cost-effectiveness of the National Early Warning System (NEWS): Systematic Review Update
Health Research Board – Collaboration in Ireland for Clinical Effectiveness Reviews
373
201. Lydon S, Byrne D, Offiah G, Gleeson L, O'Connor P. A mixed-methods investigation of health professionals’ perceptions of a physiological track and trigger system. BMJ Quality & Safety. 2016;25(9):688-95.
202. Stafseth SK, Grønbeck S, Lien T, Randen I, Lerdal A. The experiences of nurses implementing the Modified Early Warning Score and a 24-hour on-call Mobile Intensive Care Nurse: An exploratory study. Intensive and Critical Care Nursing. 2016;34:33-41.
203. Petersen JA, Rasmussen LS, Rydahl-Hansen S. Barriers and facilitating factors related to use of early warning score among acute care nurses: a qualitative study. BMC Emergency Medicine. 2017;17:1-9.
204. Chua WL, Liaw SY, Ng EKC, Mackey SJ. Frontline nurses' experiences in recognising and responding to clinical deterioration. Annals of the Academy of Medicine Singapore. 2012;41(9):S40.
205. Braun V, Clarke V, Terry G. Thematic analysis. Qual Res Clin Health Psychol. 2014;24:95-114. 206. Lydon S, Byrne D, O'Connor P, Gleeson L, Offiah G. A mixed-methods investigation of health
professionals’ perceptions of a physiological track and trigger system. 2016. 207. Massey D, Chaboyer W, Anderson V. What factors influence ward nurses’ recognition of and
response to patient deterioration? An integrative review of the literature. Nursing Open. 2017;4(1):6-23.
208. Ford DW, Goodwin AJ, Simpson AN, Johnson E, Nadig N, Simpson KN. A Severe Sepsis Mortality Prediction Model and Score for Use With Administrative Data. Critical Care Medicine. 2016;44(2):319-27.
209. Alam N, Vegting IL, Houben E, van Berkel B, Vaughan L, Kramer MH, et al. Exploring the performance of the National Early Warning Score (NEWS) in a European emergency department. Resuscitation. 2015;90:111-5.
210. Brown RT. Facilitating adoption of NEWS tool to develop clinical decision making. US: ProQuest Information & Learning; 2018.
211. Bulut M, Cebicci H, Sigirli D, Sak A, Durmus O, Top AA, et al. The comparison of modified early warning score with rapid emergency medicine score: a prospective multicentre observational cohort study on medical and surgical patients presenting to emergency department. Emergency medicine journal : EMJ. 2014;31(6):476-81.
212. Cattermole GN, Mak SK, Liow CH, Ho MF, Hung KY, Keung KM, et al. Derivation of a prognostic score for identifying critically ill patients in an emergency department resuscitation room. Resuscitation. 2009;80(9):1000-5.
213. Christensen D, Jensen NM, Maaloe R, Rudolph SS, Belhage B, Perrild H. Nurse-administered early warning score system can be used for emergency department triage. Danish medical bulletin. 2011;58(6):A4221.
214. Considine J, Jones D, Pilcher D, Currey J. Physiological status during emergency department care: relationship with inhospital death after clinical deterioration. Critical care and resuscitation : journal of the Australasian Academy of Critical Care Medicine. 2015;17(4):257-62.
215. Dundar ZD, Ergin M, Karamercan MA, Ayranci K, Colak T, Tuncar A, et al. Modified Early Warning Score and VitalPac Early Warning Score in geriatric patients admitted to emergency department. European journal of emergency medicine : official journal of the European Society for Emergency Medicine. 2016;23(6):406-12.
216. Flôr da Rocha T, Gibbon Neves J, Viegas K. Modified early warning score: evaluation of trauma patients. Revista Brasileira de Enfermagem. 2016;69(5):850-5.

Clinical & Cost-effectiveness of the National Early Warning System (NEWS): Systematic Review Update
Health Research Board – Collaboration in Ireland for Clinical Effectiveness Reviews
374
217. Geier F, Popp S, Greve Y, Achterberg A, Glockner E, Ziegler R, et al. Severity illness scoring systems for early identification and prediction of in-hospital mortality in patients with suspected sepsis presenting to the emergency department. Wiener klinische Wochenschrift. 2013;125(17-18):508-15.
218. Ho le O, Li H, Shahidah N, Koh ZX, Sultana P, Hock Ong ME. Poor performance of the modified early warning score for predicting mortality in critically ill patients presenting to an emergency department. World journal of emergency medicine. 2013;4(4):273-8.
219. Huggan PJ, Akram F, Er BH, Christen LS, Weixian L, Lim V, et al. Measures of acute physiology, comorbidity and functional status to differentiate illness severity and length of stay among acute general medical admissions: a prospective cohort study. Internal medicine journal. 2015;45(7):732-40.
220. Jain A, Palta S, Saroa R, Palta A, Sama S, Gombar S. Sequential organ failure assessment scoring and prediction of patient's outcome in Intensive Care Unit of a tertiary care hospital. Journal of Anaesthesiology Clinical Pharmacology. 2016;32(3):364-8.
221. Kaufman EJ, Earl-Royal E, Barie PS, Holena DN. Failure to Rescue after Infectious Complications in a Statewide Trauma System. Surgical Infections. 2017;18(2):89-98.
222. Keep JW, Messmer AS, Sladden R, Burrell N, Pinate R, Tunnicliff M, et al. National early warning score at Emergency Department triage may allow earlier identification of patients with severe sepsis and septic shock: a retrospective observational study. Emergency medicine journal : EMJ. 2016;33(1):37-41.
223. Kellett J, Murray A. Should predictive scores based on vital signs be used in the same way as those based on laboratory data? A hypothesis generating retrospective evaluation of in-hospital mortality by four different scoring systems. Resuscitation. 2016;102:94-7.
224. Liu N, Koh ZX, Chua EC, Tan LM, Lin Z, Mirza B, et al. Risk scoring for prediction of acute cardiac complications from imbalanced clinical data. IEEE journal of biomedical and health informatics. 2014;18(6):1894-902.
225. Liu N, Koh ZX, Goh J, Lin Z, Haaland B, Ting BP, et al. Prediction of adverse cardiac events in emergency department patients with chest pain using machine learning for variable selection. BMC medical informatics and decision making. 2014;14(1):75.
226. Ong ME, Lee Ng CH, Goh K, Liu N, Koh ZX, Shahidah N, et al. Prediction of cardiac arrest in critically ill patients presenting to the emergency department using a machine learning score incorporating heart rate variability compared with the modified early warning score. Critical care (London, England). 2012;16(3):R108.
227. Park HO, Kim JW, Kim SH, Moon SH, Byun JH, Kim KN, et al. Usability verification of the Emergency Trauma Score (EMTRAS) and Rapid Emergency Medicine Score (REMS) in patients with trauma: A retrospective cohort study. Medicine. 2017;96(44):e8449-e.
228. Sbiti-Rohr D, Kutz A, Christ-Crain M, Thomann R, Zimmerli W, Hoess C, et al. The National Early Warning Score (NEWS) for outcome prediction in emergency department patients with community-acquired pneumonia: results from a 6-year prospective cohort study. BMJ open. 2016;6(9):e011021.
229. So SN, Ong CW, Wong LY, Chung JY, Graham CA. Is the Modified Early Warning Score able to enhance clinical observation to detect deteriorating patients earlier in an Accident & Emergency Department? Australasian emergency nursing journal : AENJ. 2015;18(1):24-32.
230. Urban RW, Mumba M, Martin SD, Glowicz J, Cipher DJ. Modified Early Warning System as a Predictor for Hospital Admissions and Previous Visits in Emergency Departments. Advanced emergency nursing journal. 2015;37(4):281-9.
Clinical & Cost-effectiveness of the National Early Warning System (NEWS): Systematic Review Update
Health Research Board – Collaboration in Ireland for Clinical Effectiveness Reviews
375
231. Wong J, Taljaard M, Forster AJ, Escobar GJ, van Walraven C. Derivation and validation of a model to predict daily risk of death in hospital. Medical Care. 2011;49(8):734-43.
232. Calvert J, Hoffman J, Barton C, Shimabukuro D, Ries M, Chettipally U, et al. Cost and mortality impact of an algorithm-driven sepsis prediction system. Journal of medical economics. 2017;20(6):646-51.
233. Bunkenborg G, Poulsen I, Samuelson K, Ladelund S, Akeson J. Mandatory early warning scoring-implementation evaluated with a mixed-methods approach. Applied Nursing Research. 2016;29(1):168-76.
234. Churpek MM, Snyder A, Sokol S, Pettit NN, Edelson DP. Investigating the Impact of Different Suspicion of Infection Criteria on the Accuracy of Quick Sepsis-Related Organ Failure Assessment, Systemic Inflammatory Response Syndrome, and Early Warning Scores. Critical Care Medicine. 2017;45(11):1805-12.
235. Colombo F, Taurino L, Colombo G, Amato M, Rizzo S, Murolo M, et al. The Niguarda MEWS, a new and refined tool to determine criticality and instability in Internal Medicine Ward and Emergency Medicine Unit. Italian Journal of Medicine. 2017;11(3):310-7.
236. Jones M, Neal C, Ngu W, Dennison A, Garcea G. Early warning score independently predicts adverse outcome and mortality in patients with acute pancreatitis. Langenbeck's Archives of Surgery. 2017;402(5):811-9.
237. Badreldin AMA, Doerr F, Bender EM, Bayer O, Brehm BR, Wahlers T, et al. Rapid clinical evaluation: An early warning cardiac surgical scoring system for hand-held digital devices*. European Journal of Cardio-thoracic Surgery. 2013;44(6):992-8.
238. Barbosa V, Gomes E, Vaz S, Azevedo G, Fernandes G, Ferreira A, et al. Failure to activate the in-hospital emergency team: causes and outcomes. Revista Brasileira De Terapia Intensiva. 2016;28(4):420-6.
239. Chen J, Bellomo R, Flabouris A, Hillman K, Assareh H, Ou L. Delayed emergency team calls and associated hospital mortality: A multicenter study. Critical Care Medicine. 2015;43(10):2059-65.
240. Cheung W. Outcomes following changing from a two-tiered to a three-tiered hospital rapid response system. Australian health review: a publication of the Australian Hospital Association. 2017.
241. Clifton L, Clifton DA, Pimentel MA, Watkinson PJ, Tarassenko L. Predictive monitoring of mobile patients by combining clinical observations with data from wearable sensors. IEEE journal of biomedical and health informatics. 2014;18(3):722-30.
242. Despins LA. Factors influencing when intensive care unit nurses go to the bedside to investigate patient related alarms: A descriptive qualitative study. Intensive & Critical Care Nursing. 2017;43:101-7.
243. Edelson DP, Retzer E, Weidman EK, Woodruff J, Davis AM, Minsky BD, et al. Patient acuity rating: quantifying clinical judgment regarding inpatient stability. J Hosp Med. 2011;6(8):475-9.
244. Hoikka M, Lankimaki S, Silfvast T, Ala-Kokko TI. Medical priority dispatch codes--comparison with National Early Warning Score.(Report). Scandinavian Journal of Trauma, Resuscitation and Emergency Medicine. 2016;24(1).
245. Hravnak M, Chen L, Dubrawski A, Bose E, Clermont G, Pinsky MR. Real alerts and artifact classification in archived multi-signal vital sign monitoring data: implications for mining big data. Journal Of Clinical Monitoring And Computing. 2016;30(6):875-88.

Clinical & Cost-effectiveness of the National Early Warning System (NEWS): Systematic Review Update
Health Research Board – Collaboration in Ireland for Clinical Effectiveness Reviews
376
246. Kabrhel C, Rosovsky R, Channick R, Jaff MR, Weinberg I, Sundt T, et al. A Multidisciplinary Pulmonary Embolism Response Team: Initial 30-Month Experience With a Novel Approach to Delivery of Care to Patients With Submassive and Massive Pulmonary Embolism. Chest. 2016;150(2):384-93.
247. Kvande M, Delmar C, Lykkeslet E, Storli SL. Foresight and awareness of incipient changes in a patient' clinical conditions -- Perspectives of intensive care nurses. Intensive & Critical Care Nursing. 2015;31(5):261-8.
248. Law BY-S, Chan EA. The experience of learning to speak up: a narrative inquiry on newly graduated registered nurses. Journal of Clinical Nursing. 2015;24(13/14):1837-48.
249. Paredes S, Rocha T, Mendes D, Carvalho P, Henriques J, Morais J, et al. New approaches for improving cardiovascular risk assessment. Revista Portuguesa De Cardiologia: Orgao Oficial Da Sociedade Portuguesa De Cardiologia = Portuguese Journal Of Cardiology: An Official Journal Of The Portuguese Society Of Cardiology. 2016;35(1):5-13.
250. Rosenberg DJ, Press A, Fishbein J, Lesser M, McCullagh L, McGinn T, et al. External validation of the IMPROVE Bleeding Risk Assessment Model in medical patients. Thrombosis And Haemostasis. 2016;116(3):530-6.
251. Schoenfeld AJ, Le HV, Marjoua Y, Leonard DA, Belmont PJ, Jr., Bono CM, et al. Assessing the utility of a clinical prediction score regarding 30-day morbidity and mortality following metastatic spinal surgery: the New England Spinal Metastasis Score (NESMS). The Spine Journal: Official Journal Of The North American Spine Society. 2016;16(4):482-90.
252. Suh E-S, Mandal S, Harding R, Ramsay M, Kamalanathan M, Henderson K, et al. Neural respiratory drive predicts clinical deterioration and safe discharge in exacerbations of COPD. Thorax. 2015:thoraxjnl-2015-207188.
253. Thompson JE, Collett LW, Langbart MJ, Purcell NJ, Boyd SM, Yuminaga Y, et al. Using the ISBAR handover tool in junior medical officer handover: A study in an Australian tertiary hospital. Postgraduate Medical Journal. 2011;87(1027):340-4.
254. Timóteo AT, Aguiar Rosa S, Nogueira MA, Belo A, Cruz Ferreira R. External validation of the ProACS score for risk stratification of patients with acute coronary syndromes. Revista Portuguesa De Cardiologia: Orgao Oficial Da Sociedade Portuguesa De Cardiologia = Portuguese Journal Of Cardiology: An Official Journal Of The Portuguese Society Of Cardiology. 2016;35(6):323-8.
255. Won Young K, Yu Jung S, Jin Mi L, Jin Won H, Younsuck K, Chae-Man L, et al. Modified Early Warning Score Changes Prior to Cardiac Arrest in General Wards. PLoS ONE. 2015;10(6):e0130523.
256. Bellomo R, Ackerman M, Bailey M, Beale R, Clancy G, Danesh V, et al. A controlled trial of electronic automated advisory vital signs monitoring in general hospital wards. Critical Care Medicine. 2012;40(8):2349-61.
257. Subbe CP, Kellett J, Whitaker CJ, Jishi F, White A, Price S, et al. A pragmatic triage system to reduce length of stay in medical emergency admission: feasibility study and health economic analysis. Eur J Intern Med. 2014;25(9):815-20.
258. Kostiuk S. Can Learning the ISBARR Framework Help to Address Nursing Students' Perceived Anxiety and Confidence Levels Associated With Handover Reports? The Journal Of Nursing Education. 2015;54(10):583-7.
259. Adelstein BA, Piza MA, Nayyar V, Mudaliar Y, Klineberg PL, Rubin G. Rapid response systems: A prospective study of response times. Journal of Critical Care. 2011;26(6):635.e11-.e18.

Clinical & Cost-effectiveness of the National Early Warning System (NEWS): Systematic Review Update
Health Research Board – Collaboration in Ireland for Clinical Effectiveness Reviews
377
260. Barwise A, Thongprayoon C, Gajic O, Jensen J, Herasevich V, Pickering BW. Delayed rapid response team activation is associated with increased hospital mortality, morbidity, and length of stay in a tertiary care institution. Critical Care Medicine. 2016;44(1):54-63.
261. Brown C, Drosdowsky A, Krishnasamy M. An exploration of medical emergency team intervention at the end of life for people with advanced cancer. European Journal of Oncology Nursing. 2017;31:77-83.
262. Capan M, Ivy JS, Wilson JR, Huddleston JM. A stochastic model of acute-care decisions based on patient and provider heterogeneity. Health Care Management Science. 2017;20(2):187-206.
263. Chen L, Dubrawski A, Wang D, Fiterau M, Guillame-Bert M, Bose E, et al. Using Supervised Machine Learning to Classify Real Alerts and Artifact in Online Multisignal Vital Sign Monitoring Data. Critical Care Medicine. 2016;44(7):e456-e63.
264. Cheung W, Sahai V, Mann-Farrar J, Skylas K, Uy J, Doyle B. Incidents resulting from staff leaving normal duties to attend medical emergency team calls. The Medical Journal Of Australia. 2014;201(9):528-31.
265. Considine J, Charlesworth D, Currey J. Characteristics and outcomes of patients requiring rapid response system activation within hours of emergency admission. Critical care and resuscitation : journal of the Australasian Academy of Critical Care Medicine. 2014;16(3):184-9.
266. De Freitas GF, Hoga LAK, Fernandes MdFP, GonzÁLez JS, Ruiz MCS, Bonini BB. Brazilian registered nurses' perceptions and attitudes towards adverse events in nursing care: a phenomenological study. Journal of Nursing Management. 2011;19(3):331-8.
267. Clifton DA, Clifton L, Sandu D-M, Smith GB, Tarassenko L, Vollam SA, et al. ‘Errors’ and omissions in paper-based early warning scores: the association with changes in vital signs—a database analysis. BMJ Open. 2015;5(7).
268. Downar J, Barua R, Rodin D, Lejnieks B, Gudimella R, McCredie V, et al. Changes in end of life care 5 years after the introduction of a rapid response team: A multicentre retrospective study. Resuscitation. 2013;84(10):1339-44.
269. Downar J, Rodin D, Barua R, Lejnieks B, Gudimella R, McCredie V, et al. Rapid response teams, do not resuscitate orders, and potential opportunities to improve end-of-life care: a multicentre retrospective study. Journal of Critical Care. 2013;28(4):498-503.
270. Hands C, Reid E, Meredith P, Smith GB, Prytherch DR, Schmidt PE, et al. Patterns in the recording of vital signs and early warning scores: compliance with a clinical escalation protocol. BMJ Quality & Safety. 2013;22(9):719-26.
271. Harris P. Early warning scores in cardiac arrest patients. British Journal of Cardiac Nursing. 2013;8(9):432-7.
272. Oglesby KJ, Durham L, Welch J, Subbe CP. 'Score to Door Time', a benchmarking tool for rapid response systems: a pilot multi-centre service evaluation. Critical Care. 2011;15(4):R180-R.
273. Pedersen N, Rasmussen L, Petersen J, Gerds T, Østergaard D, Lippert A. A critical assessment of early warning score records in 168,000 patients. Including a Specialty Section on Surgical Neuromonitoring. 2018;32(1):109-16.
274. Peebles E, Subbe CP, Hughes P, Gemmell L. Timing and teamwork--an observational pilot study of patients referred to a Rapid Response Team with the aim of identifying factors amenable to re-design of a Rapid Response System. Resuscitation. 2012;83(6):782-7.

Clinical & Cost-effectiveness of the National Early Warning System (NEWS): Systematic Review Update
Health Research Board – Collaboration in Ireland for Clinical Effectiveness Reviews
378
275. Petersen JA, Mackel R, Antonsen K, Rasmussen LS. Serious adverse events in a hospital using early warning score - what went wrong? Resuscitation. 2014;85(12):1699-703.
276. Tan LH, Delaney A. Medical emergency teams and end-of-life care: a systematic review. Critical care and resuscitation : journal of the Australasian Academy of Critical Care Medicine. 2014;16(1):62-8.
277. Aligawesa M, Marks-Maran D. Meeting physical health needs: The Modified Early Warning Score (MEWS) project. British Journal of Mental Health Nursing. 2017;6(2):73-80.
278. Alrawi YA, Parker RA, Harvey RC, Sultanzadeh SJ, Patel J, Mallinson R, et al. Predictors of early mortality among hospitalized nursing home residents. QJM : monthly journal of the Association of Physicians. 2013;106(1):51-7.
279. Arulvarathan C, Yuting D. A retrospective pilot study on patients who deteriorated while admitted to a neurovascular ward. British Journal of Neuroscience Nursing. 2017;13(6):282-7.
280. Austen C, Patterson C, Poots A, Green S, Weldring T, Bell D. Using a local early warning scoring system as a model for the introduction of a national system. Acute Medicine. 2012;11(2):66-73.
281. Ballangrud R, Hall-Lord ML, Persenius M, Hedelin B. Intensive care nurses' perceptions of simulation-based team training for building patient safety in intensive care: A descriptive qualitative study. Intensive & Critical Care Nursing. 2013;30(4):179-87.
282. Bardwell KD. Evaluation of the early warning system at banner desert medical center. https://arizona.openrepository.com/arizona/bitstream/10150/621108/1/azu_etd_14943_sip1_m.pdf, editor: The University of Arizona; 2016.
283. Brown S, Anderson MA, Hill PD. Rapid response team in a rural hospital. Clinical nurse specialist CNS. 2012;26(2):95-102.
284. Chalwin RP, Flabouris A. Utility and assessment of non-technical skills for rapid response systems and medical emergency teams. Internal medicine journal. 2013;43(9):962-9.
285. Christian Peter S, John Robert W. Failure to rescue: using rapid response systems to improve care of the deteriorating patient in hospital. Clinical Risk. 2013;19(1):6-11.
286. Churpek MM, Adhikari R, Edelson DP. The value of vital sign trends for detecting clinical deterioration on the wards. Resuscitation. 2016;102:1-5.
287. Cooper S, Beauchamp A, Bogossian F, Bucknall T, Cant R, DeVries B, et al. Managing patient deterioration: a protocol for enhancing undergraduate nursing students' competence through web-based simulation and feedback techniques. BMC Nursing. 2012;11(1):18-24.
288. Cooper SJ, Cant RP. Measuring non-technical skills of medical emergency teams: An update on the validity and reliability of the team emergency assessment measure (TEAM). Resuscitation. 2014;85(1):31-3.
289. De Silva AP, Sujeewa JA, De Silva N, Danapala Rathnayake RM, Vithanage L, Sigera PC, et al. A Retrospective Study of Physiological Observation-reporting Practices and the Recognition, Response, and Outcomes Following Cardiopulmonary Arrest in a Low-to-middle-income Country. Indian Journal of Critical Care Medicine. 2017;21(6):343-5.
290. Khurana HS, Groves RH, Jr., Simons MP, Martin M, Stoffer B, Kou S, et al. Real-Time Automated Sampling of Electronic Medical Records Predicts Hospital Mortality. The American Journal Of Medicine. 2016;129(7):688-98.e2.
291. Kolic I, Crane S, McCartney S, Perkins Z, Taylor A. Factors affecting response to national early warning score (NEWS). Resuscitation. 2015;90:85-90.

Clinical & Cost-effectiveness of the National Early Warning System (NEWS): Systematic Review Update
Health Research Board – Collaboration in Ireland for Clinical Effectiveness Reviews
379
292. LeGuen M, Ballueer Y, McKay R, Eastwood G, Bellomo R, Jones D, et al. Frequency and significance of qSOFA criteria during adult rapid response team reviews: A prospective cohort study. Resuscitation. 2018;122:13-8.
293. Lobo R, Lynch K, Casserly LF. Cross-sectional audit on the relevance of Elevated National Early Warning Score in medical patients at a Model 2 hospital in Ireland. Irish journal of medical science. 2015;184(4):893-8.
294. Ludikhuize J, Dongelmans DA, Smorenburg SM, Gans-Langelaar M, Jonge E, Rooij SE. How nurses and physicians judge their own quality of care for deteriorating patients on medical wards: Self-assessment of quality of care is suboptimal*. Critical Care Medicine. 2012;40(11):2982-6.
295. Maharaj R, Stelfox H, Stelfox HT. Rapid response teams improve outcomes: no. Intensive Care Medicine. 2016;42(4):596-8.
296. McClelland G. A retrospective observational study to explore the introduction of the National Early Warning Score in NEAS. Journal of Paramedic Practice. 2015;7(2):80-9.
297. McGinley A, Pearse RM. A national early warning score for acutely ill patients. BMJ (Online). 2012;345(7869).
298. Mok W, Wang W, Cooper S, Ang EN, Liaw SY. Attitudes towards vital signs monitoring in the detection of clinical deterioration: scale development and survey of ward nurses. International journal for quality in health care : journal of the International Society for Quality in Health Care. 2015;27(3):207-13.
299. Mora JC, Schneider A, Robbins R, Bailey M, Bebee B, Hsiao Y-FF, et al. Epidemiology of early Rapid Response Team activation after Emergency Department admission. Australasian Emergency Nursing Journal. 2016;19(1):54-61.
300. Nagammal S, Nashwan AJ, Nair SLK, Susmitha A. Nurses' perceptions regarding using the SBAR tool for handoff communication in a tertiary cancer center in Qatar. Journal of Nursing Education & Practice. 2017;7(4):103-10.
301. Nwulu U, Westwood D, Edwards D, Kelliher F, Coleman JJ. Adoption of an electronic observation chart with an integrated early warning scoring system on pilot wards: a descriptive report. Computers, informatics, nursing : CIN. 2012;30(7):371-9.
302. Parham G. Recognition and response to the clinically deteriorating patient. Australian Medical Student Journal. 2012;3:18-22.
303. Patel AR, Zadravecz FJ, Young RS, Williams MV, Churpek MM, Edelson DP. The value of clinical judgment in the detection of clinical deterioration. JAMA internal medicine. 2015;175(3):456-8.
304. Patel A, Hassan S, Ullah A, Hamid T, Kirk H. Early triaging using the Modified Early Warning Score (MEWS) and dedicated emergency teams leads to improved clinical outcomes in acute emergencies. Clinical medicine (London, England). 2015;15 Suppl 3:s3.
305. Psirides A, Hill J, Hurford S. A review of rapid response team activation parameters in New Zealand hospitals. Resuscitation. 2013;84(8):1040-4.
306. Purling A, King L. A literature review: Graduate nurses' preparedness for recognising and responding to the deteriorating patient. Journal of Clinical Nursing. 2012;21(23-24):3451-65.
307. Roasio A, Costanzo E, Cardellino S. The impact of rapid response team on epidemiology of in-hospital cardiac arrest: A 5-years observational study. Intensive Care Medicine Experimental. 2016;4.

Clinical & Cost-effectiveness of the National Early Warning System (NEWS): Systematic Review Update
Health Research Board – Collaboration in Ireland for Clinical Effectiveness Reviews
380
308. Romero-Brufau S, Huddleston JM, Escobar GJ, Liebow M. Why the C-statistic is not informative to evaluate early warning scores and what metrics to use. Critical Care. 2015;19(1):285.
309. Royal College of Physicians. National Early Warning Score (NEWS) 2: Standardising the assessment of acute-illness severity in the NHS. Updated report of a working party. London: RCP2017.
310. Ruiz Izquierdo J, Simón Pascua L, Martínez Pujol L, Sánchez González B, Figueras Solé G, Muñoz Gamito G, et al. The National Early Warning Score (NEWS) for outcome prediction in medical patients in emergency department with medical criteria of admission in medical ward: A pilot study. Intensive Care Medicine Experimental. 2017;5(2).
311. Sarani B. Accuracy of an expanded early warning score for patients in general and trauma surgery wards (Br J Surg 2012; 99: 192-197). The British journal of surgery. 2012;99(2):197-8.
312. Tirkkonen J, Olkkola KT, Huhtala H, Tenhunen J, Hoppu S. Medical emergency team activation: performance of conventional dichotomised criteria versus national early warning score. Acta Anaesthesiol Scand. 2014;58(4):411-9.
313. White K, Scott IA, Vaux A, Sullivan CM. Rapid response teams in adult hospitals: time for another look? Internal medicine journal. 2015;45(12):1211-20.
314. Yoder JC, Yuen TC, Churpek MM, Arora VM, Edelson DP. A prospective study of nighttime vital sign monitoring frequency and risk of clinical deterioration. JAMA internal medicine. 2013;173(16):1554-5.
315. Shearer B, Marshall S, Buist MD. What stops hospital clinical staff from following protocols? an analysis of the incidence and factors behind the failure of bedside clinical staff to activate the rapid response system in a multi-campus Australian metropolitan healthcare service. 2012.
316. Buykx P, Kinsman L, Cooper S, McConnell-Henry T, Cant R, Endacott R, et al. FIRST2ACT: educating nurses to identify patient deterioration - a theory-based model for best practice simulation education. Nurse education today. 2011;31(7):687-93.
317. Preece MH, Hill A, Horswill MS, Watson MO. Supporting the detection of patient deterioration: observation chart design affects the recognition of abnormal vital signs. Resuscitation. 2012;83(9):1111-8.
318. Alam N, Hobbelink EL, van Tienhoven AJ, van de Ven PM, Jansma EP, Nanayakkara PW. The impact of the use of the Early Warning Score (EWS) on patient outcomes: a systematic review. Resuscitation. 2014;85(5):587-94.
319. Jo S, Jeong T, Lee JB, Jin Y, Yoon J, Park B. Validation of modified early warning score using serum lactate level in community-acquired pneumonia patients. The National Early Warning Score–Lactate score. American Journal of Emergency Medicine. 2016;34(3):536-41.
320. Jong A, Jung B, Daurat A, Chanques G, Mahul M, Monnin M, et al. Effect of rapid response systems on hospital mortality: a systematic review and meta-analysis. Intensive Care Medicine. 2016;42(4):615-7.
321. Mapp ID, Davis LL, Krowchuk H. Prevention of unplanned intensive care unit admissions and hospital mortality by early warning systems. Dimensions of critical care nursing : DCCN. 2013;32(6):300-9.
322. McNeill G, Bryden D. Do either early warning systems or emergency response teams improve hospital patient survival? A systematic review. Resuscitation. 2013;84(12):1652-67.

Clinical & Cost-effectiveness of the National Early Warning System (NEWS): Systematic Review Update
Health Research Board – Collaboration in Ireland for Clinical Effectiveness Reviews
381
323. Roney JK, Whitley BE, Maples JC, Futrell LS, Stunkard KA, Long JD. Modified early warning scoring (MEWS): evaluating the evidence for tool inclusion of sepsis screening criteria and impact on mortality and failure to rescue. J Clin Nurs. 2015;24(23-24):3343-54.
324. Smith MEB, Chiovaro J, O'Neil M, Kansagara D, Quinones A, Freeman M, et al. Early Warning Scoring Systems: A Systematic Review VA-ESP Project #05-225: 2013.
325. Smith MEB, Chiovaro JC, O'Neil M, Kansagara D, Quiñones AR, Freeman M, et al. Early warning system scores for clinical deterioration in hospitalized patients: A systematic review. Annals of the American Thoracic Society. 2014;11(9):1454-65.
326. Solomon RS, Corwin GS, Barclay DC, Quddusi SF, Dannenberg MD. Effectiveness of rapid response teams on rates of in-hospital cardiopulmonary arrest and mortality: A systematic review and meta-analysis. Journal of Hospital Medicine. 2016;11(6):438-45.
327. Winters BD, Weaver SJ, Pfoh ER, Yang T, Pham JC, Dy SM. Rapid-response systems as a patient safety strategy: a systematic review. Annals of internal medicine. 2013;158(5 Pt 2):417-25.
328. Cardona-Morrell M, Prgomet M, Turner RM, Nicholson M, Hillman K. Effectiveness of continuous or intermittent vital signs monitoring in preventing adverse events on general wards: a systematic review and meta-analysis. International journal of clinical practice. 2016;70(10):806-24.
329. Maharaj R, Raffaele I, Wendon J. Rapid response systems: a systematic review and meta-analysis. Critical care (London, England). 2015;19:254.
330. Downey CL, Tahir W, Randell R, Brown JM, Jayne DG. Strengths and limitations of early warning scores: A systematic review and narrative synthesis. Int J Nurs Stud. 2017;76:106-19.
331. Leach LS, Mayo AM. Rapid response teams: qualitative analysis of their effectiveness. American Journal Of Critical Care: An Official Publication, American Association Of Critical-Care Nurses. 2013;22(3):198-210.
332. Smith DJ, Aitken LM. Use of a single parameter track and trigger chart and the perceived barriers and facilitators to escalation of a deteriorating ward patient: a mixed methods study. Journal of Clinical Nursing. 2016;25(1/2):175-85.
333. Stolldorf DP. The Benefits of Rapid Response Teams: Exploring Perceptions of Nurse Leaders, Team Members, and End Users. AJN American Journal of Nursing. 2016;116(3):38-47.
334. Vaughn JL, Kline D, Denlinger NM, Andritsos LA, Exline MC, Walker AR. Predictive performance of early warning scores in acute leukemia patients receiving induction chemotherapy. Leukemia and Lymphoma. 2017:1-3.
335. Beebe P, Bawel-Brinkley K, O'Leary-Kelley C. Observed and self-perceived teamwork in a rapid response team. Journal for nurses in staff development : JNSD : official journal of the National Nursing Staff Development Organization. 2012;28(4):191-7.
336. Boniatti MM, Azzolini N, Viana MV, Ribeiro BSP, Coelho RS, Castilho RK, et al. Delayed medical emergency team calls and associated outcomes. Critical Care Medicine. 2014;42(1):26-30.
337. Bucknall TK, Jones D, Bellomo R, Staples M. Responding to medical emergencies: System characteristics under examination (RESCUE). A prospective multi-site point prevalence study. Resuscitation. 2013;84(2):179-83.
338. Cabrini L, Monti G, Plumari VP, Landoni G, Turi S, Laura P, et al. Observed versus predicted hospital mortality in general wards patients assisted by a medical emergency team. Signa Vitae. 2012;7(1):38-42.

Clinical & Cost-effectiveness of the National Early Warning System (NEWS): Systematic Review Update
Health Research Board – Collaboration in Ireland for Clinical Effectiveness Reviews
382
339. Carmichael HA, Robertson E, Austin J, McCruden D, Messow CM, Belcher PR. A new approach to scoring systems to improve identification of acute medical admissions that will require critical care. Scottish Medical Journal. 2011;56(4):195-202.
340. Corfield AR, Lees F, Zealley I, Houston G, Dickie S, Ward K, et al. Utility of a single early warning score in patients with sepsis in the emergency department. Emergency Medicine Journal. 2013.
341. Correia N, Rodrigues RP, Sá MC, Dias P, Lopes L, Paiva A. Improving recognition of patients at risk in a Portuguese general hospital: results from a preliminary study on the early warning score. International Journal of Emergency Medicine. 2014;7(1).
342. Coventry C, Flabouris A, Sundararajan K, Cramey T. Rapid response team calls to patients with a pre-existing not for resuscitation order. Resuscitation. 2013;84(8):1035-9.
343. De Meester K, Haegdorens F, Monsieurs KG, Verpooten GA, Holvoet A, Van Bogaert P. Six-day postoperative impact of a standardized nurse observation and escalation protocol: A preintervention and postintervention study. Journal of Critical Care. 2013;28(6):1068-74.
344. Gordon CF, Beckett DJ. Significant deficiencies in the overnight use of a Standardised Early Warning Scoring system in a teaching hospital. Scott Med J. 2011;56(1):15-8.
345. Hammer JA, Jones TL, Brown SA. Rapid response teams and failure to rescue: One community's experience. Journal of nursing care quality. 2012;27(4):352-8.
346. Herrod PJJ, Barclay C, Blakey JD. Can mobile technology improve response times of junior doctors to urgent out-of-hours calls? A prospective observational study. QJM : monthly journal of the Association of Physicians. 2014;107(4):271-6.
347. Hughes C, Pain C, Braithwaite J, Hillman K. 'Between the flags': Implementing a rapid response system at scale. BMJ Quality and Safety. 2014;23(9):714-7.
348. Huh JW, Lim CM, Koh Y, Lee J, Jung YK, Seo HS, et al. Activation of a medical emergency team using an electronic medical recording-based screening system. Critical Care Medicine. 2014;42(4):801-8.
349. Jäderling G, Bell M, Martling CR, Ekbom A, Bottai M, Konrad D. ICU admittance by a rapid response team versus conventional admittance, characteristics, and outcome. Critical Care Medicine. 2013;41(3):725-31.
350. Jäderling G, Bell M, Martling CR, Ekbom A, Konrad D. Limitations of medical treatment among patients attended by the rapid response team. Acta Anaesthesiologica Scandinavica. 2013;57(10):1268-74.
351. Jäderling G, Calzavacca P, Bell M, Martling CR, Jones D, Bellomo R, et al. The deteriorating ward patient: A Swedish-Australian comparison. Intensive Care Medicine. 2011;37(6):1000-5.
352. Jenkins PF, Thompson CH, Barton LL. Clinical deterioration in the condition of patients with acute medical illness in Australian hospitals: Improving detection and response. Medical Journal of Australia. 2011;194(11):596-8.
353. Jonsson T, Jonsdottir H, Möller AD, Baldursdottir L. Nursing documentation prior to emergency admissions to the intensive care unit. Nursing in critical care. 2011;16(4):164-9.
354. Johnson M, Jefferies D, Nicholls D. Developing a minimum data set for electronic nursing handover. Journal of Clinical Nursing. 2012;21(3-4):331-43.
355. Jones D, Drennan K, Hart GK, Bellomo R, Steven AR. Rapid Response Team composition, resourcing and calling criteria in Australia. Resuscitation. 2012;83(5):563-7.
356. Jones D, Moran J, Winters B, Welch J. The rapid response system and end-of-life care. Current Opinion in Critical Care. 2013;19(6):616-23.

Clinical & Cost-effectiveness of the National Early Warning System (NEWS): Systematic Review Update
Health Research Board – Collaboration in Ireland for Clinical Effectiveness Reviews
383
357. Jones DA, Drennan K, Bailey M, Hart GK, Bellomo R, Webb SAR, et al. Mortality of rapid response team patients in Australia: A multicentre study. Critical Care and Resuscitation. 2013;15(4):273-8.
358. Kabrhel C, Okechukwu I, Hariharan P, Takayesu JK, MacMahon P, Haddad F, et al. Factors associated with clinical deterioration shortly after PE. Thorax. 2014;69(9):835-42.
359. Karra V, Papathanassoglou ED, Lemonidou C, Sourtzi P, Giannakopoulou M. Exploration and classification of intensive care nurses' clinical decisions: a Greek perspective. Nursing in critical care. 2014;19(2):87-97.
360. Kaufman M, Bebee B, Bailey J, Robbins R, Hart GK, Bellomo R. Laboratory tests to identify patients at risk of early major adverse events: A prospective pilot study. Internal medicine journal. 2014;44(10):1005-12.
361. Kegler AL, Dale BD, McCarthy AJ. The use of high-fidelity simulation for rapid response team training: a community hospital's story. Journal for nurses in staff development : JNSD : official journal of the National Nursing Staff Development Organization. 2012;28(2):50-2.
362. Kellett J, Kim A. Validation of an abbreviated Vitalpac™ Early Warning Score (ViEWS) in 75,419 consecutive admissions to a Canadian Regional Hospital. Resuscitation. 2012;83(3):297-302.
363. Kellett J, Murray A. How to follow the NEWS. Acute Medicine. 2014;13(3):104-7. 364. Kellett J, Wang F, Woodworth S, Huang W. Changes and their prognostic implications in the
abbreviated VitalPAC™ Early Warning Score (ViEWS) after admission to hospital of 18,827 surgical patients. Resuscitation. 2013;84(4):471-6.
365. Khalid I, Qabajah MR, Hamad WJ, Khalid TJ, DiGiovine B. Outcome of hypotensive ward patients who re-deteriorate after initial stabilization by the Medical Emergency Team. Journal of Critical Care. 2014;29(1):54-9.
366. Kollef MH, Chen Y, Heard K, Larossa GN, Lu C, Martin NR, et al. A randomized trial of real-time automated clinical deterioration alerts sent to a rapid response team. Journal of Hospital Medicine. 2014;9(7):424-9.
367. Kwak HJ, Yun I, Kim SH, Sohn JW, Shin DH, Yoon HJ, et al. The extended rapid response system: 1-year experience in a university hospital. Journal of Korean medical science. 2014;29(3):423-30.
368. Kyriacos U, Jelsma J, Jordan S. Monitoring vital signs using early warning scoring systems: A review of the literature. Journal of Nursing Management. 2011;19(3):311-30.
369. Laurens N, Dwyer T. The impact of medical emergency teams on ICU admission rates, cardiopulmonary arrests and mortality in a regional hospital. Resuscitation. 2011;82(6):707-12.
370. Lim SY, Park SY, Park HK, Kim M, Park HY, Lee B, et al. Early impact of medical emergency team implementation in a country with limited medical resources: A before-and-after study. Journal of Critical Care. 2011;26(4):373-8.
371. Lin LC, Lee TH, Chang CH, Chang YJ, Liou CW, Chang KC, et al. Predictors of clinical deterioration during hospitalization following acute ischemic stroke. European Neurology. 2012;67(3):186-92.
372. Lin LC, Yang JT, Weng HH, Hsiao CT, Lai SL, Fann WC. Predictors of early clinical deterioration after acute ischemic stroke. American Journal of Emergency Medicine. 2011;29(6):577-81.
373. Lovett PB, Massone RJ, Holmes MN, Hall RV, Lopez BL. Rapid response team activations within 24 hours of admission from the emergency department: An innovative approach for performance improvement. Academic Emergency Medicine. 2014;21(6):667-72.

Clinical & Cost-effectiveness of the National Early Warning System (NEWS): Systematic Review Update
Health Research Board – Collaboration in Ireland for Clinical Effectiveness Reviews
384
374. Ludikhuize J, Smorenburg SM, de Rooij SE, de Jonge E. Identification of deteriorating patients on general wards; measurement of vital parameters and potential effectiveness of the Modified Early Warning Score. J Crit Care. 2012;27(4):424.e7-13.
375. Ludikhuize J, Hamming A, de Jonge E, Fikkers BG. Rapid response systems in The Netherlands. Joint Commission journal on quality and patient safety / Joint Commission Resources. 2011;37(3):138-44, 97.
376. Medical Emergency Team End-of-Life Care i. The timing of Rapid-Response Team activations: a multicentre international study. Critical care and resuscitation : journal of the Australasian Academy of Critical Care Medicine. 2013;15(1):15-20.
377. Menees SB, Elliott E, Govani S, Anastassiades C, Schoenfeld P. Adherence to recommended intervals for surveillance colonoscopy in average-risk patients with 1 to 2 small (<1 cm) polyps on screening colonoscopy. Gastrointestinal Endoscopy. 2014;79(4):551-7.
378. Mitchell IA, Kulh M, McKay H. Use of the modified early warning score in emergency medical units. Medical Journal of Australia. 2011;195(8):448.
379. Mohammed MA, Rudge G, Watson D, Wood G, Smith GB, Prytherch DR, et al. Index Blood Tests and National Early Warning Scores within 24 Hours of Emergency Admission Can Predict the Risk of In-Hospital Mortality: A Model Development and Validation Study. PLoS ONE. 2013;8(5).
380. Morris DS, Schweickert W, Holena D, Handzel R, Sims C, Pascual JL, et al. Differences in outcomes between ICU attending and senior resident physician led medical emergency team responses. Resuscitation. 2012;83(12):1434-7.
381. Neary PM, Regan M, Joyce MJ, McAnena OJ, Callanan I. National early warning score (NEWS) – evaluation in surgery. International Journal of Health Care Quality Assurance. 2015;28(3):245-52.
382. Nelson JL, Smith BL, Jared JD, Younger JG. Prospective trial of real-time electronic surveillance to expedite early care of severe sepsis. Annals of emergency medicine. 2011;57(5):500-4.
383. Niegsch M, Fabritius ML, Anhøj J. Imperfect Implementation of an Early Warning Scoring System in a Danish Teaching Hospital: A Cross-Sectional Study. PLoS ONE. 2013;8(7).
384. Omar Y. Avoiding medical emergencies. British Dental Journal. 2013;214(5):255-9. 385. Orosz J, Bailey M, Bohensky M, Gold M, Zalstein S, Pilcher D. Deteriorating patients managed
with end-of-life care following Medical Emergency Team calls. Internal medicine journal. 2014;44(3):246-54.
386. Patterson C, Maclean F, Bell C, Mukherjee E, Bryan L, Woodcock T, et al. Early warning systems in the UK: Variation in content and implementation strategy has implications for a NHS early warning system. Clinical Medicine, Journal of the Royal College of Physicians of London. 2011;11(5):424-7.
387. Randmaa M, Mårtensson G, Leo Swenne C, Engström M. SBAR improves communication and safety climate and decreases incident reports due to communication errors in an anaesthetic clinic: a prospective intervention study. BMJ Open. 2014;4(1):e004268-e.
388. Ritter G, Johnson T, Walden H, Sharma C, Corley A, Ravikumar TS, et al. Comparison of Two Rapid Response Teams Models: Reduction of Rapid Response Triggers and Cardiac Arrests by the Continuum of Care Model Compared With Traditional Rapid Response Team. ICU Director. 2013;4(1):6-10.
389. Smith RJ, Santamaria JD, Reid DA, Faraone EE. The mortality associated with review by the rapid response team for non-arrest deterioration: a cohort study of acute hospital adult

Clinical & Cost-effectiveness of the National Early Warning System (NEWS): Systematic Review Update
Health Research Board – Collaboration in Ireland for Clinical Effectiveness Reviews
385
patients. Critical care and resuscitation : journal of the Australasian Academy of Critical Care Medicine. 2014;16(2):119-26.
390. Smith RL, Hayashi VN, Lee YI, Navarro-Mariazeta L, Felner K. The medical emergency team call: A sentinel event that triggers goals of care discussion. Critical Care Medicine. 2014;42(2):322-7.
391. Subbe CP, Welch JR. Failure to rescue : using rapid response systems to improve care of the deteriorating patient in hospital. 2013.
392. Westphal GA, Koenig Á, Caldeira Filho M, Feijó J, de Oliveira LT, Nunes F, et al. Reduced mortality after the implementation of a protocol for the early detection of severe sepsis. Journal of Critical Care. 2011;26(1):76-81.
393. Burger D, Jordan S, Kyriacos U. Validation of a modified early warning score-linked Situation-Background-Assessment-Recommendation communication tool: A mixed methods study. Journal of Clinical Nursing. 2017;26(17/18):2794-806.
394. D. K T, M. R S, I L. Correlation of Coagulopathy of Trauma and Revised Trauma Score in Predicting Outcome in Trauma Patients. Journal of Institute of Medicine. 2016;38(2/3):105-11.
395. Kyriacos U, Jelsma J, Jordan S. Record review to explore the adequacy of post-operative vital signs monitoring using a local modified early warning score (mews) chart to evaluate outcomes. PLoS One. 2014;9(1):e87320.
396. Naidoo DK, Rangiah S, Naidoo SS. An evaluation of the Triage Early Warning Score in an urban accident and emergency department in KwaZulu-Natal. South African Family Practice. 2014;56(1):69-73.
397. Kim WY, Shin YJ, Lee JM, Huh JW, Koh Y, Lim C-M, et al. Modified Early Warning Score Changes Prior to Cardiac Arrest in General Wards. PLoS ONE. 2015;10(6):e0130523.
398. Sok Ying L, Lai Fun W, Bee Leng Ang S, Tze Yin Ho J, Chiang S, Neo Kim Ang E. Strengthening the afferent limb of rapid response systems: an educational intervention using web-based learning for early recognition and responding to deteriorating patients. BMJ quality & safety. 2016;25(6):448-56.
399. Lee JR, Choi HR. Validation of a modified early warning score to predict ICU transfer for patients with severe sepsis or septic shock on general wards. Journal of Korean Academy of Nursing. 2014;44(2):219-27.
400. Manozzo Boniatti M. Advances in performance, more benefits... the perspectives of rapid response teams. Avanços na atuação, mais benefícios as perspectivas dos times de resposta rápida. 2016;28(3):217-9.
401. Taguti Pd.a S, Dotti AZ, de Araujo KP, de Pariz PS, Dias GF, Kauss IA, et al. The performance of a rapid response team in the management of code yellow events at a university hospital. Revista Brasileira de terapia intensiva. 2013;25(2):99-105.
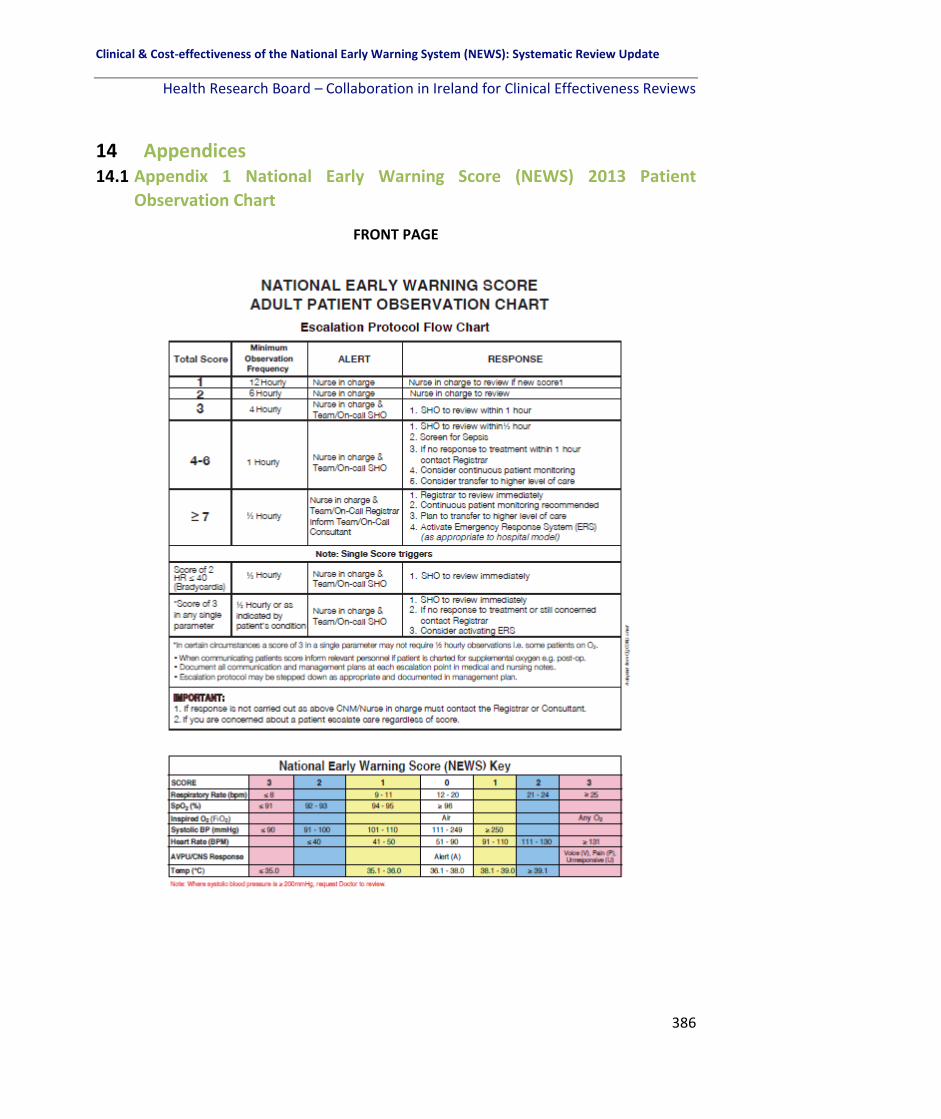
Clinical & Cost-effectiveness of the National Early Warning System (NEWS): Systematic Review Update
Health Research Board – Collaboration in Ireland for Clinical Effectiveness Reviews
386
14 Appendices 14.1 Appendix 1 National Early Warning Score (NEWS) 2013 Patient
Observation Chart
FRONT PAGE

Clinical and Cost-effectiveness of the National Early Warning System (NEWS): A Systematic Review Update
387
14.1 Appendix 1 National Early Warning Score (NEWS) 2013 Patient
Observation Chart (continued)
MIDDLE PAGES

Clinical and Cost-effectiveness of the National Early Warning System (NEWS): A Systematic Review Update
388
14.1 Appendix 1 National Early Warning Score (NEWS) 2013 Patient
Observation Chart (continued)
BACK PAGE

Clinical and Cost-effectiveness of the National Early Warning System (NEWS): A Systematic Review Update
389
14.2 Appendix 2 Search Strategy for Systematic Review
PICO Framework
Broad Areas
Specific search terms Inclusion criteria Exclusion criteria
Population Adult patient. Specific sub-populations for Q5
No specifically applied search terms. “chronic respiratory conditions” OR “chronic hypoxia” OR “chronic hypoxaemia” OR “chronic hypoxemia” OR “chronic physiological abnormalities” OR “chronic obstructive pulmonary disease” OR “COPD” OR “pulmonary fibrosis” or “frail elderly” OR “frail elderly or aged or elderly” OR “frailty in elderly people” OR “frail older adult”.
Adult acute patient (i.e. ≥16 years of age) (cared for within an acute hospital).
Pre-hospital settings, Community Settings, Patients with intellectual disability or psychiatric disorders cared for outside of the acute hospital setting, Acute Care (paediatric patients, obstetric patients, emergency department patients, DNR patients).
Intervention Early Warning Scoring System(s).
“Detection of deterioration” OR “clinical deterioration” OR “identification of deterioration” OR “physiological scoring system” OR “risk assessment report” OR “emergency response system” OR “early warning” OR “warning system” OR “warning scor*” OR “failure to rescue” OR “vital sign” OR “electronic system” OR “tablet” OR “iPad” OR “escalation protocol” OR “communication” OR “response” OR “VIEWS” OR “NEWS” OR “medical emergency team” OR “rapid response team” OR “rapid response system” OR “emergency response system” OR “emergency response team”. CINAHL BP “detection of deterioration” SH “patient safety”, “nursing assessment, “critical care”. MEDLINE “risk assessment/methods”) OR “point-of care systems”) OR “monitoring, Physiologic/ methods”(208). Named Systems (in ) “Early warning system” OR “early warning score” OR “modified early warning score” OR “MEWS” OR “VitalPAC” OR “track and trigger system” OR “Worthing” OR “SBAR” OR “situation, background, assessment, recommendation” OR “situation, background, assessment and recommendation” OR “ISBAR” OR “Identify, Situation, Background, Assessment and Recommendation” OR “Identify, Situation, Background, Assessment, Recommendation” OR “Manchester triage system” OR “biosignTM”, “Patient at Risk” OR “PAR score” OR “Physiological Scoring System” OR “Vital Sign Score” OR “Physiological Observation Track and Trigger System” OR “Between the flags”.
Studies which address the effectiveness of EWSs or track and trigger systems that have been developed to facilitate early detection of deterioration and escalation of care. Papers will be included if the principal focus of the paper and its results is on evaluating the effectiveness of the NEWS or validating the use of the NEWS in the clinical context.
EWSs or track and trigger system not suitable for measurement and reporting of acute clinical deterioration in the acute health care context. Studies which deal exclusively with the early development of an EWS or track and trigger system. Clinical studies which examine health care professionals’ responses to fictional/hypothe-tical cases e.g. vignettes.
Education program.
Education program (in Title/Abstract) “ALERT™” OR “COMPASS©” OR “Education” OR “Program*” OR “Training” OR “Course” OR “Mode of delivery” or “Online delivery” Or “face-to-face delivery”
Studies which address the effectiveness of education programmes that are used to educate/train registered healthcare professionals in relation to EWSs or track and trigger systems.
Studies which describe the development of education programmes used to educate/train healthcare professionals in relation to EWSs, with no outcome evaluation

Clinical and Cost-effectiveness of the National Early Warning System (NEWS): A Systematic Review Update
390
presented.
Economic literature
“economics” or “cost* and benefit” OR “cost analysis” OR “cost management” OR “cost saving” OR “escalation cost*” OR “additional resources” OR “cost effectiveness” OR “education” OR “resources”
Economic evaluation studies, costing studies and systematic reviews relating to EWSs.
Parameter adjustment in specific sub-populations
“Physiological parameter adjustment” OR “parameter adjustment” OR “parameter variance” OR “parameter amendment” OR “medical variance” OR “medical escalation suspension” OR “triggering thresholds” OR “activation thresholds” OR “EWS thresholds” OR “CREWS” OR “Chronic Respiratory Early Warning Score”
Studies which address the effectiveness of EWSs or track and trigger systems that have been developed to facilitate early detection of deterioration and escalation of care in specific sub-populations including frail older adults and patients with COPD with an emphasis on parameter adjustment.
EWS or track and trigger system not suitable for measurement and reporting of acute clinical deterioration in the acute health care context. Studies which deal exclusively with the early development of an EWS or track and trigger system. Clinical studies which examine health care professionals’ responses to fictional/hypothetical cases e.g. vignettes.
Why HCPs fail to escalate as per EWS protocol
“Failure to escalate” OR “fail to escalate” OR “non-adherence to EWS escalation protocol” OR “qualitative” OR “ethnography” OR “phenomenology” OR “grounded theory” OR “mixed methods” OR “study design” OR “interview” OR “attitudes” OR “themes”.
Qualitative studies which address why HCPs fail to escalate as per the NEWS protocol
Qualitative studies (e.g. open-ended survey questions) where the responses are analysed using descriptive statistics.
Comparison Compar-ison against another interven-tion or with no interve-ntion
No specific search terms. Studies looking at early warning systems and their implementation, clinical validation.
Outcome No specific search criteria If no outcome data are presented studies will not be included.
Setting No specific terms.
No specific search criteria. Acute hospital setting in countries categorised as either very high or high human development index (UNDP 2015).
Non-acute settings, Acute hospital setting in countries categorised as either medium or low Human Development Index (UNDP 2015)
Publication type/level of evidence
Databases searched We will search relevant health and psychosocial databases including Academic Search Complete, CINAHL (the
Time: Publication date within timeframe of Nov 2015.
Publication quality: Publication of
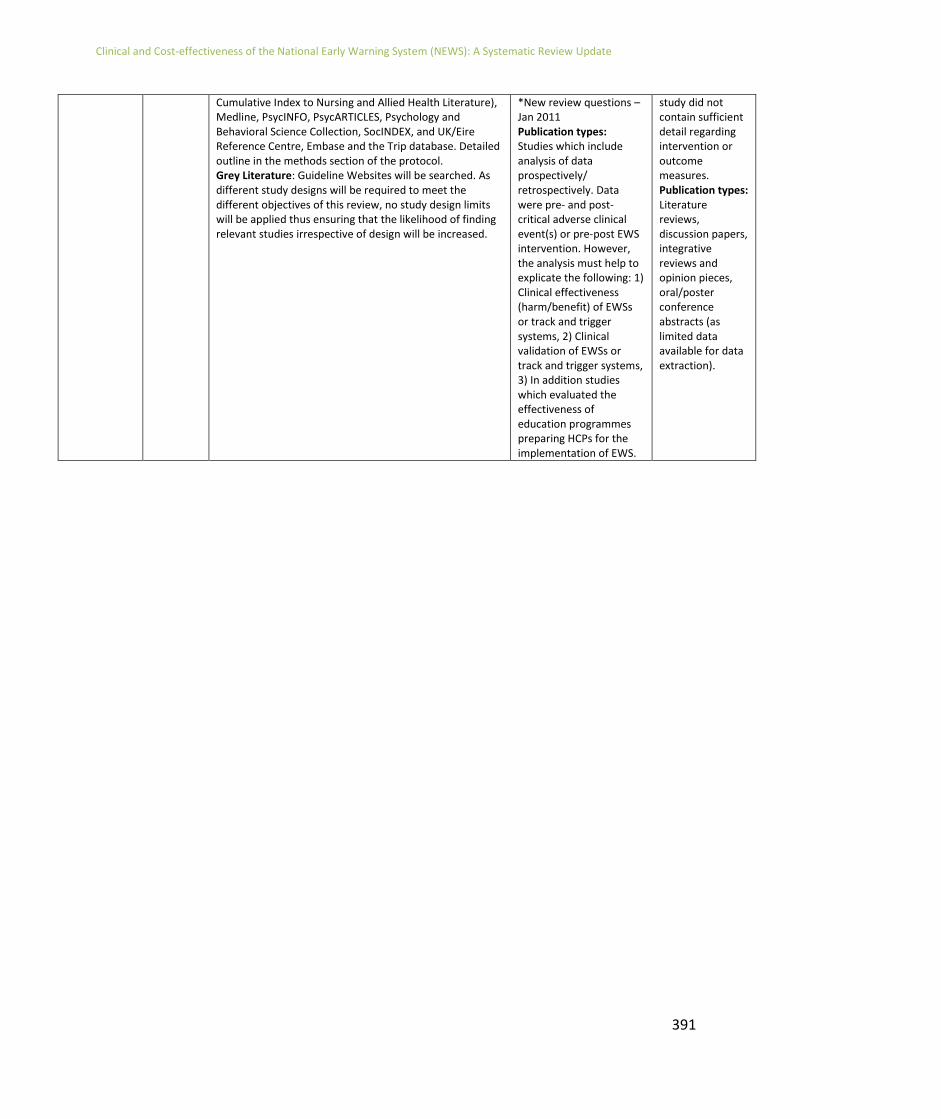
Clinical and Cost-effectiveness of the National Early Warning System (NEWS): A Systematic Review Update
391
Cumulative Index to Nursing and Allied Health Literature), Medline, PsycINFO, PsycARTICLES, Psychology and Behavioral Science Collection, SocINDEX, and UK/Eire Reference Centre, Embase and the Trip database. Detailed outline in the methods section of the protocol. Grey Literature: Guideline Websites will be searched. As different study designs will be required to meet the different objectives of this review, no study design limits will be applied thus ensuring that the likelihood of finding relevant studies irrespective of design will be increased.
*New review questions – Jan 2011 Publication types: Studies which include analysis of data prospectively/ retrospectively. Data were pre- and post-critical adverse clinical event(s) or pre-post EWS intervention. However, the analysis must help to explicate the following: 1) Clinical effectiveness (harm/benefit) of EWSs or track and trigger systems, 2) Clinical validation of EWSs or track and trigger systems, 3) In addition studies which evaluated the effectiveness of education programmes preparing HCPs for the implementation of EWS.
study did not contain sufficient detail regarding intervention or outcome measures. Publication types: Literature reviews, discussion papers, integrative reviews and opinion pieces, oral/poster conference abstracts (as limited data available for data extraction).

Clinical and Cost-effectiveness of the National Early Warning System (NEWS): A Systematic Review Update
392
14.3 Appendix 3 Grey Literature Databases Searched
Databases:
▪ OpenGrey System for Information on Grey Literature in Europe
(http://www.opengrey.eu/)
▪ Open University Dedicated Grey Literature site (http://www.open.ac.uk/library/)
▪ Education Resources Information Center (ERIC) database
(https://eric.ed.gov/)
▪ GrayLit Network (via Science.Gov as it was discontinued in 2007 and archived in
Science.Gov)
(https://www.science.gov/)
▪ Networked Digital Library of Theses.
(http://www.ndltd.org/)
Websites:
▪ Agency for Healthcare Research and Quality (https://www.ahrq.gov/)
▪ Andalusian Agency for Health Technology Assessment (AETSA) (http://www.inahta.org/)
▪ Association of Anaesthetists of Great Britain and Ireland (https://www.aagbi.org/)
▪ Australian National Health and Medical Research Council Clinical Practice Guidelines (https://www.nhmrc.gov.au/)
▪ Belgian Health Care Knowledge Centre (https://kce.fgov.be/en)
▪ Canadian Medical Association InfoBase of Clinical Practice Guidelines (https://www.cma.ca/En/Pages/clinical-practice-guidelines.aspx)
▪ eGuidelines (UK) (https://www.guidelines.co.uk/)
▪ Danish Health Authority/Danish Secretariat for Clinical Guidelines (https://www.sst.dk/en/national-clinical-guidelines)
▪ European Society of Intensive Care Medicine (https://www.esicm.org/)
▪ Finnish Medical Society Duodecim (https://www.duodecim.fi/english/)
▪ Geneva Foundation for Medical Education and Research (https://www.gfmer.ch/)
▪ Guidelines International Network (GIN) (http://www.g-i-n.net/)
▪ German Institute of Medical Documentation and Information

Clinical and Cost-effectiveness of the National Early Warning System (NEWS): A Systematic Review Update
393
(https://www.dimdi.de/static/en/index.html)
▪ Haute Autorité de santé (https://www.has-sante.fr/portail/jcms/r_1455081/Home-page)
▪ Institute for Healthcare Improvement (USA) (http://www.ihi.org/)
▪ Intensive Care Society (https://www.ics.ac.uk/)
▪ Intensive Care Society of Ireland (http://www.intensivecare.ie/)
▪ Intensive Care National Audit & Research Centre (https://www.icnarc.org/)
▪ Japan Council for Quality Health Care (https://jcqhc.or.jp/en/)
▪ National Institute for Health and Clinical Excellence (NICE) (https://www.nice.org.uk/)
▪ National Library for Health (NLH) Guidelines Finder/National Library for Health (NLH) Protocols and Care Pathways database (archived 2008) (http://webarchive.nationalarchives.gov.uk/20081113053157/https://www.library.nhs.uk/GuidelinesFinder/AboutUs.aspx)
▪ National Guideline Clearinghouse (USA) (https://www.guideline.gov/)
▪ NCEC (National Clinical Effectiveness Committee, Ireland) (http://health.gov.ie/national-patient-safety-office/ncec/national-clinical-guidelines/)
▪ New Zealand Guidelines Group (https://www.health.govt.nz/)
▪ NHS Evidence database (UK) (https://www.evidence.nhs.uk/)
▪ NHS Institute for Innovation and Improvement (ceased in 2013) (https://www.gov.uk/government/organisations/nhs-institute-for-innovation-and-improvement)
▪ Royal College of Physicians (https://www.rcplondon.ac.uk/)
▪ Royal College of Surgeons (https://www.rcseng.ac.uk/)
▪ The Royal College of Anaesthetists (https://www.rcoa.ac.uk/)
▪ Royal College of Nursing (https://www.rcn.org.uk/)
▪ Scottish Intensive Care Society (https://www.scottishintensivecare.org.uk/)
▪ Singapore Ministry of Health (https://www.moh.gov.sg/content/moh_web/home.html)

Clinical and Cost-effectiveness of the National Early Warning System (NEWS): A Systematic Review Update
394
▪ Socialstyrelsen (Health and Medical Care and Social Services, Sweden) (http://www.socialstyrelsen.se)
▪ Society of Critical Care Medicine (USA) (http://www.sccm.org/)
▪ TRIP Database (https://www.tripdatabase.com/)
▪ World Health Organization (http://www.who.int/en/).

Clinical and Cost-effectiveness of the National Early Warning System (NEWS): A Systematic Review Update
395
14.4 Appendix 4 Studies excluded after full text review
Reason for exclusion Study reference
Irrelevant population (n=28) (209) (210-217) (218-236)
Irrelevant intervention (n=23) (208, 237-258)
Irrelevant outcome (n=18) (259-276)
Irrelevant study design (n=62) (6, 9, 160, 232, 277-334)
Published prior to 2015 (n=62) (130, 134, 177, 188, 335-392)
Medium or low HDI country (n=4) (393-396)
Duplicate (n=3) (172, 397, 398)
Foreign language (n=3) (399-401)

Clinical and Cost-effectiveness of the National Early Warning System (NEWS): A Systematic Review Update
396
14.5 Appendix 5 EWS weightings and scores according to study
Study (Year) EWS Score Trigger score
3 2 1 0 1 2 3
Abbott (2015)
NEWS
Temperature <35.0 35.1-36.0 36.1-38.0 38.1-39.0 >39.0 Scores of greater than 5 (or 3 in any one parameter) trigger an urgent medical review. A score of over 7 triggers a review by a CCOT.
HR <41 41-50 51-90 91-110 111-130 >130
SBP <91 91-100 101-110 111-219 >219
RR <9 9-11 12-20 21-24 >25
SpO2 <92 92-93 94-95 >96
FiO2 YES NO
AVPU A V,P,U
PARS
Temperature <35.0 35-35.9 36-37.4 37.5-38.4 >38.5 Scores of 3 and 5 trigger reviews by the medical team or CCOT respectively.
HR <40 40-49 50-99 100-114 115-129 >130
SBP <70 70-79 80-89 100-179 >180
RR <10 10-19 20-29 30-39 >40
SpO2 <85 85-89 90-94 >95
AVPU Confused A V P U
Urine output Nil <0.5 Dialysis <0.5-3 >3
Albert (2011) MEWS
HR <40 41-50 51-120 121-139 >140 A MEWS score of 3 or more triggered staff referral to the RRT.
SBP <75 75-79 80-89 90-140 141-160 161-180
RR <8 9-11 12-20 21-25 26-30 >30
Temperature <96.1 97.1-97.9 96.1-97 >100.9
SpO2 ≤85 86-89 90-91 ≥92
Urine output <20 20-30 31-199 >200
Other Difficulty breathing, increased supplemental oxygen, altered level of consciousness, WBC, new focal weakness and staff/family concerns also criteria included in the electronic health record.
Badriyah (2014)
DTEWS
RR <18 19-20 21-24 ≥25 Not reported.
SpO2 ≤89 90-92 93-94 95-99 100
FiO2 No Yes
Temperature ≤35.8 35.9-36.0 36.1-36.4 36.5-37.1 37.2-37.9 ≥38.0
SBP ≤89 90-116 117-272 ≥273
HR ≤38 39-46 47-89 90-100 ≥101
AVPU A V, P, U
NEWS
RR <8 9-11 12-20 21-24 ≥25 Not reported.
SpO2 ≤91 92-93 94-95 ≥96
FiO2 No Yes
Temperature ≤35.0 35.1-36.0 36.1-38.0 38.1-39.0 ≥39.1
SBP ≤90 91-100 101-110 111-219 ≥220
HR ≤40 41-50 51-90 91-110 111-130 ≥131
AVPU A V, P, U
Bian (2015) Super Score
SpO2 99-100 95-98 ≤94 0–1 point, low-risk; 2–3 points, intermediate risk; 4–5 points, high risk; 6–10 points, extremely high risk.
Urine volume >50 30-50 ≤30
HR >140 90-140 <90
Emotion 0 - / -- +
RR ≥30 20-30 <20
MEWS
SBP <70 71-80 81-100 101-199 ≥200 Not reported in this study.
HR <40 41-50 51-100 101-110 111-129 ≥130
RR <9 9-14 15-20 21-29 ≥30
Temperature <35 35-38.4 ≥38.5
AVPU A V P U

Clinical and Cost-effectiveness of the National Early Warning System (NEWS): A Systematic Review Update
397
14.5 Appendix 5 – EWS weightings and scores according to study
Study (Year) EWS Score Trigger score
3 2 1 0 1 2 3
Bleyer (2011) Critical vital sign scoring EWS
SBP <85 The occurrence of any critical vital sign derangement or HCP concern that patients were unstable.
HR >120
Temperature <35 or >38.9
SpO2 <91%
RR ≤12 or ≥24
AVPU V, P, U A
Age >80 70-80 60-69
Bunkenborg (2014)
MEWS
RR <9 9-14 15-20 21-29 ≥30 MEWs score ≥5: follow algorithm for bedside action, call physician on-call, re-observe and re-score, call MET.
HR <40 41-50 51-100 101-110 111-129 ≥130
BP <70 71-80 81-100 101-199 ≥200
AVPU A V P U
Temperature <35 35-38.4 ≥38.5
SpO2 ≤95: supply oxygen to patient; ≤ 90: despite oxygen supply call MET and physician on-call
Capan (2015) NEWS
RR ≤8 9-11 12-20 21-24 ≥25 A score of 7 initiates RRT activation. SpO2 ≤91 92-93 94-95 ≥96
FiO2 No Yes
Temperature <35.0 35.1-36.0 36.1-38.0 38.1-39.0 ≥39.1
SBP ≤90 91-100 101-110 111-219 ≥220
HR ≤40 41-50 51-90 91-110 111-130 ≥131
AVPU A V, P, U
Churpek (2013)
MEWS
RR <9 9-14 15-20 21-29 >29 Not reported in paper.
HR <40 41-50 51-100 101-110 111-129 >129
SBP <70 71-80 81-100 101-199 >199
Temperature <35 35-38.4 >38.4
AVPU A V P U
ViEWS
RR <9 9-11 12-20 21-24 >24 Not reported in paper.
SpO2 <92 92-93 94-95 96-100
FiO2 No Yes
HR <41 41-50 51-90 91-110 111-130 >130
SBP <90 91-100 101-110 111-249 >249
Temperature <35.1 35.1-36 36.1-38 38.1-39 >39
AVPU A V, P, U
SEWS
RR <9 9-20 21-30 31-35 >35 Not reported in paper.
SpO2 <85 85-89 90-92 93-100
HR <30 30-39 40-49 50-99 100-109 110-129 >129
SBP <70 70-79 80-99 100-199 >199
Temperature <34 34-34.9 35-35.9 36-37.9 38-38.9 >38.9
AVPU A V P U
CART (score in parentheses)
RR <21 (0) 21-23 (8) 24-25 (12) 26-29 (15) >29 (22) Not reported in paper.
HR <100 (0) 110-139 (4)
>139 (13)
DBP >49 (0) 40-49 (4) 35-39 (6) <35 (13)
Age, years <55 (0) 55-69 (4) >69 (9)
Churpek (2012)
MEWS
RR ≤8 9-14 15-20 21-29 >29 Not reported in paper.
HR ≤40 41-50 51-100 101-110 111-129 >129
SBP ≤70 71-80 81-100 101-199 ≥200
Temperature ≤35 35.1-36 36.1-38 38.1-38.5 ≥38.6
AVPU A V P U

Clinical and Cost-effectiveness of the National Early Warning System (NEWS): A Systematic Review Update
398
14.5 Appendix 5 – EWS weightings and scores according to study
Study (Year) EWS Score Trigger score
3 2 1 0 1 2 3
Churpek (2012a)
MEWS
RR ≤8 9-14 15-20 21-29 >29 Not reported.
HR ≤40 41-50 51-100 111-129 >129
SBP ≤70 71-80 81-100 101-199 ≥200
Temperature ≤35 35.1-36 36.1-38 38.1-38.5 ≥38.6
AVPU A V P U
CART
RR Not reported in this study – max and min vital signs were used in the CART model derivation. Not reported.
HR
DBP
Age
Cooksley (2012)
MEWS
RR 5-9 10-13 14-19 20-24 25-29 >30 Not reported.
SBP 30-69 70-79 80-109 110-159 160-199 >200
HR 30-39 40-49 50-99 100-119 120-129 >130
Temperature 34-34.9 35-35.9 36-37.9 38-38.9 >39
Urine output <10 10-29 30-200 201-300 >300
AVPU A V P U
SpO2 >96 95-92 91-88 <88
NEWS
RR <8 9-11 12-20 21-24 >25 Not reported.
SpO2 >96 94-95 92-93 <91
FiO2 No Yes
Temperature <35 35.1-35.9 36-37.9 38-38.9 >39
SBP <90 90-99 100-109 110-219 >220
HR <40 40-49 50-89 90-109 110-129 >130
AVPU A V, P, U
Dawes (2014) Worthing PSS
RR ≤19 20-21 ≥22 Not reported.
HR ≤101 ≥102
SBP ≤99 ≥100
Temperature <35.3 ≥35.3
SpO2 <92 62-64 64 -95 96-100
AVPU A V, P, U
Drower (2013) ADDS
AVPU A V P ‘U’ in AVPU call CAT immediately. ‘RR’ <6 or >40 call CAT immediately. ‘SBP<70’ call CAT immediately.
RR 36-39 25-35 21-24 12-20 9-11 6-8
SpO2 ≥93 90-92 85-80 <85
FiO2 ≤2, room air 3-6 >6
HR <30 30-39 40-49 50-109 110-119 120-129 ≥130
SBP 70-79 80-89 90-99 100-179 180-199 ≥200
Temperature <35 35-35.9 36-37.9 38-38.9 ≥39
Urine output <110 110-159 160-800 >800
Durusu Tanriover (2016)
MEWS
HR <44 45-54 55-100 101-110 111-130 150 Not reported.
SBP <70 71-80 81-100 101-199 >200
RR <8 9-12 12-20 20-24 24-29 30
Temperature <36 36-37.4 37.5-37.0 >38
AVPU A V P U
Eccles (2014) NEWS
Temperature <35.0 35.1-36.0 36.1-38.0 38.1-39.0 >39.0 Not reported.
HR <41 41-50 51-90 91-110 111-130 >130
SBP <91 91-100 101-110 111-219 >219
RR <9 9-11 12-20 21-24 >25
SpO2 ≤91 92-93 94-95 ≥96
FiO2 YES NO
AVPU A V,P,U
CREWS (identical to NEWS apart from SpO2 weightings)
SpO2 ≤85 86-87 88-89 ≥90 Not reported.

Clinical and Cost-effectiveness of the National Early Warning System (NEWS): A Systematic Review Update
399
14.5 Appendix 5 – EWS weightings and scores according to study
Study (Year) EWS Score Trigger score
3 2 1 0 1 2 3
Etter (2014) VSS – each parameter is given 1 point where an abnormality occurs. VSS=total sum of all VSS points at one point in time
HR <40 or >140
Any HCP could trigger the MET using a set of calling criteria including Airway, Breathing, Circulation, Neurology and Staff Concern-based criteria.
SBP <90
RR <6 or >36
SpO2 <90%
GCS <13, decrease ≤2 points
Peripheral perfusion
>3 seconds
Fung (2014) PARS
RR <11 11-20 21-25 26-30 >30 PARS score 5 and above: ITU Junior doctor and PARS nurse (3 point).
SpO2 <86 86-91 92-100
SBP <71 71-80 81-99 100-180 181-200 >200
HR <41 40-41 51-100 101-110 111-130 >130
AVPU A V P U
Temperature <33 33-35 35.1-38 38.1-39 >39
Urine output <30ml
Jarvis (2013) LDT-EWS (Males)
Hb ≤11.1 11.2-12.8 ≥12.9 Not reported.
WBC ≤9.3 9.4-16.6 ≥16.7
U ≤9.4 9.5-13.7 ≥13.8
Cr ≤114 115-179 ≥180
Na ≤132 133-140 ≥141
K ≤3.7 3.8-4.4 4.5-4.7 ≥4.8
AIB ≤30 31-34 ≥35
LDT-EWS (Females)
Hb ≤12.0 12.1-14.8 ≥14.9 Not reported.
WBC ≤12.6 12.7-14.8 ≥14.9
U ≤8.4 8.5-13.8 ≥13.9
Cr ≤91 92-157 ≥158
Na ≤134 135-140 ≥141
K ≤3.3 3.4-4.5 ≥4.6
AIB ≤28 29-34 ≥35
Jarvis (2015a) NEWS
RR ≤8 9-11 12-20 21-24 ≥25 NEWS score ≥6.
SpO2 ≤91 92-93 94-95 ≥96
FiO2 No Yes
Temperature ≤35.0 35.1-36.0 36.1-38.0 38.1-39.0 ≥39.1
SBP ≤90 91-100 101-110 111-219 ≥220
HR ≤3 41-50 51-90 91-110 111-130 ≥131
AVPU A V, P, U
Jarvis (2015b) NEWS
RR ≤8 9-11 12-20 21-24 ≥25 Not reported.
SpO2 ≤91 92-93 94-95 ≥96
FiO2 No Yes
Temperature ≤35.0 35.1-36.0 36.1-38.0 38.1-39.0 ≥39.1
SBP ≤90 91-100 101-110 111-219 ≥220
HR ≤3 41-50 51-90 91-110 111-130 ≥131
AVPU A V, P, U
Binary NEWS
RR <12 12-20 >20 Not reported.
SpO2 <96 ≥96
FiO2 No Yes
Temperature <36.1 36.1-38.0 >38.0
SBP <111 111-219 >219
HR <51 51-90 >90
AVPU A V, P, U

Clinical and Cost-effectiveness of the National Early Warning System (NEWS): A Systematic Review Update
400
14.5 Appendix 5 – EWS weightings and scores according to study
Study (Year) EWS Score Trigger score
3 2 1 0 1 2 3
Jo (2013) VIEWS-L
SBP ≤90 91-100 101-110 111-249 ≥250 Not reported.
HR ≤40 41-50 51-90 91-110 111-130 ≥131
RR ≤8 9-11 11-20 21-24 ≥25
Temperature ≤35.0 35.1-36.0 36.1-38.0 38.1-39.0 ≥39
SpO2 ≤84 85-89 90-94 ≥95
FiO2 Room air Any O2
AVPU A V, P, U
Jones (2013) VSA
HR ≤49 50-59 60-100 101-119 ≥120 Score 5-8: Notify charge nurse and medical doctor. Consider calling MET.
RR ≤10 11-15 16-20 21-29 ≥30
SBP ≤89 90-99 100-140 141-180 ≥181
SpO2 ≤89 90-94 95-100
Jones (2011) Patientrack EWS
HR <40 41-50 51-100 101-110 111-130 >130 EWS ≥6 or EWS ≥3 5 times within 24 hours – senior doctor must be contacted. EWS 3-5: inform nurse in charge and consider nursing intervention. Recheck score in one hour. If EWS ≥3 call junior doctor.
SBP <70 71-80 81-100 101-199 >200
RR <8 9-14 15-20 21-29 >30
Temperature <35.0 35.1-36.0 36.1-37.9 38.0-38.9 >39.0
AVPU A V P U
Liljehult (2016)
ViEWS
SBP ≤90 91-100 101-110 111-219 ≥220 Not reported.
HR ≤40 41-50 51-90 91-110 111-130 ≥131
RR ≤8 9-11 12-20 21-24 ≥25
SaO2 ≤91 92-93 94-95 ≤96
FiO2 No Yes
Temperature ≤35.0 35.1-36.0 36.1-38.0 38.1-39.0 ≥39.1
AVPU A V, P, U
Van Galen (2016)
MEWS
RR <9 9-14 15-20 21-30 >30 A score of 3 or more was considered a critical score and nurses were requested to contact a doctor immediately.
SpO2 <90
HR <40 40-50 51-100 101-110 111-130 >130
SBP <70 70-80 81-100 101-200
Temperature <35.1 35.1-36.5 36.5-37.5 >37.5
AVPU A V P U
Urine output <75ml/4hrs
Staff concern 1 point
Ludikhuize (2014)
MEWS
HR <40 40-50 51-100 101-110 111-130 >130 A score of 3 or more was considered a critical score and nurses were requested to contact a doctor immediately.
SBP <70 70-80 81-100 101-200 >200
SpO2 <90
RR <9 9-14 15-20 21-30 >30
Temperature <35.1 35.1-36.5 36.6-37.5 >37.5
AVPU A V P U
Staff concern 1 point
Urine output <75ml/4hrs 1 point
Luis (2017) Short NEWS (NEWS excluding temperature)
RR <8 9-11 12-20 21-24 >25 Not reported.
SpO2 <91 92-93 94-95 >96
FiO2 Yes No
SBP <90 91-100 101-110 111-219 >220
HR <40 41-50 51-90 91-110 111-130 >131
AVPU A V, P, U
NEWS (as above with temperature)
Temperature Not reported in paper.

Clinical and Cost-effectiveness of the National Early Warning System (NEWS): A Systematic Review Update
401
14.5 Appendix 5 – EWS weightings and scores according to study
Study (Year) EWS Score Trigger score
3 2 1 0 1 2 3
Mathukia (2015)
MEWS
RR <8 8 9-17 18-20 21-29 ≥30 Score 6+: Call RRT and physician immediately. HR <40 40-50 51-100 101-110 111-129 ≥130
SBP ≤70 71-80 81-100 101-159 160-199 200-220 >220
AVPU New onset agitation, confusion
agitation, confusion
A V P U
Temperature <35.0 35.0-36 36.05-38 38.05-38.5
≥38.55
Moon (2011) MEWS
RR <8 8-20 21-30 >30 MEWS >5 or MEWS=3 in a single category or serious concern.
HR <40 40-50 51-100 101-110 111-130 >130
SBP <70 71-80 81-100 101-180 181-200 201-220 >220
Temperature <34 34.0-35.0 35.1-37.5 37.6-38.5 38.6-40.2 >40
SpO2 <90 91-93 94-100
Urine output <30ml over 2 hours
AVPU Confused, Agitated
A V P U
Martin (2015) DULK
Temperature >38◦C – 1 point <3 points: Surveillance 4-7 points: Clinical re-evaluation (vital signs), Laboratory re-evaluation, standard imaging >8 points: Within 12 hours, abdomino-pelvic CT scan ± with intra-colonic contrast.
HR > 100 – 1 point
RR > 30/min
Oliguria Diuresis < 700 mL/d – 1 point
Agitation or lethargy
2 points
Clinical deterioration
2 points
Gastroparesia 2 points
Evisceration 2 points
Abdominal or parietal pain
2 points
Elevated WBC count, CRP
103/mL) or CRP (mg/L) > 5% - 1 point
Blood creatinine, urea
>5% - 1 point
Enteral nutrition tube/ Parenteral nutrition
1 point 2 points
Ileus 2 points
Nishijima (2016)
SCS
SBP <70 71-80 81-100 101-199 >200 An alert is automatically generated if the MEWS score is 7 or more. Nurse then contacts ICU nurses and attending physician for immediate treatment response.
HR <40 41-50 51-100 101-110 111-129 >130
RR ≤8 9-14 15-20 21-29 ≥30
Temperature ≤35.0 35.1-38.4 ≥38.5
AVPU A V P U
Staff concern No Yes
Parrish (2017) MEWS
HR <40 40-50 21-100 101-110 111-130 >130 A score of 4 or more triggers a pop up notification on the electronic system.
SBP <70 70-80 81-100 101-159 160-199 200-220 >220
RR <8 8 9-17 18-20 21-29 >30
Temperature <95F 95-100.4 100.5-101 >101
AVPU Confusion A V P U
SpO2 <85 85-89 90-94 >94
Os delivery Trach collar Cannula Room air Face tent Venturi mask

Clinical and Cost-effectiveness of the National Early Warning System (NEWS): A Systematic Review Update
402
14.5 Appendix 5 – EWS weightings and scores according to study
Study (Year) EWS Score Trigger score
3 2 1 0 1 2 3
Patel (2011) MEWS
HR <40 40-50 51-100 101-110 111-129 ≥130 Score 1-3: observations 4-hourly. A MEWS >4 prompts staff to seek senior medical advice. If necessary a referral to the CCOT is made.
RR ≤8 9-14 15-20 21-29 ≥30
Temperature <35.0 35.1-36 36.1-37.9 38-38.4 ≥38.5
AVPU A V P U
Urine catheterised
Nil <0.5ml/2hours <0.5ml/1hour >3ml/2hours
Non-catheterised
P/U in 12 hours: No
P/U in 12 hours: Yes
BP Not reported.
Peris (2012) MEWS
SBP <70 71-80 81-100 101-199 ≥200 MEWS of 3 or 4 in the preoperative evaluation or at operating room discharge: transferred to HDU, whereas a MEWS score of 5 or more was considered criteria for ICU admission.
HR <40 41-50 51-100 101-110 111-129 ≥130
RR <9 9-14 15-20 21-29 ≥30
Temperature <35 35.1-38.4 ≥38.5
AVPU A V P U
Petersen (2016)
NEWS
RR <9 9-11 12-20 21-24 >24 Not reported.
SpO2 <92 92-93 94-95 >95
HR <41 41-50 51-90 91-110 111-130 >130
SBP <91 91-100 101-110 111-219 >219
AVPU A V, P, U
Temperature <35.1 35.1-36.0 36.1-38.0 38.1-39.0 >39
FiO2 Yes No
Reini (2012) MEWS
SBP ≤70 71-80 81-100 101-199 ≥200 A MEWS of 5 or more triggered referral to the CCOS.
RR <9 9-14 15-20 21-29 ≥30
HR ≤40 41-50 51-100 101-110 111-129 ≥130
Temperature ≤35 35.1-36 36.1-38 38.1-38.5 >38.5
AVPU Confused. A V P U
Smith (2012) MEWS
HR <40 40-50 51-100 101-110 111-130 >130 MEWS of 3 or more: call the attending physician.
SBP <70 70-80 81-100 101-200 >200
RR <9 9-14 15-20 21-30 >30
Temperature <35.1 35.1-36.5 36.6-37.5 >37.5
AVPU A V P U
Urine output <75 mL during last 4 hours: 1 point
Staff concern Uneasy about patient’s condition: 1 point
SpO2 <90
Smith (2013) NEWS
RR <8 9-11 12-20 21-24 ≥25 Not reported in the paper. SpO2 ≤91 92-93 94-95 ≥96
FiO2 Yes No
Temperature ≤35.0 35.1-36.0 36.1-38.0 38.1-39.0 ≥39.1
SBP ≤90 91-100 101-110 111-219 ≥220
HR ≤40 41-50 51-90 91-110 111-130 ≥131
AVPU A V, P, U
Stark (2015) MEWS
SBP <70 71-80 81-100 101-199 ≥200 Not reported.
HR <40 41-50 51-100 101-110 111-129 >130
RR <9 9-14 15-20 21-29 ≥30
Temperature <35 35-38.4 ≥38.5
AVPU A V P U

Clinical and Cost-effectiveness of the National Early Warning System (NEWS): A Systematic Review Update
403
14.5 Appendix 5 – EWS weightings and scores according to study
Study (Year)
EWS Score Trigger score
3 2 1 0 1 2 3
Suppiah (2014)
MEWS
HR Not reported. MEWS 3-4: 2-hourly observations and junior doctor to review within 30 minutes. MEWS ≥5 or a score of 3 in a single parameter: Senior medical review within 30 mins and CCOT
Temperature ≤35.0 35.0-35.9 35.0-35.9 36.0-37.9 38.0-38.9 39.0-39.9 ≥40.0
SBP ≤70 70-79 80-99 100-180 180-199 200-219 ≥220
RR <8 8-11 12-20 21-25 26-30 >30
SpO2 <85 85-89 90-93 ≥94
FiO2 No O2 >60% O2
AVPU A V P U
Urine output <80 80-119 120-199 >200 ml >800
Van Rooijen (2013)
Unnamed EWS
HR 51-100 101-110 111-130 >130 EWS ≥3: Electronic programme generated an alert to call the doctor.
SBP <70 70-80 81-100 101-200 >200
RR <9 9-14 15-20 21-30 >30
Temperature <35.1 35.1-36.5 36.6-37.5 >37.5
AVPU A V P U
Staff concern 1 point
Urine output <75ml in 4 hours: 1 point
SpO2 <90
Xiao (2012) AFSS EWS
Age 18-30 31-45 46-65 >65 A score of 8 alert doctors to patients of a severe fever state.
Past history Yes No
Fever course ≤3 4-7 8-14 >14
Temperature <38 38-38.9 39-39.9 ≥40
RR <10 11-19 20-29 ≥30
HR ≤50 51-100 101-110 111-129 ≥130
MAP ≤49 50-74 75-119 ≥120
WBC count ≤2.9 3-3.9 4-10 10.1-24.9 ≥25
Abbott (2016)
NEWS
Temperature ≤35.0 35.1-36.0 36.1-38.0 38.1-39.0 >39.0 A score of over 7 triggers review by the CCOT or medical response team
HR <41 41-50 51-90 91-110 111-130 >130
SBP <91 91-100 101-110 111-219 >219
RR <9 9-11 12-20 21-24 >25
SpO2 <92 92-93 94-95 >96
FiO2 Yes No
AVPU A V,P,U
Hollis (2016)
ViEWS
HR ≤40 41-50 51-90 91-110 111-130 ≥131 Institutional criteria for MET activation include nurse triggered recognition of single vital parameter abnormalities
SBP ≤90 91-100 101-110 111-249 ≥250
RR ≤8 9-11 12-20 21-24 ≥25
Temperature ≤95 95.1-96.8 96.9-100.4 100.5-102.2
≥102.3
SpO2
Alertness Alert Altered
Pedersen 2018
NEWS
RR ≤8 9-11 12-20 21-24 ≥25 Total score 5 or more, or 3 in one variable: Registered nurse to urgently inform the medical team caring for the patient; Total: 7 or more: Registered nurse to immediately inform the medical team caring for the patient – this should be at least at Specialist Registrar level
SpO2 ≤91 92-93 94-95 ≥96
FiO2 0 >0
Pulse rate ≤40 41-50 51-90 91-110 111-130 ≥131
SBP ≤90 91-100 101-110 111-219 ≥220
Mental state V,P,U A
Temperature ≤35.0 35.1-36.0 36.1-38.0 38.1-39.0 ≥39.1
CREWS SpO2 ≤85 86-87 88-89 ≥90
S-NEWS SpO2 ≤83 84-85 86-87 88-92, or ≥93 without oxygen supplementation
≥93 with oxygen supplementation

Clinical and Cost-effectiveness of the National Early Warning System (NEWS): A Systematic Review Update
404
14.5 Appendix 5 – EWS weightings and scores according to study
Study (Year) EWS Score Trigger score
3 2 1 0 1 2 3
Smith (2016) NEWS
RR ≤8 9-11 12-20 21-24 ≥25 NEWS score ≥7
SpO2 ≤91 92-93 94-95 ≥96
FiO2 Yes No
Temperature ≤35.0 35.1-36.0 36.1-38.0 38.1-39.0 ≥39.1
SBP ≤90 91-100 101-110 111-219 ≥220
HR ≤40 41-50 51-90 91-110 111-130 ≥131
Level of consciousness
A V, P, U
Uppanisakorn (2018)
NEWS
RR ≤8 9-11 12-20 21-24 ≥25 NEWS score ≥7
SpO2 ≤91 92-93 94-95 ≥96
FiO2 Yes No
Temperature ≤35.0 35.1-36.0 36.1-38.0 38.1-39.0 ≥39.1
SBP ≤90 91-100 101-110 111-219 ≥220
HR ≤40 41-50 51-90 91-110 111-130 ≥131
Level of consciousness
A V, P, U
Young (2014) MEWS
SBP <81 81-90 91-100 101-160 161-170 171-180 >180
HR <41 41-50 51-100 101-110 111-129 >129
RR <10 10-20 21-24 25-28 >28
Temperature <36 36-38 >38
SpO2 <91 91-94 95-100
Dyspnea Observed shortness of breath
Verbal
Mental status Any new mental status

Clinical and Cost-effectiveness of the National Early Warning System (NEWS): A Systematic Review Update
405
14.6 Appendix 6: Findings of the studies included in Q3 (Educational interventions)
Study Authors
(Year)
Outcomes Conclusion
RCTs
Liaw (2011)(177) Other outcomes post-hoc: communication
Total ABCDE domain (score ranges from 0-36):
Intervention group baseline mean 10.37 (SD 2.48), post-intervention mean 20.13 (SD 3.29), p=0.001).
Control group baseline mean 10.22 (SD 2.39), post-intervention mean 11.22 (SD 2.25).
Individual ABCDE domains:
Airway: intervention group pre-intervention mean 0.77(SD 0.73) post-intervention 2.60 (SD 0.93) (p=0.001). Control group pre-
intervention mean 0.66 (SD 0.96), post-intervention mean 0.50 (SD0.61). Breathing: intervention group pre-intervention mean 2.63
(SD 0.79), post-intervention 4.67 (SD 0.49) (p=0.001). Control group pre-intervention mean 3.13 (SD 0.74), post-intervention mean
3.13 (SD 0.62). Circulation: intervention group pre-intervention mean 1.80 (SD 0.84), post-intervention mean 5.03 (SD 1.08),
(p=0.001). Control group pre-intervention mean 1.69 (SD 1.00), post-intervention mean 2.03 (0.74).Disability: intervention group
pre-intervention mean 1.30 (SD 1.00), post-intervention 1.77 (SD1.31). Control group pre-intervention mean 1.13 (SD 1.15), post-
intervention mean 1.44 (SD 1.03).Examine: intervention group pre-intervention mean 0.53 (SD 0.40), post-intervention 0.87 (SD
0.69). Control group pre-intervention mean 1.13 (SD 1.15), post-intervention mean 1.44 (SD 1.03).
Total SBAR: intervention group baseline mean 8.47 (SD 1.62), post-score mean 11.77 (SD 2.83) (p=0.01).
The intervention group did not show any significant improvement on the post-test scores for individual SBAR subscales except
Assessment. Baseline mean 0.10 (SD 0.28), post score mean 0.40 (SD 0.47) (p=0.05).
The control group showed a significant improvement in the post-test score for the ‘global rating performance’ not for the rest of
the SBAR domains. Baseline mean 3.34 (SD 1.45), post score mean 3.84 (SD 1.35), (p=0.05).
The nursing students’ competency in
assessing, managing and reporting of
deteriorating patient can be enhanced
through a systematic development and
implementation of a simulation-based
educational program that utilized
mnemonics including ABCDE and SBAR
to help students to remember key
tasks.
Liaw (2012)(178) Primary outcome: increase in knowledge and performance
Performance: Intervention group pre-test mean 10.37 (SD 2.48), post-test 20.13 (SD 3.29), (p≤0.001), Control group: pre-test 10.22
(SD 2.39), post-test 11.22 (SD 2.25) (p=0.15)
Knowledge: Intervention group pre-test mean 35.72 (SD 2.90), post-test 43.48 (SD 2.89), (p≤0.001). Control group pre-test mean
36.8 (SD 3.95), post-test 36.81 (SD 2.99), (p=0.99).
Self-confidence: Intervention group pre-test mean 18.73 (SD 7.69), post-test mean 24.53 (SD 6.56), (p≤0.001). Control group pre-
test mean 14.63 (SD 5.90), post-test mean 20.63 (SD 6.05), (p≤0.001).
Between group tests showed that the intervention group scored significantly better than the controls for knowledge (p≤0.001) and
performance (p≤0.001). No difference between groups for self-confidence (p=0.32).
Significantly improved knowledge and
performance scores in intervention
group post-test compared to control
group but not for self-confidence.
Possible explanation for this is that the
control group received a 15 minute pre-
test simulation that could have altered
their post-test confidence score.
Liaw (2014)(166) Primary outcome: increase in knowledge and performance
Clinical performance mean score (max score 54): mean score of participants 30.58 (SD 5.78) or ‘average’ clinical performance.
Intervention: pre-test (38.52, SD 4.82) post-test1 (36.65, SD 5.59) post-test2 (33.58, SD 6.78)
Control: pre-test (29.46, SD 6.67) post-test1 (33.27, SD 7.50) post-test2 (33.38, SD 6.49)
Significant increases in the post-test1 scores (1 day later) for the intervention group (p<0.001) and the control group (p<0.05). Post-
test2 scores (2.5 months) decreased significantly for the intervention group (p<0.05), there was no significant decrease for the
controls at post-test2.
Both virtual-simulation and mannequin-
simulation resulted in improved clinical
performance immediately post
intervention. Only mannequin-based
simulation yielded an increase in clinical
performance in the longer term (2.5
months). Suggests hands-on learning
provided deeper learning.

Clinical and Cost-effectiveness of the National Early Warning System (NEWS): A Systematic Review Update
406
Appendix 6: Findings of the studies included in Q3 (Educational interventions) [continued]
Study Authors
(Year)
Outcomes Conclusion
RCTs
Liaw (2017),(180)
Primary outcome: Knowledge
Pre-test Intervention: mean 16.66 (SD 3.73)
Post-test intervention: mean 18.66 (SD 3.824) (p<0.001)
Pre-test control: mean 16.38 (SD 3.64)
Post-test control: mean 16.50 (SD 3.742) (p=0.75)
Between group comparison: p<0.01
Primary outcome: Performance (measurement of vital signs, assessing and managing clinical deterioration )
Pre-test Intervention: mean 12.19 (SD 2.40)
Post-test intervention: mean 19.44 (SD 0.69) (p<0.001)
Pre-test control: mean 12.88 (SD 2.45)
Post-test control: mean 14.09 (SD 0.44) (p=0.05)
Between group comparison: p<0.001
Secondary outcome: Improved documentation of patient observations
No statistical difference pre-test in the measurement of vital signs between the experimental and control group.
Post-test, experimental group were significantly more likely to monitor RR (59.4% vs 21.9%, p<0.001) and HR (68.8% vs. 43.4%, p<0.05).
No difference between groups for temperature, BP and SpO2
Other outcomes post-hoc: Communication, collaboration and perception: Improved documentation of patient observations
(reporting clinical deterioration ISBAR and ABCDE)
Pre-test Intervention: mean 8.03 (SD 1.74)
Post-test intervention: mean 10.00 (SD 1.48) (p<0.001)
Pre-test control: mean 8.41 (SD 2.01)
Post-test control: mean 8.75 (SD 1.67) (p>0.05)
Between group comparison: p<0.01
Using a web-based educational
programme, EN’s in the
intervention group had improved
knowledge and skills in recognising,
responding (performance) and
reporting (SBAR, ABCDE) of a
patient deteriorating in a simulated
setting.
Limited by small sample size, non-
clinical setting, ENs – may not be
applicable to other settings or
countries.
Lindsey
(2013)(168)
Primary outcome: increase in knowledge and performance
Changes in knowledge and clinical judgement: Both control (mean 57.05, SD 16.47), intervention (mean 61.07, SD 17.19) groups scored
lowest on the pre-test scores. Nursing students who received the rapid response educational intervention had significantly higher post-
test scores (mean 90.91, SD 19.69) compared to controls (mean 64.80, SD 19.69), p <0.001.
11-items survey (1,5, 6, 8 and 9 looked at knowledge of RRTs; 2, 3, 4, 7, and 10 looked at clinical judgement in activating RRTs and 11
looked at prior exposure to RRTs). The intervention group scored higher on all post-test items compared to the controls, except for
Question 3 on clinical judgement.
The findings demonstrate that
clinical simulation is effective in
improving students’ knowledge and
clinical judgment, specifically
concerning rapid response systems.
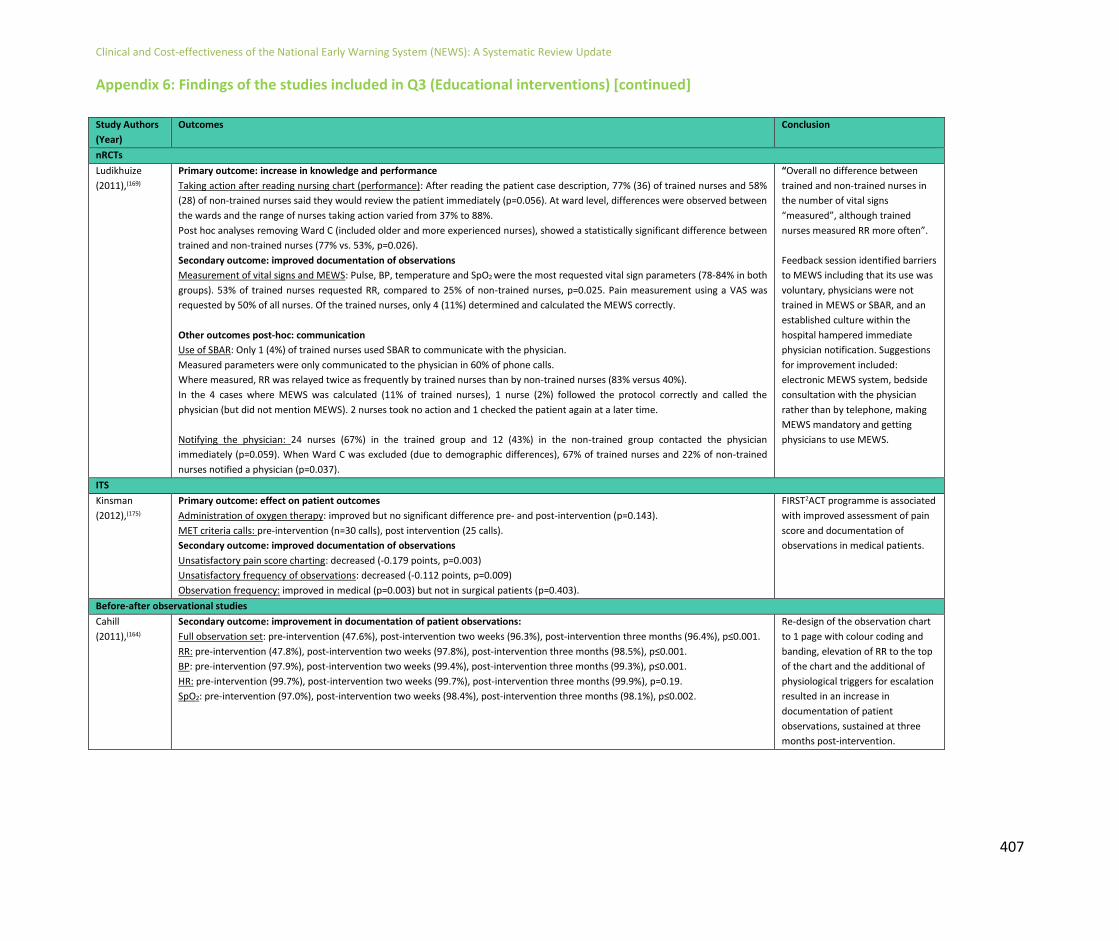
Clinical and Cost-effectiveness of the National Early Warning System (NEWS): A Systematic Review Update
407
Appendix 6: Findings of the studies included in Q3 (Educational interventions) [continued]
Study Authors
(Year)
Outcomes Conclusion
nRCTs
Ludikhuize
(2011),(169)
Primary outcome: increase in knowledge and performance
Taking action after reading nursing chart (performance): After reading the patient case description, 77% (36) of trained nurses and 58%
(28) of non-trained nurses said they would review the patient immediately (p=0.056). At ward level, differences were observed between
the wards and the range of nurses taking action varied from 37% to 88%.
Post hoc analyses removing Ward C (included older and more experienced nurses), showed a statistically significant difference between
trained and non-trained nurses (77% vs. 53%, p=0.026).
Secondary outcome: improved documentation of observations
Measurement of vital signs and MEWS: Pulse, BP, temperature and SpO2 were the most requested vital sign parameters (78-84% in both
groups). 53% of trained nurses requested RR, compared to 25% of non-trained nurses, p=0.025. Pain measurement using a VAS was
requested by 50% of all nurses. Of the trained nurses, only 4 (11%) determined and calculated the MEWS correctly.
Other outcomes post-hoc: communication
Use of SBAR: Only 1 (4%) of trained nurses used SBAR to communicate with the physician.
Measured parameters were only communicated to the physician in 60% of phone calls.
Where measured, RR was relayed twice as frequently by trained nurses than by non-trained nurses (83% versus 40%).
In the 4 cases where MEWS was calculated (11% of trained nurses), 1 nurse (2%) followed the protocol correctly and called the
physician (but did not mention MEWS). 2 nurses took no action and 1 checked the patient again at a later time.
Notifying the physician: 24 nurses (67%) in the trained group and 12 (43%) in the non-trained group contacted the physician
immediately (p=0.059). When Ward C was excluded (due to demographic differences), 67% of trained nurses and 22% of non-trained
nurses notified a physician (p=0.037).
“Overall no difference between
trained and non-trained nurses in
the number of vital signs
“measured”, although trained
nurses measured RR more often”.
Feedback session identified barriers
to MEWS including that its use was
voluntary, physicians were not
trained in MEWS or SBAR, and an
established culture within the
hospital hampered immediate
physician notification. Suggestions
for improvement included:
electronic MEWS system, bedside
consultation with the physician
rather than by telephone, making
MEWS mandatory and getting
physicians to use MEWS.
ITS
Kinsman
(2012),(175)
Primary outcome: effect on patient outcomes
Administration of oxygen therapy: improved but no significant difference pre- and post-intervention (p=0.143).
MET criteria calls: pre-intervention (n=30 calls), post intervention (25 calls).
Secondary outcome: improved documentation of observations
Unsatisfactory pain score charting: decreased (-0.179 points, p=0.003)
Unsatisfactory frequency of observations: decreased (-0.112 points, p=0.009)
Observation frequency: improved in medical (p=0.003) but not in surgical patients (p=0.403).
FIRST2ACT programme is associated
with improved assessment of pain
score and documentation of
observations in medical patients.
Before-after observational studies
Cahill
(2011),(164)
Secondary outcome: improvement in documentation of patient observations:
Full observation set: pre-intervention (47.6%), post-intervention two weeks (96.3%), post-intervention three months (96.4%), p≤0.001.
RR: pre-intervention (47.8%), post-intervention two weeks (97.8%), post-intervention three months (98.5%), p≤0.001.
BP: pre-intervention (97.9%), post-intervention two weeks (99.4%), post-intervention three months (99.3%), p≤0.001.
HR: pre-intervention (99.7%), post-intervention two weeks (99.7%), post-intervention three months (99.9%), p=0.19.
SpO2: pre-intervention (97.0%), post-intervention two weeks (98.4%), post-intervention three months (98.1%), p≤0.002.
Re-design of the observation chart
to 1 page with colour coding and
banding, elevation of RR to the top
of the chart and the additional of
physiological triggers for escalation
resulted in an increase in
documentation of patient
observations, sustained at three
months post-intervention.

Clinical and Cost-effectiveness of the National Early Warning System (NEWS): A Systematic Review Update
408
Appendix 6: Findings of the studies included in Q3 (Educational interventions) [continued]
Study Authors
(Year)
Outcomes Conclusion
Before-after observational studies
De Meester
(2013),(48)
Primary outcome: effect on patient outcomes
SAEs: n=207 in total, of which 81 (4.4/1,000 admissions) were pre-intervention and 126 (6.7/1,000 admissions) were post-intervention
(p=<0.05).
Unexpected deaths: n=16 unexpected deaths (0.99/1,000 admissions) pre-intervention and 5 unexpected deaths (0.34/1,000
admissions) post-intervention (RRR -227%, 95% CI -793%, -20%), p≤0.001.
Unplanned admission to the ICU: increased from 51 (13.1/1,000 admissions) pre-intervention to 105 (14.8/1,000 admissions) post
intervention (RRR 50%, 95% CI 30%, 64%), p=0.001).
Mortality; 10.29/1,000 (pre-intervention), 10.60 (post-intervention).
LOS: mean 5.7 days (pre-intervention), 5.54 days (post-intervention)
Cardiac arrest team calls: 3.15/1,000 admissions (pre-intervention), 14.85/1,000 post-intervention.
Other outcomes post-hoc: communication, collaboration and perception:
Nurses total score: pre-intervention 58.6 (31-97), increased to 63.9 (25-97) post-intervention, p≤0.001).
Collaboration: pre-intervention (56.2, 0-100) to post-intervention (62.2, 17-100), p≤0.001.
Communication with the physician: pre-intervention (62.9, 20-100), post-intervention (68.9, 13-100), p≤0.001).
Overall perception of communication: pre-intervention (55.3, 0-89), post-intervention 58.4, 0-100, p=0.042).
A significant reduction in SAEs
following SBAR intervention
training. An increase in unplanned
ICU admissions but a reduction in
unexpected deaths, possibly due to
earlier deterioration. In addition
SBAR improved communication and
collaboration between nurses and
physicians.
Hammond
(2013),(174)
Secondary outcome: improvement in documentation of patient observations:
ICU-Discharge Patients group
Full observation set (7 parameters): increase post intervention (210%, 95% CI 148% - 288%), p≤0.0001).
Six vital parameters (excluding urine output): 30% increase (95% CI 10.6%-52.8%).
Single parameter documentation: Temperature: 25.5%, 95% CI 8.1%-45.7%, p=0.003.
Urine output: 103%, 95% CI 80.0%-129.7%, p≤0.001.
Systolic BP: 1.4%, 95% CI -11.5%-16.1%; Diastolic BP: 0.9%, 95% CI -11.9%-15.6%.
HR: 4.8%, 95% CI -8.8%-20.3%.
RR: 10.0%, 95% CI 4.2%-26.2%.
SpO2: -0.8%, 95% CI -13.3%-13.36%.
Unplanned ICU admissions group
Full observation set (7 parameters): post intervention (44%, 95% CI 2.6% - 102.1%), p=0.04).
Six vital parameters (excluding urine output): -3.9% (95% CI -28.3%-28.9%).
Single parameter documentation: Temperature: 6.1%, 95% CI -18.8%-38.6%, p=0.7.
Urine output: 26.9%, 95% CI 2.5%-57.1%, p≤0.03.
Systolic BP and diastolic BP: -13.3%, 95% CI -31.6% - 9.9%, p=0.2.
HR: -17.0%, 95% CI -34.5%-5.2%.
RR: -11.3%, 95% CI -30%-12.4%.
SpO2: -14.2%, 95% CI -32%-8.36%.
Implementation of a new MEWS
observation chart and supporting
educational programme was
associated with statistically
significant increases in frequency of
combined and individual vital sign
set recordings during the first 24 h
post-ICU discharge. There were no
significant changes to frequency of
individual vital sign recordings in
unplanned admissions to ICU after
the MEWS observation chart was
implemented, except for urine
output. Overall increases in the
frequency of full vital sign sets were
seen.

Clinical and Cost-effectiveness of the National Early Warning System (NEWS): A Systematic Review Update
409
Appendix 6: Findings of the studies included in Q3 (Educational interventions) [continued]
Study Authors
(Year)
Outcomes Conclusion
Before-after observational studies
Jung (2016),(62)
Primary outcome: effect on patient outcomes: Unexpected mortality (non-DNR, non-palliative) RRT hospital: Pre: 21.9 per 1,000 discharges Post: 17.4 per 1,000 discharges (p=0.002) Three control hospitals: Hospital 1: Pre:14.3 per 1,000 discharges Post: 15.4 per 1,000 discharges (p=0.38) Hospital 2: Pre:24.9 per 1,000 discharges Post:22.5 per 1,000 discharges (p=0.16) Hospital 3: Pre: 22.1 per 1,000 discharges Post: 23.8 per 1,000 discharges (p=0.40) Overall mortality RRT hospital:Pre: 39.6 per 1,000 discharges Post: 34.6 per 1,000 discharges (p=0.012) Three control hospitals: Hospital 1: Pre: 16.7 per 1,000 discharges Post: 18.4 per 1,000 discharges (p=0.19) Hospital 2: Pre: 28.6 per 1,000 discharges Post: 25.2 per 1,000 discharges (p=0.066) Hospital 3: Pre: 29.0 per 1,000 discharges Post: 29.0 per 1,000 discharges (p=0.97) Non-ICU cardiac arrest RRT hospital: Pre:2.6 per 1,000 discharges Post: 1.8 per 1,000 discharges (p=0.093) Three control hospitals: Hospital 1: Pre:3.5 per 1,000 discharges Post: 4.6 per 1,000 discharges (p=0.080) Hospital 2: Pre: 3.3 per 1,000 discharges Post: 2.1per 1,000 discharges (p=0.044) Hospital 3: Pre:10.2 per 1,000 discharges Post: 10.8 per 1,000 discharges (p=0.71) Unplanned ICU admission RRT hospital: Pre:45.7 per 1,000 discharges Post: 52.8 per 1,000 discharges (p=0.002) Three control hospitals: Hospital 1: Pre: 51 per 1,000 discharges Post: 55.3 per 1,000 discharges (p=0.054) Hospital 2: Pre:60.2 per 1,000 discharges Post: 55.6 per 1,000 discharges (p=0.34) Hospital 3: Pre: 126.9 per 1,000 discharges Post: 122.0 per 1,000 discharges (p=0.24) Median hospital LOS (days) RRT hospital: Pre:5 (2-10) Post: 5(2-10), (p=0.09) Three control hospitals: Hospital 1: Pre: 4 (2-8) Post: 4 (2-8), (p<0.001) Hospital 2: Pre:3 (2-7) Post: 3 (2-6), (p<0.001) Hospital 3: Pre: 4 (2-8) Post: 4 (2-8), (p=0.36)
In the present study, implementation of an
intensivist-led RRT along with educational
modules, publicity and bedside simulation-
based training was associated with a
significant decrease in unexpected and
overall mortality of inpatients.
Liaw (2016),(181) Primary outcome: Increase in knowledge
RNs pre-test: mean 18.80, SD 3.05. RNs post test: mean 22.47, SD 2.99, p<0.001
ENs pre-test: mean 16.57, SD 3.99. ENs post test: mean 19.57, SD 3.97, p<0.001
Primary outcome: Performance (Training transfer at workplace, 5 point Likert scale), self-reported 3-4 months post training
Participants demonstrated positive attitudes (mean 3.89, SD 0.49) towards the transfer of learning to clinical practice mean
scores on each item ranged from 3.39 (peers have said my performance has improved since the training) to 4.13 (putting what I
have learned into practice to benefit the patient). No significant difference between nurses (mean 3.82, SD, 0.52) and ENs
(mean 4.06, SD 0.39).
Work with more confidence after the training: mean 3.95, SD 0.64
Work performance improved after the training: mean 3.88, SD 0.65
Primary outcome: Effect on patient outcomes: Trigger cases (RRT calls) pre and post intervention:
Medical ward: pre: 8.96%, post 14.58% (p<0.001)
Surgical ward: pre: 1.97%, post 1.23%, (p=0.15)
Authors measured the outcomes across the
levels of an existing adaptation of
Kirpatrick’s model during a 14-month period
to evaluate the impact of e-RAPIDs. Found
changes in practice (more trigger cases of
the RRT post intervention) in the medical
ward only. Changes in practice self-reported
3-4 months later by nurses and ENs after
the educational intervention. Only focusses
on the afferent limb, did not look at RRT
effectiveness. Limited by lack of control
group (which did not receive the
intervention).
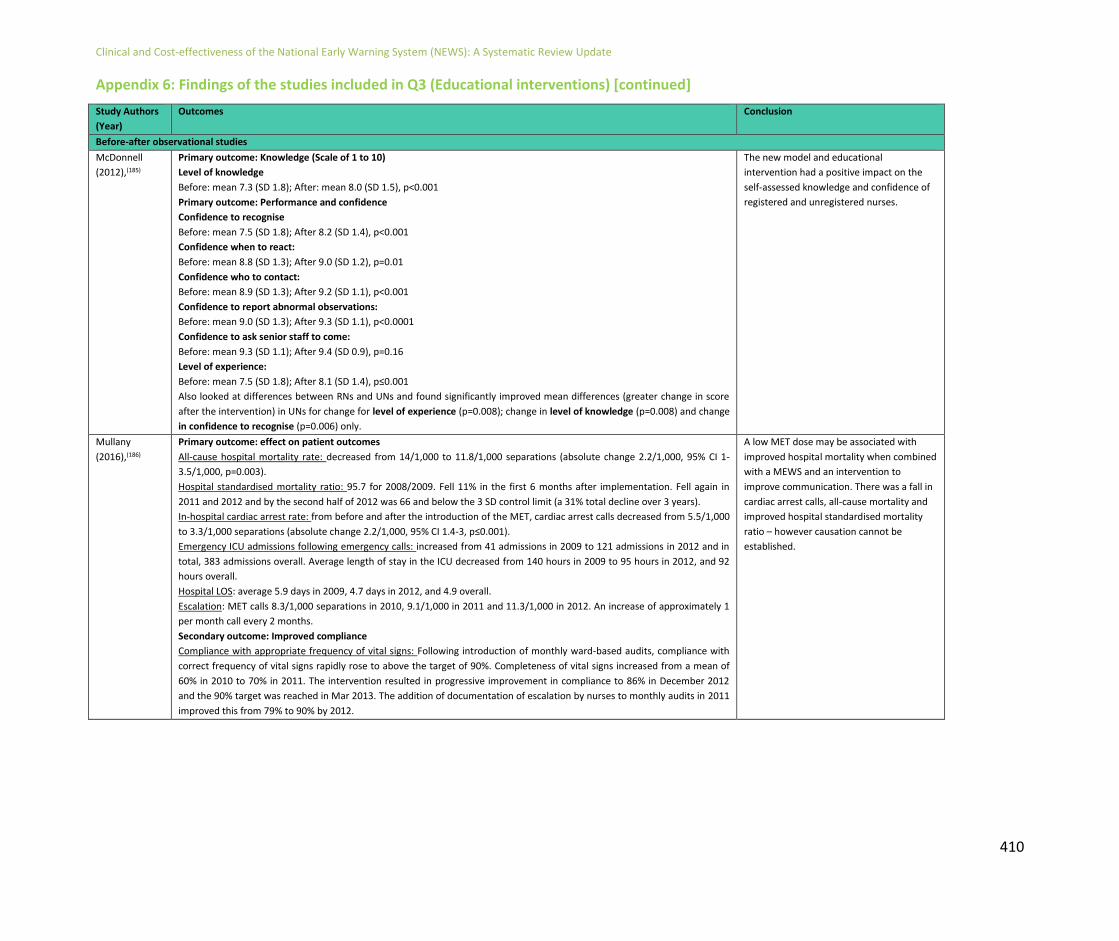
Clinical and Cost-effectiveness of the National Early Warning System (NEWS): A Systematic Review Update
410
Appendix 6: Findings of the studies included in Q3 (Educational interventions) [continued]
Study Authors
(Year)
Outcomes Conclusion
Before-after observational studies
McDonnell
(2012),(185)
Primary outcome: Knowledge (Scale of 1 to 10)
Level of knowledge
Before: mean 7.3 (SD 1.8); After: mean 8.0 (SD 1.5), p<0.001
Primary outcome: Performance and confidence
Confidence to recognise
Before: mean 7.5 (SD 1.8); After 8.2 (SD 1.4), p<0.001
Confidence when to react:
Before: mean 8.8 (SD 1.3); After 9.0 (SD 1.2), p=0.01
Confidence who to contact:
Before: mean 8.9 (SD 1.3); After 9.2 (SD 1.1), p<0.001
Confidence to report abnormal observations:
Before: mean 9.0 (SD 1.3); After 9.3 (SD 1.1), p<0.0001
Confidence to ask senior staff to come:
Before: mean 9.3 (SD 1.1); After 9.4 (SD 0.9), p=0.16
Level of experience:
Before: mean 7.5 (SD 1.8); After 8.1 (SD 1.4), p≤0.001
Also looked at differences between RNs and UNs and found significantly improved mean differences (greater change in score
after the intervention) in UNs for change for level of experience (p=0.008); change in level of knowledge (p=0.008) and change
in confidence to recognise (p=0.006) only.
The new model and educational
intervention had a positive impact on the
self-assessed knowledge and confidence of
registered and unregistered nurses.
Mullany
(2016),(186)
Primary outcome: effect on patient outcomes
All-cause hospital mortality rate: decreased from 14/1,000 to 11.8/1,000 separations (absolute change 2.2/1,000, 95% CI 1-
3.5/1,000, p=0.003).
Hospital standardised mortality ratio: 95.7 for 2008/2009. Fell 11% in the first 6 months after implementation. Fell again in
2011 and 2012 and by the second half of 2012 was 66 and below the 3 SD control limit (a 31% total decline over 3 years).
In-hospital cardiac arrest rate: from before and after the introduction of the MET, cardiac arrest calls decreased from 5.5/1,000
to 3.3/1,000 separations (absolute change 2.2/1,000, 95% CI 1.4-3, p≤0.001).
Emergency ICU admissions following emergency calls: increased from 41 admissions in 2009 to 121 admissions in 2012 and in
total, 383 admissions overall. Average length of stay in the ICU decreased from 140 hours in 2009 to 95 hours in 2012, and 92
hours overall.
Hospital LOS: average 5.9 days in 2009, 4.7 days in 2012, and 4.9 overall.
Escalation: MET calls 8.3/1,000 separations in 2010, 9.1/1,000 in 2011 and 11.3/1,000 in 2012. An increase of approximately 1
per month call every 2 months.
Secondary outcome: Improved compliance
Compliance with appropriate frequency of vital signs: Following introduction of monthly ward-based audits, compliance with
correct frequency of vital signs rapidly rose to above the target of 90%. Completeness of vital signs increased from a mean of
60% in 2010 to 70% in 2011. The intervention resulted in progressive improvement in compliance to 86% in December 2012
and the 90% target was reached in Mar 2013. The addition of documentation of escalation by nurses to monthly audits in 2011
improved this from 79% to 90% by 2012.
A low MET dose may be associated with
improved hospital mortality when combined
with a MEWS and an intervention to
improve communication. There was a fall in
cardiac arrest calls, all-cause mortality and
improved hospital standardised mortality
ratio – however causation cannot be
established.

Clinical and Cost-effectiveness of the National Early Warning System (NEWS): A Systematic Review Update
411
Appendix 6: Findings of the studies included in Q3 (Educational interventions) [continued]
Study Authors
(Year)
Outcomes Conclusion
Before-after observational studies
Merriel
(2016),(170)
Secondary outcome: improved documentation of observations
Individual EWS scores calculated correctly: pre-implementation (3,786/4,082, 92.7%); post-implementation (2,602/2,769,
93.97% ), Relative Risk 1.01 (95% CI 1.00, 1.03), p=<0.05)
All EWS scores calculated correctly for a patient’s admission: pre-implementation (140/254, 55.12%); post-implementation
(134/197, 68.02%), Relative Risk 1.24 (95% CI 1.07, 1.44), p=<0.01).
Completion of at least 1 set of required observations (e.g. at least BP): pre-implementation (192/282, 68.09%); post-
implementation (165/210, 78.57%), Relative Risk 1.2 (95% CI 1.09, 1.32), p=<0.01).
Observations performed as per the EWS guidelines: fewer than half documented as per the EWS guidelines pre-
implementation (130/282, 46.10%), increasing post-implementation to 58.57% (123/210), Relative Risk 1.33 (95% CI 1.13,
1.57).
Regular, ward-based training of shorter
duration (similar to the 1 hour training
sessions in this study) should become a
regular feature in every clinical area.
Ozekcin
(2015),(171)
Primary outcome: increase in knowledge and performance
Knowledge: pre-test (mean 56.9%, SD 16.9%), post-test (mean 84.6%, SD 10.3%), mean difference (27.6%, SD 15.9%,
p≤0.0001).
Performance: Likert scale survey - responses of the participants in responding to clinical deterioration post simulation training.
Included:
Confident to recognise patient deterioration: before simulation mean (4.06, SD 0.44), after simulation mean (4.45, SD 0.51),
p=0.001.
Confident in responding to an unstable patient and using a systematic assessment tool: before simulation mean (4.00, SD 0.52),
after simulation mean (4.48, SD 0.51), p≤0.0001).
Confident to coordinate responders using an escalation protocol: before simulation mean (3.80, SD 0.79), post simulation mean
(4.39, SD 0.62), p=0.001.
Comfortable using the SBAR tool: pre-simulation mean (4.48, SD 0.57), post simulation mean (4.71, SD 0.46), p=0.04).
After completion of education and
simulation scenarios, the goal is to reduce
the number of code blue events by 50% in
this hospital. Use of SBAR and e-learning
simulation and debriefing can improve
instability recognition resulting in an
increase in knowledge and decreased time
to critical actions.
Rose (2015),(172) Primary outcome: effect on patient outcomes
Patient RRT survival rate: pre (23, 100%), post (17, 100%)
Post RRT transfer rate: pre intervention (11, 43%) post (10, 64%).
Number of RRT calls: pre-intervention (n=23), post-intervention (17)
Secondary outcome: improved documentation of observations
Undocumented eMEWS scores: pre-intervention (11, 49%), post intervention (0, 0%)
eMEWS score range: pre (0-6, mean 2.3,SD 1.79), post (mean 3.2, SD 1.79).
A brief educational intervention (3 minutes
duration) resulted in an increase in eMEWS
documentation and more focused
identification of patient deterioration.
Schubert
(2012),(176)
Primary outcome: increase in knowledge and performance Knowledge: average increase in knowledge scores overall between pre-test and post-test of 0.73 points (t=3.16, df=110,
p=0.002, 95% CI 0.27, 1.19). Mean knowledge scores increased between pre-test and 2-weeks post-test by 1.76 points (t=4.08,
df=68, p<0.001, 95% CI 0.90, 2.62). Mean scores also increased between immediate and 2-week post-tests with an increase of
1.03 points (t=3.16, df=64, p<0.001, 95% CI 0.44, 1.61). Mean score for knowledge (out of 9) was 6.66 pre-test, 7.39 post-test
and 8.42 2-weeks post-test.
Critical thinking: significant change in critical thinking between pre-test and 2-weeks post-test results overall (p=0.001). No
significant change occurred between pre-test and 2-week post-test measures (p=0.468) or between post-test (immediate) and
2-week post-test measures (p=0.058).
Nursing knowledge and critical thinking
improved after the simulation and showed
the effectiveness of simulation as a teaching
strategy to address nursing knowledge and
critical skills thinking.

Clinical and Cost-effectiveness of the National Early Warning System (NEWS): A Systematic Review Update
412
Appendix 6: Findings of the studies included in Q3 (Educational interventions) [continued]
Study Authors
(Year)
Outcomes Conclusion
Before-after observational studies
Sebat
(2018),(157)
Primary outcome: effect on patient outcomes
Cardiac arrest per 1,000 discharges Before-intervention: 3.1 per 1,000 After-intervention: 2.4 per 1,000, p=0.04 Unadjusted hospital mortality rate Before-intervention: 3.7% After-intervention: 3.2%, p<0.001 Resource utilisation RRT calls per 1,000 discharges Before-intervention: 10.2 per 1,000 After-intervention: 48.8 per 1,000, p<0.001
Although the 4-part RRT intervention
reduced the number of cardiac arrests and
hospital mortality, we cannot be certain
which aspect of the intervention is most
responsible for the improved outcomes or
whether unknown confounding played a
role. We cannot be certain that the
educational component of the intervention
was responsible.
Shaddel
(2014),(173)
Primary outcome: increase in knowledge and performance Mean confidence in clinical judgement: (pre) 3.73, post 4.63, p=0.0001. Correct MEWS score and decision made: pre-test: 42.1%, post-test: 92.1% (p<0.00001)
Limited research into the use of MEWS in
psychiatric in-patient settings and small
sample size but demonstrated the
usefulness of MEWS to increase nurse’s
knowledge and confidence.
Wood
(2015),(182)
Primary outcome: effect on patient outcomes
Unscheduled admissions to the ICU: Mean EWS score of 7 prompting admission to critical care for adults. Consultant
involvement in 51% of adult cases.
Secondary outcome: Improved compliance
Observations done 4 hourly: Quarter 1(65%), Quarter 4(96%) [Mar 2014 Target (75%) achieved]
EWS correctly scored and added up: Quarter 1(88%), Quarter 4(93%) [Mar 2014 Target (95%) not achieved]
Frequency of observations increased appropriately: Quarter 1 (36%), Quarter 4 (50%) [Mar 2014 Target (35%) achieved].
NURSING escalation correct: Quarter 1 (22%), Quarter 4 (57%) [Mar 2014 Target (35%) achieved].
Medical escalation correct: Quarter 1 (31%), Quarter 4 (37%) [Mar 2014 Target (35%) achieved].
Limited data to date suggests for the sickest
adult patients, observations often improve
following initial medical intervention and
that early review within working hours may
prevent patient deterioration and need for
escalation out of hours. Suggests
ascertaining compliance and culture with
regards to EWS.
Key: RR: Respiratory Rate; BP: Blood Pressure; HR: Heart Rate; SpO2: Oxygen Saturation; SAE: Serious Adverse Event; RRR: Relative Risk Reduction; CI: Confidence Interval; ICU: Intensive Care Unit; LOS: Length of
Stay; SBAR: Situation, Background, Assessment, Recommendation; MEWS: Modified Early Warning Score; MET: Medical Emergency Team; ABCDE: Airway, Breathing, Circulation, Disability, Examine; SD: Standard
Deviation; RRT: rapid Response team; EWS: Early Warning Score; eMEWS: Electronic MEWS; VAS - visual analogue scale
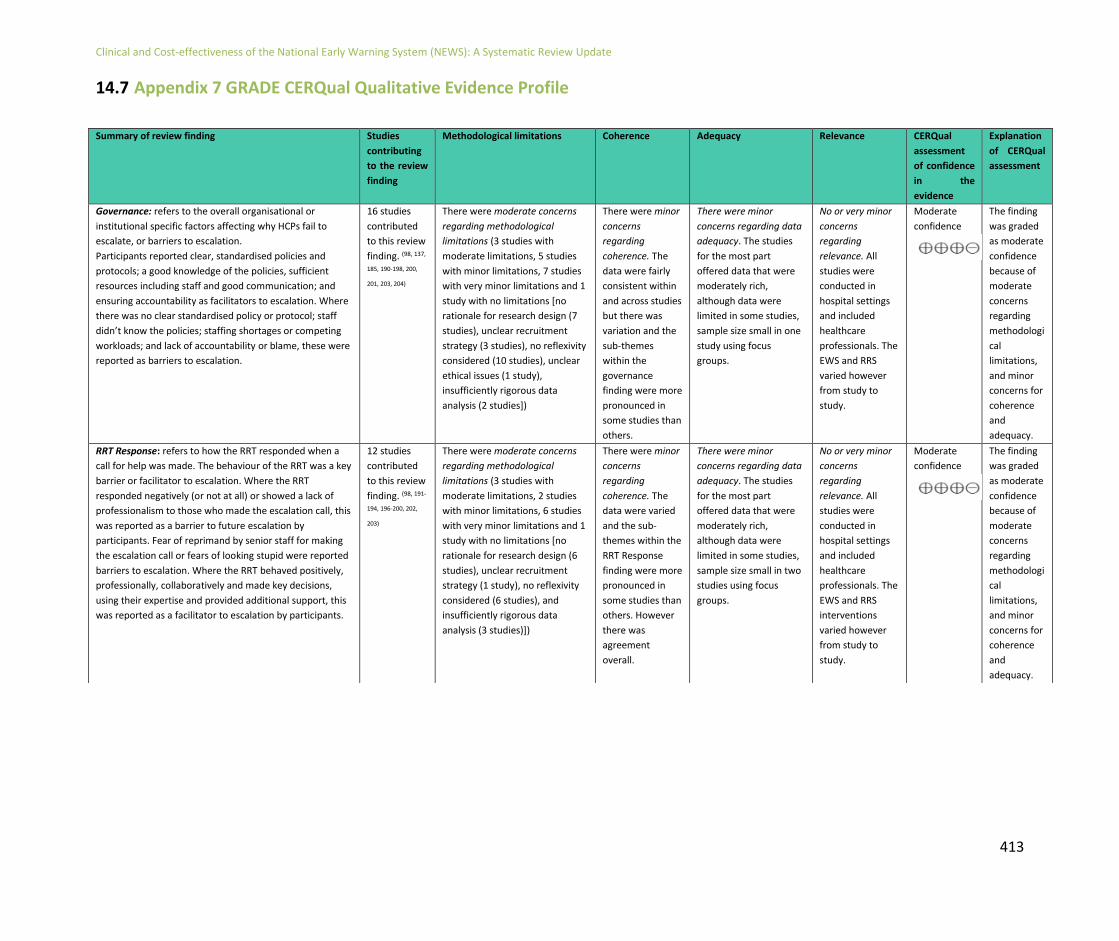
Clinical and Cost-effectiveness of the National Early Warning System (NEWS): A Systematic Review Update
413
14.7 Appendix 7 GRADE CERQual Qualitative Evidence Profile
Summary of review finding Studies
contributing
to the review
finding
Methodological limitations Coherence Adequacy Relevance CERQual
assessment
of confidence
in the
evidence
Explanation
of CERQual
assessment
Governance: refers to the overall organisational or
institutional specific factors affecting why HCPs fail to
escalate, or barriers to escalation.
Participants reported clear, standardised policies and
protocols; a good knowledge of the policies, sufficient
resources including staff and good communication; and
ensuring accountability as facilitators to escalation. Where
there was no clear standardised policy or protocol; staff
didn’t know the policies; staffing shortages or competing
workloads; and lack of accountability or blame, these were
reported as barriers to escalation.
16 studies
contributed
to this review
finding. (98, 137,
185, 190-198, 200,
201, 203, 204)
There were moderate concerns
regarding methodological
limitations (3 studies with
moderate limitations, 5 studies
with minor limitations, 7 studies
with very minor limitations and 1
study with no limitations [no
rationale for research design (7
studies), unclear recruitment
strategy (3 studies), no reflexivity
considered (10 studies), unclear
ethical issues (1 study),
insufficiently rigorous data
analysis (2 studies])
There were minor
concerns
regarding
coherence. The
data were fairly
consistent within
and across studies
but there was
variation and the
sub-themes
within the
governance
finding were more
pronounced in
some studies than
others.
There were minor
concerns regarding data
adequacy. The studies
for the most part
offered data that were
moderately rich,
although data were
limited in some studies,
sample size small in one
study using focus
groups.
No or very minor
concerns
regarding
relevance. All
studies were
conducted in
hospital settings
and included
healthcare
professionals. The
EWS and RRS
varied however
from study to
study.
Moderate
confidence
The finding
was graded
as moderate
confidence
because of
moderate
concerns
regarding
methodologi
cal
limitations,
and minor
concerns for
coherence
and
adequacy.
RRT Response: refers to how the RRT responded when a
call for help was made. The behaviour of the RRT was a key
barrier or facilitator to escalation. Where the RRT
responded negatively (or not at all) or showed a lack of
professionalism to those who made the escalation call, this
was reported as a barrier to future escalation by
participants. Fear of reprimand by senior staff for making
the escalation call or fears of looking stupid were reported
barriers to escalation. Where the RRT behaved positively,
professionally, collaboratively and made key decisions,
using their expertise and provided additional support, this
was reported as a facilitator to escalation by participants.
12 studies
contributed
to this review
finding. (98, 191-
194, 196-200, 202,
203)
There were moderate concerns
regarding methodological
limitations (3 studies with
moderate limitations, 2 studies
with minor limitations, 6 studies
with very minor limitations and 1
study with no limitations [no
rationale for research design (6
studies), unclear recruitment
strategy (1 study), no reflexivity
considered (6 studies), and
insufficiently rigorous data
analysis (3 studies)])
There were minor
concerns
regarding
coherence. The
data were varied
and the sub-
themes within the
RRT Response
finding were more
pronounced in
some studies than
others. However
there was
agreement
overall.
There were minor
concerns regarding data
adequacy. The studies
for the most part
offered data that were
moderately rich,
although data were
limited in some studies,
sample size small in two
studies using focus
groups.
No or very minor
concerns
regarding
relevance. All
studies were
conducted in
hospital settings
and included
healthcare
professionals. The
EWS and RRS
interventions
varied however
from study to
study.
Moderate
confidence
The finding
was graded
as moderate
confidence
because of
moderate
concerns
regarding
methodologi
cal
limitations,
and minor
concerns for
coherence
and
adequacy.

Clinical and Cost-effectiveness of the National Early Warning System (NEWS): A Systematic Review Update
414
Summary of review finding Studies
contributing
to the review
finding
Methodological limitations Coherence Adequacy Relevance CERQual
assessment of
confidence in the
evidence
Explanation of
CERQual assessment
Professional Boundaries: refers to the barriers to
escalation that were endemic in the included studies
surrounding hierarchy, power, and jurisdictional control.
The EWS and triggering for help was viewed as a licence to
escalate and gave participants increased autonomy. It was
also reported to be a bridge across professional
boundaries ensuring communication and teamwork across
staff levels and a workaround to get a patient seen. Other
participants reported including increased conflict among
staff (between junior and senior staff) and significant
jurisdictional hierarchy as barriers to escalation.
12 studies
contributed
to this review
finding.(98, 190-
198, 200, 201)
There were moderate methodological
limitations overall (2 studies with
moderate limitations, 3 studies with
minor limitations, 6 studies with very
minor limitations and 1 study with no
limitations [no rationale for research
design (5 studies), unclear
recruitment strategy (1 study), no
reflexivity considered (8 studies), and
insufficiently rigorous data analysis (2
studies)])
There were no
or very minor
concerns
regarding
coherence.
There were minor
concerns
regarding
adequacy (data
were largely
superficial and a
rich description
was not
provided).
There were
no or very
minor
concerns
regarding
relevance.
High Confidence
The finding was
graded as high
confidence because of
moderate concerns
regarding
methodological
limitations and minor
concerns regarding
adequacy.
Clinical Experience: refers to the barriers to escalation
specifically related to individual staff and their level of
confidence and ability to detect deterioration.
Clinical confidence to recognise deterioration and
confidence in their own ability as well as using one’s
clinical judgment were all reported as facilitating factors to
escalation by participants. The EWS was also a tool which
empowered more junior staff to make the call for help and
validated their reason for calling. Some participants
reported being unable to recognise deterioration or
doubting their own ability to detect deterioration as
barriers to making a call for help. Clinical ‘overconfidence’
was also a reported barrier to escalation where staff didn’t
call for help due to the belief that they could handle the
situation themselves.
14 studies
contributed
to this review
finding. (98, 137,
185, 190-194, 197-
201, 203)
There were moderate methodological
limitations overall (3 studies with
moderate limitations, 7 studies with
minor limitations, 3 studies with very
minor limitations and 1 study with no
limitations [no rationale for research
design (8 studies), unclear
recruitment strategy (3 studies), no
reflexivity considered (8 studies),
unclear ethical issues (1 study), and
insufficiently rigorous data analysis (2
studies)])
There were no
or very minor
concerns
regarding
coherence.
There were minor
concerns
regarding
adequacy (data
were largely
superficial and a
rich description
was not
provided).
There were
no or very
minor
concerns
regarding
relevance.
High Confidence
The finding was
graded as high
confidence because of
moderate concerns
regarding
methodological
limitations and minor
concerns regarding
adequacy.

Clinical and Cost-effectiveness of the National Early Warning System (NEWS): A Systematic Review Update
415
Key: HCP: Healthcare Professional; RRT: Rapid Response Team; RRS: Rapid Response System; EWS: Early Warning System; COPD: Chronic Obstructive Pulmonary Disease.
Summary of review finding Studies
contributing
to the
review
finding
Methodological limitations Coherence Adequacy Relevance CERQual
assessment of
confidence in
the evidence
Explanation of
CERQual
assessment
Early Warning Systems: refers to the system specific
barriers to escalation.
Specific sub-populations (e.g. those with COPD) who
resulted in excessive triggering of the EWS and the
need for parameter adjustment and modification of
the EWS were reported as a deterrent to calling for
help by some participants. Others reported that the
EWS was an excellent mechanism for triage and
ensuring patients received the care they needed as
well as a valued tool for detecting deterioration.
11 studies
contributed
to this
review
finding. (137,
185, 190, 194,
195, 197, 198,
201, 203, 204,
207)
There were moderate
methodological limitations
overall (2 studies with moderate
limitations, 2 studies with minor
limitations, 6 studies with very
minor limitations and 1 study
with no limitations [no rationale
for research design (6 studies),
unclear recruitment strategy (3
studies), no reflexivity considered
(7 studies), unclear ethical issues
(1 study), insufficiently rigorous
data analysis (1 study)])
There were
moderate
concerns
regarding
coherence.
Due to the
varying
nature of the
EWS and RRS
included
there was
variation in
the data as a
result.
There were
minor concerns
regarding
adequacy (data
were largely
superficial and a
rich description
was not
provided).
There were
no or very
minor
concerns
regarding
relevance.
Moderate
confidence
The finding was
graded as moderate
confidence because
of moderate
concerns regarding
methodological
limitations and
coherence and
minor concerns
regarding
adequacy.

Clinical and Cost-effectiveness of the National Early Warning System (NEWS): A Systematic Review Update
416
14.8 Appendix 8 Deviations from the systematic review protocol
Addition of search terms
List of search terms added to search string for Q5 in sub populations for ‘frail older adults’. These include: “frail elderly” OR “frail elderly or aged or elderly” OR “frailty in elderly people” OR “frail older adult”.
Economic search terms added to the protocol (based on the last review update): “economics” or “cost* and benefit” OR “cost analysis” OR “cost management” OR “cost saving” OR “escalation cost*” OR “additional resources” OR “cost effectiveness” OR “education” OR “resources”. Qualitative search terms added to review question 6 on why do HCPs fail to escalate as the proposed search terms were not capturing qualitative studies on the subject area: “qualitative” OR “ethnography” OR “phenomenology” OR “grounded theory” OR “mixed methods” OR “study design” OR “interview” OR “attitudes” OR “themes” . Change in databases/websites searched
• ASSIA searched (rather than Social Sciences Full Texts, and Social Sciences Abstracts individually).
• Global Health not searched individually as it is indexed within Academic Search Complete.
• UK & Ireland Reference Centre Database not searched. This database includes newspapers (including tabloids) and magazines and has no date limiting function and was deemed irrelevant overall to this search.
• The Cochrane Database of Systematic Reviews is indexed within Medline and so was not searched individually.
• The Cochrane Central Register of Controlled Trials (CENTRAL) was searched within the Cochrane Library (www.cochranelibrary.com) as pre-specified.
• The Cochrane Methodology Register (CMR); the Database of Abstracts of Reviews of Effects (DARE); the Health Technology Assessment Database (HTA) and the National Health Service Economic Evaluation Database (NHS EED) were not searched after discussion with a librarian as all of these databases have ceased at various times and are not currently up to date.
• TRIP database or the WHO Global Index Medicus were not searched for main detailed search strategy, only for the more basic grey literature searching.
• GrayLit Network – database discontinued in 2007. Searchable via Science.Gov (https://www.science.gov/) for the current review update.
• Due to changes in Google's API, OpenDOAR Search has been retired and was not searched as a result.
• The Scottish Intercollegiate Guidelines Network (SIGN) website (http://www.sign.ac.uk/) could not be searched – the website was down.
Additional items added to data extraction form as requested by the GDG
• Manual vs. elective recording of vital signs (e.g. physically feeling for a pulse versus using an electronic monitor
• Oxygen parameters (range versus score)
• Minimum standard for assessment of vital signs (e.g. 6hrs versus 12hours threshold)
Study design
• Systematic reviews not to be included as a separate evidence source, rather eligible studies from within any systematic reviews identified will be individually appraised within this current review

Clinical and Cost-effectiveness of the National Early Warning System (NEWS): A Systematic Review Update
417
Collaboration in Ireland for Clinical Effectiveness Reviews (CICER), Health Information and Quality Authority (HIQA), Cork Head Office Unit 1301, City Gate, Mahon, Cork Phone: +353 (0) 1 814 7400
URL: www.hiqa.ie
© Health Information and Quality Authority 2019