iris recognition system based on zm, gf, vr and … · zernike moments (zm) is applied on segmented...
TRANSCRIPT

International Journal of Computational Intelligence Research
ISSN 0973-1873 Volume 13, Number 5 (2017), pp. 1307-1331
© Research India Publications
http://www.ripublication.com
Iris Recognition System based on ZM, GF, VR and
Matching Level Fusion
GanapathiV. Sagar1, K B Raja2, K Suresh Babu2, Chetan Tippanna Madiwalar2
and Venugopal K R2
1Dr. Ambedkar Institute of Technology, Bangalore, India.
2University Visveswaraya Collage of Engineering, Bangalore University,
Bangalore, India
Abstract
Isis is the physiological biometric trait used to recognized a person efficiently.
In this paper, we propose Iris Recognition System based on ZM, GF, VR and
Matching Level Fusion. The Region of Interest (ROI) of iris is extracted using
segmentation. Zernike Moments (ZM) is applied on segmented iris images to
extract ZM features. The novel concept of many feature vectors of a single
person are converted into single vector per person ie., Vectors Reduction
(VR). The Euclidian Distance (ED) is used to compare feature vectors in the
database with feature vectors in test section to compute the performance
parameters. The Gabor Filter (GF) is also used to extract features of iris. Many
GF feature vectors of single person are connected into single feature vector per
person. The ED is used to compare database and test feature vectors to
compute performance parameters. The performance parameters obtained from
ZM and GF are fused using normalization technique to improve the
performance parameters. It is observed that, the performance parameters are
better compared to existing techniques.
Keywords: Biometrics, Iris Recognition, Zernike Moments, Gabor Filter,
Matching Level Fusion.
1. INTRODUCTION:
The biometrics are used to authenticate persons effectively compared to traditional
methods of reorganization using Personal Identification (PID), smart cards etc.
Biometrics refers to a science of analyzing human body parts for security purposes.
Biometric technologies are becoming the foundation of an extensive array of highly
secure identification and personal verification solutions. As the level of security

1308 Ganapathi V. Sagar et al
breaches and transaction fraud increases, the need for highly secure identification and
personal verification technologies are becoming apparent. The disadvantages of
traditional methods are recall of PIN is difficult; the smart cards may be lost or stolen.
The advantages of biometrics traits are the parts of human body and behavior of
humans; hence limitation of traditional methods are eliminated. The biometric trades
are broadly classified into two groups’ viz., (i) physiological traits and (ii) behavioral
traits. The physiological traits are body parts such as fingerprints, palm prints, Iris,
Face etc., which are almost constant throughout the life time of a person. The
behavioral traits are related to the behavior of person such as gait, signature, key
stroke etc., which vary in accordance with circumstances.
Contribution: In this paper, iris recognition system is developed based on ZM and GF
features. The number of iris feature vectors of single person are converted into single
iris feature. The performance parameters are computed using ZM and GF separately.
The performance parameters obtained from ZM and GF are fused to improve
performance of the biometric system.
Organization: The remaining sections of this paper are structured as follows. Section
2 explains the literature survey of existing techniques. Section 3 describes the
proposed iris recognition model. The performance analysis is discussed in section 4.
Conclusion is given in Section 5.
2. LITERATURE SURVEY:
Mohammed A. M et al, [1] proposed a novel segmentation method for non-ideal iris
images. Since the performance in non-ideal iris images is influenced by the
segmentation accuracy of an iris recognition system, this includes pupil segmentation
and iris visible and NIR light for pupil segmentation. The active counter is initialized
near the desired object boundary to reduce the execution time and to achieve robust
segmentation. For iris segmentation, the line Hough transforms were employed for
eyelid detection. Hence if the eyelid is closed, the counter will shrink and if eyelid is
open, the counter will expand from the initial mask. John Daugman and Cathryn
Downing, [2] proposed standard iris images are 600 times larger than the iris code
templates computed from them for database storage and search. If it is desired that iris
data should be stored, transmitted and embedded in media in the form of images. To
achieve this aim with its implications for bandwidth storage. The proposed scheme is
that to combine region of interest isolation with Jpeg and Jpeg 2000 compression at
severe levels and these are tested using a publically available database of iris images.
This also shows that only about 2% to 3% of the iris code bits change as a
consequence of image compression even as severe as to 2000 bytes. The entropy
associated with states of bits in iris codes calculated from different images of the same
eye, is typically 0.506 bits. Pattabhi Ramaiah Nalla and Ajay Kumar, [3] proposed a
domain adaptation frame work because the performance degradation is possible while
matching iris images which are acquired under two different domains. A new
algorithm is introduced using markov random field’s model to significantly improve
cross-domain iris recognition. The iris recognition accuracy is improved by acquiring

Iris Recognition System based on ZM, GF, VR and Matching Level Fusion 1309
Iris images invisible and near infrared light. The performance improvement for the
cross-spectral Iris recognition is significantly higher as compared to the cross sensor
Iris recognition. Mohd Tarif khan et al, [4] proposed Iris recognition system using 1D
Gabor filter to extract the unique features which include real and imaginary parts by
using 1D normalization and segmenting the Iris and pupil boundaries of eye from
database images. The Center boundaries are quickly detected even in the presence of
eye lashes, noise and excess illumination. The excellent accuracy with excellent
processing speed is resulted by testing different Iris databases with noisy images and
noise free images. Hamming distance based matching algorithm is used for iris
template matching because it shows excellent processing speed. Chun-wei tan and
Ajay Kumar, [5] proposed an efficient Iris segmentation approach for segmenting Iris
images acquired from at a distance less constrained imaging conditions. The Iris
segmentation approach is designed based on the cellular automata which evolves
using the Grow-Cut algorithm. The method achieved average improvement of 34.8%,
31.5%and 31.4% in the average segmentation error which was obtained from the three
publicly available databases. The result of on algorithm illustrates the significant
reduction in complexity of Iris segmentation which reduces significantly the
computational cost.
Hau Ngo et al, [6] proposed a hardware design for a real time Iris segmentation
system based on an FPGA device. The iris image is detected by using the canny edge
detection algorithm and circle search. The parallel architecture which utilizes
embedded memory bits to retain binary images and reduce communication with
external memory chip. Memory controller will distribute the internal memory to keep
access time low and simulation results shows great speedup achieved by the parallel
architecture method compared CPU based implementation. Vaibhav. V.Dakre Pravin,
[7] proposed multi-model biometrics based on combination of face and iris biometric
features. In an image, face is detected using Vi ola jones algorithms and these make
use of circular Hough transform for iris segmentation. The images are pre-processed
and segmented successfully. The feature vectors are fused at feature level fusion
using z-norm technique and forming a single vector. Lydia Elizabath et al, [8]
proposed a novel approach of grid based iris biometric water marking technique based
on a canny edge detection algorithm. The grid based watermarking algorithm uses a
hybrid Singular Value Decomposition (SV D) and Discrete Wavelet Transform
(DWT). The hybrid DWT and SVD together makes the watermarking scheme strong
and undetectable. In this scheme fault acceptance rate and fault error rate
areminimized efficiently. Simina Emerich et al, [9] proposed iris feature extraction
based on dense descriptors and also captures local details, pixel by pixel over the
complete image. In order to capture both spatial and frequency information. The three
different techniques are presented viz., Local Binary Pattern (LBP), Local Phase
Quantization(LPQ) and Differential Excitation. The experiments were performed on
the UPOL database, which are captured in the visible light due to clarity of the texture
present in the component images. These suggest that rotation invariant LBP and
rotation invariant LPQ descriptors are good for iris texture analysis. This results in
the iris micro-texture patterns such as crypts, furrows or pigment spots which are
characterized by patched based descriptors.

1310 Ganapathi V. Sagar et al
Diego Grangnaniello et al, [10] proposed a number of image descriptors for the live-
ness detection task in authentication system based on various biometric traits such as
face, iris and fingerprint. Both simple descriptors with independent quantization of
features, already considered for some live-ness detection tasks and more complex
ones, based on the joint quantization of rich features, have been considered. Hau
T.Ngo et al, [11] presented an architecture design for a high performance iris
boundary detection system based on FPGA. A novel design and implementation
using circular Hough transform was proposed to reduce the memory requirement by
93% as compared to the direct implementation of the circular of transform while
maintaining a high detection rate of 92%. The parallel pipeline implementation of the
proposed architecture demonstrates a high speed processing capability to support real-
time iris recognition system. Therefore, the proposed technology is used in portable
consumer devices such as tablets and mobile phones where iris recognition algorithm
is used. Sheng-Hsun Hsieh et al, [12] proposed a novel hardware-software hybrid
method to increase the stand-off distance in an iris recognition system. The system
hardware design used is optimized wavefront coding technique to extend the depth of
field. By using wave front coding to compensate for the blurring of the image on the
software side, the local patch-based super-resolution method to restore the blurred
image to its clear version. The proposed system increases the capture volume of a
conventional iris recognition system by three times and maintained the system high
recognition rate. Raghavendra and Busch, [13] presents depth analysis of presentation
attacks on iris recognition system especially focusing on the photo print attacks and
the electronic display attack. The algorithm introduced relatively large scale visible
spectrum iris artifact database consists of 3300 iris normal and artifact samples that
are captured by simulating iris recognition system by using five different attacks.
Multiscale binarized statistical image features and linear support vector machine are
used based on Presentation Attack Detection (PAD). Extensive experiments are
carried out on four different publically available iris artifact databases results
outstanding performance of the PAD scheme with various well established state of the
art schemes. Nadia Othman and Bernodette [14] proposed several novel contributions
to the problem of iris performance decrease due to degradations of the iris image,
occurring in particular when the acquisition distance is increased. The approach is
based on simple SR techniques applied on four different frames of video to improve
by taking into account some quality criteria such as (i) the super resolution improves
significantly the performance of iris recognition only when the images are of good
quality. This is the case, when the fusion involves, images are taken from short
distances or the best images from long distances. ii] the local quality super resolution
approach enhances the performance for the short distances, the quality of the image
decreases and for the long distances, the quality of the image performances increases
using local quality super resolution approach, bad segmented pixels are detected and
to discard them from the fusion procedure by using local quality measure.

Iris Recognition System based on ZM, GF, VR and Matching Level Fusion 1311
3. PROPOSED MODEL
In this section, we present the proposed iris recognition model based on ZM, GF,
reduction of feature vectors and fusion at matching level. The iris template is created
and features are extracted using ZM and GF. The numbers of features vectors of
single persons are converted into single person are converted into single feature vector
concept is introduced. The performance parameters are fused in matching level to
enhanced results. The block diagram of the model is shown in figure 1.
3.1Iris database
A stable and unique internal organ of eye with rich texture features present between
pupil and sclera boundary in eye. The eye images captured under Near Infrared light
source provide better iris patterns with good contrast and illuminations. The Chinese
Academy of Science Institute and Automation (CASIA) V.1 Iris database [15] created
with NIR light source consists of 108 persons having each person’s seven different
images forming total 756 eye images. In the Iris database, the seventh image of every
person is considered as test Iris image. The eye images of CASIA V.1 database of a
single person is shown in figure.2. The Total Success Rate (TSR), False Rejection
Rate (FRR) and False Accept Rate (FAR) are computed by considering number of
Person inside Database (PID) and number of Persons outside Database (POD).
Figure 1. Block diagram of proposed model.

1312 Ganapathi V. Sagar et al
Figure 2. Seven Samples of single person (CASIA V.1 database)
3.2 Iris templates
The iris is the circular portion between inner pupil and outer sclera. The horizontal iris
part is considered and extracted for iris template. The vertical iris part ie., above and
below the pupil is removed as the little portion is occupied by eyelids and eyelashes.
The horizontal iris template is obtained using iris localization and segmentation.
3.2.1 Iris Localization
The black portion in an eye is pupil, hence it has low intensity values. The sclera is
brightest portion in an eye, hence the intensity value are high. The circular iris portion
has intensity values between pupil and sclera. The appropriate threshold intensity
values are fixed and masking upper intensity values to locate pupil as shown in the
figure 3(a). The binary image is subjected to connected component analysis, which
scans the image and tag the binary image. The maximum diameter of pupil is obtained
using equi-diameter region properties of connected component analysis of binary
image as shown in figure 3(b).
(a) Pupil with eyelashes (b) extracted pupil
Figure 3. Extraction of pupil from an eye image
3.2.2 Iris Segmentation
The iris part is extracted from an eye image using segmentation. The centroid and
bounding box are used to local center and radius of localized pupil. The upper and
lower portions of pupil are removed by manipulating pupil radius and outer radius of
pupil vertically to avoid eyelids and eyelashes in iris part as shown in figure 4(a). The
horizontal iris portion nearer to pupil is considered by taking 45 pixels left and right
of pupil boundary based on springer CASIA V.1 database analysis [15] as shown in

Iris Recognition System based on ZM, GF, VR and Matching Level Fusion 1313
figure 4(b). The left and right side portions of iris parts are concentrated to obtain iris
template.
(a)Localized iris part (b) segmented iris (c) Iris Template
Figure 4. Iris Template formations
3.3 Zernike Moments (ZM):
A statistical measure of pixel distribution around centre of gravity of an image which
capture global character shaper information. The ZM are designed to capture both
global and geometric information of an image. The ZM are invariant to image. The
digital image of square size is mapped to the unit circle with its origin at the images
center to compute ZM’s. The pixels falling outside the unit circle are discarded. The
gray-scale image is converted into binary image for ZM. The square image is
converted into polar coordinate as shown in Figure 5.
(a) NxN image (b) Unit Circle Mapped image bitmap onto.
Figure 5. Image Conversion
The size of an image is N*N with x1 x2 are x-axis dimension and y1 y2 are y-axis
dimensions. The center of the limit disc is (x’, y’) with is polar value and is polar
angle. The image mapped to polar co-ordinate by computing distance d as given as
equation 1.
𝑑 = √((𝑥2−𝑥′)
2
2) + (
(𝑦2−𝑦′)2
2)………………………………………………………… (1)

1314 Ganapathi V. Sagar et al
The distance vector and angle for any pixel (x, y) in polar co-ordinate are computed
using equation 2 and 3.
𝜌 = √(𝑥−𝑥′)2+(𝑦−𝑦′)2
𝑑……………………………………………… . . ……………… . . …(2)
𝜃 = 𝑡𝑎𝑛−1(𝑥 − 𝑥 ′)
(𝑦 − 𝑦 ′)……………………………………………………………………(3)
The Zernike complex polynomials (x, y) which form a complete orthogonal set over
the unit disc of x2+y2≤1 is polar co-ordinate is given in equation 4.
𝑉𝑎𝑏(𝑥, 𝑦) = 𝑉𝑎𝑏(𝜌, 𝜃) = 𝑅𝑎𝑏(𝜌)𝑒𝑗𝑏𝜃…………………………………………… . . (4)
Where radial polynomial is given equation 5.
𝑅𝑎𝑏(𝜌) = ∑(−1)𝑘𝑝
𝑘=0
(𝑎 − 𝑘)!
𝑘! (𝑝 − 𝑘)! (𝑞 − 𝑘)!∗ 𝜌𝑎−2𝑘………………………………(5)
Where a ≥ 0, |b| ≤a, a - |b| = even,
, p = (a − |b|) /2, q = (a + |b|) /2
a = order of Zernike moments and non-negative integer.
b = Repetitions and it is an integer that satisfies the conditions.
The ZM of order a and repetition b is computed using equation 6.
𝑍𝑎𝑏 =𝑎 + 1
𝜋∑∑𝐼(𝜌, 𝜃)𝑉∗𝑎𝑏(𝜌, 𝜃)………………………………………………(6)
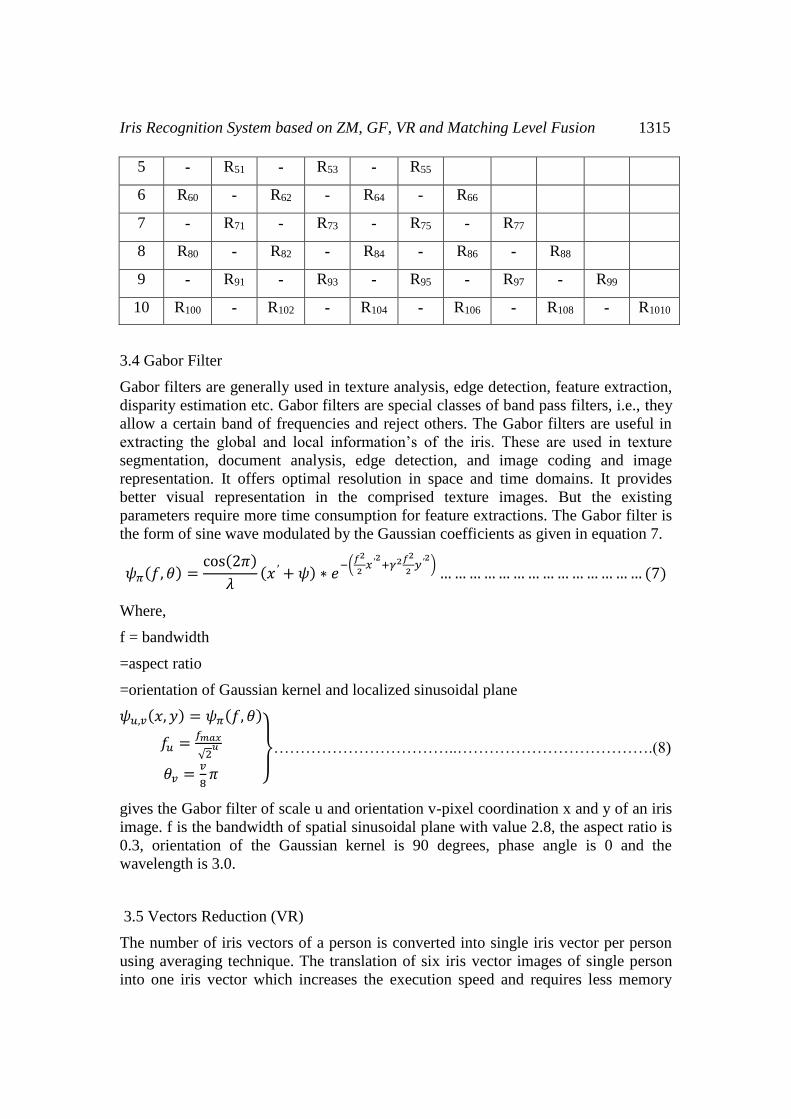
Where *is the complex conjugate. The ZM for order 10 with first 66 moments are
given in the table 1.
Table 1. List of Zernike moments up to order a=10
a\b 0 1 2 3 4 5 6 7 8 9 10
0 R00 -
1 - R11
2 R20 - R22
3 - R31 - R33
4 R40 - R42 - R44
Iris Recognition System based on ZM, GF, VR and Matching Level Fusion 1315
5 - R51 - R53 - R55
6 R60 - R62 - R64 - R66
7 - R71 - R73 - R75 - R77
8 R80 - R82 - R84 - R86 - R88
9 - R91 - R93 - R95 - R97 - R99
10 R100 - R102 - R104 - R106 - R108 - R1010
3.4 Gabor Filter
Gabor filters are generally used in texture analysis, edge detection, feature extraction,
disparity estimation etc. Gabor filters are special classes of band pass filters, i.e., they
allow a certain band of frequencies and reject others. The Gabor filters are useful in
extracting the global and local information’s of the iris. These are used in texture
segmentation, document analysis, edge detection, and image coding and image
representation. It offers optimal resolution in space and time domains. It provides
better visual representation in the comprised texture images. But the existing
parameters require more time consumption for feature extractions. The Gabor filter is
the form of sine wave modulated by the Gaussian coefficients as given in equation 7.
𝜓𝜋(𝑓, 𝜃) =cos(2𝜋)
𝜆(𝑥 ′ + 𝜓) ∗ 𝑒
−(𝑓2
2𝑥′2+𝛾2
𝑓2
2𝑦′2)
……………………………………(7)
Where,
f = bandwidth
=aspect ratio
=orientation of Gaussian kernel and localized sinusoidal plane
𝜓𝑢,𝑣(𝑥, 𝑦) = 𝜓𝜋(𝑓, 𝜃)
𝑓𝑢 =𝑓𝑚𝑎𝑥
√2𝑢
𝜃𝑣 =𝑣
8𝜋 }
……………………………..……………………………….(8)
gives the Gabor filter of scale u and orientation v-pixel coordination x and y of an iris
image. f is the bandwidth of spatial sinusoidal plane with value 2.8, the aspect ratio is
0.3, orientation of the Gaussian kernel is 90 degrees, phase angle is 0 and the
wavelength is 3.0.
3.5 Vectors Reduction (VR)
The number of iris vectors of a person is converted into single iris vector per person
using averaging technique. The translation of six iris vector images of single person
into one iris vector which increases the execution speed and requires less memory

1316 Ganapathi V. Sagar et al
while creating iris vector database. The converting six iris vectors of a single person
into one iris vector is as shown in figure 6.
Figure 6. Vectors Reduction from six images to single image
3.6 Euclidean distance
The distance between database features (ai) and test database (bi) features is given in
equation 9.
𝐸𝐷 = √∑ (𝑎𝑖 − 𝑏𝑖)𝑁𝑖=1 ……………………………………………………………(9)
Where,
N=Number of coefficients in a vector
= Coefficient values of vectors in the database
= Coefficient values of vectors in the test image
The ED is use to get similarities and dissimilarities of iris images to verify the
performance.
3.7 Matching level Fusion
The performance Parameters such as percentage optimum TSR and EER values are
fused based score level fusion using normalization technique and is given in
equation 10.
𝑁𝑜𝑟𝑚𝑎𝑙𝑖𝑧𝑎𝑡𝑖𝑜𝑛 𝐹𝑢𝑠𝑖𝑜𝑛 = [𝐴𝑐𝑡𝑢𝑎𝑙 𝑣𝑎𝑙𝑢𝑒 𝑜𝑓 𝑂𝑝𝑡.𝑇𝑆𝑅 𝑜𝑓 𝑍𝑀
𝐴𝑐𝑡𝑢𝑎𝑙 𝑣𝑎𝑙𝑢𝑒 𝑜𝑓 𝑂𝑝𝑡.𝑇𝑆𝑅 𝑜𝑓 𝐺𝐹] ∗ [𝑀𝑎𝑥𝑇𝑆𝑅 𝑜𝑓 𝐺𝐹]… (10)

Iris Recognition System based on ZM, GF, VR and Matching Level Fusion 1317
4. PERFORMANCE ANALYSIS
In this section, the definitions of performance parameters are given and also presented
experimental results obtained from publicly available database CAISA V.1 to test the
performance of the proposed iris recognition method.
4.1 Definitions of Performance Parameters
4.1.1 False Rejection Rate (FRR): It is defined as the probability of genuine persons
being rejected as an imposter. It is the ratio of number of genuine persons rejected to
the total number of persons inside the database and is computed in equation 11.
𝐹𝑅𝑅 =𝑛𝑢𝑚𝑏𝑒𝑟 𝑜𝑓 𝑔𝑒𝑛𝑢𝑖𝑛𝑒 𝑝𝑒𝑟𝑠𝑜𝑛𝑠 𝑟𝑒𝑗𝑒𝑐𝑡𝑒𝑑
𝑡𝑜𝑡𝑎𝑙 𝑛𝑢𝑚𝑏𝑒𝑟 𝑜𝑓 𝑝𝑒𝑟𝑠𝑜𝑛𝑠 𝑖𝑛𝑠𝑖𝑑𝑒 𝑡ℎ𝑒 𝑑𝑎𝑡𝑎𝑏𝑎𝑠𝑒 …………………… (11)
4.1.2 False Acceptance Rate (FAR): Is defining as the probability of imposter being
accepted as genuine persons. It is ratio of imposters accepted as genuine persons
from outside the database to the total number of persons in the outside database and is
computed in equation 12.
𝐹𝐴𝑅 =𝑛𝑢𝑚𝑏𝑒𝑟 𝑜𝑓 𝑖𝑚𝑝𝑜𝑠𝑡𝑒𝑟 𝑎𝑐𝑐𝑒𝑝𝑡𝑒𝑑 𝑎𝑠 𝑔𝑒𝑛𝑢𝑖𝑛𝑒 𝑝𝑒𝑟𝑠𝑜𝑛𝑠
𝑡𝑜𝑡𝑎𝑙 𝑛𝑢𝑚𝑏𝑒𝑟 𝑜𝑓 𝑝𝑒𝑟𝑠𝑜𝑛𝑠 𝑜𝑢𝑡𝑠𝑖𝑑𝑒 𝑡ℎ𝑒 𝑑𝑎𝑡𝑎𝑏𝑎𝑠𝑒………………. (12)
4.1.3 Equal Error Rate (EER): Is defined as error trade of between FRR and FAR i.e.,
FAR = FRR for a particular threshold value. A lower EER value indicates better
performance of biometric systems.
4.1.4 Total Success Rate (TSR): Is the measure of accuracy of biometric systems. It
is the ratio of the total number of genuine persons identified correctly in the database
to the total number of persons inside the database and is computed in equation 13.
𝑇𝑆𝑅 =𝑔𝑒𝑛𝑢𝑖𝑛𝑒 𝑝𝑒𝑟𝑠𝑜𝑛𝑠 𝑖𝑑𝑒𝑛𝑡𝑖𝑓𝑖𝑒𝑑 𝑐𝑜𝑟𝑟𝑒𝑐𝑡𝑙𝑦
𝑡𝑜𝑡𝑎𝑙 𝑛𝑢𝑚𝑏𝑒𝑟 𝑜𝑓 𝑝𝑒𝑟𝑠𝑜𝑛𝑠 𝑖𝑛𝑠𝑖𝑑𝑒 𝑡ℎ𝑒 𝑑𝑎𝑡𝑎𝑏𝑎𝑠𝑒…………………… (13)
• Optimum Total Success Rate (Opt.TSR): The value of TSR corresponding to the
EER for specified threshold.
• Maximum Total Success Rate (Max.TSR): The value of maximum TSR for
specified threshold value irrespective of error value.
4.2 Performance variations:
The variations of performance parameter with threshold for different combinations of
Person Inside Database (PID) and Person Outside Database (POD) using ZM, GF and
proposed fusion techniques are analyzed in this section. The comparison of proposed
method using the existing methods is also discussed in this section.

1318 Ganapathi V. Sagar et al
4.2.1 Experimental results using ZM for different combination of PID and POD’s:
The variations of performance parameters such as percentage FRR, FAR and TSR
with threshold using ZM for different combination of PID and POD’s are analyzed in
this section. The percentage variations of FAR, FRR and TSR with threshold for PID
and POD combination of 20:80, 30:70, 50:50, 60:40 and 80:20 are given in Table
2,3,4,5 and 6 respectively. The percentage FRR value decreases with increasing in
threshold values and the value is 100% for lower values of the threshold for all
combinations of PID and POD.
The percentage of FAR and TSR increases with threshold values and attains
maximum value for higher threshold for all combinations of PID and POD’s. The
maximum TSR values for all combinations of PID and POD is 100% for higher
values of threshold.
The percentage variation of FRR, FAR and TSR are plotted in the figure7,8,9,10 and
11 for PID and POD combinations of 20:80, 30:70, 50:50, 60:40 and 80:20
respectively. It is observed that the percentage FRR values decreases with threshold
and the percentage of FAR and TSR are increases with threshold values. The
percentage values of FRR and TSR are 100% for the lower and higher values of
threshold respectively. The percentage EER values are 16,14,16,15 and 14 for the PID
and POD combinations of 20:80, 30:70, 50:50, 60:40 and 80:20 respectively. The
EER values are almost constant around 15 for all combination of PID and POD’s. The
percentage optimum TSR (opt.TSR) are 85, 86.6, 84, 85 and 84for PID and POD
combinations of 20:80, 30:70, 50:50, 60:40 and 80:20 respectively.
Table 2. Performance variations with threshold for PID and POD combination of 20
& 80 using ZM technique.
Threshold %FRR %FAR %TSR
0.57 100 0 0
0.58 95 0 5
0.69 35 0 65
0.70 30 3.75 70
0.74 20 12.5 80
0.75 15 17.75 85
0.76 15 18.75 85
0.77 10 23.75 90
0.84 5 72 95
0.85 0 80 100

Iris Recognition System based on ZM, GF, VR and Matching Level Fusion 1319
Figure 7. Performance curves using ZM for PID and POD combinations of 20 & 80
Table 3. Performance variations with threshold for PID and POD combination of 30
& 70 using ZM technique.
Threshold %FRR %FAR %TSR
0.54 100 0 0
0.69 36.6 0 63.3
0.70 33.3 2.8 66.6
0.73 23.3 11.4 76.6
0.74 16.6 14.2 83.3
0.75 13.3 14.0 86.6
0.77 13.3 24.5 86.6
0.79 10 30.0 90.0
0.82 3.3 68.5 96.6
0.84 0 75.7 100

1320 Ganapathi V. Sagar et al
Figure 8. Performance curves using ZM for PID and POD combinations of 30 & 70
Table 4. Performance variations with threshold for PID and POD combination of 50
& 50 using ZM technique.
Threshold %FRR %FAR %TSR
0 100 0 0
.05 100 0 0
0.35 100 0 0
0.50 96.0 0 4.0
0.55 90.0 0 10.0
0.65 50.0 0 50.0
0.70 22.2 4.0 78.0
0.73 16.6 13.6 82.0
0.75 12.2 30.0 88.0
0.90 0 98.0 100

Iris Recognition System based on ZM, GF, VR and Matching Level Fusion 1321
Figure 9. Performance curves using ZM for PID and POD combinations of 50 & 50
Table 5. Performance variations with threshold for PID and POD combination of 60
& 40 using ZM technique.
Threshold %FRR %FAR %TSR
0.56 100 0 0
0.60 68.3 0 31.6
0.69 21.6 0 78.3
0.70 20.0 5.0 80.0
0.73 15.3 15.0 85.0
0.74 13.3 20.0 86.6
0.75 10.0 27.5 90.0
0.81 5.0 60.0 95.0
0.84 1.6 82.5 98.8
0.87 0 90.0 100

1322 Ganapathi V. Sagar et al
Figure 10. Performance curves using ZM for PID and POD combinations of 60 & 40
Table 6. Variation Performance variations with threshold for PID and POD
combination of 80 & 20 using ZM technique.
Threshold %FRR %FAR %TSR
0.52 100 0 0
0.59 67.5 0 32.5
0.68 25.0 10.0 75.0
0.73 16.25 15.0 82.5
0.74 13.75 20.0 85.0
0.76 6.25 35.0 90.0
0.77 3.7 45.0 92.5
0.83 2.5 90.0 92.5
0.87 0 100 95.0
0.90 0 100 100

Iris Recognition System based on ZM, GF, VR and Matching Level Fusion 1323
Figure 11. Performance curves using ZM for PID and POD combinations of 80 & 20
4.2.2 Experimental results using GF for different combinations of PID and POD’s
The performance parameter such as percentage FRR, FAR, TSR and EER and their
variations with threshold values for different combinations of PID and POD’s are
discussed in this section. The variations of performance parameters with threshold for
different PID and POD combinations of 20:80, 30:70, 50:50, 60:40 and 80:20 are
given in table 7,8,9,10 and 11 respectively.
The values of percentage FAR and TSR increases with increase in threshold values.
The maximum percentage TSR is 100 for all combinations of PID and POD’s for
higher values of threshold. The percentage value of FRR is zero for higher values of
threshold and FAR value is zero for low values of threshold. The graphical
representation of percentage FRR, FAR and TSR for variations of threshold values
are given in Figure 12,13,14,15 and 16 for different combinations of PID and POD’s.
It is observed that the percentage FRR and FAR values decrease with increase in
threshold values. The percentage values of TSR and FAR increases in increases in
threshold values. The percentage EER values are 14,10,18,14 and 15 for the PID and
POD combinations of 20:80, 30:70, 50:50, 60:40 and 80:20 respectively. The
percentage optimum TSR values are 85,90,82,85 and 85 for PID and POD

1324 Ganapathi V. Sagar et al
combinations of 20:80, 30:70, 50:50, 60:40 and 80:20 respectively. The maximum
percentage TSR value is 100 for all combinations of PID and POD.
Table 7. Performance variations with threshold for PID and POD combination of 50
& 50 using GF technique.
Threshold %FRR %FAR %TSR
0.54 100 0 0
0.55 95 0 4
0.68 40 0 60
0.69 30 1.25 70
0.73 20 10 80
0.75 15 13.75 85
0.76 15 17.75 85
0.80 10 38.75 90
0.84 5 66.25 95
0.85 0 76.6 100
Figure 12. Performance curves using GF for PID and POD combinations of 20 & 80

Iris Recognition System based on ZM, GF, VR and Matching Level Fusion 1325
Table 8. Performance variations with threshold for PID and POD combination of 30
& 70 using GF technique.
Threshold %FRR %FAR %TSR
0.54 100 0 0
0.66 36.6 0 63.3
0.69 26.6 2.8 73.3
0.71 20 7.1 80.0
0.72 16.6 8.5 83.33
0.73 10 11 90.00
0.74 6.6 12.8 93.3
0.75 6.6 18.5 93.3
0.78 3.3 30.0 96.66
0.93 0 97.5 100
Figure 13. Performance curves using GF for PID and POD combinations of 30 & 70

1326 Ganapathi V. Sagar et al
Table 9. Performance variations with threshold for PID and POD combination of 50
& 50 using GF technique.
Threshold %FRR %FAR %TSR
0.50 100 0 0
0.64 52.0 0 48.0
0.69 24.0 2.0 76.0
0.71 22.0 12.0 78.0
0.72 18.0 16.0 82.0
0.73 18.0 16.0 82.0
0.75 10.0 30.0 90.0
0.77 8.0 36.0 92.0
0.81 6.0 58.0 94.0
0.92 0 98 100
Figure 14. Performance curves using GF for PID and POD combinations of 50 & 50

Iris Recognition System based on ZM, GF, VR and Matching Level Fusion 1327
Table 10. Performance variations with threshold for PID and POD combination of 60
& 40 using GF technique.
Threshold %FRR %FAR %TSR
0.44 100 0 0
0.62 53.3 0 46.6
0.68 30 0 70.0
0.69 21.6 2.5 78.3
0.71 20.0 12.5 80.0
0.72 15.0 15.0 85.0
0.75 8.3 27.5 91.6
0.81 5.0 42.5 95.0
0.84 1.6 82.5 98.33
0.9 0 97.5 100
Figure 15. Performance curves using GF for PID and POD combinations of 60 & 40

1328 Ganapathi V. Sagar et al
Table 11. Performance variations with threshold for PID and POD combination of 80
& 20 using GF technique.
Threshold %FRR %FAR %TSR
0.48 100 0 0
0.62 48.75 0 51.2
0.68 23.7 5.0 76.2
0.71 20.0 10.0 78.7
0.73 15.0 15.0 85.0
0.74 12.5 20.0 87.5
0.75 10.0 25.0 90.0
0.78 3.75 45.0 95.0
0.81 2.5 70.0 96.2
0.89 0 100 98.7
Figure 16. Performance curves using GF for PID and POD combinations of 80 & 20
4.2.3 Experimental results of proposed fusion technique and compared with ZM and
GF techniques.
The Performance parameter such as percentage optimum TSR and EER values of ZM
and GF techniques are fused at matching level in the proposed model to obtained
better performance results. The percentage Opt.TSR and EER values for different
combination of PID and POD’s with ZM, GF and Proposed fusion techniques are
given in Table 12.

Iris Recognition System based on ZM, GF, VR and Matching Level Fusion 1329
Table 12. Comparison of Different Technique with ZM & GF Techniques
PID:POD ZM GF FUSION
%
Opt.TSR %EER %
Opt.TSR %EER %
Opt.TSR %EER
20:80 85.0 0.16 85 0.14 90.0 11(0.11)
30:70 86.5 0.14 90 0.10 86.5 14(0.14)
50:50 84.0 0.16 82 0.17 93.0 08(0.08)
60:40 85.0 0.15 85 0.14 90.0 10(0.10)
80:20 84.0 0.15 85 0.15 89.0 10(0.10)
4.2.4 Performance comparison of proposed method with existing methods
In order to evaluate the efficiency of our method, we compared it with the existing
method in terms of maximum TSR for CASIA iris database. The maximum TSR
value of proposed method is 100%, which is better compared to 92.9% and 84.3%
values presented by Chun Wei Tan and Ajay Kumar [16] and Rizal Isnonto[17].
Table 13. Performance comparison of proposed method with existing methods.
Sl
No. Author Techniques %Max TSR
1 Chun-Wei Tan and Ajay
Kumar [16] Log Gabor +Geo-key
Transformation 92.9
2 R. Rizal Isnanto [17] Bi orthogonal wavelet
transform 84.3
3 Proposed Method Fusion of ZM and GF 100
5. CONCLUSION:
The iris is physiological biometric trait and has unique features even for twins. In this
paper, we proposed iris recognition system based on ZM, GF, VR and fusion of
performance parameter at matching level. The ROI of iris is obtained using
segmentation. The ZM and GF are used to extract feature from ROI of iris. The
number of feature vectors of single person are converted into single vector using
averaging technique ie., Vector Reduction(VR) to reduce memory and improve the
speed of matching. The performance parameters computed from ZM and GF are fused
at matching level to improve the performance of biometric system. It is observed that
the performance of the proposed method is better compared to existing methods.

1330 Ganapathi V. Sagar et al
REFERENCES:
[1] Mohammed A M Abdullah, Satnam S Dlay, Wai L Woo and Jonathon A
Chambers, “Robust Iris Segmentation Method Based on a New Active
Contour Force with a Noncircular Normalisation” IEEE Transactions on
systems, Man and Cybernetics: Systems, pp.1-14, 2016.
[2] John Daugman and Cathryn Downing, “Effect of Severe Image Compressin
on Iris Recogntion Performance” IEEE Transactions on Information Forensics
and Security, Vol. 3, No.1, pp.52–61, March, 2008.
[3] Pattabhi Ramaiah Nalla and Ajay Kumar, “Toward More Accurate Iris
Recognition Using Cross-Spectral Matching” IEEE transactions on Image
processing, Vol.26, No.1, pp.208-221, January, 2017.
[4] Mohd Tariq Khan, Deepak Arora and Shashwat Shukla, “Feature Extraction
through Iris Images using 1-D Gabor Filter on Different Iris Datasets” IEEE
International Conferenceon contemporary computing (IC3), pp.445-450,
2013.
[5] Chun-Wei Tan and Ajay Kumar “Efficient Iris Segmentation using Grow-Cut
Algorithm for Remotely Acquired Iris Images” IEEE International
Conference on biometrics: Theory, Application and System (BTAS, pp.99-104,
2012.
[6] Hau Ngo, Jennifer Shafer, Robert Ives, Ryan Rakvic and Randy Broussard
“Real Time Iris Segmentation on FPGA” IEEE International Conference on
Applications-Specific Systems, pp.1-7, 2012.
[7] Vaibhav V Dakre and Pravin G Gawande “An Efficient Technique of
Multimodal Biometrics using fusion of Face and Iris features” IEEE
International Conference on Advances in Signal Processing, pp.231-236,
June, 2016.
[8] Lydia Elizabeeth B, Duraipandi C, Anju Pratap and Rhymend Uthariaraj V “A
Grid based Iris Biometric Watermarking using Wavelet Transform”
International Conference on Recent Trends in Information Technology,
pp.978-989, 2014.
[9] Simina Emerich, Raul Malutan, Eugen Lupu and Laszlo Lefkovits “Patch
based Descriptors for Iris Recognition” IEEE International Conference on
Intelligent Computer Communication and Processing (ICCP), pp.187-191,
2016.
[10] Diego Gragnaniello, Giovanni Poggi, Carlo Sansone and Luisa Verdoliva “An
Investigation of Local Descriptors for Biometric Spoofing Detection” IEEE
transactions on Information Forensics and Security, Vol. 10, No.4, pp.849–
863, April, 2015.
[11] Hau T Ngo, Ryan N Rakvic, Randy P Broussard and Robert W Ives
“Resource-Aware Architecture Design and Implementation of Hough

Iris Recognition System based on ZM, GF, VR and Matching Level Fusion 1331
Transform for a Real-Time Iris Boundary Detection System” IEEE
transactions on Consumer Electronics, Vol.60, No.3, pp.485–492, August,
2014.
[12] Sheng-Hsun Hsieh, Yung-Hui Li, Chung-Hao Tien and Chin-Chen Chang,
“Extending the Capture Volume of an Iris Recognition System using
Wavefront Coding and Super-Resolution” IEEE Transactions on Cybernetics,
Vol.46, No.12, pp.3342-3350, December, 2016.
[13] R Raghavendra and Christroph Busch “Robust Scheme for Iris Representation
Attack Detection Using Multiscale Binarized Statistical Image Features” IEEE
Transactions on Information Forensics and Security, Vol. 10, No.4, pp.703–
715, April, 2015.
[14] Nadia Othman and Bernadette Dorizzi “Impact of Quality-Based Fusion
Techniques for Video-Based Iris Recognition at a Distance” IEEE
transactions on Information Forensics and Security, Vol. 10, No.8, pp.1590–
1602, August 2015.
[15] http://www.sinobiometrics.com, CASIA Iris Image Database.
[16] Chun-Wei Tan and Ajay Kumar “Efficient and Accurate At-a-Distance Iris
Recognition Using Geometric Key-Based Iris Encoding” IEEE Transaction on
Information Forensics and Security, Vol. 9, No. 9, pp-1518-1526, September
2014.
[17] R. Rizal Isnanto “Isis Recognition Analysis Using Biorthogonal Wavelets
Transform for Feature Extraction” IEEE International conference on
Information Technology, Computer and Electrical Engineering, pp.183-187,
March 2015.

1332 Ganapathi V. Sagar et al