ipsas accounting mrk performance measurement and …imd.unjspf.org/presentations/imd_accounting and...
TRANSCRIPT

0
IPSAS Accounting MRK Performance Measurement
and Reporting
Investment Management Division

1
Objective of Presentation
The objective of this presentation is to provide clarity on the differencesbetween terminology used for investment accounting and investmentperformance reporting purposes.
In certain cases, the same terminology may be used for both purposes, butthese terms may have different meanings depending upon the report.
It is important to identify both the term used and the reporting purpose towhich the term applies.
Otherwise, there is a risk that terminology could be taken out of context, andthis can affect the conclusions and/or findings of the observer.
2
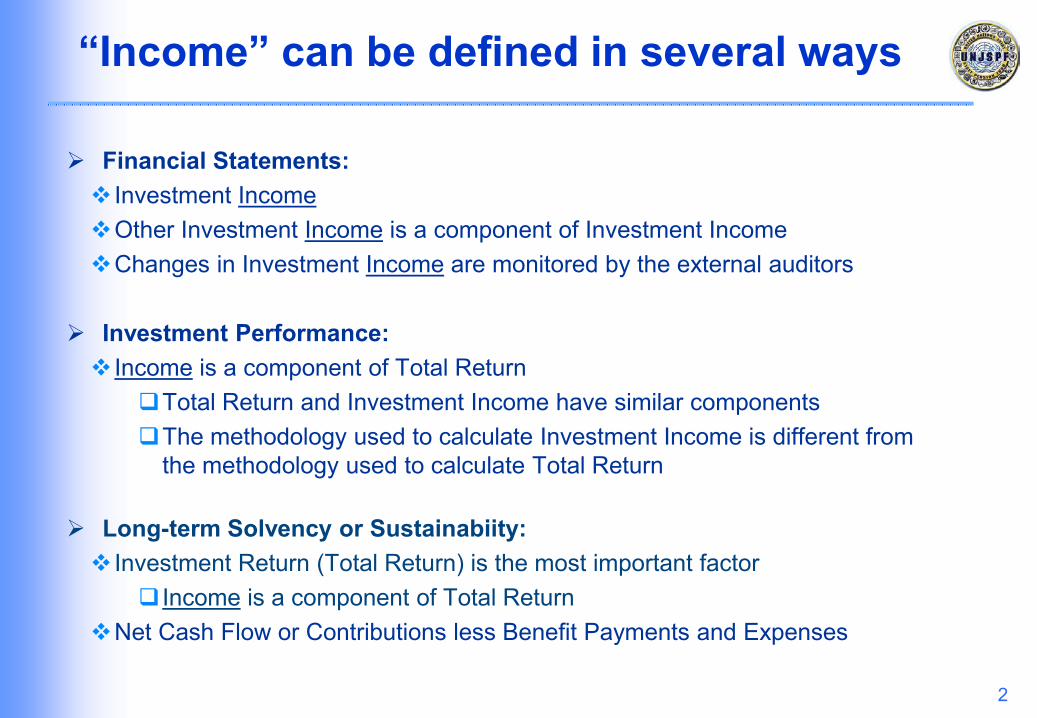
“Income” can be defined in several ways
Financial Statements: Investment IncomeOther Investment Income is a component of Investment IncomeChanges in Investment Income are monitored by the external auditors
Investment Performance: Income is a component of Total Return
Total Return and Investment Income have similar componentsThe methodology used to calculate Investment Income is different from
the methodology used to calculate Total Return
Long-term Solvency or Sustainabiity: Investment Return (Total Return) is the most important factor
Income is a component of Total ReturnNet Cash Flow or Contributions less Benefit Payments and Expenses
3
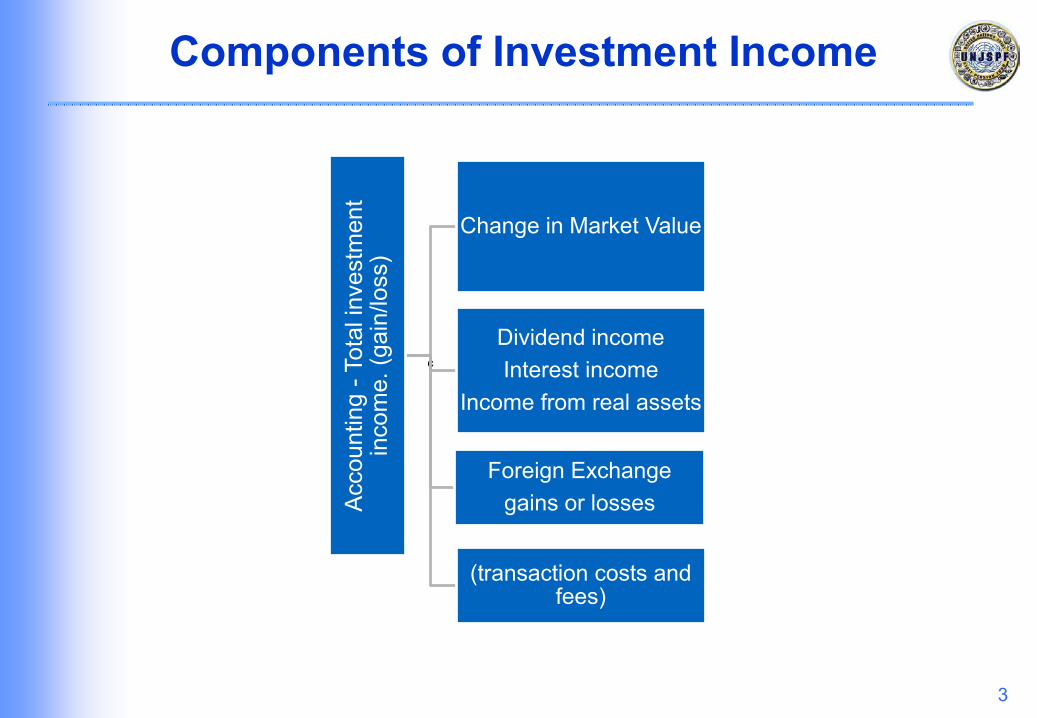
Components of Investment Income
çAc
coun
ting
-Tot
al in
vest
men
t in
com
e. (g
ain/
loss
)
Change in Market Value
Foreign Exchange gains or losses
Dividend incomeInterest income
Income from real assets
(transaction costs and fees)
4
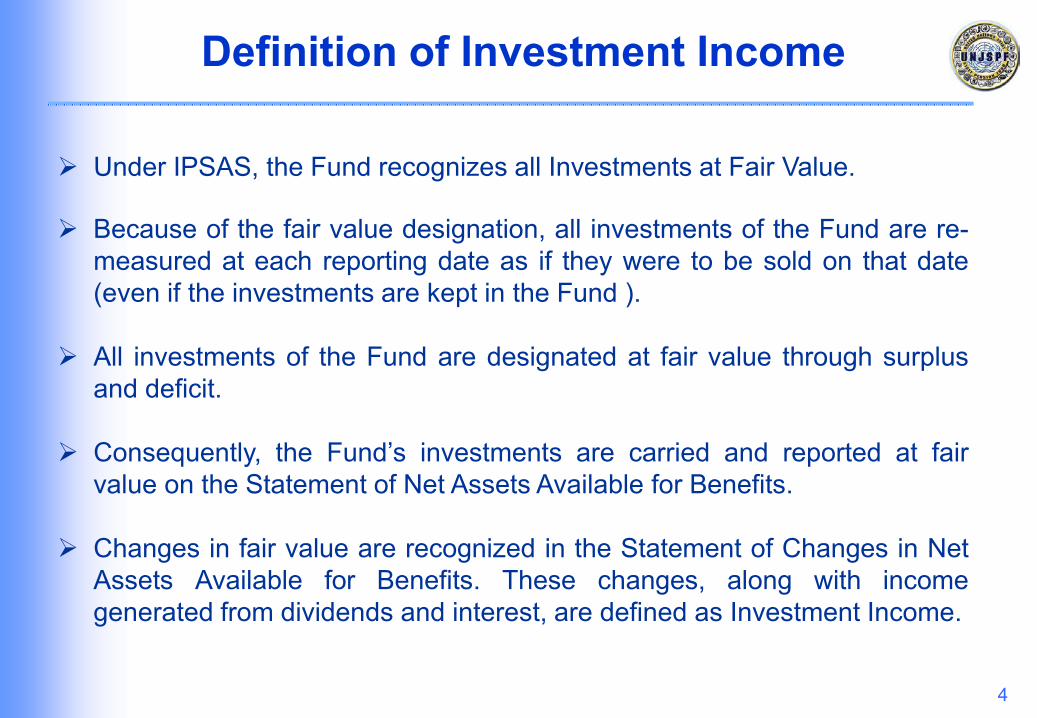
Under IPSAS, the Fund recognizes all Investments at Fair Value.
Because of the fair value designation, all investments of the Fund are re-measured at each reporting date as if they were to be sold on that date(even if the investments are kept in the Fund ).
All investments of the Fund are designated at fair value through surplusand deficit.
Consequently, the Fund’s investments are carried and reported at fairvalue on the Statement of Net Assets Available for Benefits.
Changes in fair value are recognized in the Statement of Changes in NetAssets Available for Benefits. These changes, along with incomegenerated from dividends and interest, are defined as Investment Income.
Definition of Investment Income
5
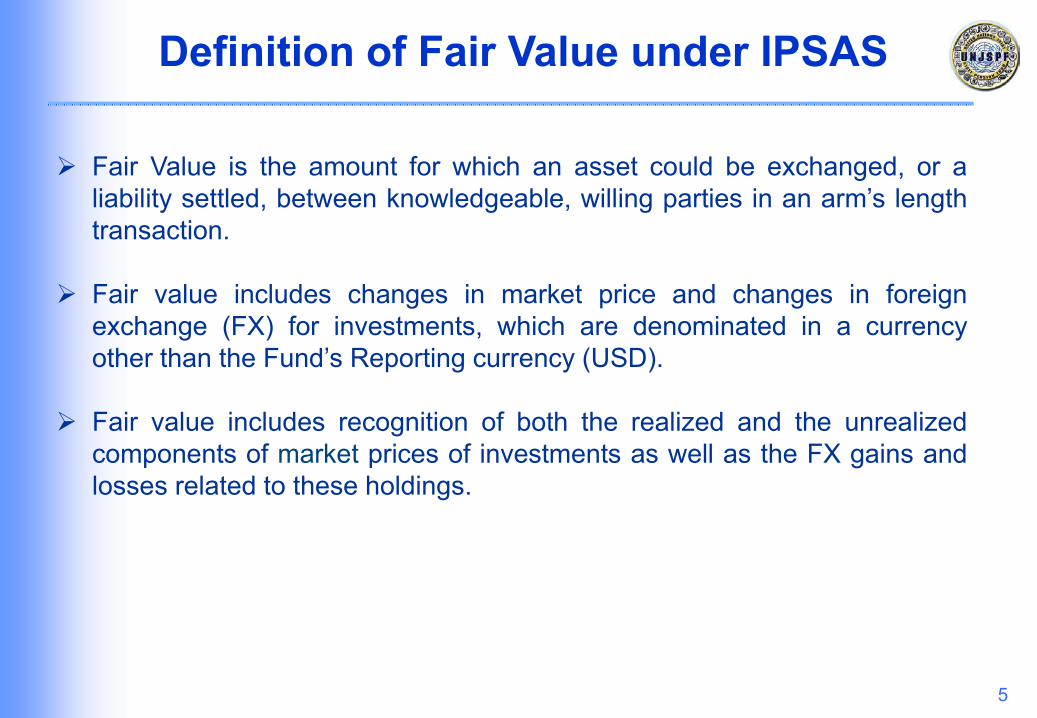
Fair Value is the amount for which an asset could be exchanged, or aliability settled, between knowledgeable, willing parties in an arm’s lengthtransaction.
Fair value includes changes in market price and changes in foreignexchange (FX) for investments, which are denominated in a currencyother than the Fund’s Reporting currency (USD).
Fair value includes recognition of both the realized and the unrealizedcomponents of market prices of investments as well as the FX gains andlosses related to these holdings.
Definition of Fair Value under IPSAS
6
The Fund’s Financial Statements report the change in the market price ofInvestments separately from changes (gains and losses) in ForeignExchange. Both are components of Investment Income.
The change in fair value includes the changes in market price and thechanges in the exchange rate used to translate the non-USD investmentinto USD. These changes are presented separately even though they maybe related to the same transaction(s).
The Fund manages its investments from a total return perspective, andthe Financial Statements show the underlying components of total returnsuch as changes in market price and changes in Foreign Exchange.
Investment Income under IPSAS
7
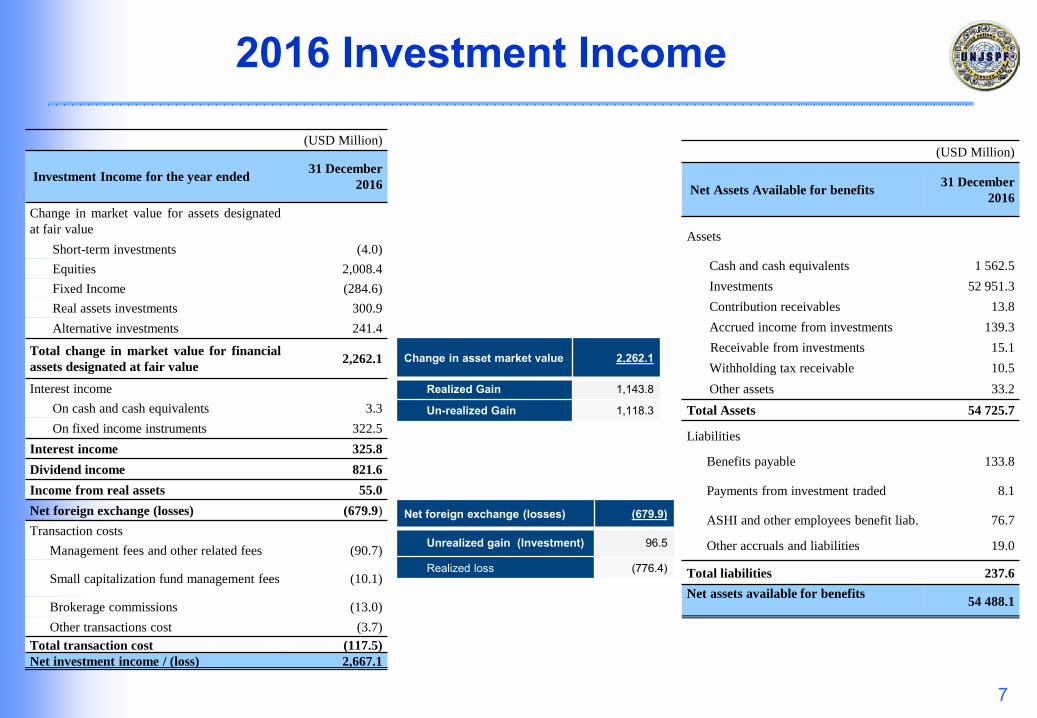
2016 Investment Income
(USD Million)
Investment Income for the year ended31 December
2016
Change in market value for assets designated
at fair value
Short-term investments (4.0)
Equities 2,008.4
Fixed Income (284.6)
Real assets investments 300.9
Alternative investments 241.4
Total change in market value for financial
assets designated at fair value2,262.1
Interest income
On cash and cash equivalents 3.3
On fixed income instruments 322.5
Interest income 325.8
Dividend income 821.6
Income from real assets 55.0
Net foreign exchange (losses) (679.9)
Transaction costs
Management fees and other related fees (90.7)
Small capitalization fund management fees (10.1)
Brokerage commissions (13.0)
Other transactions cost (3.7)
Total transaction cost (117.5)
Net investment income / (loss) 2,667.1
Change in asset market value 2,262.1
Realized Gain 1,143.8
Un-realized Gain 1,118.3
Net foreign exchange (losses) (679.9)
Unrealized gain (Investment) 96.5
Realized loss (776.4)
(USD Million)
Net Assets Available for benefits31 December
2016
Assets
Cash and cash equivalents 1 562.5
Investments 52 951.3
Contribution receivables 13.8
Accrued income from investments 139.3
Receivable from investments 15.1
Withholding tax receivable 10.5
Other assets 33.2
Total Assets 54 725.7
Liabilities
Benefits payable 133.8
Payments from investment traded 8.1
ASHI and other employees benefit liab. 76.7
Other accruals and liabilities 19.0
Total liabilities 237.6
Net assets available for benefits54 488.1
8
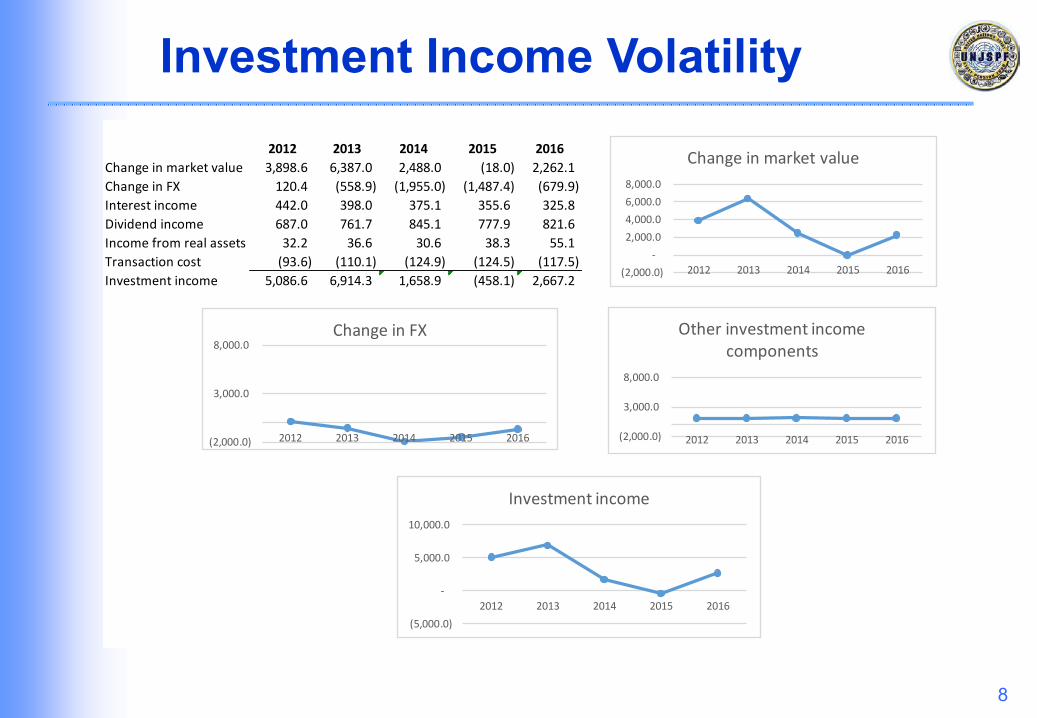
Investment Income Volatility2012 2013 2014 2015 2016
Change in market value 3,898.6 6,387.0 2,488.0 (18.0) 2,262.1
Change in FX 120.4 (558.9) (1,955.0) (1,487.4) (679.9)
Interest income 442.0 398.0 375.1 355.6 325.8
Dividend income 687.0 761.7 845.1 777.9 821.6
Income from real assets 32.2 36.6 30.6 38.3 55.1
Transaction cost (93.6) (110.1) (124.9) (124.5) (117.5)
Investment income 5,086.6 6,914.3 1,658.9 (458.1) 2,667.2
Other investment
income components 1,067.6 1,086.2 1,125.9 1,047.3 1,085.0
(2,000.0)
-
2,000.0
4,000.0
6,000.0
8,000.0
2012 2013 2014 2015 2016
Change in market value
(5,000.0)
-
5,000.0
10,000.0
2012 2013 2014 2015 2016
Investment income
(2,000.0)
3,000.0
8,000.0
2012 2013 2014 2015 2016
Change in FX
(2,000.0)
3,000.0
8,000.0
2012 2013 2014 2015 2016
Other investment income components

9
Investment Income Interpretation
Investment Income and its components are identified for accounting purposes
Recent focus has been on: The changes in Investment Income from one year to the next; and The FX component of Investment Income
In some years, Investment Income could decline due to a decline in the fair value of the Fund’s assets. This is not always a bad thing. If the returns of 2 simultaneous years both exceeded the Fund’s return
objectives, but the return for the second year is less than the return of the first year, then Investment Income could decline from year one to year two.
The FX component of Investment Income may include realized or unrealized gains or losses.
10
The Fund’s Reporting Currency (USD) The Fund is measured in USD terms for both investment accounting and investment performance
purposes.
The Fund invests a significant portion of its assets in non-US countries. These investments aremade in the local currencies, and they are translated into USD for investment accounting andinvestment performance purposes.
From 2013 to 2016, the Fund experienced FX losses on its non-US investments, most of whichwere unrealized, due to the strength of the US dollar (USD).
The Fund experienced FX gains during the first half of 2017, as the USD weakened against othermajor currencies.
Currency markets tend to move in cycles over the long term.
The impact of currency on the Fund’s investment performance and Financial Statementaccounting has been a zero sum game over the long term.

11
2016 - Financial Statement Currency Breakdown
CurrencySum of Fx Change - Realized
Sum of Fx Change -Unrealized
Sum of Foreign exchange change
% of Total IMD
British pound sterling (176,070,004) (285,700,915) (461,770,919) 68%
Euro (184,239,303) 10,563,481 (173,675,821) 25%
Mexican peso (89,381,721) 17,040,050 (72,341,672) 11%
Polish zloty (59,382,162) 30,795,638 (28,586,524) 4%
Swedish krona (31,105,222) 2,920,012 (28,185,210) 4%
South Korean won (15,151,110) (3,162,552) (18,313,662) 3%
Swiss franc (6,363,350) (6,423,260) (12,786,610) 2%
Turkish lira (4,220,945) (3,928,032) (8,148,977) 1%
Australian dollar (76,578,813) 69,008,295 (7,570,518) 1%
Malaysian ringgit (28,040,771) 21,683,118 (6,357,653) 1%
Indian rupee (12,829,883) 8,545,893 (4,283,989) 1%
Singapore dollar (2,497,306) (710,658) (3,207,964) 0%
Philippine peso (2,174,492) (1,005,333) (3,179,825) 0%
Danish krone (912,744) (1,955,099) (2,867,843) 0%
Chilean peso (191,346) (79,443) (270,789) 0%
Hong Kong dollar 99,902 (251,961) (152,059) 0%
Hungarian forint (199) - (199) 0%United States dollar - - - 0%
Russian Ruble 7,828 - 7,828 0%
New Zealand dollar (3,565,893) 4,478,142 912,249 0%
Norwegian krone (41,808,533) 43,507,957 1,699,425 0%
South African rand 1,186,628 6,552,671 7,739,298 -1%
Brazilian real (4,638,407) 24,956,158 20,317,752 -3%
Canadian dollar (57,132,975) 88,547,041 31,414,065 -5%Japanese yen 11,017,929 75,243,454 86,261,383 -13%
Grand Total (783,972,892) 100,624,657 (683,348,235) 100%
Fund secretariat 7,551,267 (4,084,680) 3,466,587
UNJSPF Total (776,421,625) 96,539,977 (679,881,648)
12
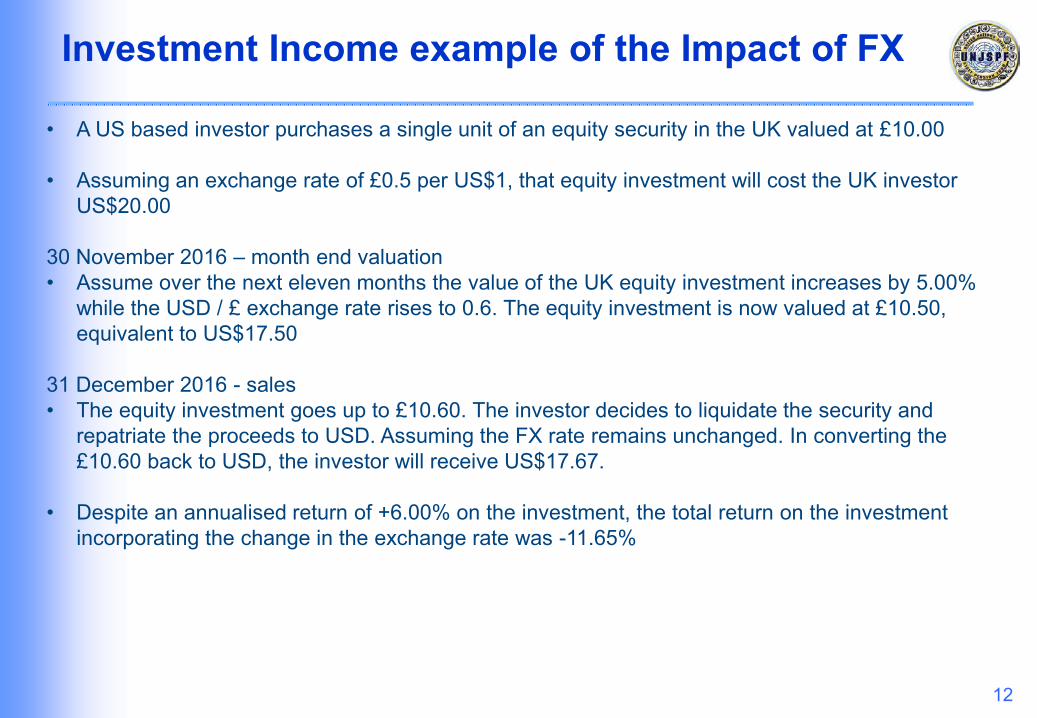
Investment Income example of the Impact of FX
• A US based investor purchases a single unit of an equity security in the UK valued at £10.00
• Assuming an exchange rate of £0.5 per US$1, that equity investment will cost the UK investor US$20.00
30 November 2016 – month end valuation• Assume over the next eleven months the value of the UK equity investment increases by 5.00%
while the USD / £ exchange rate rises to 0.6. The equity investment is now valued at £10.50, equivalent to US$17.50
31 December 2016 - sales• The equity investment goes up to £10.60. The investor decides to liquidate the security and
repatriate the proceeds to USD. Assuming the FX rate remains unchanged. In converting the £10.60 back to USD, the investor will receive US$17.67.
• Despite an annualised return of +6.00% on the investment, the total return on the investment incorporating the change in the exchange rate was -11.65%

13
Investment Income example of the impact of FX
Unrealised Market Gain or Loss
This value represents the portion of the unrealised gain or loss attributable to changes in the price of the security from the time of purchase to the report date. The formula used to determine this is:
Market Value in Local Currency – Book Cost in Local Currency (£10.50-£10.00) /0.6 = US$0.83Current Month End Exchange Rate
Unrealised Translation Gain or Loss
This value represents the portion of unrealised gain/loss attributable to changes in the value of the local currency versus the clients base currency from the time of the security purchase to the report date. The formula used to determine this is:
Book Cost in Local Currency – Book Cost in Base Currency (£10.00 /0.6) – 20 = - US$3.33Month End Exchange Rate
Unrealised Gain or Loss Total
The difference between the market value of a security as of the report date and the book cost, expressed in the client’s base currency.
Unrealised Market Gain or Loss + Unrealised Translation Gain or Loss 0.83 +(-)3.33 = - 2.50
14
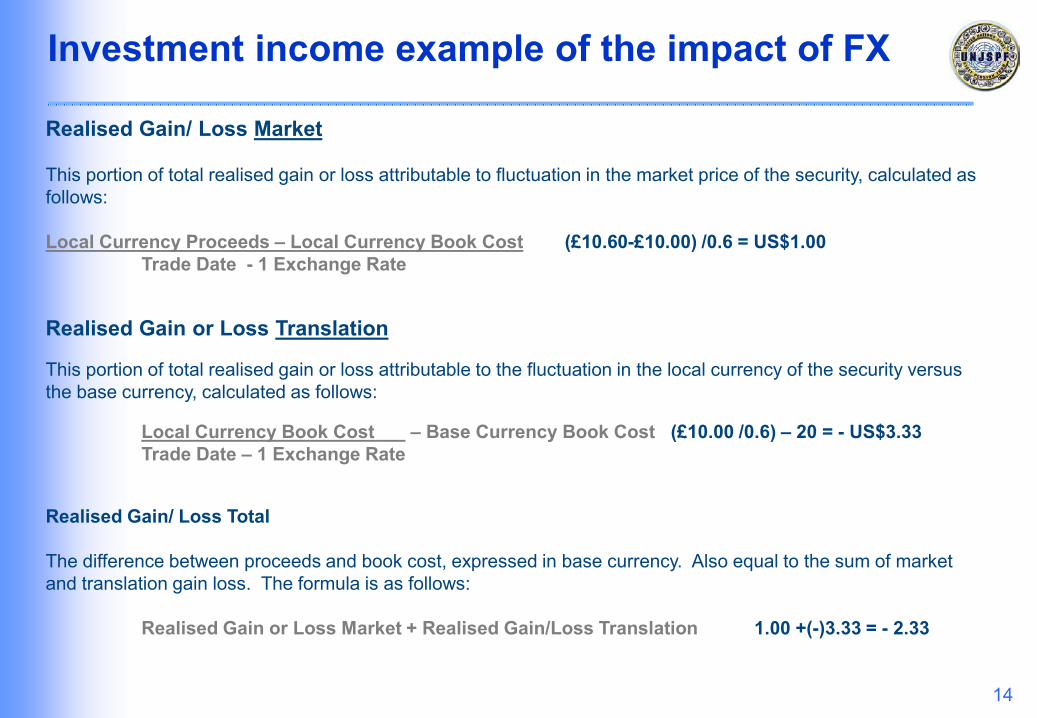
Investment income example of the impact of FX
Realised Gain/ Loss Market
This portion of total realised gain or loss attributable to fluctuation in the market price of the security, calculated as follows:
Local Currency Proceeds – Local Currency Book Cost (£10.60-£10.00) /0.6 = US$1.00Trade Date - 1 Exchange Rate
Realised Gain or Loss Translation
This portion of total realised gain or loss attributable to the fluctuation in the local currency of the security versus the base currency, calculated as follows:
Local Currency Book Cost – Base Currency Book Cost (£10.00 /0.6) – 20 = - US$3.33Trade Date – 1 Exchange Rate
Realised Gain/ Loss Total
The difference between proceeds and book cost, expressed in base currency. Also equal to the sum of market and translation gain loss. The formula is as follows:
Realised Gain or Loss Market + Realised Gain/Loss Translation 1.00 +(-)3.33 = - 2.33
15
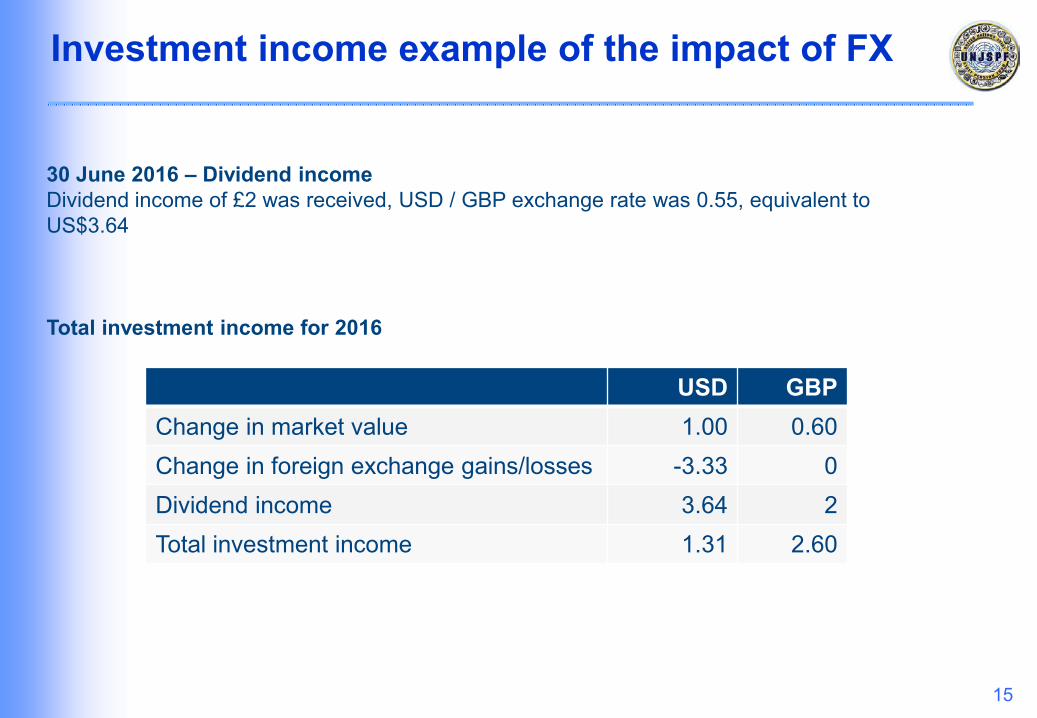
Investment income example of the impact of FX
30 June 2016 – Dividend incomeDividend income of £2 was received, USD / GBP exchange rate was 0.55, equivalent to US$3.64
Total investment income for 2016
USD GBPChange in market value 1.00 0.60Change in foreign exchange gains/losses -3.33 0Dividend income 3.64 2Total investment income 1.31 2.60

16
Currency from an Investment PerformanceReporting Perspective
17
An investment’s profit or loss expressed as a percentage of itsbeginning period market value
An investment’s growth over a given period, expressed as apercentage of its market value
An expression of a portfolio’s profit or loss as a ratio of its marketvalue in percentage terms
The monetary return experienced by the holder of a portfolio
What is Performance?
18
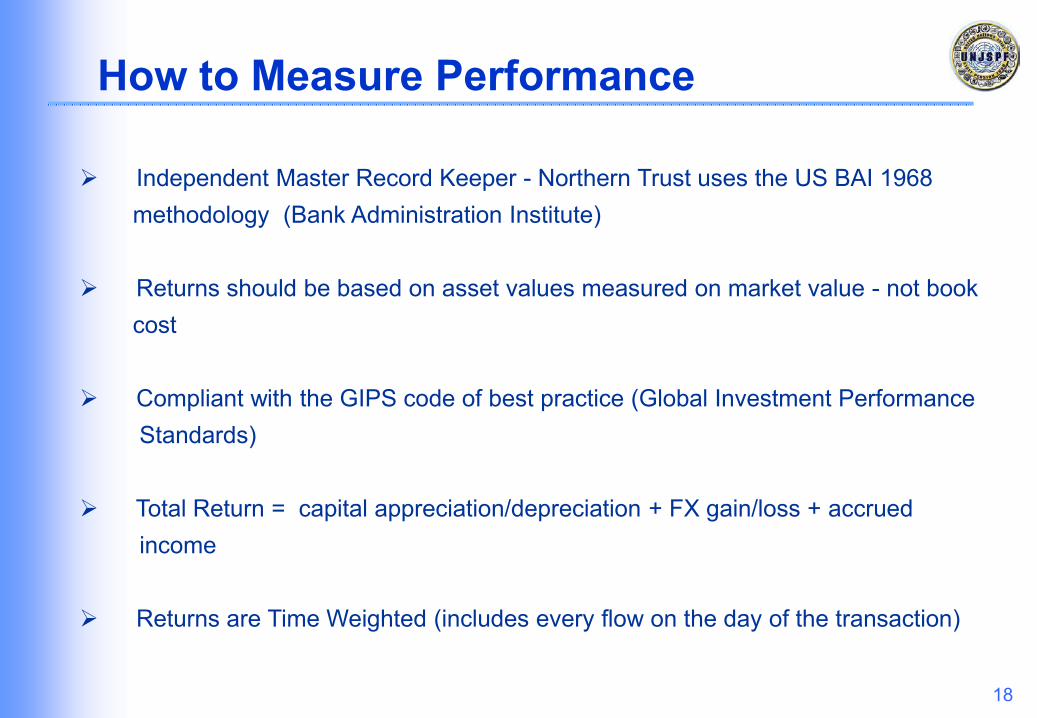
How to Measure Performance
Independent Master Record Keeper - Northern Trust uses the US BAI 1968 methodology (Bank Administration Institute)
Returns should be based on asset values measured on market value - not book cost
Compliant with the GIPS code of best practice (Global Investment Performance Standards)
Total Return = capital appreciation/depreciation + FX gain/loss + accrued income
Returns are Time Weighted (includes every flow on the day of the transaction)
19
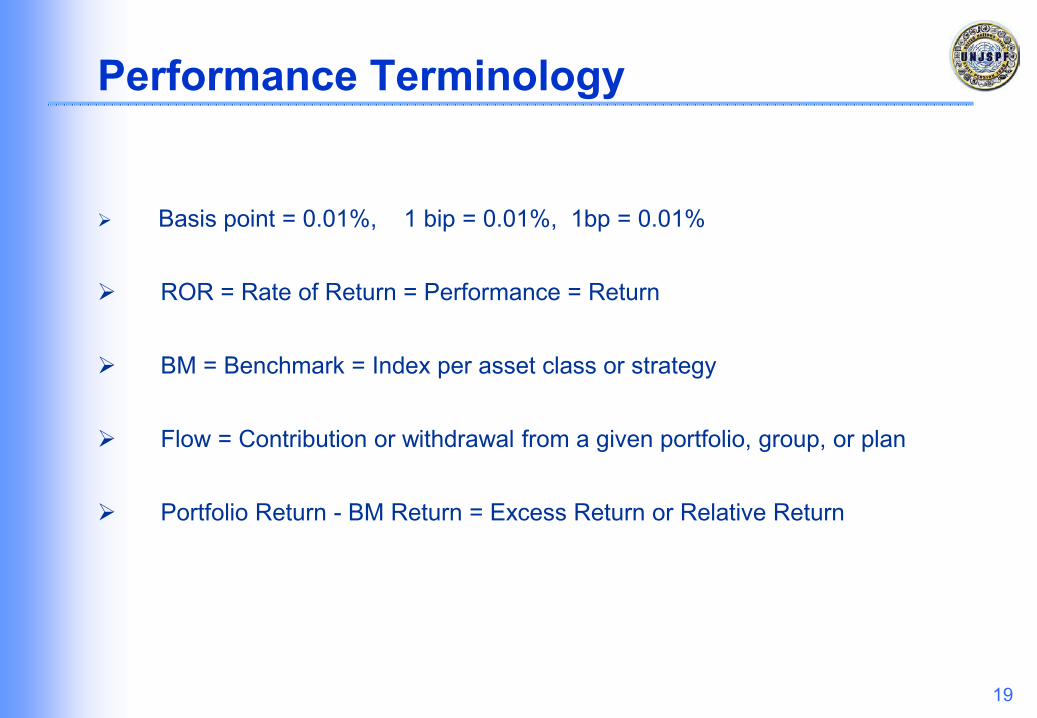
Performance Terminology
Basis point = 0.01%, 1 bip = 0.01%, 1bp = 0.01%
ROR = Rate of Return = Performance = Return
BM = Benchmark = Index per asset class or strategy
Flow = Contribution or withdrawal from a given portfolio, group, or plan
Portfolio Return - BM Return = Excess Return or Relative Return

20
Independent Master Record Keeper – Data Flow
Analytics and Reporting Delivery
UNJSPF IMD
Front office
Composite Management System Dashboards Fundamentals Data Direct Reporting support
Data inputs
Accounting and market data
Core asset data
Fund accounting valuations
IOO valuations
Hedge fund services
Data transformation
Performance
Daily linked returns
Characteristics
Allocations
Ex post risk statistics
Attribution
Equity class and security level attribution
Fixed income class level attribution
Multiple models
Flexible hierarchies
Composite Management
Composite construction and maintenance
GIPS compliant reporting
Auditing reports and verification assistance
Currency conversion and ex post risk statistics
21
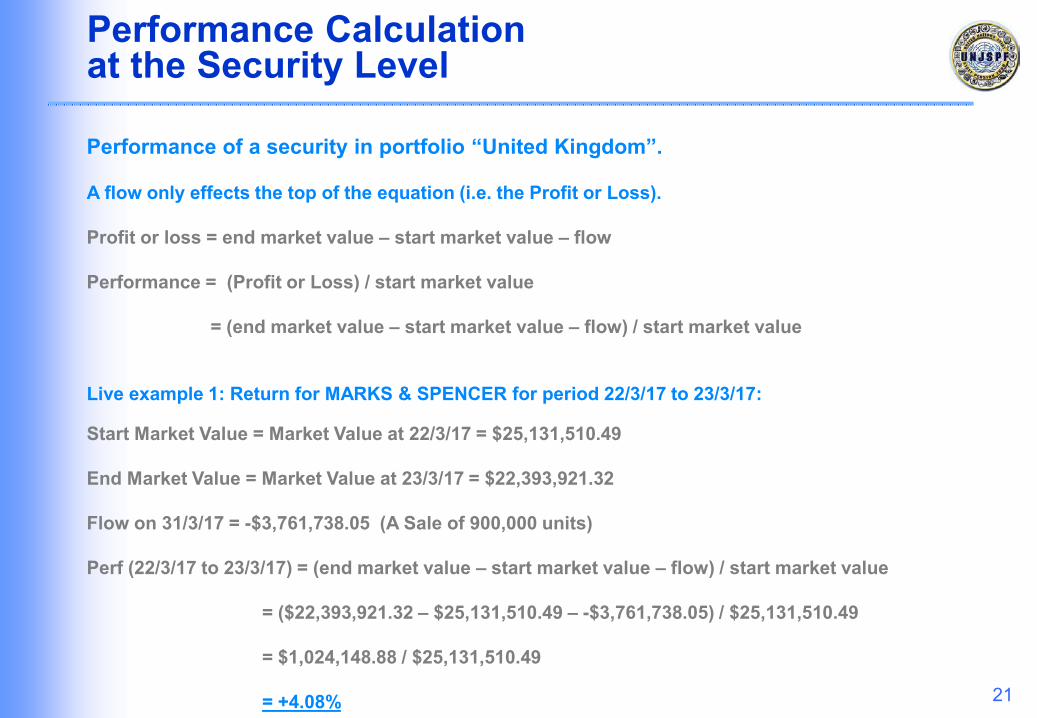
Performance Calculation at the Security Level
Performance of a security in portfolio “United Kingdom”.
A flow only effects the top of the equation (i.e. the Profit or Loss).
Profit or loss = end market value – start market value – flow
Performance = (Profit or Loss) / start market value
= (end market value – start market value – flow) / start market value
Live example 1: Return for MARKS & SPENCER for period 22/3/17 to 23/3/17:
Start Market Value = Market Value at 22/3/17 = $25,131,510.49
End Market Value = Market Value at 23/3/17 = $22,393,921.32
Flow on 31/3/17 = -$3,761,738.05 (A Sale of 900,000 units)
Perf (22/3/17 to 23/3/17) = (end market value – start market value – flow) / start market value
= ($22,393,921.32 – $25,131,510.49 – -$3,761,738.05) / $25,131,510.49
= $1,024,148.88 / $25,131,510.49
= +4.08%
22
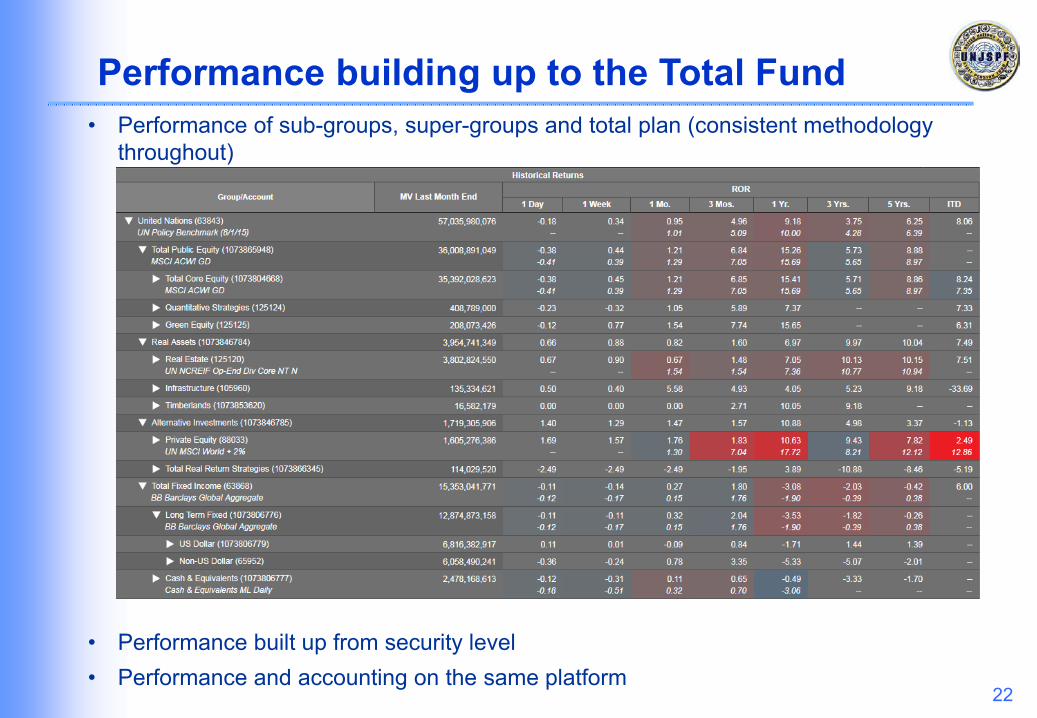
Performance building up to the Total Fund• Performance of sub-groups, super-groups and total plan (consistent methodology
throughout)
• Performance built up from security level• Performance and accounting on the same platform
UNDERSTAND
23
Performance Measurement
Currencies
The Fund invests in both ‘USD’ and ‘non-USD’ currencies.
Base Return (USD)
Monetary return of the Fund’s investments is US dollar.
Local Return
Monetary return of the Fund’s investments in local currency.
Example – Euro, British pound, Brazilian real, etc.
Currency Contribution
Difference between Base Return and Local return.
Currency contribution is a component of the Total Return
24
Impact of Currency on Performance
The globalization of institutional portfolios brings greater return anddiversification opportunities
When trading international securities pension funds must remember that acurrency transaction is involved
Any currency market movements do not always work in favour of theinvestor
When investors have international asset exposure, changes in currency –known as foreign exchange (FX) – rates will cause the value of thoseassets to change
FX volatility can be significant, and at times equal or overshadow thevolatility of the underlying asset