ipo watch report 2017 - final
TRANSCRIPT
JANUARY 2017
Australian IPO Activity in 2016Including analysis of RTO activities
IPO Watch Australia
Great people, great resultshlb.com.au

www.hlb.com.au
For further information
Perth Marcus Ohm +61 8 9267 3225 [email protected]
Gold Coast Janelle Manders +61 7 5574 0922 [email protected]
Melbourne Jude Lau +61 3 9606 3888 [email protected]
Adelaide Corey McGowan +61 8 8133 5030 [email protected]
Brisbane (HLB Chessboard) Peter Bishop +61 7 3001 8870 [email protected]
Sydney Simon James +61 2 9020 4000 [email protected]
Wollongong Ben Fock +61 2 4254 6500 [email protected]
Overview ...................................................................1
IPO activity by quarter .............................................2
The road ahead ........................................................2
IPOs by market capitalisation .................................3
Sector analysis .........................................................4
IPO subscription rates .............................................5
Share price performance ........................................6
Case Study – VEEM Limited..... ...............................7
Reverse takeovers (RTOs) overview ......................8
Amendments to ASX listing rules ..........................9
RTOs overview – an analysis ................................10
RTOs by market capitalisation .............................. 11
RTOs by industry sector ........................................12
Contents
Disclaimer – The analysis presented on pages 1 to 6 within this report relates to all initial public offerings that have resulted in the listing of an entity’s securities on the Australian Securities Exchange (“ASX”) with the exception of compliance and “backdoor” listings and offers of non-equity securities.
The data presented on reverse takeovers on pages 10 to 12 includes all ASX recompliance listings, excluding those which did not include significant changes in ownership and/or management.
The term “small cap” is used to refer to companies with a market capitalisation of no more than $100 million. All analysis by reference to market capitalisation on listing is based on the price at which new securities were issued.
Whilst every care has been taken to ensure the accuracy of information contained in this report, we accept no liability for any error or omission, nor for any action taken in reliance on any statement or opinion in this report.
No statement or opinion in this report is intended to be construed as investment advice. Properly considered professional advice should always be sought if in doubt regarding the merits of any investment.
No part of this publication may be reproduced, in whole or in part, without the prior written consent of HLB Mann Judd.
© 2017 HLB Mann Judd Australasian Association

1Great people, great results
2016 was a year of continued improvement in the IPO market. There were a total of 94 new IPOs on the ASX during 2016 which was an 11% increase over the previous year when 85 companies listed on the market and a marked improvement on the previous 5-year average of 72 listings.
The total funds raised increased slightly in 2016 at $7.50 billion raised which represents an increase of 7% on the 2015 total of $7.02 billion, despite the increased number of small cap companies listing in 2016 and lower associated capital raisings. The total raised also compares favourably with the previous 5-year average of $7.24 billion which was significantly inflated by the record set in 2014 of $16.70 billion, a figure that was impacted by several large listings.
Whereas large listings had previously dominated the statistics in the period since the IPO market cooled, the activity in both 2016 and 2015 was more balanced in terms of both market capitalisations and industry spread.
In 2016, an increasing proportion of the IPO market was made up of smaller cap companies. The number of new small cap market entrants increased significantly during 2016, with a total of 64 entities with a market cap less than $100 million completing their IPOs during the year. This represents a solid increase of 33% over 2015’s 48 small cap listings and over the previous 5-year average of 49 listings.
In terms of funds raised by small caps, there was consistency with previous years with small caps raising $828.51 million in 2016, or 11% of the total funds raised of $7.50 billion, which compares to the total in 2015 of $827.59 million (or 17% of the total funds raised in that year). Average funds raised by small caps decreased to $12.95 million in 2016 from the previous year total of $17.24 million. Whilst it is positive to note the increasing contribution to the number of listings by small cap companies, it remains substantially short compared to 2012 when 93% of all listings were from entities with sub-$100 million market caps.
With respect to the largest cap companies listing during the year, a total of three entities listed during the year with a market capitalisation of over $1 billion. These listings contributed a total of $2.43 billion to the total funds raised during the year or 32% of the total. This was a significant increase over 2015, when the two very large entities listing contributed 19% of the total, or $1.33 billion.
At the other end of the scale, the smallest market entrants (those with a market cap below $10 million) saw four successful listings in 2016 compared to just a single listing in 2015 and two new listings in 2014. These very small listings contributed only $17 million to the total funds raised and represented the Materials, Retailing and Food, Beverage & Tobacco industries. Historically, this segment has been represented by junior miners and the shift in representation highlights poor levels of investor sentiment in the Materials and Energy sectors over recent years. In 2016, there was an increase in the number of Materials companies listing which were more evenly spread across all market capitalisation ranges.
The trend which emerged in the previous year, of increasing diversification in IPOs across industries, continued in 2016 with 20 industry groups represented compared to 21 in 2015, and an average of 17 in the previous three years. The technology and biotech sectors were again well represented with Software & Services (21), Pharmaceuticals & Biotechnology (six) and Technology Hardware & Equipment (two) comprising 31% of all new listings during the year. Materials stocks performed much better in 2016 with a total of 12 listings compared to only three in the previous year. Energy stocks unfortunately continued to be under-represented, with only a single listing during the year. Other notable market segments included Food, Beverage & Tobacco and Real Estate with seven listings each.
In a marker of improving investor sentiment towards the IPO market, subscription rates for IPOs increased significantly during 2016 relative to previous years, with 83% of all new listings meeting or exceeding their subscription targets. In total, new IPOs obtained 102% of the total funds being sought raising $7.50 billion. This is a positive step from 2015 and 2014, when only 68% and 65% of companies respectively were able to meet their funding targets.
Whereas in previous years, small cap companies have struggled to meet their subscription targets, subscription rates in 2016 were relatively well spread across all market capitalisation brackets. The smallest companies (<$10 million market capitalisation) performed well with all four of the new listings achieving their targets with an average oversubscription of 21%. Those entities with a market cap between $10 million and $25 million and those over $100 million were also oversubscribed on average. The poorest performing segment was the $50 million to $75 million market cap entities, of which only 57% of companies achieved their target, with an average subscription rate of 69% of total funds sought.
Share performance of new listings was positive overall relative to the wider market. New listings within the small cap sector recorded an average first day share price increase of 12%, and across all capitalisations an average gain of 8%. A total of 49 new listings, or 52% of all IPOs during 2016, ended their first day above their listing price.
In terms of year end share price gains, new listings again outperformed the wider market in 2016, with an average increase in share price of 16% across all new IPOs and 22% specifically within the small cap sector. This compares well against the ASX 200, which still recorded a solid increase of 7%.
OverviewSmall cap IPO market continues to improve
Marcus Ohm
Partner Corporate & Audit Services
Perth
3
5 5
7
5
9
8
10
4
10
12
16
-
2
4
6
8
10
12
14
16
18
-
1,000.00
2,000.00
3,000.00
4,000.00
5,000.00
6,000.00
7,000.00
8,000.00
January February March April May June July August September October November December
Nu
mb
er o
f Ne
w Issues
Cu
mu
lati
ve F
undr
aisi
ng ($
m)
Number of Listings (RHS) Cumulative Small Cap Fundraising (LHS) Cumulative Large Cap Fundraising (LHS) Cumulative Total Fundraising (LHS)
2 www.hlb.com.au
2017 is poised to be a stronger year for IPOs, especially in the Materials sector, if the upcoming listings are representative of things to come. At the open to the year, 23 companies have applied for listing to the ASX, which represents an increase of 15% over the same time last year. These new entrants are seeking to raise a total of $206.60 million, which is marginally short of last year when the total was $208.30 million.
The recovery in the Materials sector looks set to continue next year with a total of 11 explorers, miners and associated businesses waiting to list. This is a significant improvement over the previous year, when there were only four planned listings in these sectors which sought to raise $15.30 million. These are generally smaller listings seeking a total of $70.00 million, with most seeking to raise between $3.50 and $4.00 million. A significant portion of these are focused on lithium and cobalt, in a sign of the continuing push for materials used in the creation of energy cells.
The largest planned listing is that of India Fund Limited, an investment company seeking to invest funds in Indian listed companies. This company is seeking to raise $50.00 million, approximately one-quarter of all the funds in the pipeline.
Real Estate stocks also contribute significantly to the total funds sought, with two planned listings looking to raise $30.00 million.
At the same time last year, technology and biotechnology stocks featured heavily which reflected in the results for the year. At that time, seven planned listings were seeking $68.50 million. By comparison, only one technology company is awaiting listing, seeking $5.00 million. Also prominent in the results from last year were Agriculture stocks, which contrasts with this year, with only two planned listings totalling $7.10 million.
The road ahead...
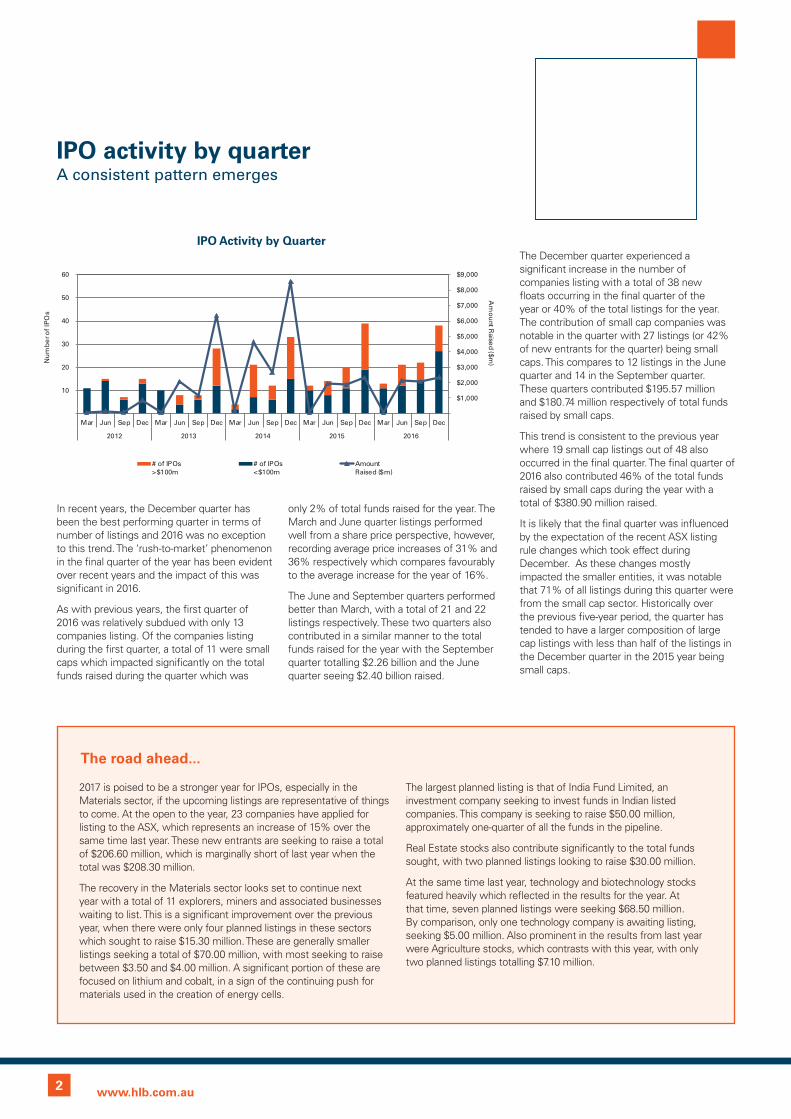
In recent years, the December quarter has been the best performing quarter in terms of number of listings and 2016 was no exception to this trend. The ‘rush-to-market’ phenomenon in the final quarter of the year has been evident over recent years and the impact of this was significant in 2016.
As with previous years, the first quarter of 2016 was relatively subdued with only 13 companies listing. Of the companies listing during the first quarter, a total of 11 were small caps which impacted significantly on the total funds raised during the quarter which was
only 2% of total funds raised for the year. The March and June quarter listings performed well from a share price perspective, however, recording average price increases of 31% and 36% respectively which compares favourably to the average increase for the year of 16%.
The June and September quarters performed better than March, with a total of 21 and 22 listings respectively. These two quarters also contributed in a similar manner to the total funds raised for the year with the September quarter totalling $2.26 billion and the June quarter seeing $2.40 billion raised.
The December quarter experienced a significant increase in the number of companies listing with a total of 38 new floats occurring in the final quarter of the year or 40% of the total listings for the year. The contribution of small cap companies was notable in the quarter with 27 listings (or 42% of new entrants for the quarter) being small caps. This compares to 12 listings in the June quarter and 14 in the September quarter. These quarters contributed $195.57 million and $180.74 million respectively of total funds raised by small caps.
This trend is consistent to the previous year where 19 small cap listings out of 48 also occurred in the final quarter. The final quarter of 2016 also contributed 46% of the total funds raised by small caps during the year with a total of $380.90 million raised.
It is likely that the final quarter was influenced by the expectation of the recent ASX listing rule changes which took effect during December. As these changes mostly impacted the smaller entities, it was notable that 71% of all listings during this quarter were from the small cap sector. Historically over the previous five-year period, the quarter has tended to have a larger composition of large cap listings with less than half of the listings in the December quarter in the 2015 year being small caps.
IPO activity by quarterA consistent pattern emerges
$1,000
$2,000
$3,000
$4,000
$5,000
$6,000
$7,000
$8,000
$9,000
10
20
30
40
50
60
Mar Jun Sep Dec Mar Jun Sep Dec Mar Jun Sep Dec Mar Jun Sep Dec Mar Jun Sep Dec
2012 2013 2014 2015 2016
Am
ou
nt Raise
d ($m)N
um
be
r of
IPO
s
# of IPOs>$100m
# of IPOs<$100m
AmountRaised ($m)
IPO Activity by Quarter

3Great people, great results
Company NameAmount
Raised ($m)Market
Cap($m)
WGF WATERMARK GLOBAL LEADERS FUND LIMITED 91.08 91.08
MA1 MONASH ABSOLUTE INVESTMENT COMPANY LIMITED 52.47 52.47
MTO MOTORCYCLE HOLDINGS LIMITED 46.10 75.90
D2O DUXTON WATER LIMITED 41.70 70.36
4WD AUTOMOTIVE SOLUTIONS GROUP LTD 30.90 50.35
ATS AUSTRALIS OIL & GAS LIMITED 30.00 85.39
DN8 DREAMSCAPE NETWORKS LIMITED 25.00 86.00
9SP 9 SPOKES INTERNATIONAL LIMITED 25.00 80.59
SVH SILVER HERITAGE GROUP LIMITED 25.00 76.11
VEE VEEM LTD 25.00 65.00 Capital Goods
Category
Consumer Services
Software & Services
Software & Services
Energy
Automobiles & Components
Utilities
Retailing
Investments
Investments
5.00
10.00
15.00
20.00
25.00
30.00
35.00
40.00
0
5
10
15
20
25
30
0 to 10 10 to 25 25 to 50 50 to 75 75 to 100
Am
ou
nt Raise
d ($m)N
um
be
r of
IPO
s
Market Capitalisation on Listing ($m)
2015 Small Cap IPOs 2016 Small Cap IPOs Mean amount raised 2015 Mean amount raised 2016
Number of Small Cap IPOs by Market Capitalisation
IPOs by market capitalisationIncreasing contribution from small cap sector
The contribution of small cap companies increased in 2016, continuing the trend of the previous year. A total of 68% of all new listings during 2016 were companies with a market capitalisation upon listing of less than $100 million which was up from 56% in the previous year and 43% in 2014.
There was a notable trend towards smaller listings in 2016. Whereas in 2015, the most active segment was the $25-50 million bracket, which recorded 18 of the total 48 small cap listings (or 38%), only 27% of all small cap listings in 2016 fell within this bracket. Conversely, the $10-25 million market capitalisation range had 28 out of a total of 64
small cap listings (or 44%). The larger number of listings in this bracket contributed 24% ($198.41 million) to the total funds raised by small caps at an average amount raised of $7.09 million.
The $75-100 million bracket, as expected, contributed the most to the total raised for the year with $264.51 million out of $828.51 million total funds raised (or 32% of the total). This bracket also recorded the highest average funds raised for the year with $33.06 million, similar to the previous year when the average funds raised were $31.39 million. This bracket contained only eight listings (or 13%) which was similar to the $50-75 million bracket with
seven listings. The smallest cap companies (<$10 million) recorded the least with four listings.
The smaller market cap IPOs significantly outperformed their larger counterparts with respect to share price performance. The smallest caps (<$10 million) recorded an average day one gain of 65%, and finished the year in positive territory by 52% on average. The $10-25 million bracket was the best performing overall, however, with average day-one gains of 27% and an average year-end gain of 56%.
Largest IPOs within Small Cap Segment in 2016

4 www.hlb.com.au
A total of 20 different industry sectors were represented in 2016, continuing the trend of both 2015 and 2014 which had 21 and 17 sectors respectively. The most well represented sectors were Software & Services (21 listings) and Materials (12 listings) which comprised a total of 35% of all new listings during the year.
Looking at the small cap sector specifically, technology and biotechnology listings were well-represented, with Software & Services recording 16 listings (25%), Pharmaceuticals & Biotechnology (six listings) and Technology Hardware & Equipment (two listings).
Materials stocks were also solid performers during the year. A total of 12 new market entrants came from the Materials sector with ten of these being within the small cap sector for a total of 13% of all new listings. Whilst this is an increase on both 2015 (three listings) and 2014 (five listings), it is still somewhat short of the total achieved in 2013 when 87% of small cap listings were from the Materials or Energy sectors. In 2016, the Energy sector only
achieved a single listing (2015: one listing) as the ongoing difficulties within the oil and gas industry continued to impact upon this sector.
The Investments and Diversified Financials sectors also featured well again this year with a total of 11 listings, of which seven were small cap entities. However, these sectors are down on 2015, when they contributed a total of 18 new listings.
The largest contributors to the total funds raised for the year of $7.50 billion were Real Estate ($2.53 billion) and Food, Beverage & Tobacco ($1.01 billion). This latter sector was assisted considerably by the listing of Inghams Group Limited which raised $596.61 million via its IPO.
In terms of funds raised by the small cap sector, the Investment sector contributed four listings totalling $175.18 million (or 21% of funds raised) and the Software & Services sector contributed 16 listings for $152.41 million (or 18% of funds raised). The average funds raised by small caps within the Software & Services sector, however, was only $9.53
million, reflecting the characteristics of new entrants within this sector.
The Software & Services sector has been a strong performer not just in the IPO market but also through reverse takeovers of listed shell companies, predominantly from the junior exploration sector. This contrasts somewhat with international conditions, particularly in the US market in 2016 where tech listings have been subdued in both the current and previous years, and it remains to be seen how this sector will perform in 2017.
NumberAmount Raised
($m)Number
Amount Raised ($m)
NumberAmount Raised
($m)Number
Amount Raised ($m)
Automobiles & Components 2 81 1 82 1 31 - - 1sknaB 5 1 122 1 5 - -
Capital Goods 5 961 1 27 4 42 1 27 Commercial Services & Supplies 3 165 3 180 2 18 1 55 Consumer Durables & Apparel - - 2 20 - - 1 7 Consumer 3secivreS 55 5 369 3 55 4 37 Diversified Financials 5 336 7 613 3 32 3 18
1ygrenE 30 1 4 1 30 - - Food, Beverage & Tobacco 7 1,011 3 889 1 4 - - Health Care Equipment & Services 4 91 8 252 3 29 6 103 Household & Personal Products - - 2 271 - - - -
1ecnarusnI 15 2 157 1 15 - - Investments 6 883 11 1,156 4 175 7 315
21slairetaM 153 3 9 10 66 3 9 Media 1 188 - - - - - - Pharmaceuticals & Biotechnology 6 35 5 58 6 35 4 25 Real Estate 7 2,526 4 824 2 24 1 11
5gniliateR 359 5 372 2 52 2 41 Semiconductors & Semiconductor Equipme 1 10 - - 1 10 - - Software & 12secivreS 545 15 1,537 16 152 10 127 Technology Hardware & Equipment 2 11 2 24 2 11 2 24 Telecommunication Services - - 3 52 - - 2 27 Utilities 1 42 1 2 1 42 1 2
49latoT 7,502 85 7,020 64 828 48 828
Industry
Sector Analysis All llamSsgnitsiL Cap Only
2016 2015 2016 2015
The best performing sectors were Software & Services and Materials.
Sector analysisOngoing sector diversity highlights an improving market

5Great people, great results
¹ Based on the funds target being the maximum subscription, or in the absence of a range, the amount sought per the final revised prospectus. Any amounts exceeding these amounts would represent oversubscription.
In a positive indicator for the IPO market, subscription rates were up significantly during 2016 with 83% of all IPOs meeting their subscription targets. Total funds raised during the year were, on average, 102% of their targeted subscription amounts. This compares favourably with 2015 with only 58 companies (or 68%) reaching their target at an average subscription rate of 91%.
Subscription rates were assisted by the contribution of small cap companies with all four of the smallest IPOs (<$10 million) reaching their target and 24 (or 86%) of those within the $10-25 million bracket. Both of these market capitalisation brackets closed, on average, oversubscribed achieving subscription
rates of 121% and 101%, respectively.
In terms of other market capitalisations, large cap companies also performed well, with 26 (or 87%) of all large caps reaching their targets and raising an average of 104% of their goals in 2016.
The poorest performing bracket was $50-75 million, with only four (57%) being fully or oversubscribed with entities in this range reaching only 69% of their cumulative raising target on average.
With respect to subscription rates by industry sector, a total of 10 different industry sectors overall met their targets. Only two sectors had a success rate of 50% or less of companies
meeting their targets (Utilities – 0% and Technology Hardware & Equipment – 50%). The Materials sector performed well in terms of subscriptions with all 12 of its entrants meeting or exceeding their targets. Software & Services was also a strong performer with 19 of the 21 listings in this sector meeting their targets.
Underwritten offers, unsurprisingly, met or exceeded their targets 93% of the time which compares to 78% for those offers not underwritten. It is notable that the amount of offers which were underwritten has decreased significantly in 2016 with only 31% recorded in 2016 compared to 44% in 2015 and 66% in 2014.
% of Subscription Target Achieved
121%
101%91%
69%
88%
104%
0%
20%
40%
60%
80%
100%
120%
140%
0 to 10 10 to 25 25 to 50 50 to 75 75 to 100 100+
Market Capitalisation at Listing ($m)
20%
33%40%
29%33%
17%
43%
10%
50%
100%100% 100% 100%
60%
100% 100%
67%
100% 100%
83%
57%
100% 100%90%
50%
0%
10%
20%
30%
40%
50%
60%
70%
80%
90%
100%
Sh
are
of
Co
mpa
nies
Target Not Achieved Target Achieved
80% 67%71%
100%
% of Subscription Target Achieved by Sector
IPO subscription ratesSmall cap listings well subscribed

6 www.hlb.com.au
IPOs outperformed the broader market again in 2016, continuing the trend of previous years. New market entrants had an average share price gain of 16% above listing price and this was even greater in the small cap segment where the average increase was 22% compared to initial listing price. This is a strong performance by new entrants against the overall ASX 200 which appreciated by 7% during the year.
In terms of share price performance by industry sector, Capital Goods (+92%) and Health Care Equipment & Services (+68%) were the best performing sectors on average. Excluding sectors with less than 3 listings, only three industry sectors recorded year-end losses being Diversified Financials (-18%), Consumer Services (-16%), and Commercial Services & Supplies (-12%).
Share price performance by small cap entities was also positive relative to the wider market.
Within the small cap space, Capital Goods performed solidly (+187%), as did the sectors of Food, Beverage & Tobacco (+230%), Retailing (+80%) and Semiconductors & Semiconductor Equipment (+65%) although these three sectors contained just one or two entrants each. The Capital Goods sector continued its positive performance from 2015 when there was an average 81% increase in small caps.
There was mixed performance from Technology and Biotechnology stocks in terms of share price appreciation. Software & Services listings gained a 2% average return (16 listings), Technology Hardware & Equipment had an 8% average return from two listings and Pharmaceuticals & Biotechnology recorded a 7% increase on average from six listings. This contrasts strongly with the experience in 2015 when the Software & Services sector fell 20% on average against their listing price but the Pharmaceuticals & Biotechnology (+49%) and
Technology Hardware & Equipment (+81%) performed very well.
The poor showing from the Materials sector in 2015 (-1%) reversed in 2016 with the industry finishing in positive territory by 15% on average.
In terms of share price performance across all market capitalisations, several industries performed well during the year appreciating by over 40% on average. In addition to Capital Goods and Health Care Equipment & Services as noted above, several sectors recorded strong results for investors such as Semiconductors & Semiconductor Equipment (+65%), Insurance (+43%) and Media (+43%).
The standout performer of 2016 was Aurora Labs Limited which finished the year with a share price of $2.99, an increase of 1395% over its listing price of $0.20. The stock has peaked above $3.50 during the year, and has again exceeded the $3.00 mark since the end of the year. The first day gain was similarly strong increasing by 150% to $0.50. Other notable results were Abundant Produce Limited (+230%), Noxopharm Limited (+155%), Afterpay Holdings Limited (+152%) and CFOAM Limited (+135%).
A total of 43 stocks ended their year in negative territory with 17 of these recording decreases of 25% or more and five losing more than a third of their share price since listing.
First day performance was mixed, with 56 recording gains including CFoam Limited (+250%), Abundant Produce Limited (+175%) and Aurora Labs (+150%). 25 IPOs had poor first days, with three listings recording losses of 25% or more.
2016 IPO Share Price Performance
-10%
0%
10%
20%
30%
40%
50%
60%
70%
0 to 10 10 to 25 25 to 50 50 to 75 75 to 100 100+
Av
era
ge
retu
rn
Market capitalisation on listing ($m)
Day one closing price 31 December 2016 closing price
¹ Reflects the overall gain from a notional investment of $1 in each IPO, based on the share price at 31 December 2016.
² Data not presented for industry sectors with less than three IPOs.
29%
15%
1%
7%
9%
6%
68%
8%
-18%
-16%
-12%
92%
-40% -20% 0% 20% 40% 60% 80% 100%
Software & Services
Retailing
Real Estate
Pharmaceuticals & Biotechnology
Materials
Investments
Health Care Equipment & Services
Food, Beverage & Tobacco
Diversified Financials
Consumer Services
Commercial Services & Supplies
Capital Goods
Average Return
2016 IPO Share Price Performance by Industry 1, 2
Share price performanceIPOs outperform the market

7Great people, great results
Case studyVEEM LimitedIPO provides for future growth
When Perth-based marine technology company Veem Limited (ASX: VEE) decided to IPO it was with a view to provide a financial structure to capitalise on the growth opportunities that new product developments were creating. It was also an opportunity to provide a mechanism to manage succession planning.
Mark Miocevich, managing director of Veem said: “The board had always considered that becoming a public company, or part of a public company, was a desirable direction, and we did not see any major downsides in pursuing an IPO.
“The cost of the IPO, and the additional board discipline required as a listed entity, were seen as reasonable tradeoffs for the potential benefits that an IPO offered. The IPO process ran smoothly and the key to this success was ensuring the company was IPO ready before the process began,” Mr Miocevich said.
This was demonstrated by having:
1. Many years of audited profitable performance.
2. A potentially high growth future product portfolio.
3. A highly structured, high compliance business profile.
4. A well developed business plan.
“Making the company IPO ready takes many years of product and system development. My advice for those considering an IPO in the future is to make your company think and act like a public company as early as you can. The transition is then smaller to make and will ultimately be more successful.”
He also offers advice on the importance of managing expectations.
“The IPO process time frame was longer than predicted by approximately three months. There were valid reasons for the delay, so my advice to others would be to allow a little longer than is initially thought.
“Because we used the best subcontractors to assist in the management of the IPO process, only realistic expectations were created from the beginning.
“Following the IPO, the overall process could be evaluated against those realistic expectations, and it was considered to be very successful from the board’s perspective.”
Not surprisingly, there was increased workload for the board and senior management during the IPO process. Mr Miocevich’s advice on how to manage this includes:
1. Having a comprehensive company budgeting model and easily accessible historical financials.
2. Having a comprehensive business plan including company history.
3. Engaging a financial consultant whose responsibility it is to prepare the company’s financial modeling for the IPO.
“This is a substantial amount of work in itself and would have placed an unreasonable burden on the board and staff had it not occurred,” he said.
Since listing on the ASX there has been a definite upside impact on the business.
“There is an increased need for public relations to provide the higher public profile required for a public company, which is a positive for all of the company’s stakeholders.
“There has also been an increased focus by senior management, and the board, on meeting all forecasts. This dedication to meeting targets can only have a positive impact on the business.”
Mr Miocevich offers a final piece of advice for those looking to undertake an IPO.
“Perhaps the most significant consideration is to choose the right adviser,” he said.
“One of the most important factors which contributed to a successful IPO for the company was finding the best consultants to guide the company through the process.
“Without the efforts of Danny Buckley and his team at HLB Mann Judd, we may have been looking at a very different outcome.”
Raised $25 million on listing.Investigating AccountantOctober 2016
8 www.hlb.com.au
During 2016 we observed that the “backdoor” continued to provide an entry for many businesses to access the ASX for the first time, rather than via an IPO. As observed last year, the surge in the number of backdoor listings over the last three years can be attributed to changes by the ASX in 2014, including allowing companies to issue shares below 20 cents each, along with adopting a policy to automatically remove long-term suspended entities which has acted as an incentive to some current ASX list vehicles to look for reconstruction opportunities. Further, the end of the mining boom saw the proliferation of exploration companies reduced to shells and seeking other investment opportunities outside the mining industry. Changes to ASX Listing Rules and Guidance Note 12 (effective 19 December 2016) are likely to have an impact on backdoor listings and the popularity of the backdoor as an alternative listing route may slow during 2017.
IPO or through the backdoor?
A reverse takeover, alternatively known as a backdoor listing, usually involves a listed shell company acquiring the shares or assets of an unlisted company in return for shares in the listed company. Shareholder approval is required from the “acquiring” listed vehicle for the transaction and the entity will typically change its strategy, control, management and name at this time. An equity capital raising often accompanies the listing and offers a new life for a dormant shell company.
Listing via the backdoor, rather than via an IPO usually involves costs associated with extra legal and accounting work involved in preparation of expert reports and agreements for approval at a meeting of shareholders. A backdoor listing requires shareholder approval and, as such, that process contains some uncertainty and may take longer than a controlled IPO approach.
As an alternative listing route to IPO, a backdoor listing can have advantages for certain companies with particular circumstances. The data observed in 2016 shows it’s typically smaller businesses and capital raisings that opted for a backdoor listing as opposed to an IPO. Further, during 2016 a large number of companies in the innovation and technology sector have listed via the backdoor.
The new ASX Listing Rules require that a listed company’s share register has at least 300 security holders each holding at least $2,000 of securities. A benefit of a backdoor listing is the listed shell company has existing shareholders which may assist the entity to achieve the required shareholder spread to comply with ASX relisting requirements (noting the minimum $2,000 parcels must still be met) that it may not achieve via an IPO. Through a backdoor listing, a company can request the ASX to waive the 20 cent minimum issue price and allow an issue price as low as 2 cents. If the shell company has existing cash and expertise within the board of directors, this would also offer a significant advantage over an IPO.
ASX closing the backdoor
The new ASX Listing Rules and changes to Guidance Note 12 are likely to provide greater hurdles to those seeking listing via the backdoor, and the market is likely to see a significant decline in the number of backdoor listings in 2017.
The new ASX Listing Rules in relation to audit requirements for historic financial information will also impact backdoor listings, with the ASX’s new position requiring in most instances 2 full years of audited accounts for the entity seeking admission and any significant business it has acquired in the previous 12 months (or proposes to acquire in connection with the listing). Significant is defined as more than 25% of the consolidated net assets, consolidated total equity interests, consolidated annual revenue.
Other changes to ASX Listing Rules include a change to the profit test to increase the requirement for consolidated profits for the 12 months prior to admission from $400,000 to $500,000, a change to the Net Tangible Assets Test to increase the net tangible assets from $3 million to $4 million, and a change to the Market Capitalisation Test to increase the market capitalisation from $10 million to $15 million.
One of the advantages backdoor listings had over IPOs was that securities in an entity that announces a backdoor listing could continue trading up to the day on which the security holders are asked to approve the transaction. ASX has changed this policy in Guidance Note 12 and will now suspend trading in an entity’s securities from the time it announces it is subject to a reverse takeover, until it has re-complied with ASX’s admission and quotation requirements under Listing Rule 11.1.3.
The full impact of these and the other changes to the ASX Listing Rules are yet to be felt on the market. The effect of these changes is likely to reduce the number of backdoor listings and small cap IPOs in 2017, both of which have been dominated by the technology sector in recent years. With the introduction of the changed listing rules aimed at improving the quality of new listings, the performance of backdoor listings and small cap IPOs in 2017 will be interesting to watch.
Reverse takeovers (RTOs) overviewThe impact of the new ASX Listing Rules
Simon James
Partner Corporate Advisory
Sydney
As an alternative listing route to IPO, a backdoor listing can have advantages for certain companies with particular circumstances.

9Great people, great results
Many exploration entities have been forced, due to market conditions, to undertake backdoor listings in recent years.
Following much consultation and feedback, the Australian Securities Exchange (ASX) has introduced a number of changes to the listing requirements for companies.
The new rules, which came into effect on 19 December 2016, were tempered following the consultation period but are still likely to have an impact on future transactions and, in particular, reverse takeover (RTO) transactions (also known as backdoor listings).
Some of the key changes include:
Financial thresholds The financial threshold for listing has been increased, meaning companies will now need to meet either a net tangible asset test of $4 million (up from $3 million) or a market capitalisation test of $15 million (up from $10 million).
Free float requirement A 20 percent minimum free float requirement at the time of admission has been introduced. Previously there was a general expectation that entities should list with a free float of at least 10 percent but ASX had also accepted a lower free float if companies could explain their plans and timeline to increase the free float.
Minimum spread requirements The ASX had originally proposed changing the minimum spread requirements to require 200 security holders (if the entity has a free float of less than $50 million) or 100 security holders (if the entity has a free float of $50 million or more), with each security holder having a parcel of securities with a value of at least $5,000.
The final rules have changed the spread test to a single tier of at least 300 security holders, each holding at least $2,000 of securities.
Audited accounts “Asset test entities” are now required to disclose their audited accounts for the last two financial years. The original proposal was for the last three years.
In addition, such entities must also provide the audited accounts of any significant acquisitions in the 12 months prior to listing, or proposed acquisitions in connection with the listing.
Impact on exploration companies
During the consultation period, there had been some speculation that ASX may allow carve outs for explorers, in particular regarding the net tangible asset requirement.
This was a key concern because exploration entities are very dependent on ready access to equity markets to achieve their business objectives and undertake exploration activity.
While the carve out did not happen, overall the industry appears satisfied that the ASX took the feedback on board and moderated its proposals.
For instance, the original proposal by the ASX was to increase the proposed market capitalisation test to $20 million.
However, as highlighted in previous IPO Watch reports, listings for juniors have tended to be at the lowest market capitalisations and in many cases market capitalisation on listing has been less than $20 million.
Changing the market cap test to $15 million rather than $20 million will make it easier for juniors to achieve their IPO goals.
Another welcome adjustment to the original proposal is dropping the requirement for investors to have a parcel of securities with a value of at least $5,000, and instead maintaining the existing $2,000 requirement.
Resource companies are generally highly speculative plays for “Mum and Dad” investors and the self-managed superannuation fund market, and an increase in the minimum investment was likely to negatively influence decisions on capital allocations for these investors.
Whilst a $2,000 minimum investment could be seen as an acceptable allocation of funds to a high risk investment, many investors would not consider a $5,000 minimum investment in the same light.
Backdoor listings
Many exploration entities have been forced, due to market conditions, to undertake backdoor listings in recent years.
There is a natural limit on the ability of exploration entities to sustain their existence without further capital injections and many entities only have sufficient cash reserves for one or two quarters. The exit route for most of these entities in recent years has been to ‘backdoor’ a new business into the shell.
The past two years in particular have seen high numbers of recompliance listings where explorers have changed the nature of their business - a high proportion being into the technology sector.
The moderated changes as outlined above, together with improved investor sentiment as evidenced by a healthy pipeline for the Materials sector at the start of 2017, may mean juniors return to the IPO market in the coming year.
Amendments to ASX listing rulesNew changes are balanced and moderate
Marcus Ohm
Partner Corporate & Audit Services
Perth

10 www.hlb.com.au
Reverse takeovers (RTOs) were a significant feature of 2016. Also known as backdoor listings, 69 RTOs took place during the year, with associated capital raisings totalling $368.42 million. This represents a notable increase on 2015, which was already a strong year for RTOs, when 58 companies listed through this method and raised $330.14 million in the process.
It has been evident over the last few years that there has been a trend for materials companies to transform into technology companies via backdoor listings. There has also been a geographic diversification from Western Australian-based shell companies to various other States and industries.
From an industry-based perspective, in 2016 there was a net increase of 23 listings for the Software & Services sector, and two listings for Technology Hardware & Equipment which can be contrasted with a net decrease of 25 listings for Materials, and a decrease of ten listings for Energy stocks. This trend corresponds closely to the previous year when Software & Services (+17 companies) increased at the expense of Materials (-18 companies).
The geographic change has been less pronounced than the movement between industries. In 2016, WA had a net loss of 7% or three companies, which follows on from the relatively small movement of seven companies in 2015. NSW experienced a net gain of three in 2016, which was down on the seven in 2015.
Unlike the IPO market, there was no evidence of a final quarter rush to complete transactions prior to ASX rule changes being implemented. The March quarter of 2016 was the best performer with 28 RTOs (41%) raising a total of $135.15 million, or 27% of the total. In 2015, the best performing quarter was the June quarter, with 16 listings (28%) raising $103.66 million (31%).
From a share price performance perspective, RTOs performed worse on average than the overall market, with an average gain of 6% compared to the gain in the ASX 200 of 7%. This was a marked deviation from 2015, when backdoor listings significantly outperformed the market, recording average gains of 9%, compared to a loss of 2% in the ASX 200.
A total of 22 RTOs (or 32% of RTOs) finished the year with share prices in the black (2015: 22 RTOs or 37%). It was notable in 2016 that significantly more entities recorded a net loss in share price over the year, with 42 newly back-doored entities (61%) ending up in negative territory compared to just 28 entities in 2015 (48%).
Reverse takeovers (RTOs) overviewAn analysis of RTOs
-100% -50% 0% 50% 100%
WA
VIC
TAS
SA
QLD
NT
NSW
ACT
2016
2015
1Relative Movement by State
20.00
40.00
60.00
80.00
100.00
120.00
140.00
160.00
2015 - March 2015 - June 2015 -September
2015 -December
2016 - March 2016 - June 2016 -September
2016 -December
0
2
4
6
8
10
12
14
16
18
Am
ou
nt Raise
d ($m)N
um
be
r of
RT
Os
Number of RTOs Amount Raised ($m)
RTO Activity by Quarter
From a share price performance perspective, RTOs performed worse on average than the overall market.
¹ Relative movements are calculated as the difference between the total home States of the companies prior to the completion of the RTO, and, subsequently, expressed as a percentage increase or decrease.

11Great people, great results
Reverse takeovers (RTOs) overviewAnalysis by market capitalisation
$10
$20
$30
$40
$50
$60
0
5
10
15
20
25
30
35
0 to 10 10 to 25 25 to 50 50 to 75 75 to 100 100+
Am
ou
nt Raise
d ($m)N
um
be
r of
RT
Os
2015 RTOs 2016 RTOs 2015 Median Funds Raised 2016 Median Funds Raised
RTOs by Market Capitalisation
Market capitalisation ($m)
Similarly to 2015, reverse takeovers were most prevalent amongst the smaller cap companies. A total of 32 RTOs had a market capitalisation of less than $10 million or 46% of all RTOs. The $10-25 million market capitalisation range was also a standout with 26 listings comprising 38% of the total. In the previous year, the most common market capitalisation bracket was $10-25 million, which had 27 backdoor listings (or 47%).
The <$10 million and $10-25 million brackets contributed the most to the total funds raised through an RTO process with the smallest companies (<$10 million market capitalisation) adding $121.47 million, or 33% of the year’s total of $368.42m. This was narrowly behind those within the $10-25 million bracket, who raised $130.98 million or 36% of the total. This bracket was the best performer in 2015, with 43% ($141.07) of the total funds raised of $330.14 million.
In the previous year, the large cap companies recorded the highest average funds raised
at $50.00 million which contrasts strongly with the current year. As there was only one relatively small RTO within the >$100 million market cap bracket during the year, average funds raised by this market capitalisation bracket was only $1.56 million, and was significantly behind the $25-50 million bracket, which recorded an average raising of $11.95 million.
The smallest companies (<$10 million) performed well with respect to their share prices recording an average gain of 41% by the end of the year. This was also the only bracket to record an average gain, with significant losses from the large caps (a loss of 65%) and the $25-50 million bracket (loss of 21%) reducing the average for all RTOs where the average price increase was 6%. The wider ASX 200 climbed by 7% over the same period. RTOs did not therefore outperform the market significantly in 2016 when compared to the previous year when the average gain of 9% represented a solid performance against the ASX 200, which decreased by 2%.
Similarly to 2015, reverse takeovers were most prevalent amongst the smaller cap companies.

12 www.hlb.com.au
The technology sectors were the most significant inbound industries for RTOs during 2016 recording a total of 35 RTOs. The largest contributor was Software & Services with 26 companies utilising a backdoor listing with Pharmaceuticals & Biotechnology (five listings) and Technology, Hardware & Equipment (four listings) also making a contribution. Interestingly, ten materials stocks listed via a backdoor listing during the year (14%) in what has been a year of recovery for a sector which in recent history has tended to enter the market via a traditional IPO process. These trends follow 2015 fairly closely when 22 technology stocks listed through RTO (38%) and 12% of all backdoor listings were for Materials stocks (seven listings).
Software & Services, unsurprisingly, was the largest contributor to total funds raised with $110.07 million (30%). This is similar to 2015 when this sector raised $128.01 million or 39% of the total. In contrast, RTOs within the Real
Estate sector were less active in the current year only contributing 2% ($5.57 million) to the total funds raised after comprising 15% of the total capital raised in 2015.
With respect to share price performance, the Pharmaceuticals & Biotechnology sector was the standout performer recording average gains of 163%. Telecommunications Services also closed out the year well recording an average gain of 136% from the two listings within this sector and continuing the strong performance from 2015 when the average gain was 56%.
Materials stocks were relatively poor performers, with an average loss of 14% which compared to the previous year average loss of 23%. The worst performing sector during 2016 was, however, the Commercial Services & Supplies sector with an average loss of 43%, which was a significant negative turnaround when the industry sector recorded an average gain of 51% in 2015.
RTO Share Price Performance By Industry
-100% -50% 0% 50% 100% 150% 200%
Capital Goods
Commercial Services & Supplies
Food Beverage & Tobacco
Health Care Equipment & Services
Materials
Pharmaceuticals & Biotechnology
Software & Services
Technology Hardware & Equipment
Average Share Price Performance
2016
2015
Average Return
Reverse takeovers (RTOs) overviewAnalysis by industry sector
With respect to share price performance, the Pharmaceuticals & Biotechnology sector was the standout performer...

Great people, great results
The HLB Mann Judd Australasian Association consists of nine member firms and two representative firms across Australia and New Zealand. It represents a group of specialists providing business advice and services to a wide range of business organisations and private clients.
As members of HLB International, HLB Mann Judd firms are part of a worldwide network of respected accounting firms with more than 500 offices in over 100 countries. We are ranked in the top 12 largest accounting and business advisory groups worldwide. Through this international network we obtain the benefit of HLB’s global experience and provide our clients with access to professional expertise throughout the world.
HLB Mann Judd firms offer a comprehensive range of professional services to listed clients and companies pursuing an IPO. In addition to acting as corporate advisers, investigating accountants, and tax and accounting advisers, we have extensive experience in assisting clients in their preparation for an IPO and in evaluating the benefits and feasibility of an IPO against alternative strategic options.
Our assistance to companies pursuing an IPO or RTO typically includes:
n Investigating accountant’s reports on historical and forecast financial information
n Independent expert’s reports
n Analysis and advice on feasibility and alternatives to an IPO
n Pre-IPO diagnostic review
n Corporate and structuring advice
n Financial and taxation due diligence
n Valuations
n Company and shareholder tax advice and planning
n Accounting advice.
About HLB Mann Judd
Recent transactionsHLB Mann Judd is proud to have assisted in the following IPOs or RTOs in 2016:
Intiger Group Limited
TECHNOLOGYMETALS AUSTRALIA LIMITED

Australian IPO Activity in 2016
IPO Watch Australia
Member FirmsAdelaideTel +61 8 8133 5000 Email [email protected]
AucklandTel +64 9 303 2243 Email [email protected]
BrisbaneTel +61 7 3001 8800 Email [email protected]
Gold Coast Tel +61 7 5574 0922 Email [email protected]
MelbourneTel +61 3 9606 3888 Email [email protected]
PerthTel +61 8 9227 7500 Email [email protected]
Perth (Insolvency WA)Tel +61 8 9215 7900 Email [email protected]
SydneyTel +61 2 9020 4000 Email [email protected]
WollongongTel +61 2 4254 6500 Email [email protected]
Representative FirmsHobart | Lorkin Delpero HarrisTel +61 3 6224 4844 Email [email protected]
Lismore | Thomas Noble and RussellTel +61 2 6621 8544 Email [email protected]
The HLB Mann Judd Australasian Association is an independent network of accounting firms, business and financial advisers with offices throughout Australia and New Zealand. Each member firm is separately owned and managed and has no liability for the acts and omissions of any other member firm. Not all services listed in this brochure are provided by all member firms.
HLB Mann Judd firms are part of HLB International, a world-wide network of independent accounting firms and business advisers.
linkedin.com/company/hlb-mann-judd twitter.com/HLBMannJudd
hlb.com.au
Liability limited by a scheme approved under Professional Standards Legislation.