greater china ipo watch 2009 - le figaro ipo chine.pdf · greater china ipo watch 2009 ... and...
TRANSCRIPT
Capital Market Services
Greater China IPO Watch 2009
Greater China IPO Watch 2009
This Greater China IPO Watch provides an overview of the initial public offerings (IPOs) and listing activities on Greater China’s principal stock markets, including Hong Kong, Shanghai, Shenzhen and Taiwan. The analysis covers companies which were listed on these markets from 1 January to 31 December 2009. For comparability purposes, all figures in this report have been translated into United States Dollars (USD) at the applicable closing exchange rate at the end of each year.
Initial public offering in this publication is defined to include all share listings on a platform where the entity’s shares have not been listed previously.
This report has been prepared by the China/Hong Kong Capital Market Services Group of PricewaterhouseCoopers.
Introduction to the four stock marketsThe Hong Kong stock market consists of two separate boards: the Main Board (MB) and the Growth Enterprise Market (GEM). The MB facilitates fund raising by companies with track records of certain minimum profit, revenue, operating cash flow and/or market capitalisation levels as set out in the Hong Kong listing rules. The GEM focuses on companies which do not fulfil the profitability/track record requirements of the Main Board but have growth potential. Companies established in Mainland China (the People’s Republic of China) that are listed in Hong Kong are referred to as H-share companies. Companies owned by Mainland China nationals or enterprises which are listed in Hong Kong through Hong Kong or overseas incorporated holding companies are referred to as Red Chip companies.
Both the Shanghai and Shenzhen Stock Exchanges consist of A-share and B-share listing platforms on which companies established in Mainland China can list. The Shenzhen Stock Exchange has a Small and Medium Enterprise (SME) Board and a ChiNext Board to facilitate fund-raising of small and medium-sized enterprises and growing venture enterprises. Shanghai and Shenzhen A-share, and shares listed on SME and ChiNext can only be traded by Mainland China nationals and enterprises, while B-share can only be traded by overseas investors.
The Taiwan Stock Exchange (TSEC) facilitates capital raising by companies (both Taiwan and foreign companies) with track records of certain minimum profit and capital base. Technology-based companies without track records but with a certain minimum amount of paid-in capital and projected net worth can also be listed. Most of the companies in Taiwan have to list their shares for a minimum of six months on the over-the-counter market, Emerging Stock on the Gretai Securities Market (GTSM) before listing on TSEC. This review does not include data from the GTSM.
Greater China IPO Watch 2009
Contents
Page
Foreword 1
Overview of the IPO markets in Greater China 2
IPOs by stock exchange 3
A/H-share perspective 4
IPO vs. other equity fund raising 5
IPOs by P/E multiples 6
IPOs by share price performance on the first day of listing 7
IPOs by industry sector 8
Turnover value and market capitalisation 9
Top ten IPOs in Greater China from 2005 to 2009 10
Top ten IPOs in world history and top ten IPOs worldwide in 2009 11
Comparison with the US markets 12
Comparison with the European markets 13
Comparison with major Asian markets 14
Comparison of market capitalisation with GDP 15
1 Greater China IPO Watch 2009
There was a significant rebound of IPO activities in the Greater China capital markets in the second half of 2009, even though other capital markets over the world were still suffering from the global financial crisis and contracting economy.
There were 208 IPOs in Greater China with total funds raised amounting to USD59.7 billion in 2009, compared to 157 IPOs with USD23.9 billion funds raised in 2008. The Greater China capital markets regained the leading role with the highest total funds raised among the world’s major capital markets in 2009. United States (New York Stock Exchange and NASDAQ) ranked second in 2009 as there was a lack of mega size company listings.
There were some sizable companies listed in Hong Kong and Shanghai this year. The average deal size increase from USD0.15 billion in 2008 to USD0.29 billion in 2009. In addition, the trend of H-share companies (Mainland China companies listed on the Hong Kong Stock Exchange) offering and listing their shares on the Shanghai A-share market continue in 2009. In 2009, there was one existing H-share listing its shares on the Shanghai A-share market and there was a company listing its shares in Hong Kong and Shanghai almost the same time.
In 2009, Shenzhen ChiNext was launched and successfully attracted 36 companies with IPO funds raised of USD3 billion. ChiNext offers a new capital platform for Chinese enterprises engaged in innovation and other growing industries . All these IPOs were offered at a P/E multiple of over 30 times.
There was a general increase in pricing, in terms of Price Earnings multiples (P/E), in Hong Kong, Shanghai and Shenzhen. 38% of those newly listed companies in Hong Kong offered shares at a P/Es of more than 20 times while it was only 29% in 2008. In Shanghai, most of the IPOs were offered at a P/E multiples of over 30 times in 2009 while all the IPOs in Shenzhen were offered at P/E multiples of over 30 times in 2009.
Looking ahead, with the economy stimulation plans still being put in place by various governments, it is expected that both stock markets and IPO activities will continue to be prosperous. The Chinese Government has announced its intention to transform Shanghai into an international financial centre by 2020. In this regards, Shanghai is expected to establish an International Board soon to attract red-chips or other sizeable overseas companies to list there. For Hong Kong, we believe that it will continue its well-established position to be a gateway for foreign investors to access to the China market. We expect that these will be more overseas companies offering and listing their shares in Hong Kong in the coming year.
Foreword
Kennedy Liu
Head of China/Hong Kong Capital Market Services Group PricewaterhouseCoopers
Greater China IPO Watch 2009 2
Overview of the IPO markets in Greater China
98
140
242
157
208
0
50
100
150
200
250
300
2005 2006 2007 2008 2009
Year
Number of IPOs from 2005 to 2009
Num
ber
of I
PO
s
25.6
62.0
104.0
23.9
59.7
0
20
40
60
80
100
120
Amount of IPO funds raised from 2005 to 2009 (in USD billion)
US
D b
illio
n
2005 2006 2007 2008 2009
Year
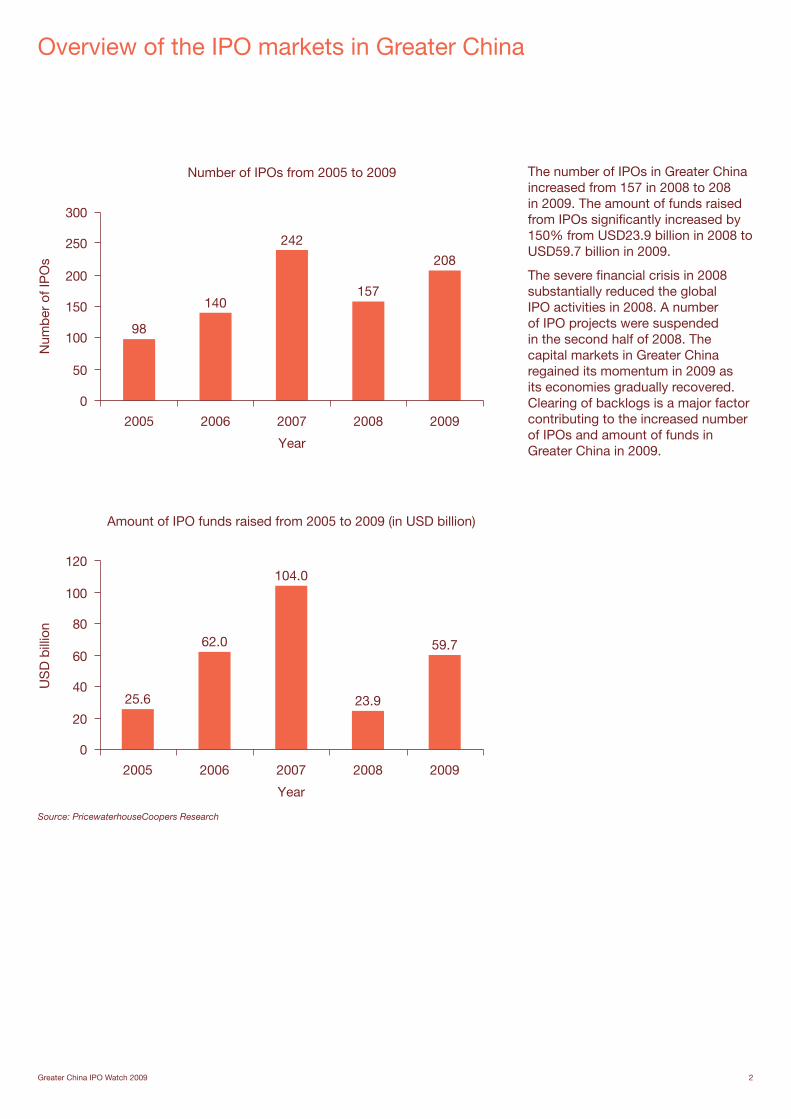
The number of IPOs in Greater China increased from 157 in 2008 to 208 in 2009. The amount of funds raised from IPOs significantly increased by 150% from USD23.9 billion in 2008 to USD59.7 billion in 2009.
The severe financial crisis in 2008 substantially reduced the global IPO activities in 2008. A number of IPO projects were suspended in the second half of 2008. The capital markets in Greater China regained its momentum in 2009 as its economies gradually recovered. Clearing of backlogs is a major factor contributing to the increased number of IPOs and amount of funds in Greater China in 2009.
Source: PricewaterhouseCoopers Research
3 Greater China IPO Watch 2009
(Funds raised in USD billion)
Hong Kong Main Board
Hong Kong GEM Shanghai A Shenzhen A
Shenzhen SME Board
Shenzhen ChiNext Taiwan Total
2005
No. of IPOs 60*# 10 3 0 12 - 13 98
% of total 61.2% 10.2% 3.1% 0.0% 12.2% - 13.3% 100%
Funds raised 24.6 0.1 0.3 0.0 0.4 - 0.2 25.6
% of total 96.1% 0.4% 1.2% 0.0% 1.5% - 0.8% 100%
2006
No. of IPOs 58*# 6 13 0 52 - 11 140
% of total 41.4% 4.3% 9.3% 0.0% 37.1% - 7.9% 100%
Funds raised 43.9 0.2 15.1 0.0 2.1 - 0.7 62.0
% of total 70.8% 0.3% 24.4% 0.0% 3.4% - 1.1% 100%
2007
No. of IPOs 84*# 2 25^ 1^ 100 - 30 242
% of total 34.7% 0.8% 10.4% 0.4% 41.3% - 12.4% 100%
Funds raised 37.8 0.2 60.0 0.0 5.4 - 0.6 104
% of total 36.3% 0.2% 57.7% 0.0% 5.2% - 0.6% 100%
2008
No. of IPOs 47# 2 6^ 0 71 - 31 157
% of total 29.9% 1.3% 3.8% 0.0% 45.2% - 19.8% 100%
Funds raised 8.5 0.0 10.8 0.0 4.4 - 0.2 23.9
% of total 35.6% 0.0% 45.2% 0.0% 18.4% - 0.8% 100%
2009
No. of IPOs 68# 5 9 0 54 36 36 208
% of total 32.7% 2.4% 4.3% 0.0% 26.0% 17.3% 17.3% 100.0%
Funds raised 32.0 0.0 18.3 0.0 6.2 3.0 0.2 59.7
% of total 53.6% 0.0% 30.7% 0.0% 10.4% 5.0% 0.3% 100.0%
* - included Real Estate Investment Trusts (REITs): 3 in 2005, 2 in 2006 and 2 in 2007# - included listing by introduction & switch from GEM to Main Board without raising funds in Hong Kong: 3 in 2005, 3 in 2006, 4 in 2007, 20 in 2008 and 8 in 2009
^ - included listing companies by shares swap, without raising funds: 2 in Shanghai A-share and 1 in Shenzhen A-share in 2007; 1 in Shanghai A-share in 2008
Source: PricewaterhouseCoopers Research
IPOs by stock exchange
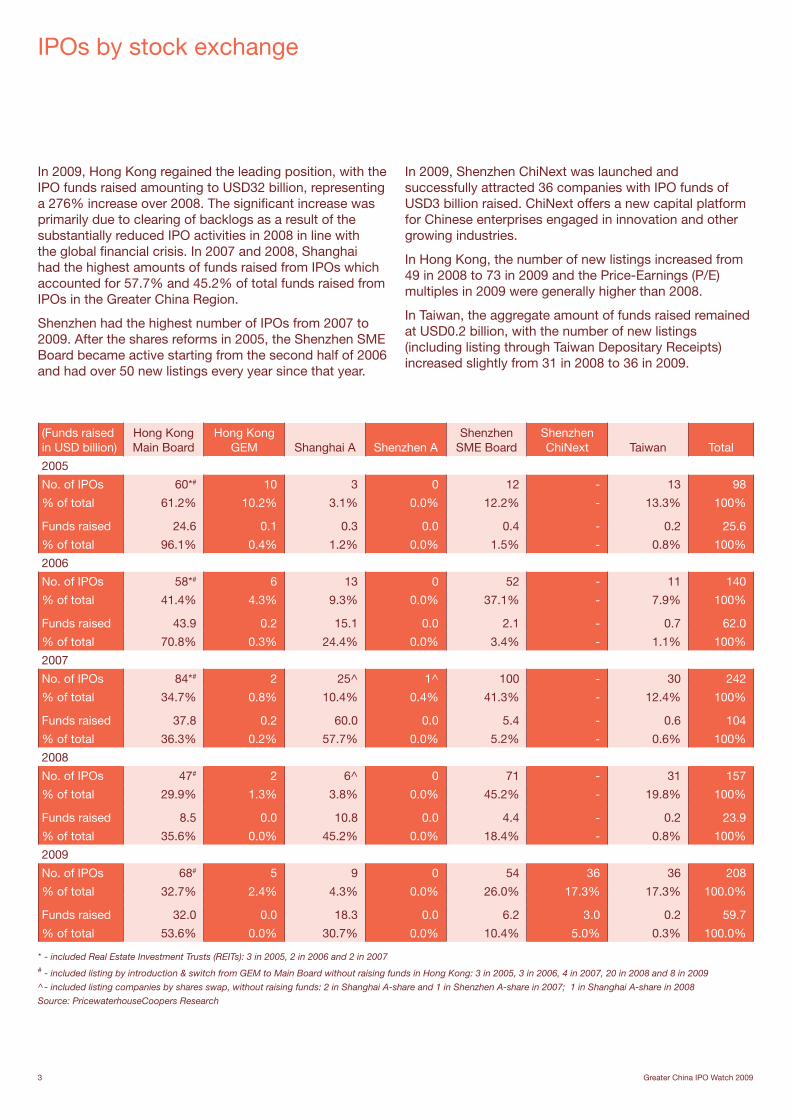
In 2009, Hong Kong regained the leading position, with the IPO funds raised amounting to USD32 billion, representing a 276% increase over 2008. The significant increase was primarily due to clearing of backlogs as a result of the substantially reduced IPO activities in 2008 in line with the global financial crisis. In 2007 and 2008, Shanghai had the highest amounts of funds raised from IPOs which accounted for 57.7% and 45.2% of total funds raised from IPOs in the Greater China Region.
Shenzhen had the highest number of IPOs from 2007 to 2009. After the shares reforms in 2005, the Shenzhen SME Board became active starting from the second half of 2006 and had over 50 new listings every year since that year.
In 2009, Shenzhen ChiNext was launched and successfully attracted 36 companies with IPO funds of USD3 billion raised. ChiNext offers a new capital platform for Chinese enterprises engaged in innovation and other growing industries.
In Hong Kong, the number of new listings increased from 49 in 2008 to 73 in 2009 and the Price-Earnings (P/E) multiples in 2009 were generally higher than 2008.
In Taiwan, the aggregate amount of funds raised remained at USD0.2 billion, with the number of new listings (including listing through Taiwan Depositary Receipts) increased slightly from 31 in 2008 to 36 in 2009.
Greater China IPO Watch 2009 4
6
12
23
97
0
5
10
15
20
25
Number of H-share IPOs from 2005 to 2009
Num
ber
of I
PO
s
2005 2006 2007 2008 2009
Year
As at 31 December 2009 Number
H-share companies already listed A-share 61
H-share companies without issued A-share 95
Total H-share listed companies in Hong Kong 156
As at 31 December 2009 Number
A-share companies (out of 50 according to market capitalisation) in Shanghai without H-share issued
23
A-share companies (out of 50 according to market capitalisation) in Shenzhen without H-share issued
47
Source: PricewaterhouseCoopers Research
A/H-share perspective
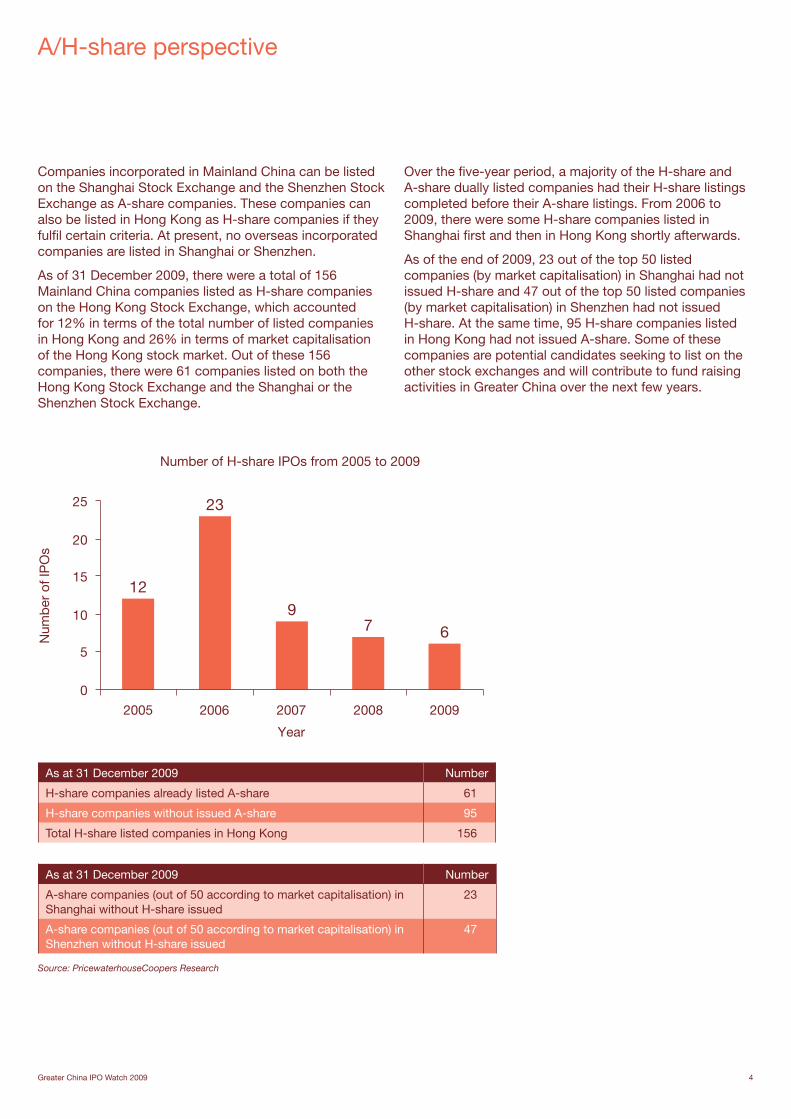
Companies incorporated in Mainland China can be listed on the Shanghai Stock Exchange and the Shenzhen Stock Exchange as A-share companies. These companies can also be listed in Hong Kong as H-share companies if they fulfil certain criteria. At present, no overseas incorporated companies are listed in Shanghai or Shenzhen.
As of 31 December 2009, there were a total of 156 Mainland China companies listed as H-share companies on the Hong Kong Stock Exchange, which accounted for 12% in terms of the total number of listed companies in Hong Kong and 26% in terms of market capitalisation of the Hong Kong stock market. Out of these 156 companies, there were 61 companies listed on both the Hong Kong Stock Exchange and the Shanghai or the Shenzhen Stock Exchange.
Over the five-year period, a majority of the H-share and A-share dually listed companies had their H-share listings completed before their A-share listings. From 2006 to 2009, there were some H-share companies listed in Shanghai first and then in Hong Kong shortly afterwards.
As of the end of 2009, 23 out of the top 50 listed companies (by market capitalisation) in Shanghai had not issued H-share and 47 out of the top 50 listed companies (by market capitalisation) in Shenzhen had not issued H-share. At the same time, 95 H-share companies listed in Hong Kong had not issued A-share. Some of these companies are potential candidates seeking to list on the other stock exchanges and will contribute to fund raising activities in Greater China over the next few years.
5 Greater China IPO Watch 2009
Hong Kong Shanghai Shenzhen TaiwanGreater China
Total
(Amounts in USD billion) Amount % Amount % Amount % Amount % Amount %
2005
IPO funds raised 24.7 59% 0.3 8% 0.4 100% 0.2 9% 25.6 53%
Other equity funds raised 17.5 41% 3.4 92% 0.0 0% 2.0 91% 22.9 47%
Total equity funds raised 42.2 100% 3.7 100% 0.4 100% 2.2 100% 48.5 100%
2006
IPO funds raised 44.1 64% 15.1 68% 2.1 33% 0.7 33% 62.0 63%
Other equity funds raised 24.5 36% 7.1 32% 4.2 67% 1.4 67% 37.2 37%
Total equity funds raised 68.6 100% 22.2 100% 6.3 100% 2.1 100% 99.2 100%
2007
IPO funds raised 38 50% 60.0 66% 5.4 35% 0.6 26% 104.0 56%
Other equity funds raised 38.2 50% 30.6 34% 10.2 65% 1.7 74% 80.7 44%
Total equity funds raised 76.2 100% 90.6 100% 15.6 100% 2.3 100% 184.7 100%
2008
IPO funds raised 8.5 15% 10.8 33% 4.4 24% 0.2 25% 23.9 22%
Other equity funds raised 46.6 85% 21.6 67% 13.7 76% 0.6 75% 82.5 78%
Total equity funds raised 55.1 100% 32.4 100% 18.1 100% 0.8 100% 106.4 100%
2009
IPO funds raised 32.0 39% 18.3 38% 9.2 37% 0.2 8% 59.7 38%
Other equity funds raised 50.8 61% 30.2 62% 15.9 63% 2.4 92% 99.3 62%
Total equity funds raised 82.8 100% 48.5 100% 25.1 100% 2.6 100% 159.0 100%
Source: PricewaterhouseCoopers Research
IPO vs. other equity fund raising
38%
62%
0
50
100
150
200
Total equity funds raised from 2005 to 2009 (in USD billion)
US
D b
illio
n
Other equity funds raised (USD billion)
IPO funds raised (USD billion)
2005 2006 2007 2008 2009
53%
47% 63%
37%
56%
44%
22%
78%
Year
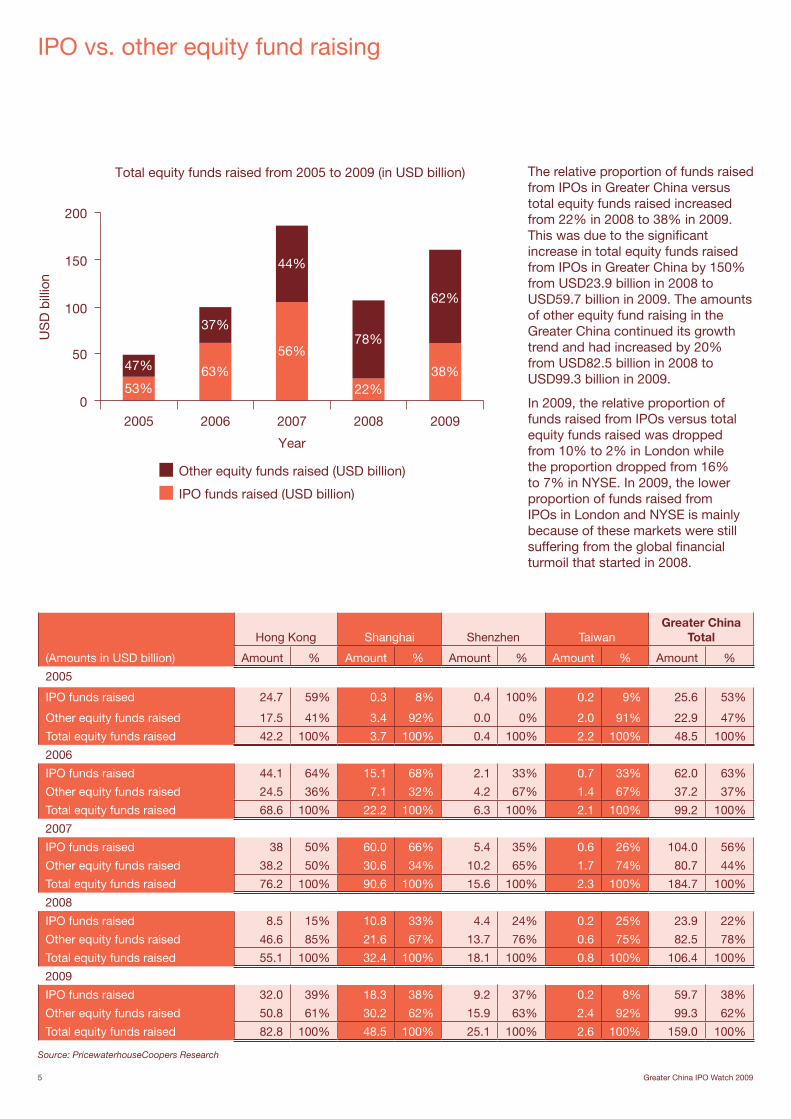
The relative proportion of funds raised from IPOs in Greater China versus total equity funds raised increased from 22% in 2008 to 38% in 2009. This was due to the significant increase in total equity funds raised from IPOs in Greater China by 150% from USD23.9 billion in 2008 to USD59.7 billion in 2009. The amounts of other equity fund raising in the Greater China continued its growth trend and had increased by 20% from USD82.5 billion in 2008 to USD99.3 billion in 2009.
In 2009, the relative proportion of funds raised from IPOs versus total equity funds raised was dropped from 10% to 2% in London while the proportion dropped from 16% to 7% in NYSE. In 2009, the lower proportion of funds raised from IPOs in London and NYSE is mainly because of these markets were still suffering from the global financial turmoil that started in 2008.
Greater China IPO Watch 2009 6
Hong Kong Shanghai Shenzhen Taiwan
49
39
1015 12 13
6 3 1 2 1
9
1 1 314
19
73 1
5 3
0
10
20
30
40
50
60
P/E ratio for 2009
<5 5-9.99
10-14.99
15-19.99
20-29.99
30-49.99
50-99.99
100-299.99
>300 N/A
P/E ratio
Num
ber
of I
PO
s
Source: PricewaterhouseCoopers Research
IPOs by P/E multiples
16 15
63
45
131428
13 18 17
125
36
6 2 3 1 1
24104 11
70
6 21012
42
0
20
40
60
80
100
120
140
P/E ratio by year
<5 5-9.99
10-14.99
15-19.99
20-29.99
30-49.99
50-99.99
100-299.99
>300 N/A
P/E ratio
Num
ber
of I
PO
s
2007 2008 2009
11 11 1221 19
2 28
110 9
3 21 2
90
712 5 3 4 1 1 113
0
20
40
60
80
100
P/E ratio for 2007
P/E ratio
<5 5-9.99
10-14.99
15-19.99
20-29.99
30-49.99
50-99.99
100-299.99
>300 N/A
Num
ber
of I
PO
s
27 7 5 2 1
21
2 33 11 4 42
64
12 2 1 1 1
20
0
20
40
60
80
P/E ratio for 2008
<5 5-9.99 10-14.99 15-19.99 20-29.99 30-49.99 50-99.99 N/A
Num
ber
of I
PO
s
P/E ratio
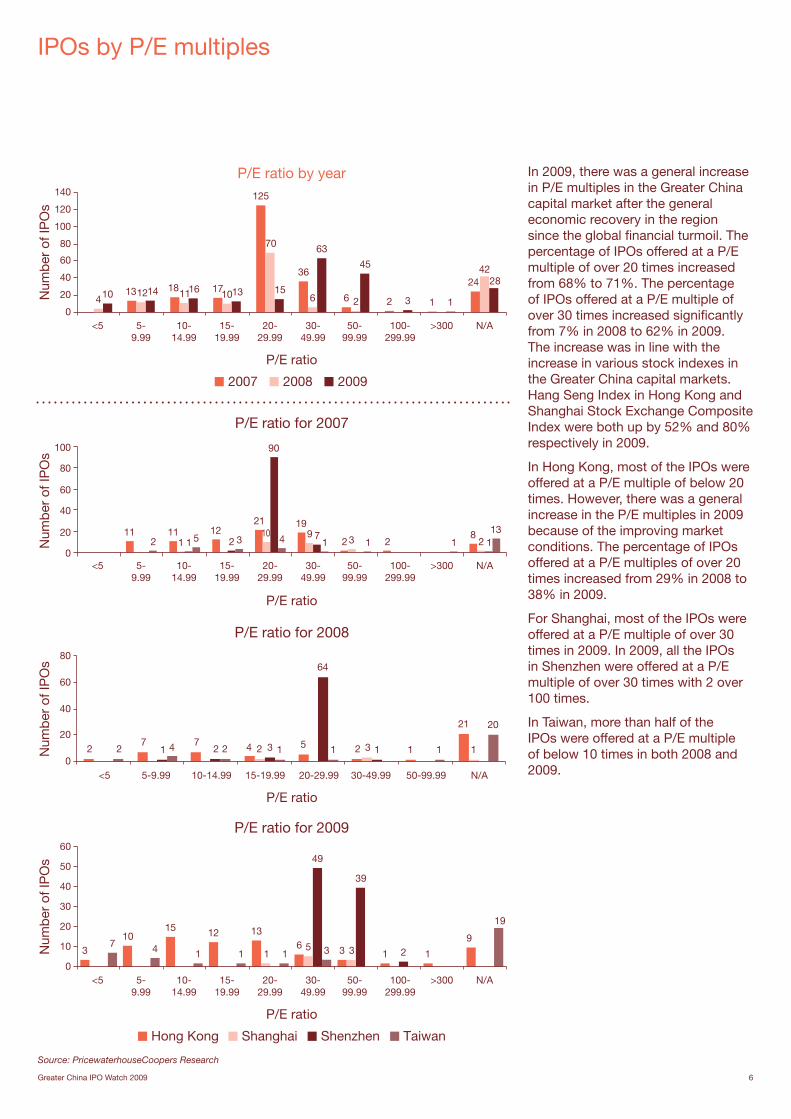
In 2009, there was a general increase in P/E multiples in the Greater China capital market after the general economic recovery in the region since the global financial turmoil. The percentage of IPOs offered at a P/E multiple of over 20 times increased from 68% to 71%. The percentage of IPOs offered at a P/E multiple of over 30 times increased significantly from 7% in 2008 to 62% in 2009. The increase was in line with the increase in various stock indexes in the Greater China capital markets. Hang Seng Index in Hong Kong and Shanghai Stock Exchange Composite Index were both up by 52% and 80% respectively in 2009.
In Hong Kong, most of the IPOs were offered at a P/E multiple of below 20 times. However, there was a general increase in the P/E multiples in 2009 because of the improving market conditions. The percentage of IPOs offered at a P/E multiples of over 20 times increased from 29% in 2008 to 38% in 2009.
For Shanghai, most of the IPOs were offered at a P/E multiple of over 30 times in 2009. In 2009, all the IPOs in Shenzhen were offered at a P/E multiple of over 30 times with 2 over 100 times.
In Taiwan, more than half of the IPOs were offered at a P/E multiple of below 10 times in both 2008 and 2009.
7 Greater China IPO Watch 2009
16
1116
512
58
1 2
12
3339
8
16
512 21 3
19
0
10
20
50
30
40
Num
ber
of I
PO
s
-20% to-29.99%
-10% to-19.99%
-0.01% to-9.99%
0% to9.99%
10% to19.99%
20% to49.99%
50% to99.99%
100% to199.99%
200% to299.99%
N/A
Hong Kong Shanghai Shenzhen Taiwan
% change of first day closing price over IPO price 2009
Source: PricewaterhouseCoopers Research
IPOs by share price performance on the first day of listing
713
29
11
25
3932
2511 11
6
21
32
51
94
16
16
11
2114
50 52
24
20
10
20
30
40
50
60
17
39
27
Share price performance by year – % change of first day closing price over IPO price
Num
ber
of I
PO
s
-20% to-29.99%
-10% to-19.99%
-0.01% to -9.99%
0% to9.99%
10% to19.99%
20% to49.99%
50% to99.99%
100% to199.99%
200% to299.99%
300% to499.99%
>500% N/A
2007 2008 2009
19
Share price performance by stock exchange –% change of first day closing price over IPO price 2007
611
24
10
19
10
2 43
10 9
1 2
17
38
31
13
21 25
1 3 2 2 1
13
0
10
20
30
40
-10% to-19.99%
-0.01% to-9.99%
0% to9.99%
10% to19.99%
20% to49.99%
50% to99.99%
100% to199.99%
300% to499.99%
>500%200% to299.99%
N/A
Num
ber
of I
PO
s
3
9 9
3 41
20
421
3
9
27
18
9
42 2 1
4 3
19
0
10
20
30
Num
ber
of I
PO
s
-10% to-19.99%
-0.01% to-9.99%
0% to9.99%
10% to19.99%
20% to49.99%
50% to99.99%
100% to199.99%
200% to299.99%
300% to499.99%
N/A
% change of first day closing price over IPO price 2008
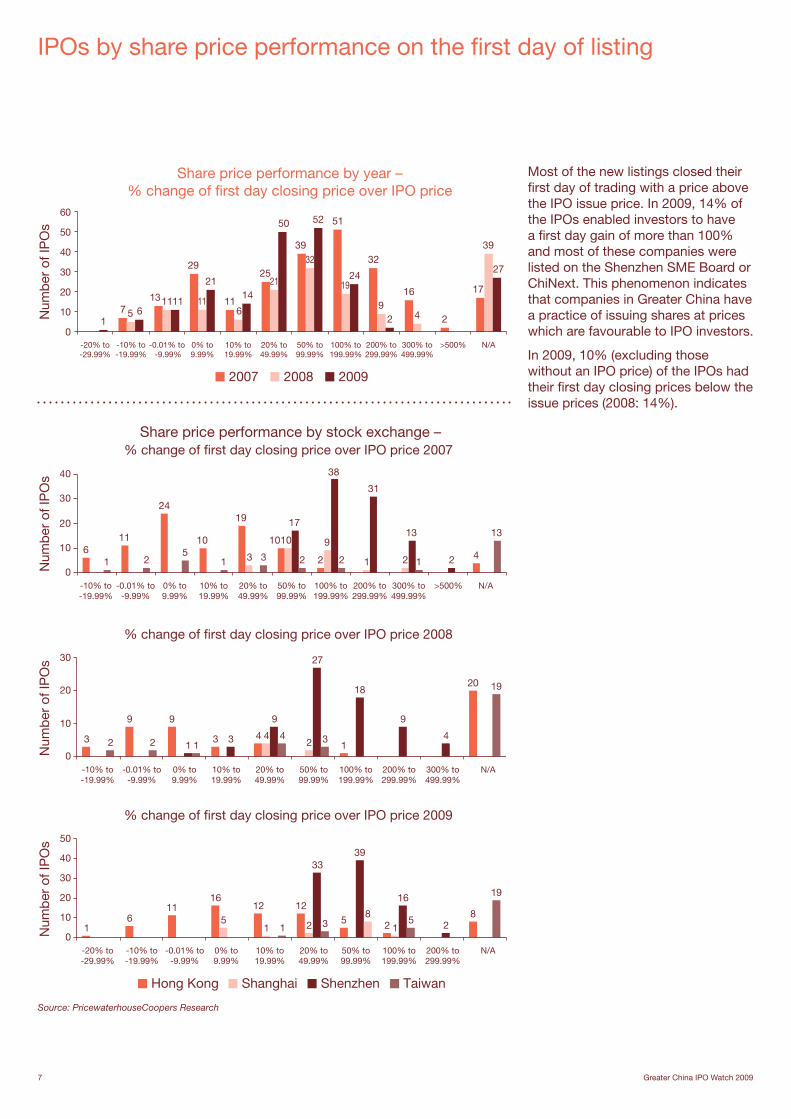
Most of the new listings closed their first day of trading with a price above the IPO issue price. In 2009, 14% of the IPOs enabled investors to have a first day gain of more than 100% and most of these companies were listed on the Shenzhen SME Board or ChiNext. This phenomenon indicates that companies in Greater China have a practice of issuing shares at prices which are favourable to IPO investors.
In 2009, 10% (excluding those without an IPO price) of the IPOs had their first day closing prices below the issue prices (2008: 14%).
Greater China IPO Watch 2009 8
IPOs by industry sector
Source: PricewaterhouseCoopers Research
Number of IPO by industry sector2007
(Total number of IPOs in 2007: 242)
6%
12%
14%
40%
28%
Number of IPO by industry sector2008
(Total number of IPOs in 2008: 157)
5%6%
12%
43%
34%
Number of IPO by industry sector2009
(Total number of IPOs in 2009: 208)
6%8%
13%
38%
35%
Funds raised by industry sector2007
(Total IPO funds raised in 2007: USD104 billion)
21%
44%
4%
10%
21%
Funds raised by industry sector2008
(Total IPO funds raised in 2008: USD23.9 billion)
25%
3%2%
44%
26%
Funds raised by industry sector2009
(Total IPO funds raised in 2009: USD59.7 billion)
8%
33%
2%
27%
30%
Energy & utilities Financials Information technology & telecommunications
Industrials Retail, consumer goods & services
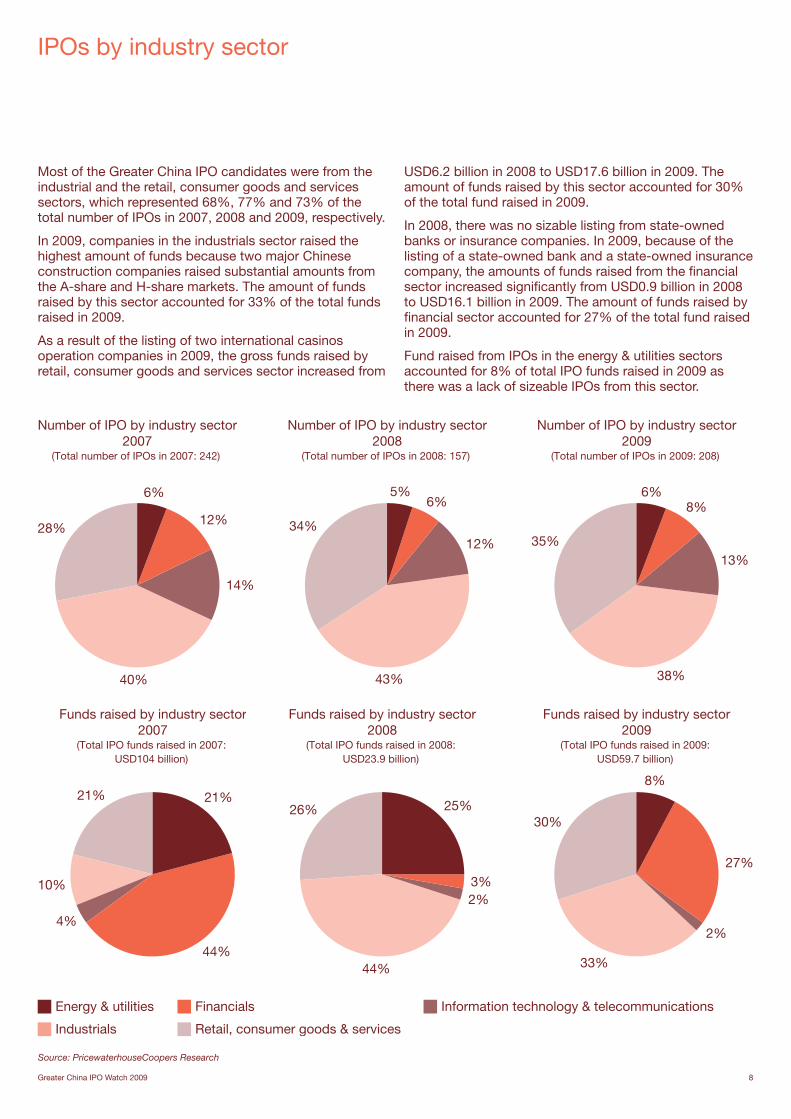
Most of the Greater China IPO candidates were from the industrial and the retail, consumer goods and services sectors, which represented 68%, 77% and 73% of the total number of IPOs in 2007, 2008 and 2009, respectively.
In 2009, companies in the industrials sector raised the highest amount of funds because two major Chinese construction companies raised substantial amounts from the A-share and H-share markets. The amount of funds raised by this sector accounted for 33% of the total funds raised in 2009.
As a result of the listing of two international casinos operation companies in 2009, the gross funds raised by retail, consumer goods and services sector increased from
USD6.2 billion in 2008 to USD17.6 billion in 2009. The amount of funds raised by this sector accounted for 30% of the total fund raised in 2009.
In 2008, there was no sizable listing from state-owned banks or insurance companies. In 2009, because of the listing of a state-owned bank and a state-owned insurance company, the amounts of funds raised from the financial sector increased significantly from USD0.9 billion in 2008 to USD16.1 billion in 2009. The amount of funds raised by financial sector accounted for 27% of the total fund raised in 2009.
Fund raised from IPOs in the energy & utilities sectors accounted for 8% of total IPO funds raised in 2009 as there was a lack of sizeable IPOs from this sector.
9 Greater China IPO Watch 2009
(Amounts in USD billion)
2007 2008 2009
Stock exchange
Number of listed
companiesTurnover
valueMarket
capitalisation
Number of listed
companiesTurnover
valueMarket
capitalisation
Number of listed
companiesTurnover
valueMarket
capitalisation
Hong Kong Main Board
1,048 2,757.4 2,633.1 1,087 2,271.2 1,323.1 1,145 1,991.1 2,291.5
Hong Kong GEM
193 20.4 20.7 174 6.7 5.8 174 9.8 13.5
Shanghai A 850 4,138.1 3,679.5 854 2,633.7 1,419.3 860 5,059.9 2,692.2
Shanghai B 54 47.6 18.4 54 9.8 5.5 54 15.6 12.5
Shenzhen A* 657 2,094.1 768.7 727 1,261.9 347.1 818 2,760.3 854.3
Shenzhen B 55 31.7 16.6 55 8.1 6.2 54 15.1 14.0
Taiwan 698 1,019.0 663.8 718 795.7 356.7 741 927.8 640.9
Total 3,555 10,108.3 7,800.8 3,669 6,987.1 3,463.7 3,846 10,779.6 6,518.9
* including Shenzhen SME Board and Shenzhen ChiNext
Source: PricewaterhouseCoopers Research
Turnover value and market capitalisation
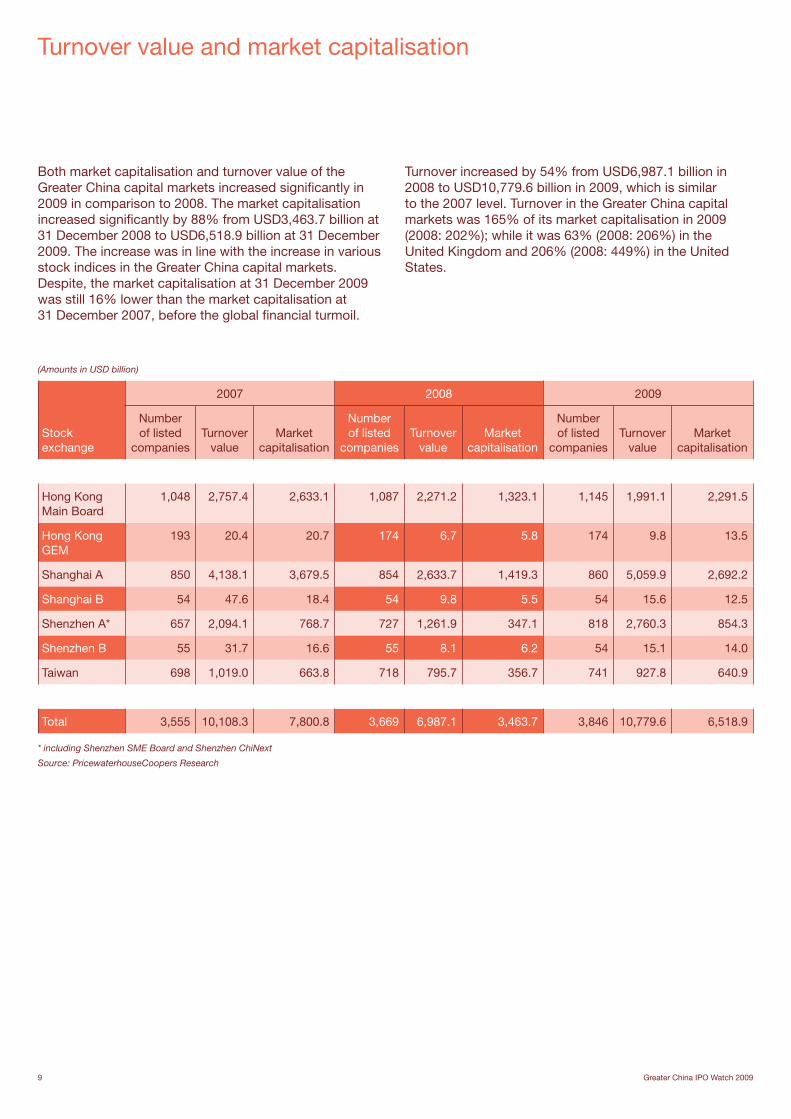
Both market capitalisation and turnover value of the Greater China capital markets increased significantly in 2009 in comparison to 2008. The market capitalisation increased significantly by 88% from USD3,463.7 billion at 31 December 2008 to USD6,518.9 billion at 31 December 2009. The increase was in line with the increase in various stock indices in the Greater China capital markets. Despite, the market capitalisation at 31 December 2009 was still 16% lower than the market capitalisation at 31 December 2007, before the global financial turmoil.
Turnover increased by 54% from USD6,987.1 billion in 2008 to USD10,779.6 billion in 2009, which is similar to the 2007 level. Turnover in the Greater China capital markets was 165% of its market capitalisation in 2009 (2008: 202%); while it was 63% (2008: 206%) in the United Kingdom and 206% (2008: 449%) in the United States.
Greater China IPO Watch 2009 10
2005 Funds Raised (USD billion)
Funds raised (USD million)
Stock exchange
China Construction Bank Corporation 9,231 Hong KongChina Shenhua Energy Co Ltd 3,287 Hong KongThe Link Real Estate Investment Trust* 2,790 Hong KongBank of Communications Co Ltd 2,171 Hong KongChina COSCO Holdings Co Ltd 1,230 Hong KongShanghai Electric Group Co Ltd 652 Hong KongDongfeng Motor Group Co Ltd 589 Hong KongFoxconn International Holdings Ltd 479 Hong KongAgile Property Holdings Ltd 467 Hong KongGuangzhou R&F Properties Co Ltd 295 Hong Kong
21,191 (83%)
2006 Company
Funds raised (USD million)
Stock exchange
Industrial and Commercial Bank of China Ltd#
22,041 Hong Kong & Shanghai
Bank of China Ltd# 11,152 Hong KongChina Merchants Bank Co Ltd 2,660 Hong KongBank of China Ltd# 2,562 ShanghaiChina Communications Construction Co Ltd
2,380 Hong Kong
China Coal Energy Co Ltd 1,944 Hong KongDaqin Railway Co Ltd 1,922 ShanghaiGuangshen Railway Co Ltd 1,324 ShanghaiShui On Land Ltd 877 Hong KongKingboard Laminates Holdings Ltd 820 Hong Kong
47,682 (77%)
2007 Company
Funds raised (USD million)
Stock exchange
PetroChina Co Ltd 9,154 ShanghaiChina Shenhua Energy Co Ltd 9,124 ShanghaiChina Construction Bank Corporation
7,955 Shanghai
Ping An Insurance (Group) Company of China Ltd
5,327 Shanghai
China CITIC Bank Corporation Ltd#
6,051 Hong Kong & Shanghai
China Pacific Insurance (Group) Co Ltd
4,111 Shanghai
China Life Insurance Co Ltd 3,881 ShanghaiBank of Communications Co Ltd 3,454 ShanghaiChina Railway Group Ltd# 3,075 ShanghaiChina Railway Group Ltd# 2,835 Hong Kong
54,968(53%)
2008 Company
Funds raised (USD million)
Stock exchange
China Coal Energy Co Ltd 3,761 ShanghaiChina Railway Construction Corporation Ltd#
3,259 Shanghai
China Railway Construction Corporation Ltd#
2,606 Hong Kong
Zijin Mining Group Co Ltd 1,462 ShanghaiJinduicheng Molybdenum Co Ltd 1,306 ShanghaiWant Want China Holdings Ltd 1,052 Hong KongChina South Locomotive & Rolling Stock Corporation Ltd#
958 Shanghai
China South Locomotive & Rolling Stock Corporation Ltd#
617 Hong Kong
SJM Holdings Ltd 497 Hong KongRenhe Commercial Holdings Company Ltd
437 Hong Kong
15,955(67%)
2009 Company
Funds raised (USD million)
Stock exchange
China State Construction Engineering Corporation Ltd
7,347 Shanghai
China Minsheng Banking Corp Ltd 4,027 Hong KongChina Pacific Insurance (Group) Co Ltd
3,575 Hong Kong
Metallurgical Corporation of China Ltd#
2,779 Shanghai
China Longyuan Power Group Corporation Ltd
2,593 Hong Kong
Sands China Ltd 2,503 Hong KongMetallurgical Corporation of China Ltd#
2,351 Hong Kong
China Shipbuilding Industry Company Limited
2,157 Shanghai
China CNR Corporation Limited 2,036 ShanghaiWynn Macau Ltd 1,869 Hong Kong
31,237(52%)
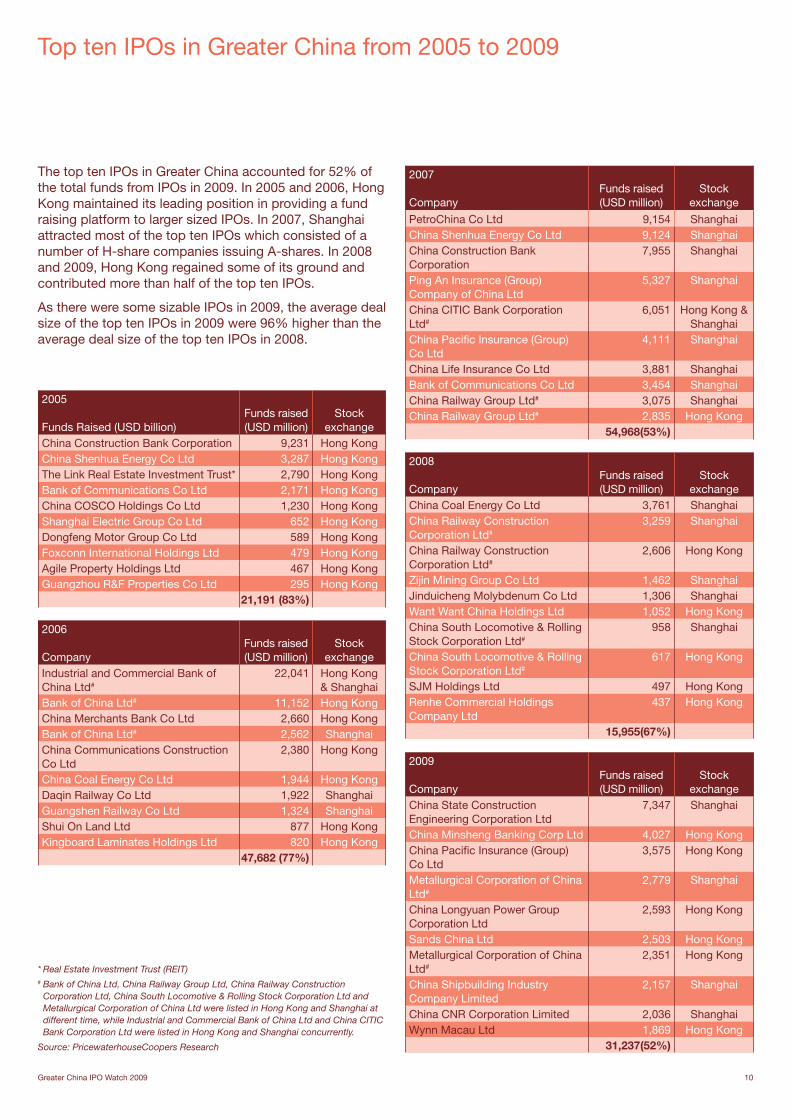
Top ten IPOs in Greater China from 2005 to 2009
* Real Estate Investment Trust (REIT)# Bank of China Ltd, China Railway Group Ltd, China Railway Construction
Corporation Ltd, China South Locomotive & Rolling Stock Corporation Ltd and Metallurgical Corporation of China Ltd were listed in Hong Kong and Shanghai at different time, while Industrial and Commercial Bank of China Ltd and China CITIC Bank Corporation Ltd were listed in Hong Kong and Shanghai concurrently.
Source: PricewaterhouseCoopers Research
The top ten IPOs in Greater China accounted for 52% of the total funds from IPOs in 2009. In 2005 and 2006, Hong Kong maintained its leading position in providing a fund raising platform to larger sized IPOs. In 2007, Shanghai attracted most of the top ten IPOs which consisted of a number of H-share companies issuing A-shares. In 2008 and 2009, Hong Kong regained some of its ground and contributed more than half of the top ten IPOs.
As there were some sizable IPOs in 2009, the average deal size of the top ten IPOs in 2009 were 96% higher than the average deal size of the top ten IPOs in 2008.
11 Greater China IPO Watch 2009
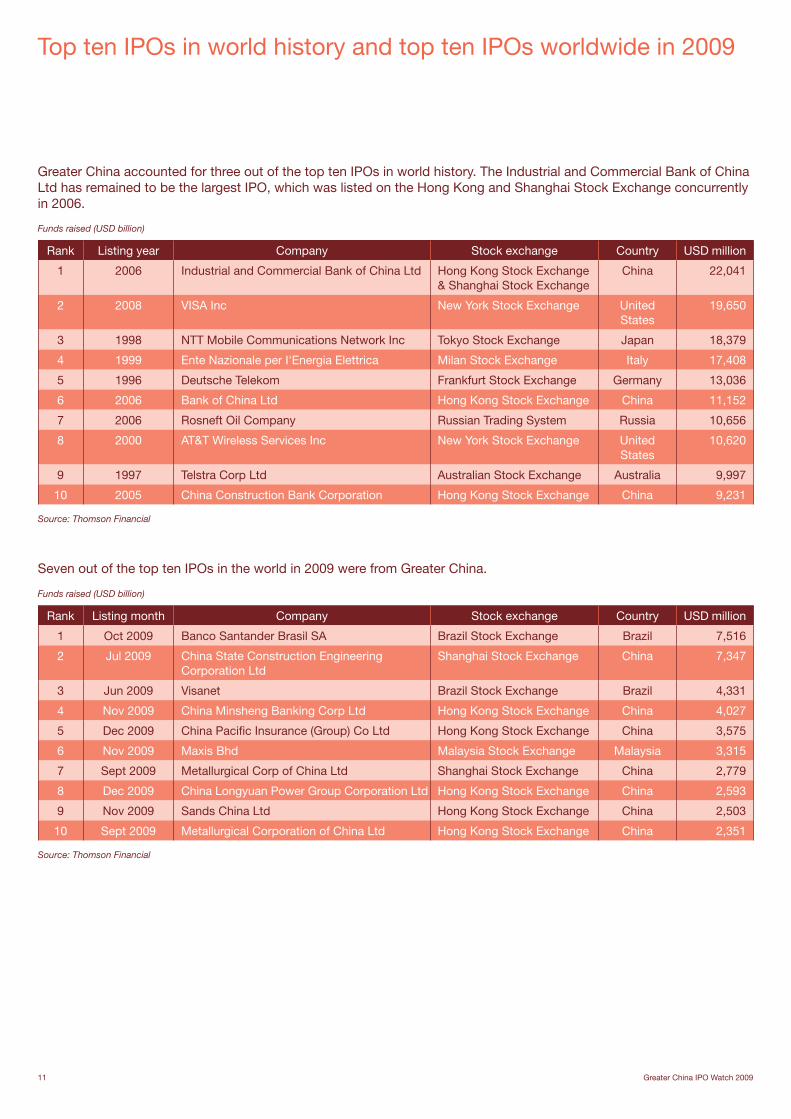
Greater China accounted for three out of the top ten IPOs in world history. The Industrial and Commercial Bank of China Ltd has remained to be the largest IPO, which was listed on the Hong Kong and Shanghai Stock Exchange concurrently in 2006.
Funds raised (USD billion)
Rank Listing year Company Stock exchange Country USD million
1 2006 Industrial and Commercial Bank of China Ltd Hong Kong Stock Exchange & Shanghai Stock Exchange
China 22,041
2 2008 VISA Inc New York Stock Exchange United States
19,650
3 1998 NTT Mobile Communications Network Inc Tokyo Stock Exchange Japan 18,379
4 1999 Ente Nazionale per I'Energia Elettrica Milan Stock Exchange Italy 17,408
5 1996 Deutsche Telekom Frankfurt Stock Exchange Germany 13,036
6 2006 Bank of China Ltd Hong Kong Stock Exchange China 11,152
7 2006 Rosneft Oil Company Russian Trading System Russia 10,656
8 2000 AT&T Wireless Services Inc New York Stock Exchange United States
10,620
9 1997 Telstra Corp Ltd Australian Stock Exchange Australia 9,997
10 2005 China Construction Bank Corporation Hong Kong Stock Exchange China 9,231
Source: Thomson Financial
Seven out of the top ten IPOs in the world in 2009 were from Greater China.
Funds raised (USD billion)
Rank Listing month Company Stock exchange Country USD million
1 Oct 2009 Banco Santander Brasil SA Brazil Stock Exchange Brazil 7,516
2 Jul 2009 China State Construction Engineering Corporation Ltd
Shanghai Stock Exchange China 7,347
3 Jun 2009 Visanet Brazil Stock Exchange Brazil 4,331
4 Nov 2009 China Minsheng Banking Corp Ltd Hong Kong Stock Exchange China 4,027
5 Dec 2009 China Pacific Insurance (Group) Co Ltd Hong Kong Stock Exchange China 3,575
6 Nov 2009 Maxis Bhd Malaysia Stock Exchange Malaysia 3,315
7 Sept 2009 Metallurgical Corp of China Ltd Shanghai Stock Exchange China 2,779
8 Dec 2009 China Longyuan Power Group Corporation Ltd Hong Kong Stock Exchange China 2,593
9 Nov 2009 Sands China Ltd Hong Kong Stock Exchange China 2,503
10 Sept 2009 Metallurgical Corporation of China Ltd Hong Kong Stock Exchange China 2,351
Source: Thomson Financial
Top ten IPOs in world history and top ten IPOs worldwide in 2009
Greater China IPO Watch 2009 12
(Amounts in USD billion)
2007 2008 2009
Stock exchangeNumber of
IPOsFunds raised
Average deal size
Number of IPOs
Funds raised
Average deal size
Number of IPOs
Funds raised
Average deal size
Hong Kong 86 38.0 49 8.5 73 32.0
Shanghai 25 60.0 6 10.8 9 18.3
Shenzhen 101 5.4 71 4.4 90 9.2
Taiwan 30 0.6 31 0.2 36 0.2
Greater China total 242 104.0 0.43 157 23.9 0.15 208 59.7 0.29
NASDAQ 154 20.4 26 3.0 33 7.7
NYSE 142 44.7 31 26.4 36 17.5
NASDAQ + NYSE total
296 65.1 0.22 57 29.4 0.52 69 25.2 0.37
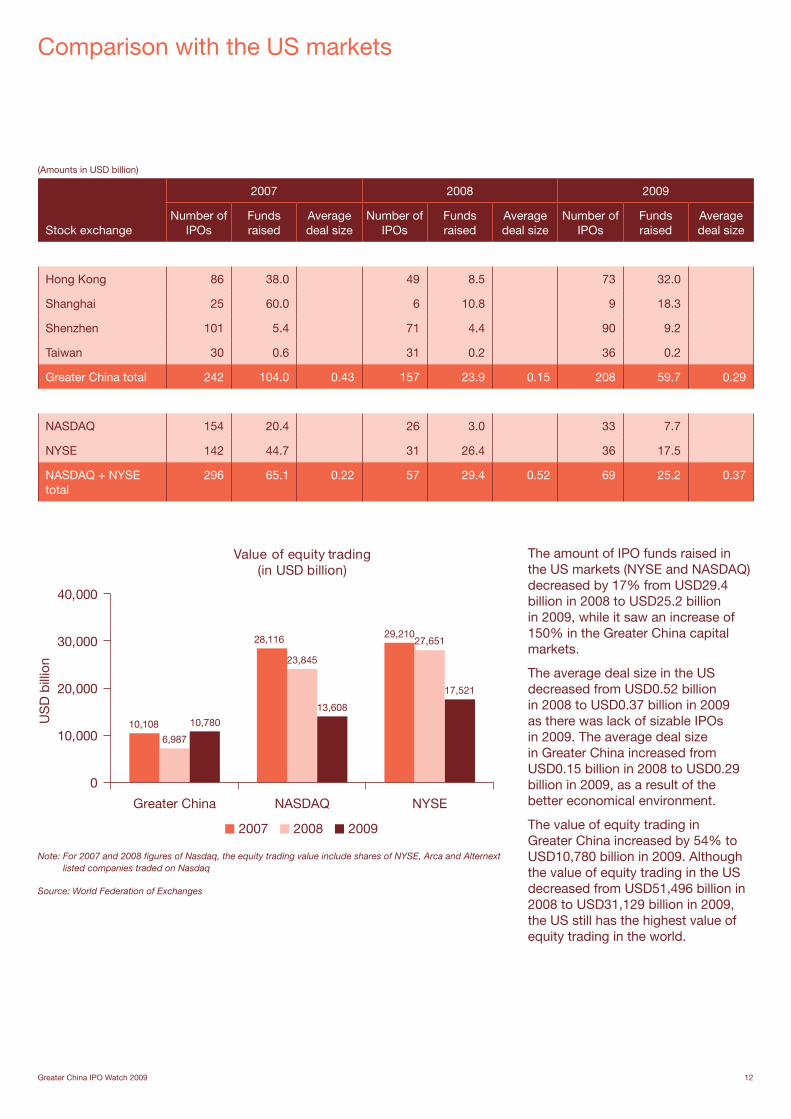
Comparison with the US markets
10,108
28,116 29,210
6,987
23,845
27,651
10,780
13,608
17,521
0
10,000
20,000
30,000
40,000
Value of equity trading(in USD billion)
Greater China NASDAQ NYSE
US
D b
illio
n
2007 2008 2009
The amount of IPO funds raised in the US markets (NYSE and NASDAQ) decreased by 17% from USD29.4 billion in 2008 to USD25.2 billion in 2009, while it saw an increase of 150% in the Greater China capital markets.
The average deal size in the US decreased from USD0.52 billion in 2008 to USD0.37 billion in 2009 as there was lack of sizable IPOs in 2009. The average deal size in Greater China increased from USD0.15 billion in 2008 to USD0.29 billion in 2009, as a result of the better economical environment.
The value of equity trading in Greater China increased by 54% to USD10,780 billion in 2009. Although the value of equity trading in the US decreased from USD51,496 billion in 2008 to USD31,129 billion in 2009, the US still has the highest value of equity trading in the world.
Note: For 2007 and 2008 figures of Nasdaq, the equity trading value include shares of NYSE, Arca and Alternext listed companies traded on Nasdaq
Source: World Federation of Exchanges
13 Greater China IPO Watch 2009
(Amounts in USD billion)
2007 2008 2009
Stock exchangeNumber of
IPOsFunds raised
Average deal size
Number of IPOs
Funds raised
Average deal size
Number of IPOs
Funds raised
Average deal size
Hong Kong 86 38.0 49 8.5 73 32.0
Shanghai 25 60.0 6 10.8 9 18.3
Shenzhen 101 5.4 71 4.4 90 9.2
Taiwan 30 0.6 31 0.2 36 0.2
Greater China total 242 104.0 0.43 157 23.9 0.15 208 59.7 0.29
London (Main Board) 99 40.3 38 10.0 9 0.9
London (AIM) 220 13.9 58 2.0 14 1.0
London (SFM + PSM) 5 2.8 3 0.4 2 0.5
London total 324 57.0 0.18 99 12.4 0.13 25 2.4 0.10
Europe total 819 117.4 0.14 295 19.5 0.07 126 10.2 0.08
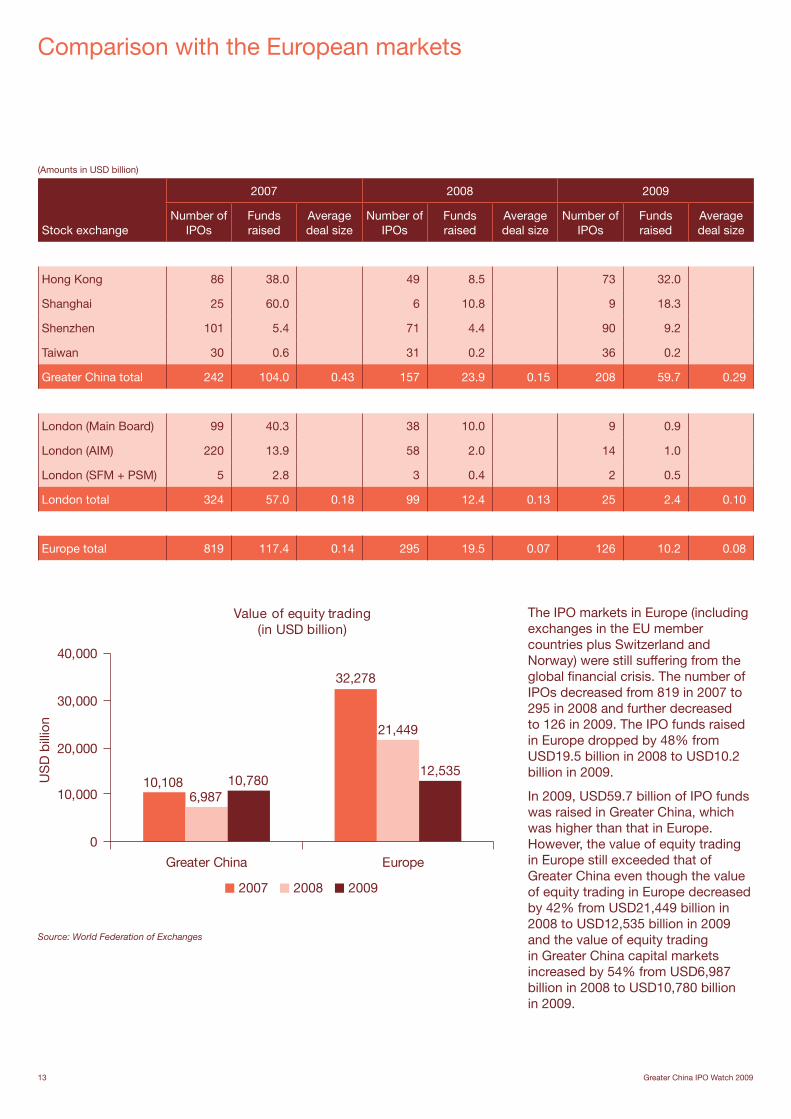
Comparison with the European markets
21,449
32,278
10,1086,987
12,53510,780
0
10,000
20,000
30,000
40,000
2007 2008 2009
Greater China Europe
Value of equity trading(in USD billion)
US
D b
illio
n
The IPO markets in Europe (including exchanges in the EU member countries plus Switzerland and Norway) were still suffering from the global financial crisis. The number of IPOs decreased from 819 in 2007 to 295 in 2008 and further decreased to 126 in 2009. The IPO funds raised in Europe dropped by 48% from USD19.5 billion in 2008 to USD10.2 billion in 2009.
In 2009, USD59.7 billion of IPO funds was raised in Greater China, which was higher than that in Europe. However, the value of equity trading in Europe still exceeded that of Greater China even though the value of equity trading in Europe decreased by 42% from USD21,449 billion in 2008 to USD12,535 billion in 2009 and the value of equity trading in Greater China capital markets increased by 54% from USD6,987 billion in 2008 to USD10,780 billion in 2009.
Source: World Federation of Exchanges
Greater China IPO Watch 2009 14
(Amounts in USD billion)
2007 2008 2009
Stock exchangeNumber of
IPOsFunds raised
Average deal size
Number of IPOs
Funds raised
Average deal size
Number of IPOs
Funds raised
Average deal size
Hong Kong 86 38.0 49 8.5 73 32.0
Shanghai 25 60.0 6 10.8 9 18.3
Shenzhen 101 5.4 71 4.4 90 9.2
Taiwan 30 0.6 31 0.2 36 0.2
Greater China total 242 104.0 0.43 157 23.9 0.15 208 59.7 0.29
Tokyo Stock Exchange (Main board)
13 2.9 7 0.5 6 0.2
Osaka Stock Exchange (Main board)
- - - - - -
JASDAQ 49 0.7 18 0.7 8 0.2
Mothers 23 0.5 12 0.2 4 0.2
Hercules 25 0.3 9 0.1 1 0.0
Others 11 0.1 3 0.0 - -
Japan total 121 4.5 0.04 49 1.5 0.03 19 0.6 0.03
Main Board 53 5.7 23 1.2 9 2.2
Catalist & its predecessor - SESDAQ
8 0.0 7 0.1 14 0.1
Singapore total 61 5.7 0.09 30 1.3 0.04 23 2.3 0.10
Comparison with major Asian markets
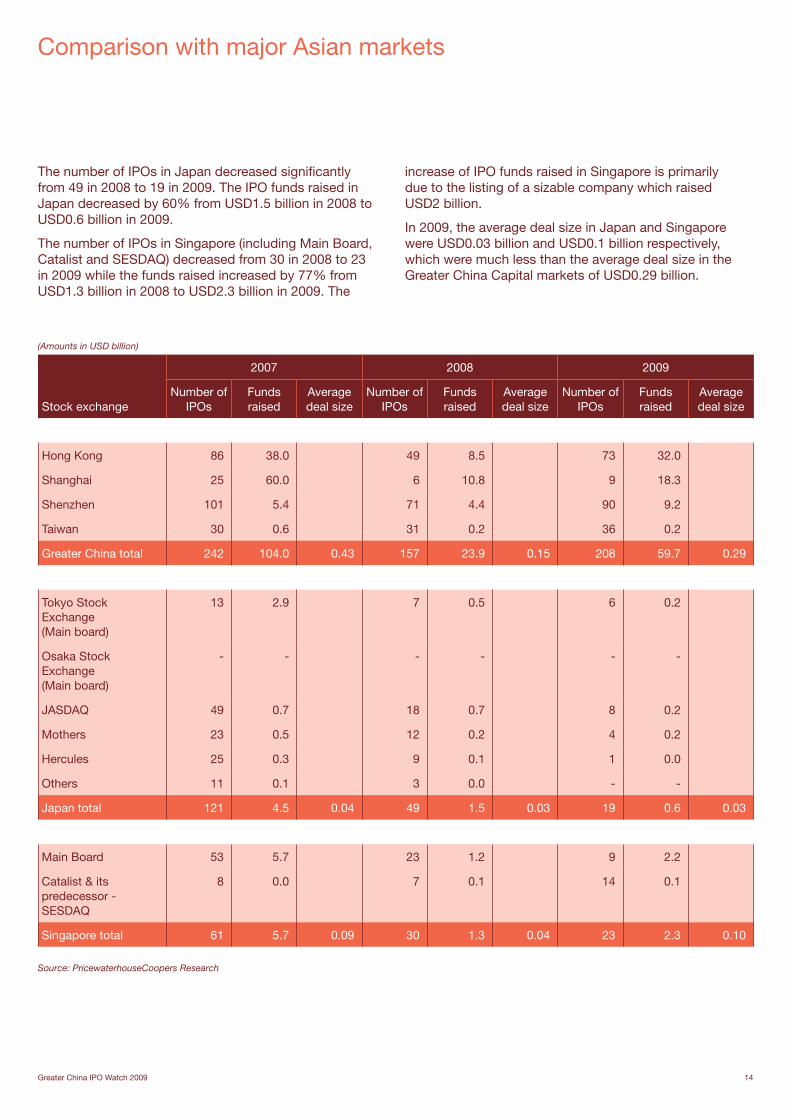
The number of IPOs in Japan decreased significantly from 49 in 2008 to 19 in 2009. The IPO funds raised in Japan decreased by 60% from USD1.5 billion in 2008 to USD0.6 billion in 2009.
The number of IPOs in Singapore (including Main Board, Catalist and SESDAQ) decreased from 30 in 2008 to 23 in 2009 while the funds raised increased by 77% from USD1.3 billion in 2008 to USD2.3 billion in 2009. The
increase of IPO funds raised in Singapore is primarily due to the listing of a sizable company which raised USD2 billion.
In 2009, the average deal size in Japan and Singapore were USD0.03 billion and USD0.1 billion respectively, which were much less than the average deal size in the Greater China Capital markets of USD0.29 billion.
Source: PricewaterhouseCoopers Research
15 Greater China IPO Watch 2009
Comparison of market capitalisation with GDP
(Amounts in USD billion)
2007 2008 2009
Funds raised (USD billion) Country/Region
Market Cap GDP
Market Cap to
GDP (%)Market
Cap GDP
Market Cap to
GDP (%)Market
Cap GDP
Market Cap to
GDP (%)
Hong Kong Hong Kong 2,654 207 1282% 1,329 217 612% 2,305 211 1092%
Shanghai China 3,698 3,420 108% 1,425 4,405 32% 2,705 4,912 55%
Shenzhen China 785 3,420 23% 353 4,405 8% 868 4,912 18%
Taiwan Taiwan 664 383 173% 357 392 91% 641 379 169%
Greater China total
Greater China 7,801 4,010 195% 3,464 5,014 69% 6,519 5,502 118%
NYSE United States 15,651 13,843 113% 9,209 14,265 65% 11,838 14,258 83%
NASDAQ United States 4,014 13,843 29% 2,249 14,265 16% 3,239 14,258 23%
NYSE + NASDAQ total
United States 19,665 13,843 142% 11,458 14,265 80% 15,077 14,258 106%
London United Kingdom 3,852 2,749 140% 1,868 2,340 80% 2,796 2,255 124%
Source: National Bureau of Statistics of China, Census and Statistics Department of HKSAR, National Statistics Republic of China (Taiwan), US Department of Commerce — Bureau of Economic Analysis, UK National Statistics Online, World Federation of Exchanges.
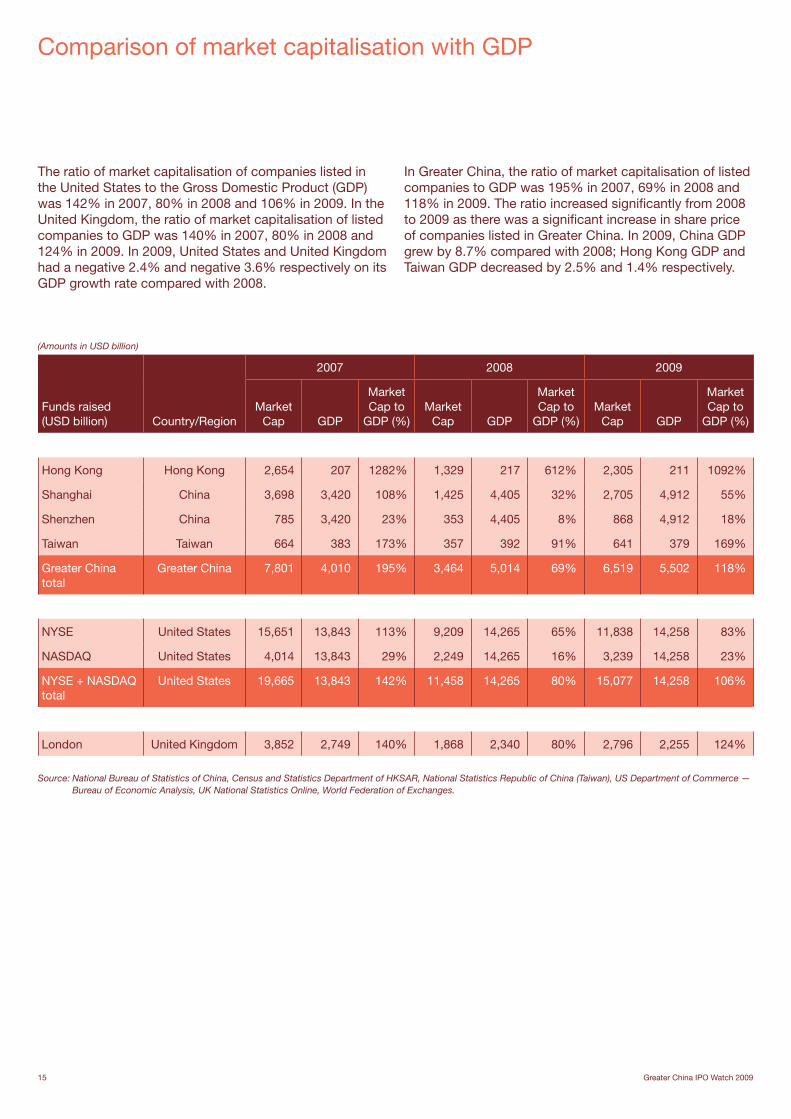
The ratio of market capitalisation of companies listed in the United States to the Gross Domestic Product (GDP) was 142% in 2007, 80% in 2008 and 106% in 2009. In the United Kingdom, the ratio of market capitalisation of listed companies to GDP was 140% in 2007, 80% in 2008 and 124% in 2009. In 2009, United States and United Kingdom had a negative 2.4% and negative 3.6% respectively on its GDP growth rate compared with 2008.
In Greater China, the ratio of market capitalisation of listed companies to GDP was 195% in 2007, 69% in 2008 and 118% in 2009. The ratio increased significantly from 2008 to 2009 as there was a significant increase in share price of companies listed in Greater China. In 2009, China GDP grew by 8.7% compared with 2008; Hong Kong GDP and Taiwan GDP decreased by 2.5% and 1.4% respectively.
Greater China IPO Watch 2009 16
Capital Market Services Group
Capital Market Services Group is part of the Assurance practice of PricewaterhouseCoopers. It is comprised of a core team of specialists who provide a broad range of services to companies and/or investment banks in connection with all aspects of capital market transactions. These include preparation for becoming a public listed company, selecting the right market and advisory team, advising on group restructuring, accounting and regulatory issues and acting as reporting accountants.
The China/Hong Kong Capital Market Services Group is part of the PricewaterhouseCoopers global network of capital markets specialists.
China/Hong Kong Capital Market Services Group Partners and Directors:
Kennedy Liu +852 2289 1881 [email protected]
Edmond Chan +852 2289 1128 [email protected]
Rebecca Chan +852 2289 1287 [email protected]
Rayon Chu +852 2289 1531 [email protected]
Rita Chan +852 2289 2327 [email protected]
Charles Feng +86 (10) 6533 2399 [email protected]
Pauline Leung +852 2289 1809 [email protected]
Xuemei Li +86 (10) 6533 5179 [email protected]
Thomas Lo +86 (10) 6533 2223 [email protected]
About PricewaterhouseCoopers
PricewaterhouseCoopers (www.pwc.com) provides industry-focused assurance, tax and advisory services to build public trust and enhance value for its clients and their stakeholders. More than 163,000 people in 151 countries across our network share their thinking, experience and solutions to develop fresh perspectives and practical advice.
PricewaterhouseCoopers China, Hong Kong and Singapore operate on a combined basis, subject to local applicable laws. Taken together, we have more than 470 partners and a strength of 13,000 people.
The firm provides a wide range of services to help organisations solve business issues, identify and maximise opportunities. Our industry specialisation enables us to identify trends and customise solutions for your sector of interest. Each line of service is staffed with highly qualified, experienced professionals and leaders in our profession. These resources, combined with our global network, allow us to provide the support you need wherever you may be located.
We are located in these cities: Beijing, Hong Kong, Shanghai, Singapore, Chongqing, Dalian, Guangzhou, Macau, Ningbo, Qingdao, Shenzhen, Suzhou, Tianjin, Xiamen and Xi’ an.
“PricewaterhouseCoopers” refers to the network of member firms of PricewaterhouseCoopers International Limited, each of which is a separate and independent legal entity.
For more information visit: www.pwchk.com
For further copies of this publication please contact the PricewaterhouseCoopers Marketing and Communications Department in Hong Kong on +852 2289 8705.

pwchk.compwccn.com This publication has been prepared by PricewaterhouseCoopers for general guidance on matters of interest only, and is not intended to provide specific advice on any matter, nor is it intended to be comprehensive. No representation or warranty (express or implied) is given as to the accuracy or completeness of the information contained in this publication, and, to the extent permitted by law, PricewaterhouseCoopers firms do not accept or assume any liability, responsibility or duty of care for any consequences of you or anyone else acting, or refraining to act, in reliance on the information contained in this publication or for any decision based on it. If specific advice is required, or if you wish to receive further information on any matters referred to in this publication, please speak with your usual contact at PricewaterhouseCoopers or those listed in this publication.
© 2010 PricewaterhouseCoopers. All rights reserved. “PricewaterhouseCoopers” and “PwC” refer to the network of member firms of PricewaterhouseCoopers International Limited (“PwCIL”). Each member firm is a separate legal entity and does not act as agent of PwCIL or any other member firm. PwCIL does not provide any services to clients. PwCIL is not responsible or liable for the acts or omissions of any of its member firms nor can it control the exercise of their professional judgment or bind them in any way. No member firm is responsible or liable for the acts or omissions of any other member firm nor can it control the exercise of another member firm’s professional judgment or bind another member firm or PwCIL in any way.
This is printed on 9lives 55 which is made with an elemental chlorine free process. It has 55% recycled fibre and 45% fibre from well-managed forestry. 9lives 55 is ISO 14001 certified.