ipc2010- ipc2010-31372 ,3& - harry bhadeshia · pdf filex65 linepipe steel in order to...
TRANSCRIPT
1 Copyright © 2010 by ASME
ArcelorMittal Global R&D Ghent Zelzate, Belgium
Materials Science and Metallurgy,
University of Cambridge, UK
ArcelorMittal Global R&D Ghent Zelzate, Belgium
ArcelorMittal Global R&D Ghent Zelzate, Belgium
Materials Science and Metallurgy,
University of Cambridge, UK
ArcelorMittal Commercial FCE Fos-sur-Mer, France
In the present paper, investigations performed on ArcelorMittal X65 linepipe steel in order to understand the effects of high frequency induction (HFI) welding process and in-line post-weld heat treatment on weld properties are described. The factors that potentially can affect weld toughness, such as microstructure, grain size, precipitates, hardness, inclusions, and texture, are evaluated and discussed systematically in order to correlate weld microstructure with toughness of the HFI welded pipes.
High frequency induction is one of the welding processes currently used in the production of longitudinally welded pipes for gas transmission. The process is attractive to pipe manufacturers due to its advantages over submerged arc welding, such as high productivity, lack of consumables and narrower weld zone. However, the final characteristics of HFI welds are significantly different from those of the arc welds and require an in-line post-weld heat treatment (PWHT), and special attention to achieve acceptable toughness level in the welds [1-2]. Previous studies [3-5] were focused on HFI welded pipes of AM X65HIC steel (resistance to hydrogen induced cracking (HIC) suitable for sour service applications) in order to understand the effects of the welding process and the in-line post-weld heat treatment on weld microstructure and toughness. The coarse crystallographic grain size at the junction of the welds was found to be one of the main reasons for the low toughness.
In our latest study, investigations into the microstructure – toughness relation were performed on HFI welded (non-HIC) X65 pipes with a diameter of 24”and the findings are described here.
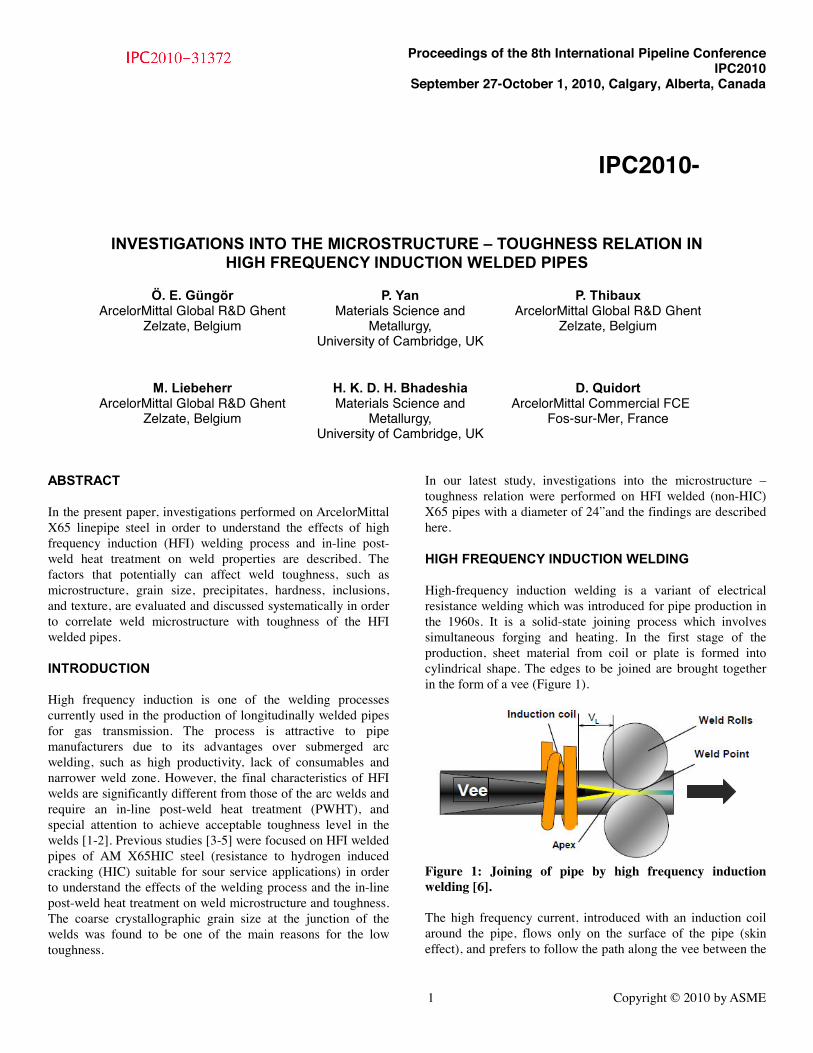
High-frequency induction welding is a variant of electrical resistance welding which was introduced for pipe production in the 1960s. It is a solid-state joining process which involves simultaneous forging and heating. In the first stage of the production, sheet material from coil or plate is formed into cylindrical shape. The edges to be joined are brought together in the form of a vee (Figure 1).
Figure 1: Joining of pipe by high frequency induction welding [6]. The high frequency current, introduced with an induction coil around the pipe, flows only on the surface of the pipe (skin effect), and prefers to follow the path along the vee between the
Proceedings of the 8th International Pipeline Conference IPC2010
September 27-October 1, 2010, Calgary, Alberta, Canada
IPC2010-
2 Copyright © 2010 by ASME
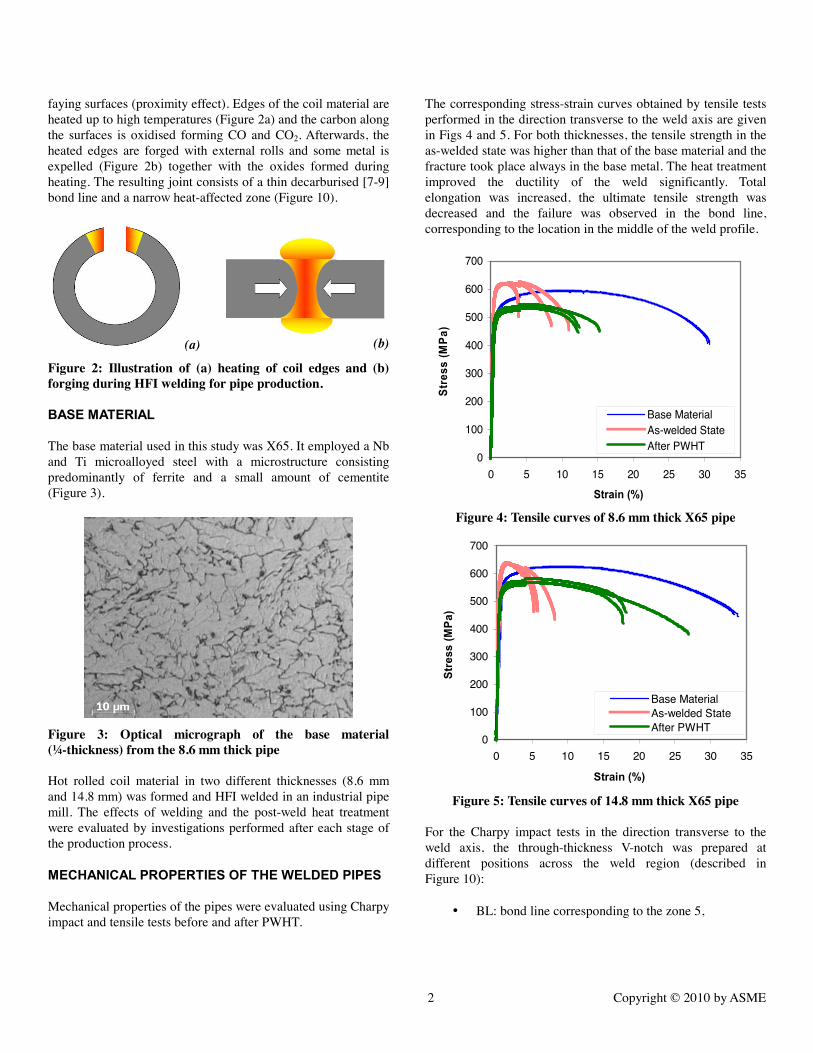
faying surfaces (proximity effect). Edges of the coil material are heated up to high temperatures (Figure 2a) and the carbon along the surfaces is oxidised forming CO and CO2. Afterwards, the heated edges are forged with external rolls and some metal is expelled (Figure 2b) together with the oxides formed during heating. The resulting joint consists of a thin decarburised [7-9] bond line and a narrow heat-affected zone (Figure 10).
(a)
(b)
Figure 2: Illustration of (a) heating of coil edges and (b) forging during HFI welding for pipe production.
The base material used in this study was X65. It employed a Nb and Ti microalloyed steel with a microstructure consisting predominantly of ferrite and a small amount of cementite (Figure 3).
Figure 3: Optical micrograph of the base material (¼-thickness) from the 8.6 mm thick pipe Hot rolled coil material in two different thicknesses (8.6 mm and 14.8 mm) was formed and HFI welded in an industrial pipe mill. The effects of welding and the post-weld heat treatment were evaluated by investigations performed after each stage of the production process.
Mechanical properties of the pipes were evaluated using Charpy impact and tensile tests before and after PWHT.
The corresponding stress-strain curves obtained by tensile tests performed in the direction transverse to the weld axis are given in Figs 4 and 5. For both thicknesses, the tensile strength in the as-welded state was higher than that of the base material and the fracture took place always in the base metal. The heat treatment improved the ductility of the weld significantly. Total elongation was increased, the ultimate tensile strength was decreased and the failure was observed in the bond line, corresponding to the location in the middle of the weld profile.
0
100
200
300
400
500
600
700
0 5 10 15 20 25 30 35
Base MaterialAs-welded StateAfter PWHT
Figure 4: Tensile curves of 8.6 mm thick X65 pipe
0
100
200
300
400
500
600
700
0 5 10 15 20 25 30 35
Base MaterialAs-welded StateAfter PWHT
Figure 5: Tensile curves of 14.8 mm thick X65 pipe
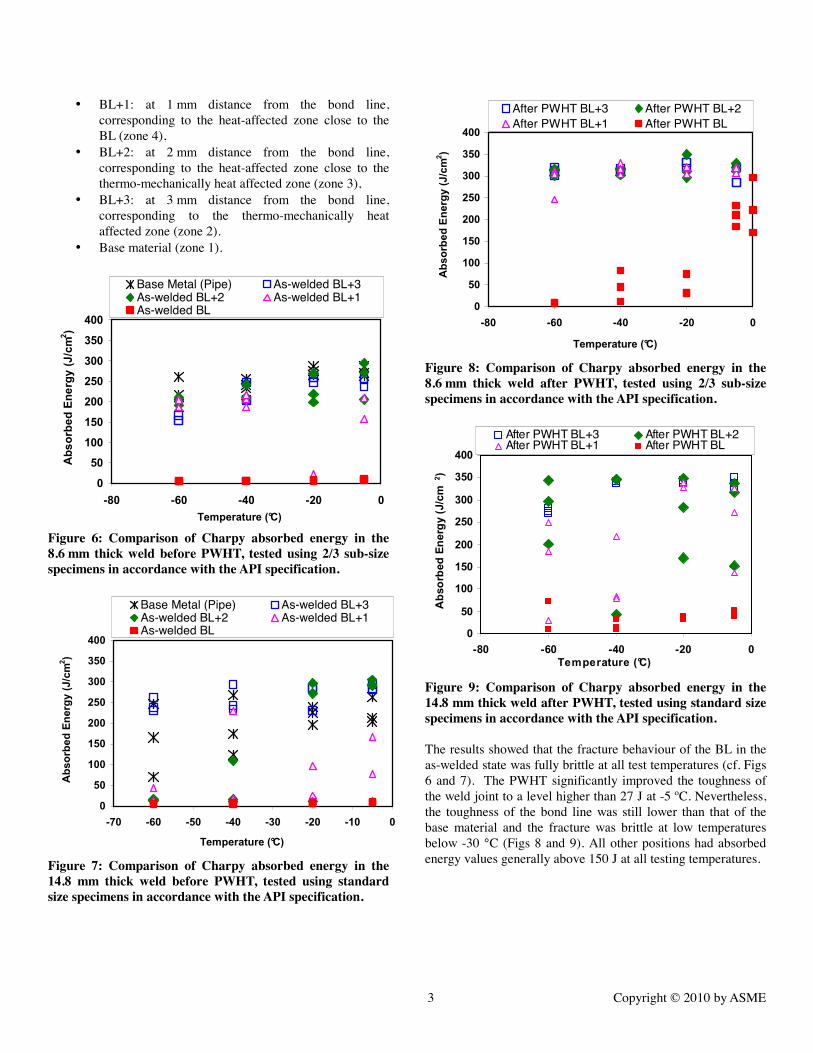
For the Charpy impact tests in the direction transverse to the weld axis, the through-thickness V-notch was prepared at different positions across the weld region (described in Figure 10):
• BL: bond line corresponding to the zone 5,
3 Copyright © 2010 by ASME
• BL+1: at 1 mm distance from the bond line, corresponding to the heat-affected zone close to the BL (zone 4),
• BL+2: at 2 mm distance from the bond line, corresponding to the heat-affected zone close to the thermo-mechanically heat affected zone (zone 3),
• BL+3: at 3 mm distance from the bond line, corresponding to the thermo-mechanically heat affected zone (zone 2).
• Base material (zone 1).
Base Metal (Pipe) As-welded BL+3As-welded BL+2 As-welded BL+1As-welded BL
Figure 6: Comparison of Charpy absorbed energy in the 8.6 mm thick weld before PWHT, tested using 2/3 sub-size specimens in accordance with the API specification.
Base Metal (Pipe) As-welded BL+3As-welded BL+2 As-welded BL+1As-welded BL
Figure 7: Comparison of Charpy absorbed energy in the 14.8 mm thick weld before PWHT, tested using standard size specimens in accordance with the API specification.
After PWHT BL+3 After PWHT BL+2After PWHT BL+1 After PWHT BL
Figure 8: Comparison of Charpy absorbed energy in the 8.6 mm thick weld after PWHT, tested using 2/3 sub-size specimens in accordance with the API specification.
After PWHT BL+3 After PWHT BL+2After PWHT BL+1 After PWHT BL
Figure 9: Comparison of Charpy absorbed energy in the 14.8 mm thick weld after PWHT, tested using standard size specimens in accordance with the API specification. The results showed that the fracture behaviour of the BL in the as-welded state was fully brittle at all test temperatures (cf. Figs 6 and 7). The PWHT significantly improved the toughness of the weld joint to a level higher than 27 J at -5 ºC. Nevertheless, the toughness of the bond line was still lower than that of the base material and the fracture was brittle at low temperatures below -30 °C (Figs 8 and 9). All other positions had absorbed energy values generally above 150 J at all testing temperatures.
4 Copyright © 2010 by ASME
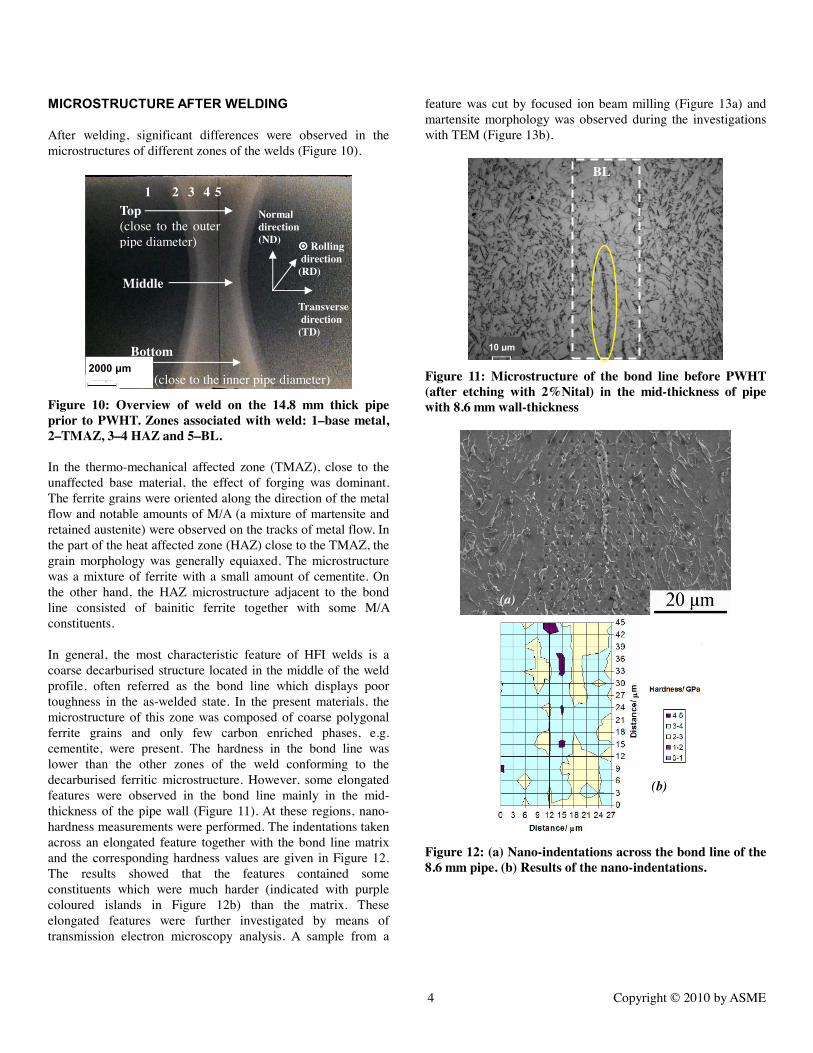
After welding, significant differences were observed in the microstructures of different zones of the welds (Figure 10).
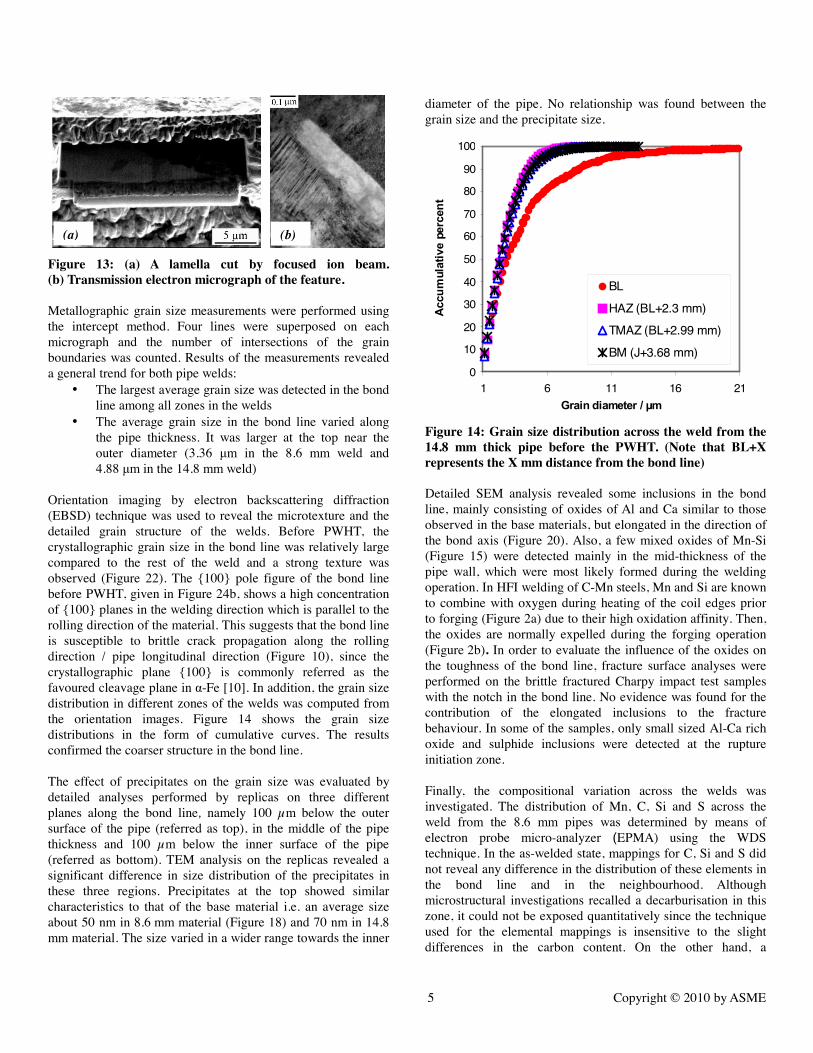
Figure 10: Overview of weld on the 14.8 mm thick pipe prior to PWHT. Zones associated with weld: 1–base metal, 2–TMAZ, 3–4 HAZ and 5–BL. In the thermo-mechanical affected zone (TMAZ), close to the unaffected base material, the effect of forging was dominant. The ferrite grains were oriented along the direction of the metal flow and notable amounts of M/A (a mixture of martensite and retained austenite) were observed on the tracks of metal flow. In the part of the heat affected zone (HAZ) close to the TMAZ, the grain morphology was generally equiaxed. The microstructure was a mixture of ferrite with a small amount of cementite. On the other hand, the HAZ microstructure adjacent to the bond line consisted of bainitic ferrite together with some M/A constituents. In general, the most characteristic feature of HFI welds is a coarse decarburised structure located in the middle of the weld profile, often referred as the bond line which displays poor toughness in the as-welded state. In the present materials, the microstructure of this zone was composed of coarse polygonal ferrite grains and only few carbon enriched phases, e.g. cementite, were present. The hardness in the bond line was lower than the other zones of the weld conforming to the decarburised ferritic microstructure. However, some elongated features were observed in the bond line mainly in the mid-thickness of the pipe wall (Figure 11). At these regions, nano-hardness measurements were performed. The indentations taken across an elongated feature together with the bond line matrix and the corresponding hardness values are given in Figure 12. The results showed that the features contained some constituents which were much harder (indicated with purple coloured islands in Figure 12b) than the matrix. These elongated features were further investigated by means of transmission electron microscopy analysis. A sample from a
feature was cut by focused ion beam milling (Figure 13a) and martensite morphology was observed during the investigations with TEM (Figure 13b).
Figure 11: Microstructure of the bond line before PWHT (after etching with 2%Nital) in the mid-thickness of pipe with 8.6 mm wall-thickness
Figure 12: (a) Nano-indentations across the bond line of the 8.6 mm pipe. (b) Results of the nano-indentations.
1 2 3 4
Normal direction (ND)
Transverse direction (TD)
Rolling direction (RD)
Top (close to the outer pipe diameter)
Bottom (close to the inner pipe diameter)
Middle
5 BL
(a)
(b)
5 Copyright © 2010 by ASME
Figure 13: (a) A lamella cut by focused ion beam. (b) Transmission electron micrograph of the feature. Metallographic grain size measurements were performed using the intercept method. Four lines were superposed on each micrograph and the number of intersections of the grain boundaries was counted. Results of the measurements revealed a general trend for both pipe welds:
• The largest average grain size was detected in the bond line among all zones in the welds
• The average grain size in the bond line varied along the pipe thickness. It was larger at the top near the outer diameter (3.36 m in the 8.6 mm weld and 4.88 m in the 14.8 mm weld)
Orientation imaging by electron backscattering diffraction (EBSD) technique was used to reveal the microtexture and the detailed grain structure of the welds. Before PWHT, the crystallographic grain size in the bond line was relatively large compared to the rest of the weld and a strong texture was observed (Figure 22). The {100} pole figure of the bond line before PWHT, given in Figure 24b, shows a high concentration of {100} planes in the welding direction which is parallel to the rolling direction of the material. This suggests that the bond line is susceptible to brittle crack propagation along the rolling direction / pipe longitudinal direction (Figure 10), since the crystallographic plane {100} is commonly referred as the favoured cleavage plane in -Fe [10]. In addition, the grain size distribution in different zones of the welds was computed from the orientation images. Figure 14 shows the grain size distributions in the form of cumulative curves. The results confirmed the coarser structure in the bond line. The effect of precipitates on the grain size was evaluated by detailed analyses performed by replicas on three different planes along the bond line, namely 100 µm below the outer surface of the pipe (referred as top), in the middle of the pipe thickness and 100 µm below the inner surface of the pipe (referred as bottom). TEM analysis on the replicas revealed a significant difference in size distribution of the precipitates in these three regions. Precipitates at the top showed similar characteristics to that of the base material i.e. an average size about 50 nm in 8.6 mm material (Figure 18) and 70 nm in 14.8 mm material. The size varied in a wider range towards the inner
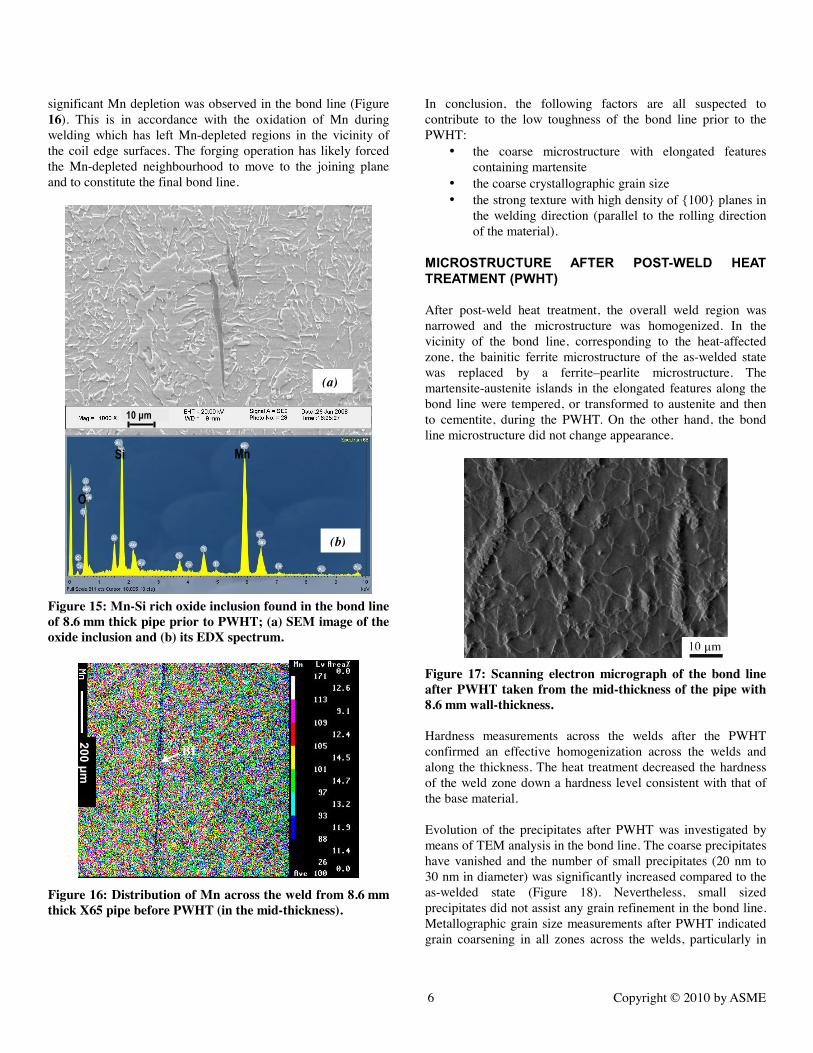
diameter of the pipe. No relationship was found between the grain size and the precipitate size.
0
10
20
30
40
50
60
70
80
90
100
1 6 11 16 21
BL
HAZ (BL+2.3 mm)TMAZ (BL+2.99 mm)
BM (J+3.68 mm)
Figure 14: Grain size distribution across the weld from the 14.8 mm thick pipe before the PWHT. (Note that BL+X represents the X mm distance from the bond line) Detailed SEM analysis revealed some inclusions in the bond line, mainly consisting of oxides of Al and Ca similar to those observed in the base materials, but elongated in the direction of the bond axis (Figure 20). Also, a few mixed oxides of Mn-Si (Figure 15) were detected mainly in the mid-thickness of the pipe wall, which were most likely formed during the welding operation. In HFI welding of C-Mn steels, Mn and Si are known to combine with oxygen during heating of the coil edges prior to forging (Figure 2a) due to their high oxidation affinity. Then, the oxides are normally expelled during the forging operation (Figure 2b). In order to evaluate the influence of the oxides on the toughness of the bond line, fracture surface analyses were performed on the brittle fractured Charpy impact test samples with the notch in the bond line. No evidence was found for the contribution of the elongated inclusions to the fracture behaviour. In some of the samples, only small sized Al-Ca rich oxide and sulphide inclusions were detected at the rupture initiation zone. Finally, the compositional variation across the welds was investigated. The distribution of Mn, C, Si and S across the weld from the 8.6 mm pipes was determined by means of electron probe micro-analyzer (EPMA) using the WDS technique. In the as-welded state, mappings for C, Si and S did not reveal any difference in the distribution of these elements in the bond line and in the neighbourhood. Although microstructural investigations recalled a decarburisation in this zone, it could not be exposed quantitatively since the technique used for the elemental mappings is insensitive to the slight differences in the carbon content. On the other hand, a
(a) (b)
6 Copyright © 2010 by ASME
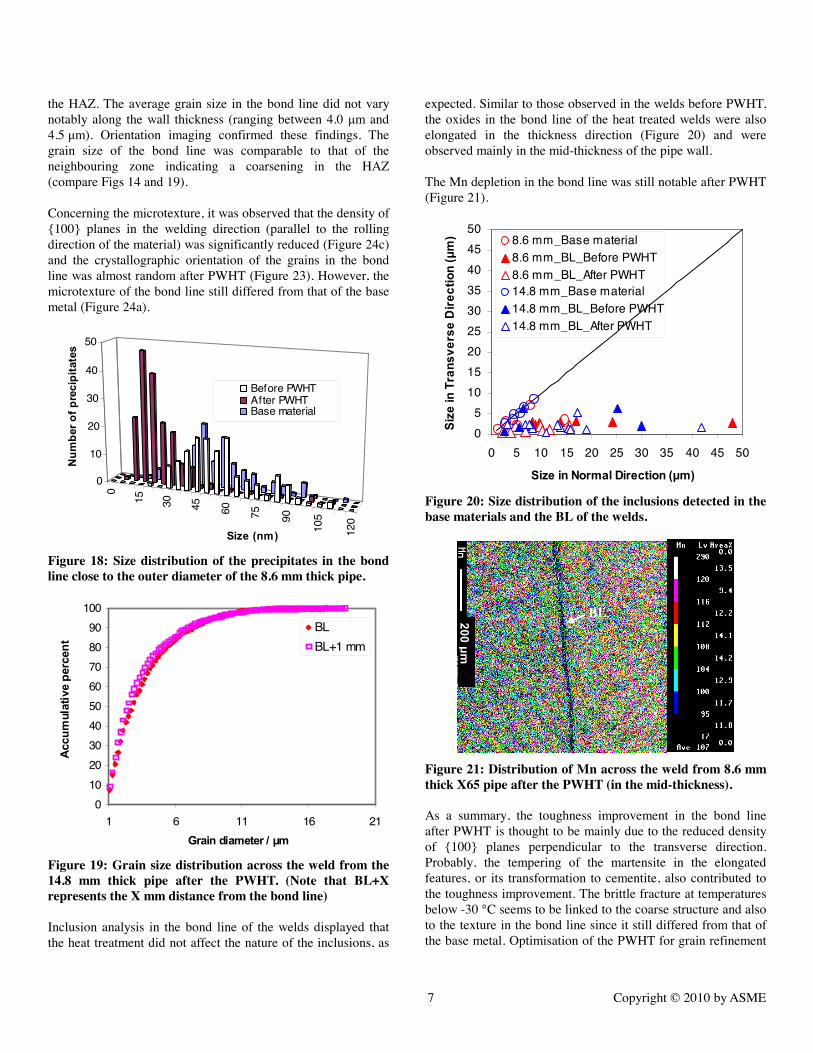
significant Mn depletion was observed in the bond line (Figure 16). This is in accordance with the oxidation of Mn during welding which has left Mn-depleted regions in the vicinity of the coil edge surfaces. The forging operation has likely forced the Mn-depleted neighbourhood to move to the joining plane and to constitute the final bond line.
Figure 15: Mn-Si rich oxide inclusion found in the bond line of 8.6 mm thick pipe prior to PWHT; (a) SEM image of the oxide inclusion and (b) its EDX spectrum.
Figure 16: Distribution of Mn across the weld from 8.6 mm thick X65 pipe before PWHT (in the mid-thickness).
In conclusion, the following factors are all suspected to contribute to the low toughness of the bond line prior to the PWHT:
• the coarse microstructure with elongated features containing martensite
• the coarse crystallographic grain size • the strong texture with high density of {100} planes in
the welding direction (parallel to the rolling direction of the material).
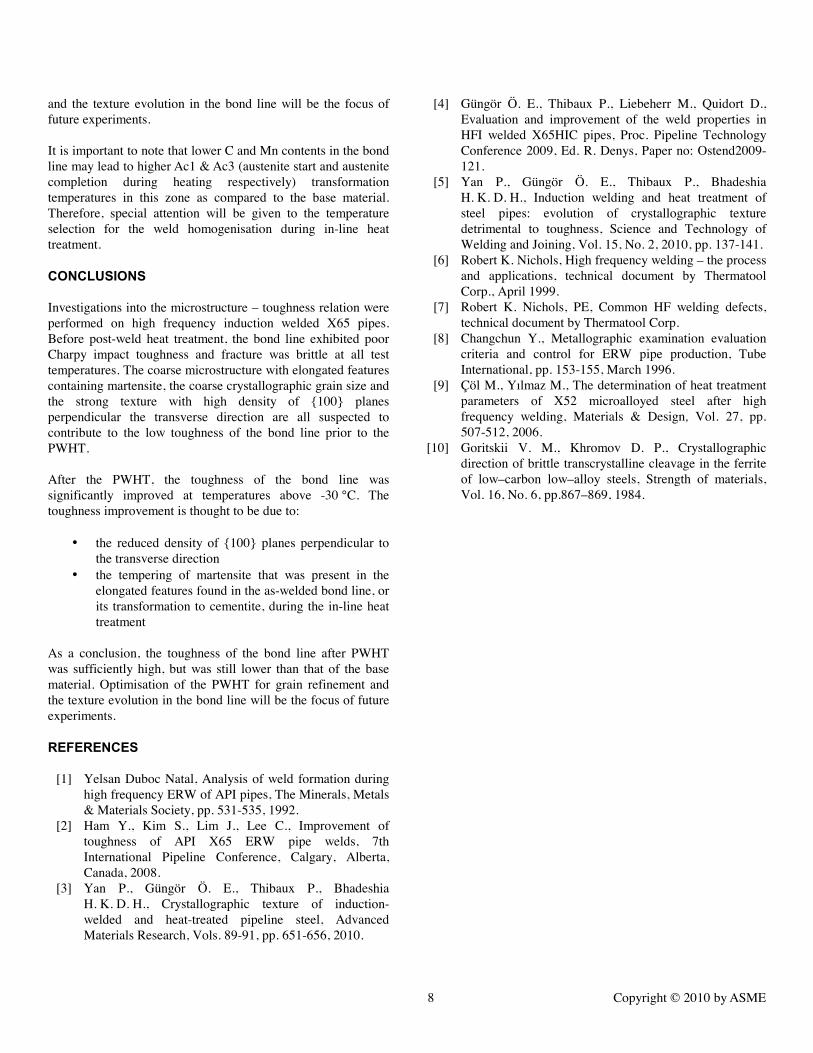
After post-weld heat treatment, the overall weld region was narrowed and the microstructure was homogenized. In the vicinity of the bond line, corresponding to the heat-affected zone, the bainitic ferrite microstructure of the as-welded state was replaced by a ferrite–pearlite microstructure. The martensite-austenite islands in the elongated features along the bond line were tempered, or transformed to austenite and then to cementite, during the PWHT. On the other hand, the bond line microstructure did not change appearance.
Figure 17: Scanning electron micrograph of the bond line after PWHT taken from the mid-thickness of the pipe with 8.6 mm wall-thickness. Hardness measurements across the welds after the PWHT confirmed an effective homogenization across the welds and along the thickness. The heat treatment decreased the hardness of the weld zone down a hardness level consistent with that of the base material. Evolution of the precipitates after PWHT was investigated by means of TEM analysis in the bond line. The coarse precipitates have vanished and the number of small precipitates (20 nm to 30 nm in diameter) was significantly increased compared to the as-welded state (Figure 18). Nevertheless, small sized precipitates did not assist any grain refinement in the bond line. Metallographic grain size measurements after PWHT indicated grain coarsening in all zones across the welds, particularly in
BL
(a)
(b)
7 Copyright © 2010 by ASME
the HAZ. The average grain size in the bond line did not vary notably along the wall thickness (ranging between 4.0 m and 4.5 m). Orientation imaging confirmed these findings. The grain size of the bond line was comparable to that of the neighbouring zone indicating a coarsening in the HAZ (compare Figs 14 and 19). Concerning the microtexture, it was observed that the density of {100} planes in the welding direction (parallel to the rolling direction of the material) was significantly reduced (Figure 24c) and the crystallographic orientation of the grains in the bond line was almost random after PWHT (Figure 23). However, the microtexture of the bond line still differed from that of the base metal (Figure 24a).
0
15 30 45 60 75 90
105
120
0
10
20
30
40
50
Before PWHTAfter PWHTBase material
Figure 18: Size distribution of the precipitates in the bond line close to the outer diameter of the 8.6 mm thick pipe.
0102030405060708090
100
1 6 11 16 21
BLBL+1 mm
Figure 19: Grain size distribution across the weld from the 14.8 mm thick pipe after the PWHT. (Note that BL+X represents the X mm distance from the bond line) Inclusion analysis in the bond line of the welds displayed that the heat treatment did not affect the nature of the inclusions, as
expected. Similar to those observed in the welds before PWHT, the oxides in the bond line of the heat treated welds were also elongated in the thickness direction (Figure 20) and were observed mainly in the mid-thickness of the pipe wall. The Mn depletion in the bond line was still notable after PWHT (Figure 21).
05
101520253035404550
0 5 10 15 20 25 30 35 40 45 50
8.6 mm_Base material8.6 mm_BL_Before PWHT8.6 mm_BL_After PWHT14.8 mm_Base material14.8 mm_BL_Before PWHT14.8 mm_BL_After PWHT
Figure 20: Size distribution of the inclusions detected in the base materials and the BL of the welds.
Figure 21: Distribution of Mn across the weld from 8.6 mm thick X65 pipe after the PWHT (in the mid-thickness). As a summary, the toughness improvement in the bond line after PWHT is thought to be mainly due to the reduced density of {100} planes perpendicular to the transverse direction. Probably, the tempering of the martensite in the elongated features, or its transformation to cementite, also contributed to the toughness improvement. The brittle fracture at temperatures below -30 °C seems to be linked to the coarse structure and also to the texture in the bond line since it still differed from that of the base metal. Optimisation of the PWHT for grain refinement
BL
8 Copyright © 2010 by ASME
and the texture evolution in the bond line will be the focus of future experiments. It is important to note that lower C and Mn contents in the bond line may lead to higher Ac1 & Ac3 (austenite start and austenite completion during heating respectively) transformation temperatures in this zone as compared to the base material. Therefore, special attention will be given to the temperature selection for the weld homogenisation during in-line heat treatment.
Investigations into the microstructure – toughness relation were performed on high frequency induction welded X65 pipes. Before post-weld heat treatment, the bond line exhibited poor Charpy impact toughness and fracture was brittle at all test temperatures. The coarse microstructure with elongated features containing martensite, the coarse crystallographic grain size and the strong texture with high density of {100} planes perpendicular the transverse direction are all suspected to contribute to the low toughness of the bond line prior to the PWHT. After the PWHT, the toughness of the bond line was significantly improved at temperatures above -30 °C. The toughness improvement is thought to be due to:
• the reduced density of {100} planes perpendicular to the transverse direction
• the tempering of martensite that was present in the elongated features found in the as-welded bond line, or its transformation to cementite, during the in-line heat treatment
As a conclusion, the toughness of the bond line after PWHT was sufficiently high, but was still lower than that of the base material. Optimisation of the PWHT for grain refinement and the texture evolution in the bond line will be the focus of future experiments.
[1] Yelsan Duboc Natal, Analysis of weld formation during
high frequency ERW of API pipes, The Minerals, Metals & Materials Society, pp. 531-535, 1992.
[2] Ham Y., Kim S., Lim J., Lee C., Improvement of toughness of API X65 ERW pipe welds, 7th International Pipeline Conference, Calgary, Alberta, Canada, 2008.
[3] Yan P., Güngör Ö. E., Thibaux P., Bhadeshia H. K. D. H., Crystallographic texture of induction-welded and heat-treated pipeline steel, Advanced Materials Research, Vols. 89-91, pp. 651-656, 2010.
[4] Güngör Ö. E., Thibaux P., Liebeherr M., Quidort D., Evaluation and improvement of the weld properties in HFI welded X65HIC pipes, Proc. Pipeline Technology Conference 2009, Ed. R. Denys, Paper no: Ostend2009-121.
[5] Yan P., Güngör Ö. E., Thibaux P., Bhadeshia H. K. D. H., Induction welding and heat treatment of steel pipes: evolution of crystallographic texture detrimental to toughness, Science and Technology of Welding and Joining, Vol. 15, No. 2, 2010, pp. 137-141.
[6] Robert K. Nichols, High frequency welding – the process and applications, technical document by Thermatool Corp., April 1999.
[7] Robert K. Nichols, PE, Common HF welding defects, technical document by Thermatool Corp.
[8] Changchun Y., Metallographic examination evaluation criteria and control for ERW pipe production, Tube International, pp. 153-155, March 1996.
[9] Çöl M., Yılmaz M., The determination of heat treatment parameters of X52 microalloyed steel after high frequency welding, Materials & Design, Vol. 27, pp. 507-512, 2006.
[10] Goritskii V. M., Khromov D. P., Crystallographic direction of brittle transcrystalline cleavage in the ferrite of low–carbon low–alloy steels, Strength of materials, Vol. 16, No. 6, pp.867–869, 1984.
9 Copyright © 2010 by ASME
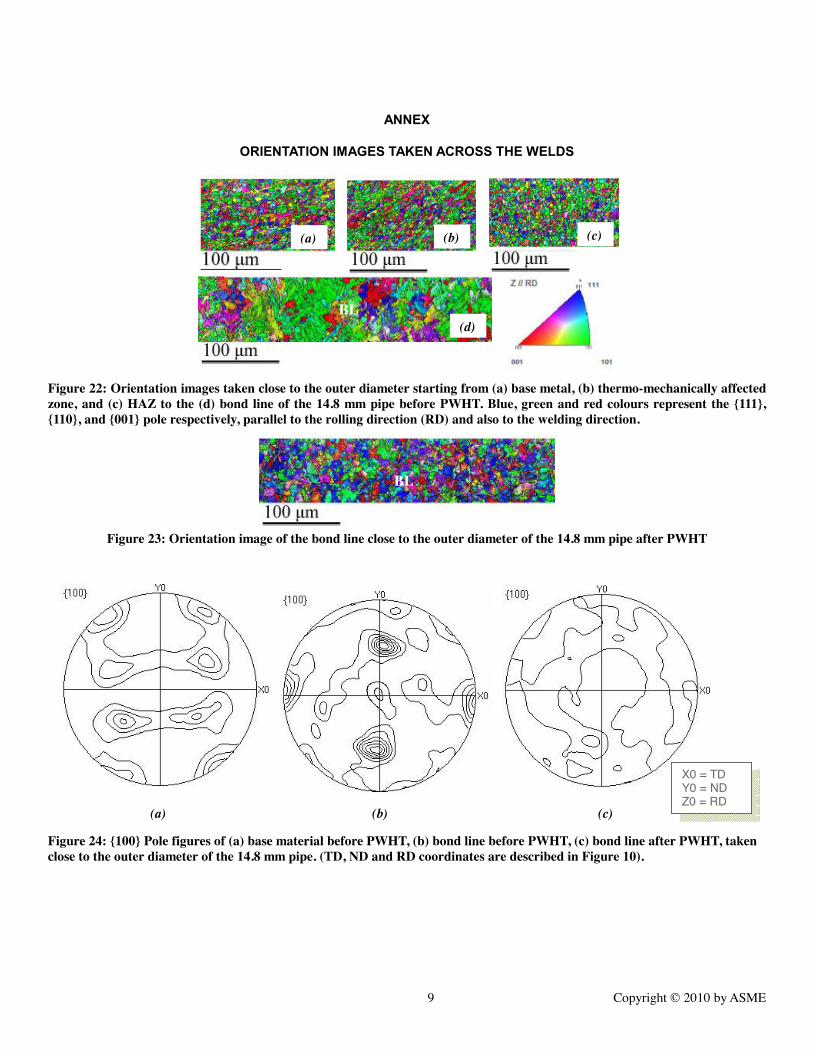
Figure 22: Orientation images taken close to the outer diameter starting from (a) base metal, (b) thermo-mechanically affected zone, and (c) HAZ to the (d) bond line of the 14.8 mm pipe before PWHT. Blue, green and red colours represent the {111}, {110}, and {001} pole respectively, parallel to the rolling direction (RD) and also to the welding direction.
Figure 23: Orientation image of the bond line close to the outer diameter of the 14.8 mm pipe after PWHT
(a) (b) (c)
Figure 24: {100} Pole figures of (a) base material before PWHT, (b) bond line before PWHT, (c) bond line after PWHT, taken close to the outer diameter of the 14.8 mm pipe. (TD, ND and RD coordinates are described in Figure 10).
(d)
(b) (a) (c)
BL
BL
X0 = TD Y0 = ND Z0 = RD