ioretention hydrologic performance study i
TRANSCRIPT
Bioretention Hydrologic Performance Study I
Prepared for:
City of Bellingham, Project Sponsor
Eli Mackiewicz, PM
Stormwater Action Monitoring (SAM) Program
Brandi Lubliner, SAM Coordinator, Ecology
Prepared by:
William J. Taylor Principal Investigator Taylor Aquatic Science
Bryan Berkompas Aspect Consulting LLC
Douglas Beyerlein, P.E. Prime Consultant Clear Creek Solutions, Inc.
Anne Cline Raedeke Associates, Inc.
Jennifer H. SaltonStall, L.Hg. Associated Earth Sciences, Inc.
Christopher Wright Raedeke Associates, Inc.
Associates, Inc. Raedeke
Taylor Aquatic Science

Publication Information
Suggested Citation Taylor, W., D. Beyerlein, J. Saltonstall, B. Berkompas, A. Cline. 2018. Western Washington Bioretention
Hydrologic Performance Study I. Stormwater Action Monitoring Program. Prepared for City of Bellingham and Washington State Department of Ecology. Seattle, WA.
Author and Contact Information William J. Taylor, [email protected], 206-755-3211 Douglas Beyerlein, [email protected], 425-225-5997
Available online at Stormwater Action Monitoring (SAM); https://ecology.wa.gov/Regulations-Permits/Reporting-requirements/Stormwater-monitoring/Stormwater-Action-Monitoring under Effectiveness Studies.
Bioretention Hydrologic Performance Study
August 28, 2018 Page i
Bioretention Hydrologic Performance Study I
Final Report
Date: August 28, 2018
Table of Contents
1.0 Executive Summary ................................................................................................................................. 1 1.1 Summary of Findings ...................................................................................................................... 2 1.2 Recommendations for Improved Bioretention Designs and Performance .................................... 6
2.0 Introduction ............................................................................................................................................ 9 3.0 Site Selection and Study Design ............................................................................................................ 11
3.1 Project Goals ................................................................................................................................ 11 3.2 Project Objectives......................................................................................................................... 11 3.3 Site Selection Criteria and Selection Process ............................................................................... 12
4.0 Results and Discussion .......................................................................................................................... 13 4.1 Hydrologic Monitoring ................................................................................................................. 13 4.2 Geotechnical and Hydrogeologic Assessment ............................................................................. 15 4.3 Vegetation Monitoring ................................................................................................................. 19 4.4 Hydrologic Modeling Discussion .................................................................................................. 21
References .................................................................................................................................................. 23 Figures Figure 1. Distribution of Bioretention Monitoring Site Locations. .............................................................. 4 Figure 2. Graphical Representation of the Grain-Size Composition of BSM Samples Collected at Each of the Ten Facilities Studied. .......................................................................... 18 Tables Table 1. Comparison of Design and Measured Infiltration Rates .............................................................. 5 Table 2. Bioretention Hydrologic Performance Site Names and Acronyms Used in the Study ............... 12 Table 3. Hydrogeologic and Dimensional Constructed Conditions at Ten Monitored Bioretention Facilities. ....................................................................................... 14 Table 4. Averaged Organic Matter and Grain Size Results Relative to Recommended Values ............... 17 Table 5. Wetland Indicator Status Percent Distribution for Shrubs and Herbaceous Vegetation in the Ten Bioretention Facilities Studied ............................................ 20 Table 6. Model Input Data ........................................................................................................................ 22
Bioretention Hydrologic Performance Study
August 28, 2018 Page ii
Table of Contents (Continued)
Appendices (in separate file)
1. Bioretention Hydrologic Performance (BHP) Study Site Selection Process and List of SelectedSites Technical Memo - Deliverables 2.2 and 2.3 Combined. Taylor Aquatic Science. 10/23/15
2. Bioretention Hydrologic Performance Study - Hydrologic Monitoring Results. Aspect Consulting.6/26/18
3. Deliverable 4.5, Site B145, Geotechnical/Soils Assessment Design Data and Current Conditions,145th Place SE and SE 22nd Street Roadway Improvement Project, Bellevue, Washington.Associated Earth Sciences, Inc. 10/25/16
4. Deliverable 4.5, Site BDP, Geotechnical/Soils Assessment Design Data and Current Conditions,Bloedel Donavan Park, Bellingham, Washington. Associated Earth Sciences, Inc. 10/25/16
5. Deliverable 4.5, Site IHS, Geotechnical/Soils Assessment Design Data and Current Conditions,Issaquah High School, Issaquah, Washington. Associated Earth Sciences, Inc. 10/25/16
6. Deliverable 4.5, Site MCCA, Geotechnical/Soils Assessment Design Data and Current Condition,Mill Creek Community Association, Mill Creek, Washington. Associated Earth Sciences, Inc.10/25/16
7. Deliverable 4.5, Site NOLL, Geotechnical/Soils Assessment Design Data and Current Conditions,Noll Roundabout, Poulsbo, Washington. Associated Earth Sciences, Inc. 10/25/16
8. Deliverable 4.5, Site ORLA, Geotechnical/Soils Assessment Design Data and Current Conditions,Olympia Regional Learning Academy, Thurston County, Washington. Associated Earth Sciences,Inc. 10/25/16
9. Deliverable 4.5, Site SLP, Geotechnical/Soils Assessment Design Data and Current Conditions,Spanaway Lake Park, Pierce County, Washington. Associated Earth Sciences, Inc. 10/25/16
10. Bellingham Bioretention Study - Vegetation Monitoring Methods and Results. RaedekeAssociates, Inc. 10/19/16
11. Bioretention Hydrologic Performance Phase II Deliverable 5.2 Hydrologic Modeling Results.Clear Creek Solutions, Inc. 6/26/18

Bioretention Hydrologic Performance Study
August 28, 2018 Page 1
1.0 Executive Summary
A bioretention facility is an engineered stormwater facility that treats stormwater by passing it through a specified soil profile, and either retains or detains the treated stormwater for flow attenuation, according to the Washington State Department of Ecology (Ecology). While the use of bioretention facilities in new and redevelopment in the Puget Sound region is increasing rapidly, little formal assessment of the hydrologic performance of locally constructed facilities can be found in the scientific literature. As population grows and developable area in the Puget Sound is increasingly scarce, and natural stream channels remain vulnerable to stormwater runoff, evidence is needed that stormwater control measures are efficiently using space available while achieving protection of local waters.
With this in mind, the three main goals of the Bioretention Hydrologic Performance (BHP) Study I was to:
1. Provide an overall assessment regarding how constructed bioretention facilities are performingon variable sites throughout Puget Sound.
2. From this assessment, identify major elements of the site designs and performance constraintsthat can help inform the design and modeling process for more efficient and predictablyperforming facilities.
3. Provide recommendations for engineers and jurisdiction reviewers to better model, design, andreview future bioretention facility designs.
To conduct this assessment, ten constructed bioretention cells were selected from throughout the Puget Sound Basin. The design and construction assessment included:
• Review of original design documents and hydrologic model.• Nine months of hydrologic monitoring of inflow, outflow, pooling and groundwater elevations.• Geotechnical and hydrogeologic sampling.• Review of original vegetation planting plans and assessment of plant survival.• Modeling of the site hydrology using Western Washington Hydrology Model (WWHM) version
2012 to evaluate the performance of the model and identify design features that affecthydrological performance.
Overall, the ten bioretention facilities assessed appear to continue to serve a more than adequate function without unexpected shortcomings resulting in under capacity or local flooding. Little or no overflow occurred at most of the sites, with the exception of apparent underdrain bypassing in one facility. Infiltration rates in all the bioretention soil mixes (BSM) accommodated most of the inflow runoff to the facilities during the monitoring period. This study did not review water quality treatment performance of these facilities, focusing instead on hydrologic flow control parameters.
Bioretention Hydrologic Performance Study
August 28, 2018 Page 2
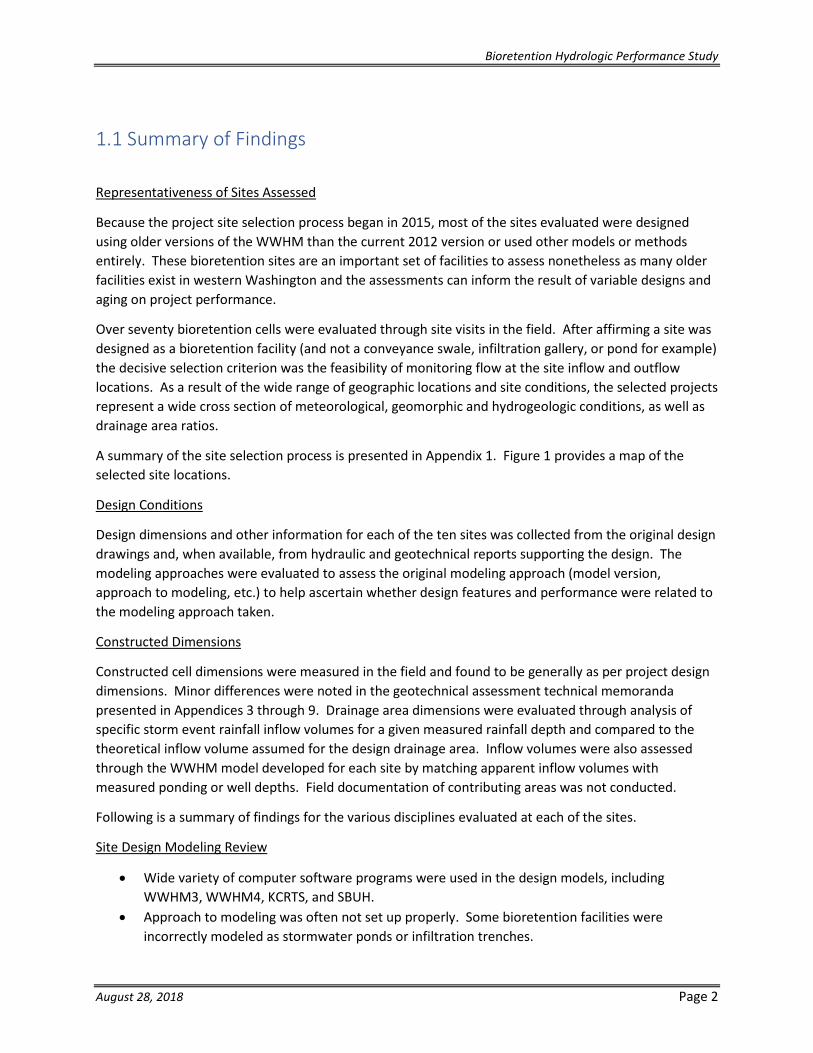
1.1 Summary of Findings
Representativeness of Sites Assessed
Because the project site selection process began in 2015, most of the sites evaluated were designed using older versions of the WWHM than the current 2012 version or used other models or methods entirely. These bioretention sites are an important set of facilities to assess nonetheless as many older facilities exist in western Washington and the assessments can inform the result of variable designs and aging on project performance.
Over seventy bioretention cells were evaluated through site visits in the field. After affirming a site was designed as a bioretention facility (and not a conveyance swale, infiltration gallery, or pond for example) the decisive selection criterion was the feasibility of monitoring flow at the site inflow and outflow locations. As a result of the wide range of geographic locations and site conditions, the selected projects represent a wide cross section of meteorological, geomorphic and hydrogeologic conditions, as well as drainage area ratios.
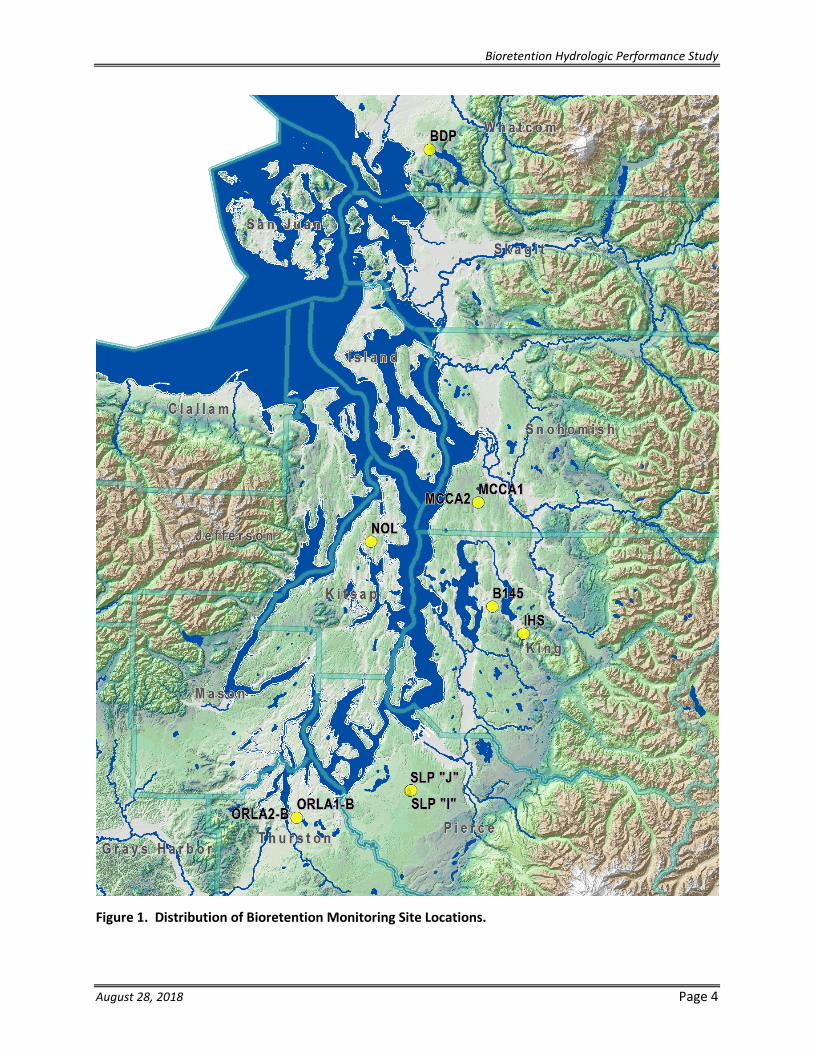
A summary of the site selection process is presented in Appendix 1. Figure 1 provides a map of the selected site locations.
Design Conditions
Design dimensions and other information for each of the ten sites was collected from the original design drawings and, when available, from hydraulic and geotechnical reports supporting the design. The modeling approaches were evaluated to assess the original modeling approach (model version, approach to modeling, etc.) to help ascertain whether design features and performance were related to the modeling approach taken.
Constructed Dimensions
Constructed cell dimensions were measured in the field and found to be generally as per project design dimensions. Minor differences were noted in the geotechnical assessment technical memoranda presented in Appendices 3 through 9. Drainage area dimensions were evaluated through analysis of specific storm event rainfall inflow volumes for a given measured rainfall depth and compared to the theoretical inflow volume assumed for the design drainage area. Inflow volumes were also assessed through the WWHM model developed for each site by matching apparent inflow volumes with measured ponding or well depths. Field documentation of contributing areas was not conducted.
Following is a summary of findings for the various disciplines evaluated at each of the sites.
Site Design Modeling Review
• Wide variety of computer software programs were used in the design models, including WWHM3, WWHM4, KCRTS, and SBUH.
• Approach to modeling was often not set up properly. Some bioretention facilities were incorrectly modeled as stormwater ponds or infiltration trenches.

Bioretention Hydrologic Performance Study
August 28, 2018 Page 3
• Some of the facilities infiltrated all stormwater and did not overflow during the study. Hydrologically they performed better than expected beyond required safety factors, masking possible design errors or incorrect assumptions.
Hydrologic Monitoring
• Nine (9) months of continuous wet season monitoring (October 2016 - June 2017) with careful QA/QC (Quality Assurance/Quality Control) conducted in the field and in the data sets; stage recorders were downloaded and recalibrated biweekly, weirs cleaned of debris, and data sets reviewed and corrected with documentation for apparent inconsistencies.
• Variable ponding response depending on subsurface conditions.
• Evidence of shallow groundwater mounding in some of the sites.
• Evidence of water movement not captured in the modeling, including:
o Possible lateral subsurface flow in some of the sites.
o Evidence of subsurface leakage into an overflow outlet structure in one site.
o Evidence at one site of short circuiting through soil directly to underdrain, resulting in almost no detention, and reduced treatment.
Geotechnical and Hydrogeologic Findings
• Sites covered a wide range of geomorphic and hydrogeologic conditions common to western Washington.
• Bioretention soil texture was generally coarser than current guidelines, resulting in greater infiltration rates than would be expected under the current media guidelines.
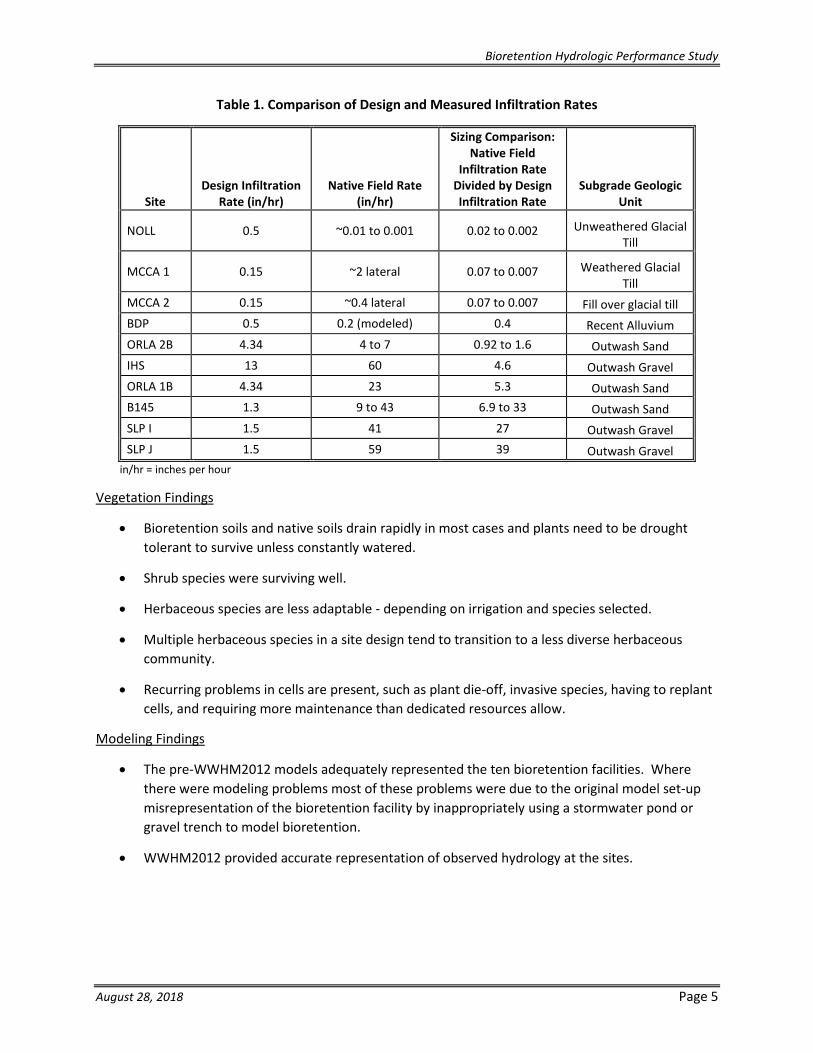
• Wide range of measured infiltration rates, with measured rates in the field for subsurface soils significantly greater in about half the cases than the site design values used, as illustrated in Table 1. The highest subsurface infiltration rates relative to design were observed on outwash sites.
• Little site-specific geotechnical or hydrogeologic data; only two sites conducted pilot infiltration tests; other analyses sometimes used infiltration results from adjacent geotechnical work.
Bioretention Hydrologic Performance Study
August 28, 2018 Page 4
Figure 1. Distribution of Bioretention Monitoring Site Locations.
Bioretention Hydrologic Performance Study
August 28, 2018 Page 5
Table 1. Comparison of Design and Measured Infiltration Rates
Site Design Infiltration
Rate (in/hr) Native Field Rate
(in/hr)
Sizing Comparison: Native Field
Infiltration Rate Divided by Design Infiltration Rate
Subgrade Geologic Unit
NOLL 0.5 ~0.01 to 0.001 0.02 to 0.002 Unweathered Glacial Till
MCCA 1 0.15 ~2 lateral 0.07 to 0.007 Weathered Glacial Till
MCCA 2 0.15 ~0.4 lateral 0.07 to 0.007 Fill over glacial till BDP 0.5 0.2 (modeled) 0.4 Recent Alluvium ORLA 2B 4.34 4 to 7 0.92 to 1.6 Outwash Sand IHS 13 60 4.6 Outwash Gravel ORLA 1B 4.34 23 5.3 Outwash Sand B145 1.3 9 to 43 6.9 to 33 Outwash Sand SLP I 1.5 41 27 Outwash Gravel SLP J 1.5 59 39 Outwash Gravel
in/hr = inches per hour
Vegetation Findings
• Bioretention soils and native soils drain rapidly in most cases and plants need to be drought tolerant to survive unless constantly watered.
• Shrub species were surviving well.
• Herbaceous species are less adaptable - depending on irrigation and species selected.
• Multiple herbaceous species in a site design tend to transition to a less diverse herbaceous community.
• Recurring problems in cells are present, such as plant die-off, invasive species, having to replant cells, and requiring more maintenance than dedicated resources allow.
Modeling Findings
• The pre-WWHM2012 models adequately represented the ten bioretention facilities. Where there were modeling problems most of these problems were due to the original model set-up misrepresentation of the bioretention facility by inappropriately using a stormwater pond or gravel trench to model bioretention.
• WWHM2012 provided accurate representation of observed hydrology at the sites.
Bioretention Hydrologic Performance Study
August 28, 2018 Page 6
1.2 Recommendations for Improved Bioretention Designs and Performance
Given the above findings, major recommendations intended for engineers, geologists, and landscape architects, as well as development reviewers at local jurisdictions for each of the design elements include:
Design Features
• Provide inspectors’ confirmation of constructed contributing areas and overflow elevations.
Geotechnical and Hydrogeologic Recommendations
• Collect site-specific data to understand shallow soil, geologic and groundwater conditions affecting subsurface infiltration rates.
• Consider potential for lateral flow, and the ultimate path of the infiltrated water, particularly for sites with low or spatially variable infiltration rates.
• Provide soil media that is consistent with the specifications provided in the Ecology 2012 Stormwater Management Manual for Western Washington, as amended in December 2014 (2014 SWMMWW; Ecology, 2014).
• Conduct geotechnical plan review by the permit applicant and jurisdiction staff of permit plan set so that plans adequately incorporate geotechnical recommendations (i.e., are bioretention cells located near infiltration test locations or at different elevations or does the grading plan remove the permeable horizon).
• Conduct observations during construction by permit applicant and jurisdiction staff to observe whether the subsurface geologic and groundwater conditions are consistent with the basis of design (e.g., if site design is based on outwash soils being present, do not overexcavate into consolidated glacial till).
Vegetation Recommendations
• Select plants that reflect the expected subsurface moisture and dry season conditions, and the solar exposure expected for the site.
• Select plant species that are consistent with each other for growing success (e.g., select shrubs that are not excessively shading the herbaceous plants).
• Select a planting plan that is consistent with the institutional or residential owner’s design needs and commitment to maintenance.
• Install woody species at lower density to allow for plant growth and spreading.
Bioretention Hydrologic Performance Study
August 28, 2018 Page 7
• Select native herbaceous plant species that are more likely to survive in both wet and dryconditions.
• Maintenance plans and contingency plans should be part of the bioretention designspecifications provided by the project design consultant.
• Conduct an assessment of how BSM infiltration rates change as the bioretention site ages andwhether or not vegetation has an effect on the BSM infiltration rate.
Modeling Recommendations
• Ecology should instruct the WWHM2012 software engineers to investigate how to moreaccurately represent the soil layer depths in the model development, including possibly a leaflitter layer.
• Ecology should instruct the WWHM2012 software engineers to investigate more appropriatedefault evapotranspiration rates based on vegetation types.
• Ecology should instruct the WWHM2012 software engineers to conduct sensitivity analyses ofthe magnitude of effect of infiltration rate variability, contributing drainage area, and use ofregional rainfall records on facility performance.
Recommendations Summary
In general, these findings of the hydrologic performance of constructed facilities found that the sites successfully infiltrated all the stormwater inflows during the monitoring period, with the exception of one site that appeared to foster infiltration through the bioretention soil media that quickly bypassed to an underdrain, and another that was too small for its contributing area and exhibited groundwater mounding, slowing infiltration.
Development sites where space is limited may benefit from greater subsurface hydrogeological investigation for better estimates of the potential infiltration capacity. The many factors and parameters that influence bioretention facilities’ design and the uncertainty of subsurface infiltration rates may be contributing to discounting the feasibility of bioretention at some sites. Vegetation composition and maintenance appears to become an afterthought in design of the bioretention facilities. The requirement to provide maintenance may, on occasion, become an excuse not to include bioretention in the project’s stormwater design.
Acknowledgement to Project Sponsors, SAM Participants, and Jurisdiction Volunteers
This project has been a cooperative effort involving contributions from the Stormwater Action Monitoring (SAM) staff, and the participating SAM jurisdictions who reviewed the original proposal during the selection process. As the jurisdictional sponsor, the City of Bellingham provided careful review of all deliverables and budget monitoring, resulting in greatly improved products and remaining within the conditions of the Ecology Agreement. The SAM Coordinator and other Ecology technical staff likewise provided responsive reviews of draft submittals.
Local jurisdictions provided substantial collaboration through nominating candidate bioretention study sites, and provided the background designs and reports needed to assess the multiple sites evaluated.

Bioretention Hydrologic Performance Study
August 28, 2018 Page 8
Over seventy individual bioretention cells were visited as part of the selection process, nominated by over 22 different jurisdictions, with dozens of other agencies contacted. Two of the jurisdictions of facilities selected for monitoring (the cities of Bellingham and Poulsbo) provided staff support to help download the hydrologic monitoring instrumentation data.
Finally, discussions with participating design engineers provided insight to design details and supporting documents for a greater understanding of the designs and constructed conditions.
Bioretention Hydrologic Performance Study
August 28, 2018 Page 9
2.0 Introduction
While the storage and infiltration capability of bioretention facilities is generally acknowledged, little data exists in the Puget Sound region to verify the hydrologic performance of these facilities. Use of bioretention is widespread in the Puget Sound region and is expected to increase in the region as a result of requirements of the National Pollutant Discharge Elimination System (NPDES) municipal permits and the 2014 SWMMWW (Ecology, 2014). State and local governments are interested to ensure that new bioretention facilities constructed under the 2014 SWMMWW can be built to attain desired performance.
Meeting expected infiltration and overflow conditions from bioretention facilities ensures downstream receiving waters are protected to the extent planned and the desired inflow volumes are filtered for water quality treatment. The cumulative hydrologic benefit of bioretention facilities on receiving waters will depend on the hydrologic performance of each of the individual facilities within a basin.
The hydrologic performance of bioretention facilities may also affect the survival, composition, and health and maintenance of the facility vegetation, which may, in turn, have further impacts on infiltration and longevity of the facility. Conducting a performance assessment of bioretention facilities represents an adaptive management process to help ensure effective implementation of low impact development (LID) facilities in the Puget Sound region.
The intent of this study was to:
1. Conduct an overall assessment regarding how ten constructed bioretention facilities are performing in sites throughout Puget Sound.
2. Use the detailed monitoring of each facility to identify major elements of the site designs and performance constraints to assist in the design and modeling to produce efficient and predictably performing facilities in the future.
3. Provide recommendations for design engineers and jurisdiction reviewers to better model, design, and review future bioretention facilities.
The overall BHP project involved an initial review of many candidate sites, discussions with local jurisdiction owners, design engineers and maintenance staff; and site-specific documentation of dimensions and elevations, soil structure, infiltration rate, vegetation conditions, modeling software, and measured hydrologic response of the facility. As part of our study, each site was modeled by our project team using WWHM2012. Post-construction site conditions and 9-months’ worth of monitoring data were used to assess model parameter values and new model elements (e.g., presence of a leaf litter layer) to provide insights to the model performance itself and facility performance.
As a result of the comprehensive nature of the assessment, it should be noted that many of the insights and conclusions come not just from the physical measurements, hydrologic performance data, and modeling, but also from the more anecdotal observations gained from owners, engineers, and operators of the facilities, as well as the investigators’ own site-specific observations.

Bioretention Hydrologic Performance Study
August 28, 2018 Page 10
While this study answered many questions, new research questions emerged from this study. These possible new questions were not evaluated here as the analyses would require unavailable or uncollected data, or are beyond the scope of this project.
The following discussions of each of the site monitoring and modeling disciplines are summaries of the approaches and conclusions presented in the various discipline technical memoranda provided in the appendices.

Bioretention Hydrologic Performance Study
August 28, 2018 Page 11
3.0 Site Selection and Study Design
The overall value in the use of bioretention (and other LID stormwater facilities) will depend on the accuracy with which constructed facilities meet their hydrologic performance expectations. If facilities do not infiltrate, retain, and release flows sufficiently, receiving waters will not be protected from hydrologic impacts, and contact with BSM may not be adequate to provide water quality treatment. Facilities which perform better than expected or designed may occupy more site area that needed to meet local water quality and flow control goals. As a result, in some cases, cost savings could be achieved by implementing more-detailed, site-specific, design methodologies.
Evaluation of BHP will provide feedback to the 2014 SWMMWW modeling design process, and to engineers’ design approaches, to help optimize designs for greater expected accuracy and resulting benefits.
3.1 Project Goals
The project goal is to compare actual hydrologic performance of constructed bioretention facilities around the Puget Sound under a variety of storm conditions with the modeled performance from the same facility using WWHM2012. Results are anticipated to demonstrate the relative importance of site characteristics, design, construction, maintenance, and modeling variables.
Communication goals for the project were to provide presentations and technical memoranda to the Stormwater Work Group (SWG) and Ecology to elicit feedback on the project. These were completed during the course of the project. The final report was created in order to provide summary information to professional stormwater managers and their staff throughout the region.
3.2 Project Objectives
Specific objectives of the project included installing inflow and outflow monitoring instruments that accurately and precisely measure stage at primary hydraulic devices which can then be translated by a rating curve to flow. Rain gages were installed to measure actual rainfall at the site of the subject bioretention facility being monitored. Rainfall and flow were measured continuously during the wet season to enable evaluation of the design model using the actual rainfall, runoff, and facility flow-through conditions observed.
The change in the model parameters required to accurately reproduce the monitored data will reveal the accuracy of the model parameters used in the original engineering design. The comparison of the hydrologic results to the minimum requirements will also reveal the degree to which the results continued to meet or did not meet the hydrologic criteria of the 2014 SWMMWW.
Bioretention Hydrologic Performance Study
August 28, 2018 Page 12
Coincident with collecting flow data and comparing the design model with a model based on actual performance, the secondary objectives are to collect data characterizing the BSM, shallow subgrade soils, infiltration rate, ponding depths, subsurface water depths, and vegetation community composition and density and maintenance activity. These additional data are used in conjunction with the observed hydrologic performance to support hypotheses regarding the possible mechanisms influencing the hydrologic results.
3.3 Site Selection Criteria and Selection Process
To initiate the facility selection process, a selection criteria matrix was developed to identify and prioritize the project site elements as they affected the site’s potential selection. Candidate sites were identified through discussions with interested local jurisdictions and some privately-owned facilities. Each of the candidate sites identified were assessed in the field for the selection criteria, and final selection based largely on the ability of the inflows to be accurately measured. A complete description of the process is provided in Appendix 1.
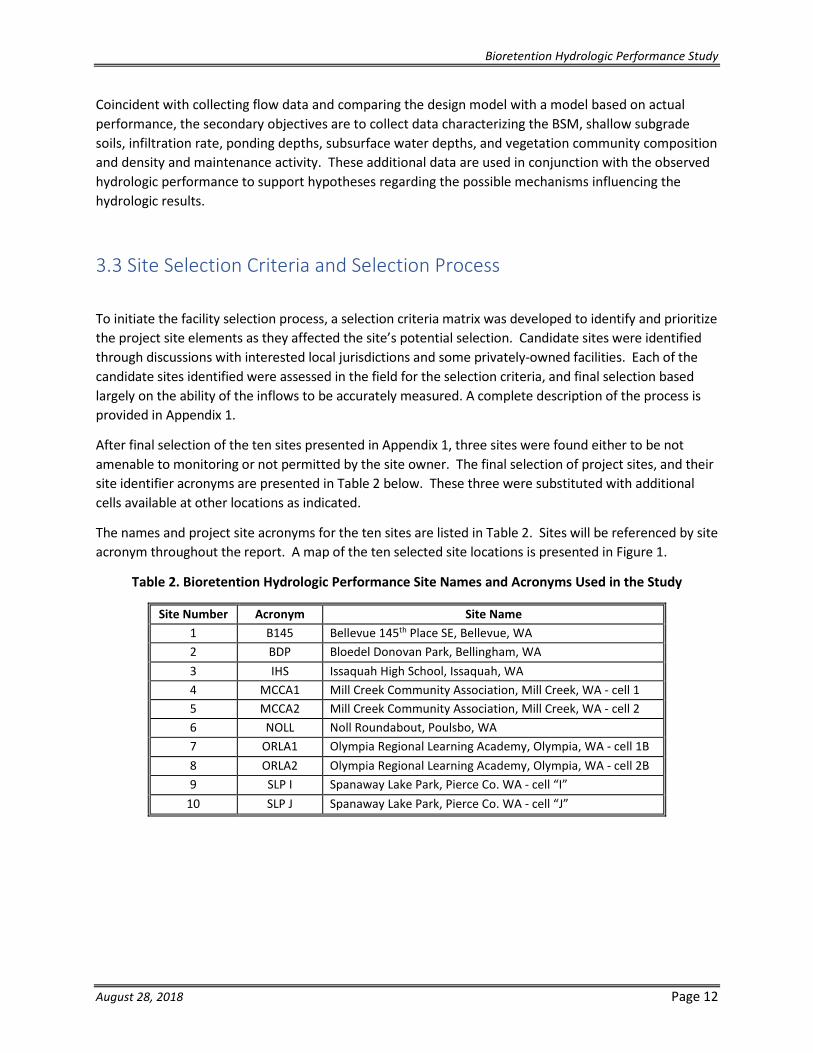
After final selection of the ten sites presented in Appendix 1, three sites were found either to be not amenable to monitoring or not permitted by the site owner. The final selection of project sites, and their site identifier acronyms are presented in Table 2 below. These three were substituted with additional cells available at other locations as indicated.
The names and project site acronyms for the ten sites are listed in Table 2. Sites will be referenced by site acronym throughout the report. A map of the ten selected site locations is presented in Figure 1.
Table 2. Bioretention Hydrologic Performance Site Names and Acronyms Used in the Study
Site Number Acronym Site Name 1 B145 Bellevue 145th Place SE, Bellevue, WA 2 BDP Bloedel Donovan Park, Bellingham, WA 3 IHS Issaquah High School, Issaquah, WA 4 MCCA1 Mill Creek Community Association, Mill Creek, WA - cell 1 5 MCCA2 Mill Creek Community Association, Mill Creek, WA - cell 2 6 NOLL Noll Roundabout, Poulsbo, WA 7 ORLA1 Olympia Regional Learning Academy, Olympia, WA - cell 1B 8 ORLA2 Olympia Regional Learning Academy, Olympia, WA - cell 2B 9 SLP I Spanaway Lake Park, Pierce Co. WA - cell “I”
10 SLP J Spanaway Lake Park, Pierce Co. WA - cell “J”

Bioretention Hydrologic Performance Study
August 28, 2018 Page 13
4.0 Results and Discussion
The intent of the BHP Study was to compare original design plans for the expected dimensions, geotechnical and hydrogeologic conditions, hydrology, and vegetation plans with the actual measured conditions for all these disciplines.
The intent of this comparison was to identify major elements of the site designs and performance constraints to help inform the design and modeling process for more efficient and predictably performing facilities.
With these design elements, we provide recommendations for engineers and jurisdiction reviewers to better model, design and review future bioretention facility designs.
The methods and materials used for each of the disciplines studied are presented in the appendices for each of the disciplines addressed at all the sites in this study:
• Hydrologic Monitoring • Geotechnical and Hydrogeology Assessment • Vegetation Community • Modeling Analysis of Observed Performance
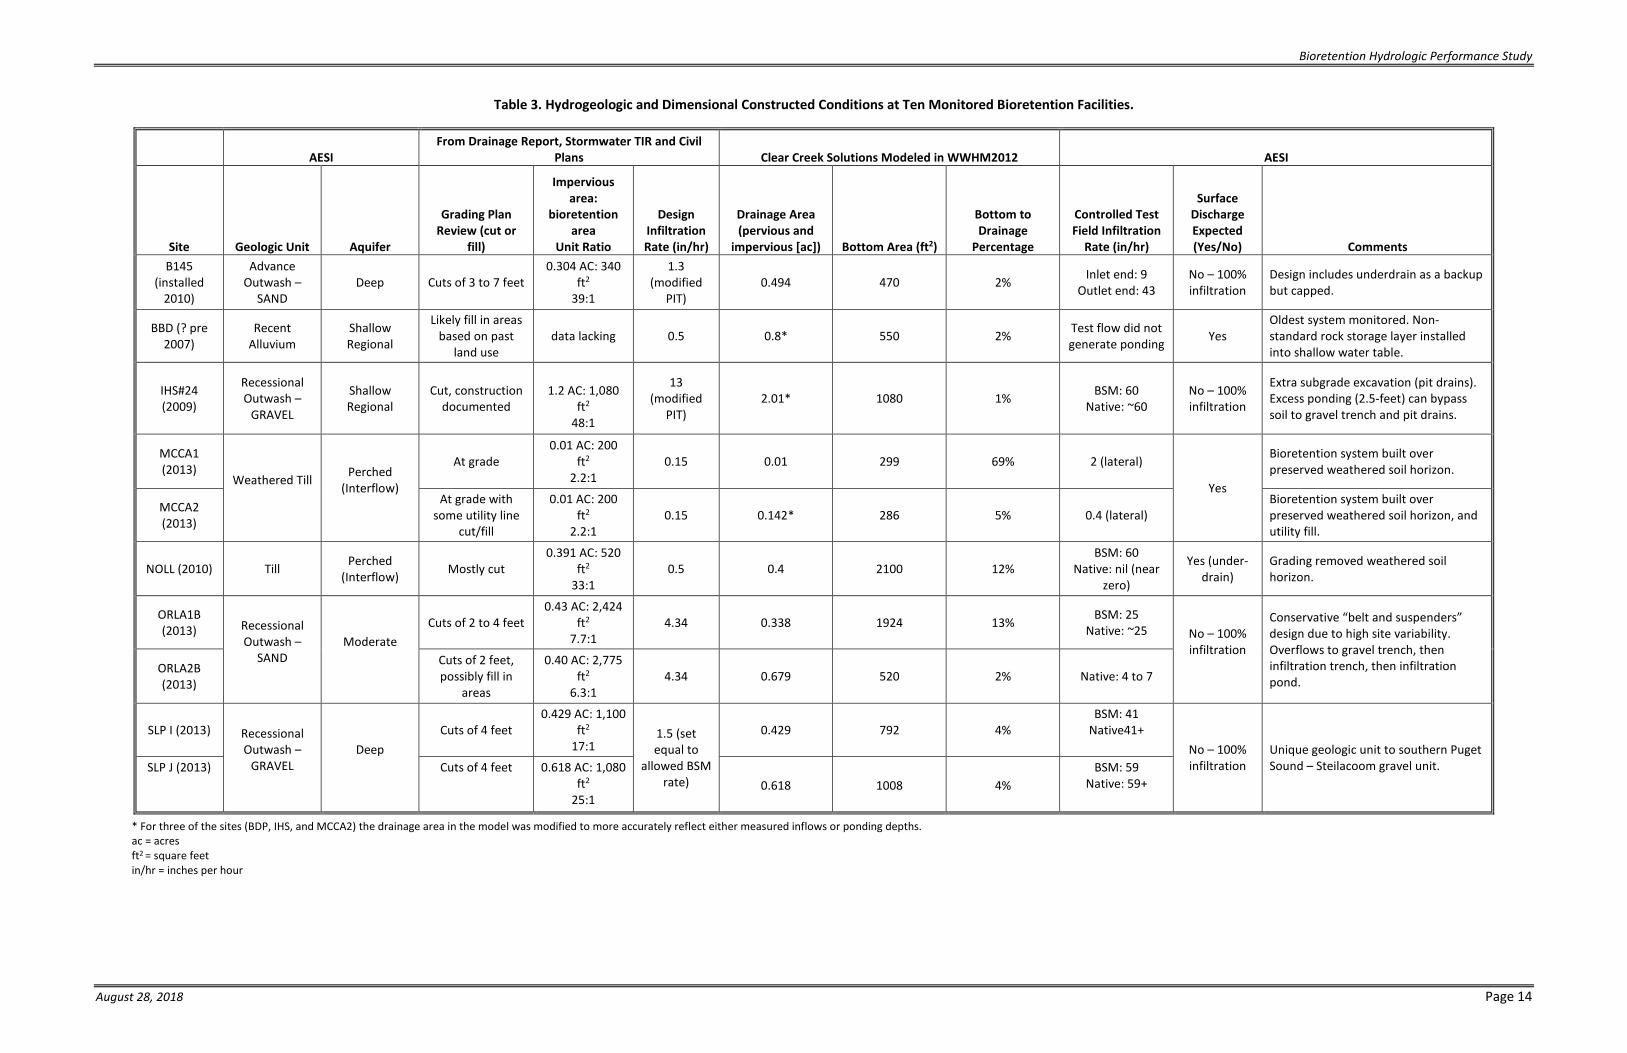
A summary of the dimensional, geotechnical, hydrogeologic and modeled site conditions of the ten cells selected for monitoring is presented in Table 3.
4.1 Hydrologic Monitoring
Continuous hydrologic monitoring of the hydrologic cycle through each of the ten cells was conducted for the period of October 2016 through June 2017. The monitoring was conducted at 5-minute intervals including the following hydrologic elements:
• Rainfall • Inflow to the bioretention cell • Ponding stage • Subsurface or groundwater stage • Overflow surface outlet
Water levels for the flow monitoring locations were measured relative to the invert of the compound weirs installed in the inlet or outlet pipes and were also tied into a common local elevation. Water levels in the surface ponding and subsurface wells were tied into the same common local elevation. Each of the rain gages and stage recording devices were downloaded on a biweekly basis, and the instruments re-calibrated to their respective zero-point elevations. Appendix 2 provides a detailed description of the methods, materials, and QA/QC process for the data collection and review process.
Bioretention Hydrologic Performance Study
August 28, 2018 Page 14
Table 3. Hydrogeologic and Dimensional Constructed Conditions at Ten Monitored Bioretention Facilities.
* For three of the sites (BDP, IHS, and MCCA2) the drainage area in the model was modified to more accurately reflect either measured inflows or ponding depths. ac = acres ft2 = square feet in/hr = inches per hour
AESI From Drainage Report, Stormwater TIR and Civil
Plans Clear Creek Solutions Modeled in WWHM2012 AESI
Site Geologic Unit Aquifer
Grading Plan Review (cut or
fill)
Impervious area:
bioretention area
Unit Ratio
Design Infiltration Rate (in/hr)
Drainage Area (pervious and
impervious [ac]) Bottom Area (ft2)
Bottom to Drainage
Percentage
Controlled Test Field Infiltration
Rate (in/hr)
Surface Discharge Expected (Yes/No) Comments
B145 (installed
2010)
Advance Outwash –
SAND Deep Cuts of 3 to 7 feet
0.304 AC: 340 ft2
39:1
1.3 (modified
PIT) 0.494 470 2% Inlet end: 9
Outlet end: 43 No – 100% infiltration
Design includes underdrain as a backup but capped.
BBD (? pre 2007)
Recent Alluvium
Shallow Regional
Likely fill in areas based on past
land use data lacking 0.5 0.8* 550 2% Test flow did not
generate ponding Yes Oldest system monitored. Non-standard rock storage layer installed into shallow water table.
IHS#24 (2009)
Recessional Outwash –
GRAVEL
Shallow Regional
Cut, construction documented
1.2 AC: 1,080
ft2 48:1
13 (modified
PIT) 2.01* 1080 1% BSM: 60
Native: ~60 No – 100% infiltration
Extra subgrade excavation (pit drains). Excess ponding (2.5-feet) can bypass soil to gravel trench and pit drains.
MCCA1 (2013)
Weathered Till
Perched (Interflow)
At grade 0.01 AC: 200
ft2 2.2:1
0.15 0.01 299 69% 2 (lateral)
Yes
Bioretention system built over preserved weathered soil horizon.
MCCA2 (2013)
At grade with some utility line
cut/fill
0.01 AC: 200 ft2
2.2:1 0.15 0.142* 286 5% 0.4 (lateral)
Bioretention system built over preserved weathered soil horizon, and utility fill.
NOLL (2010) Till Perched (Interflow) Mostly cut
0.391 AC: 520 ft2
33:1 0.5 0.4 2100 12%
BSM: 60 Native: nil (near
zero)
Yes (under-drain)
Grading removed weathered soil horizon.
ORLA1B (2013) Recessional
Outwash – SAND
Moderate
Cuts of 2 to 4 feet 0.43 AC: 2,424
ft2 7.7:1
4.34 0.338 1924 13% BSM: 25 Native: ~25 No – 100%
infiltration
Conservative “belt and suspenders” design due to high site variability. Overflows to gravel trench, then infiltration trench, then infiltration pond.
ORLA2B (2013)
Cuts of 2 feet, possibly fill in
areas
0.40 AC: 2,775 ft2
6.3:1 4.34 0.679 520 2% Native: 4 to 7
SLP I (2013) Recessional Outwash –
GRAVEL
Deep
Cuts of 4 feet 0.429 AC: 1,100
ft2 17:1
1.5 (set equal to
allowed BSM rate)
0.429 792 4% BSM: 41
Native41+ No – 100%
infiltration Unique geologic unit to southern Puget Sound – Steilacoom gravel unit. SLP J (2013) Cuts of 4 feet 0.618 AC: 1,080
ft2 25:1
0.618 1008 4% BSM: 59
Native: 59+
Bioretention Hydrologic Performance Study
August 28, 2018 Page 15
The intent of this detailed hydrologic monitoring in the study was to provide multiple points of information in the hydrologic response of the overall facility. This enabled cross comparison of the data from each of the points with each other and later with the hydrologic model to confirm an understanding of the overall hydrologic response of the system. With the careful QA/QC procedures used during data collection and review of the data, these data provide the substantiated basis for modeling and understanding of the overall performance of the facilities.
One of the findings appears to be that the contributing areas of the facilities in some cases may be different (either larger or smaller) than the originally designed contributing area. The importance of this point is that the bioretention facility can only perform as designed if the size of the contributing inflow area is correct. It is important to double check the inflow area to ensure that model calculations and site design are accurate for the project site.
4.2 Geotechnical and Hydrogeologic Assessment
Data collected as part of geotechnical and hydrogeologic assessment include key information on the imported BSM and the native subgrade soil and shallow groundwater. Controlled field infiltration rate testing was conducted at each facility. Details are included in Appendices 3 through 9.
Hydrogeologic Setting and Infiltration Performance
The ten bioretention facilities cover a range of geologic settings: four facilities on glaciated upland terrain, five facilities on outwash plains, and one facility in an alluvial valley.
Of the four facilities on glaciated uplands (B145, MCCA 1, MCCA 2, and NOLL), only one (B145) appears to have an infiltration rate that meets or exceeds the design rate. This is also the only glaciated upland site that as part of construction was excavated through the surficial low-permeability glacial till into advance outwash sediments (sands). MCCA 1 and MCCA 2 are situated in a preserved weathered till horizon and uncontrolled fill. We interpret the measured infiltration rates in MCCA1 and MCCA2 as representing lateral infiltration, rather than vertical infiltration. The NOLL facility is located on dense glacial till and was constructed with an underdrain. During infiltration testing at NOLL, we observed that discharge from the underdrain was approximately equal to the inflow into the facility, due to the proximity of the inlet to the outlet. The inflow rapidly soaked through the bioretention soil media and was simultaneously collected by the underdrain. The inflow did not spread out across the surface of the bioretention soil, and instead essentially bypassed into the underdrain.
We observe infiltration systems on glacial till soils behave more as dispersion best management practices (BMPs) rather than infiltration BMPs due to lateral flow components.
Five facilities (SLP I and J, ORLA 1-B and 2-B, and IHS) are located on outwash plain terrain, in sediments generally consisting of gravels or sands. All five outwash plain facilities exceed design infiltration rates. One of the facilities (IHS) was situated above a shallow water table and groundwater mounding in response to inflow was observed. However, the mound did not intersect the bioretention soil or affect infiltration performance at this site due to high aquifer transmissivity. Outwash plains with shallow
Bioretention Hydrologic Performance Study
August 28, 2018 Page 16
groundwater flooding do not meet Ecology requirements for bioretention if groundwater mounding interferes with bioretention infiltration.
One facility (BDP) was located in an alluvial valley, adjacent to Lake Whatcom. Very shallow groundwater is present beneath the facility. At BDP, groundwater mounding occurred in response to inflow, and groundwater intersected the base of the bioretention soil. However, only occasional minimal outflow occurred during the monitoring period. The infiltration rate of this facility can be affected by groundwater mounding due to the shallow groundwater. Additional reduction of the data is necessary to evaluate the reduction in infiltration rate as a result of mounding.
Bioretention Soil
We tested mechanical grain-size distribution and percent organic matter by weight in accordance with American Society for Testing and Materials (ASTM) D422 and D2974, respectively, on samples of bioretention soil mix and native sediment from each site. We also conducted a geotechnical T-probe survey of the facility base to qualitatively assess soil thickness and compaction.
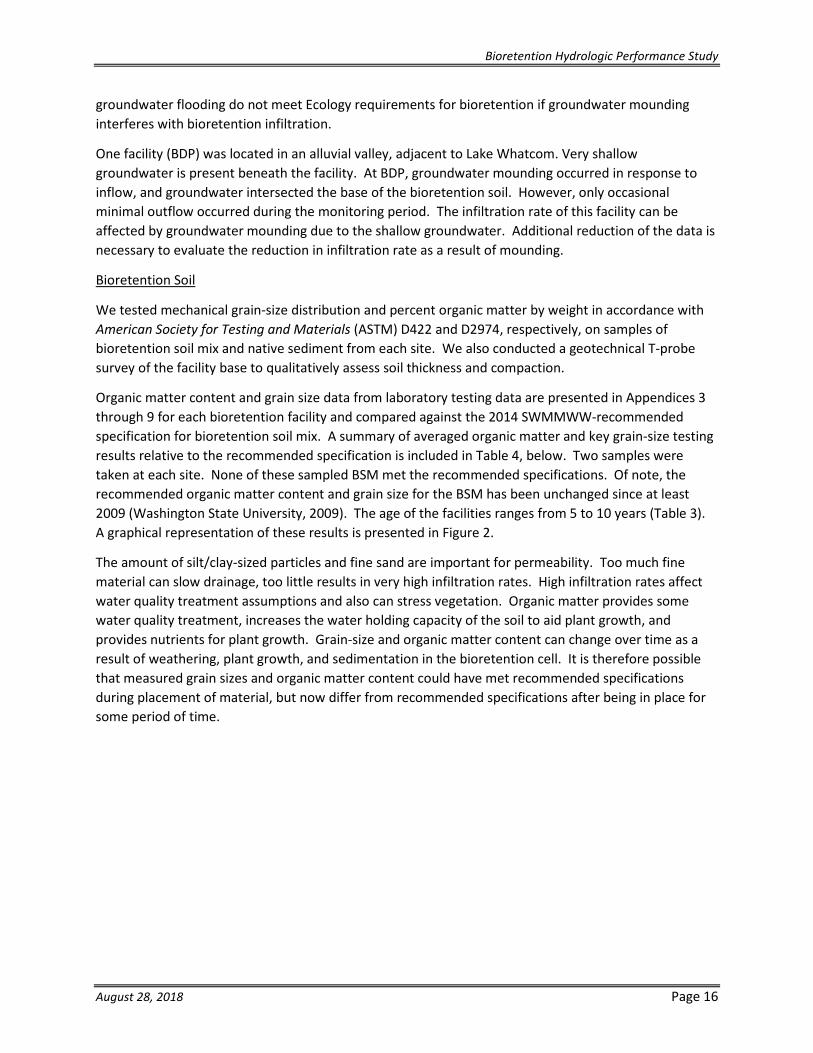
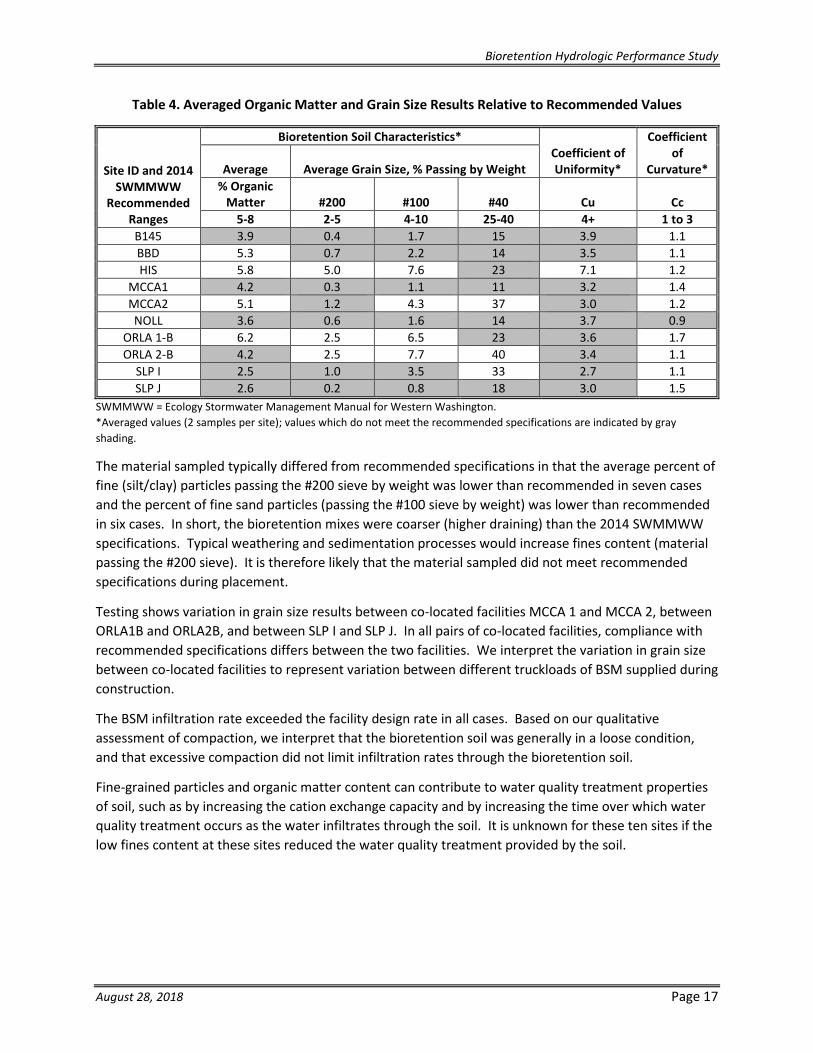
Organic matter content and grain size data from laboratory testing data are presented in Appendices 3 through 9 for each bioretention facility and compared against the 2014 SWMMWW-recommended specification for bioretention soil mix. A summary of averaged organic matter and key grain-size testing results relative to the recommended specification is included in Table 4, below. Two samples were taken at each site. None of these sampled BSM met the recommended specifications. Of note, the recommended organic matter content and grain size for the BSM has been unchanged since at least 2009 (Washington State University, 2009). The age of the facilities ranges from 5 to 10 years (Table 3). A graphical representation of these results is presented in Figure 2.
The amount of silt/clay-sized particles and fine sand are important for permeability. Too much fine material can slow drainage, too little results in very high infiltration rates. High infiltration rates affect water quality treatment assumptions and also can stress vegetation. Organic matter provides some water quality treatment, increases the water holding capacity of the soil to aid plant growth, and provides nutrients for plant growth. Grain-size and organic matter content can change over time as a result of weathering, plant growth, and sedimentation in the bioretention cell. It is therefore possible that measured grain sizes and organic matter content could have met recommended specifications during placement of material, but now differ from recommended specifications after being in place for some period of time.
Bioretention Hydrologic Performance Study
August 28, 2018 Page 17
Table 4. Averaged Organic Matter and Grain Size Results Relative to Recommended Values
Site ID and 2014 SWMMWW
Recommended Ranges
Bioretention Soil Characteristics* Coefficient of Uniformity*
Coefficient of
Curvature* Average Average Grain Size, % Passing by Weight % Organic
Matter #200 #100 #40 Cu Cc 5-8 2-5 4-10 25-40 4+ 1 to 3
B145 3.9 0.4 1.7 15 3.9 1.1 BBD 5.3 0.7 2.2 14 3.5 1.1 HIS 5.8 5.0 7.6 23 7.1 1.2
MCCA1 4.2 0.3 1.1 11 3.2 1.4 MCCA2 5.1 1.2 4.3 37 3.0 1.2 NOLL 3.6 0.6 1.6 14 3.7 0.9
ORLA 1-B 6.2 2.5 6.5 23 3.6 1.7 ORLA 2-B 4.2 2.5 7.7 40 3.4 1.1
SLP I 2.5 1.0 3.5 33 2.7 1.1 SLP J 2.6 0.2 0.8 18 3.0 1.5
SWMMWW = Ecology Stormwater Management Manual for Western Washington. *Averaged values (2 samples per site); values which do not meet the recommended specifications are indicated by grayshading.
The material sampled typically differed from recommended specifications in that the average percent of fine (silt/clay) particles passing the #200 sieve by weight was lower than recommended in seven cases and the percent of fine sand particles (passing the #100 sieve by weight) was lower than recommended in six cases. In short, the bioretention mixes were coarser (higher draining) than the 2014 SWMMWW specifications. Typical weathering and sedimentation processes would increase fines content (material passing the #200 sieve). It is therefore likely that the material sampled did not meet recommended specifications during placement.
Testing shows variation in grain size results between co-located facilities MCCA 1 and MCCA 2, between ORLA1B and ORLA2B, and between SLP I and SLP J. In all pairs of co-located facilities, compliance with recommended specifications differs between the two facilities. We interpret the variation in grain size between co-located facilities to represent variation between different truckloads of BSM supplied during construction.
The BSM infiltration rate exceeded the facility design rate in all cases. Based on our qualitative assessment of compaction, we interpret that the bioretention soil was generally in a loose condition, and that excessive compaction did not limit infiltration rates through the bioretention soil.
Fine-grained particles and organic matter content can contribute to water quality treatment properties of soil, such as by increasing the cation exchange capacity and by increasing the time over which water quality treatment occurs as the water infiltrates through the soil. It is unknown for these ten sites if the low fines content at these sites reduced the water quality treatment provided by the soil.
Bioretention Hydrologic Performance Study
August 28, 2018 Page 18
Figure 2. Graphical Representation of the Grain-Size Composition of BSM Samples Collected at Each of the Ten Facilities Studied. “Specs.” illustrate recommended gradation in the 2014 SWMMWW.
Bioretention Hydrologic Performance Study
August 28, 2018 Page 19
4.3 Vegetation Monitoring
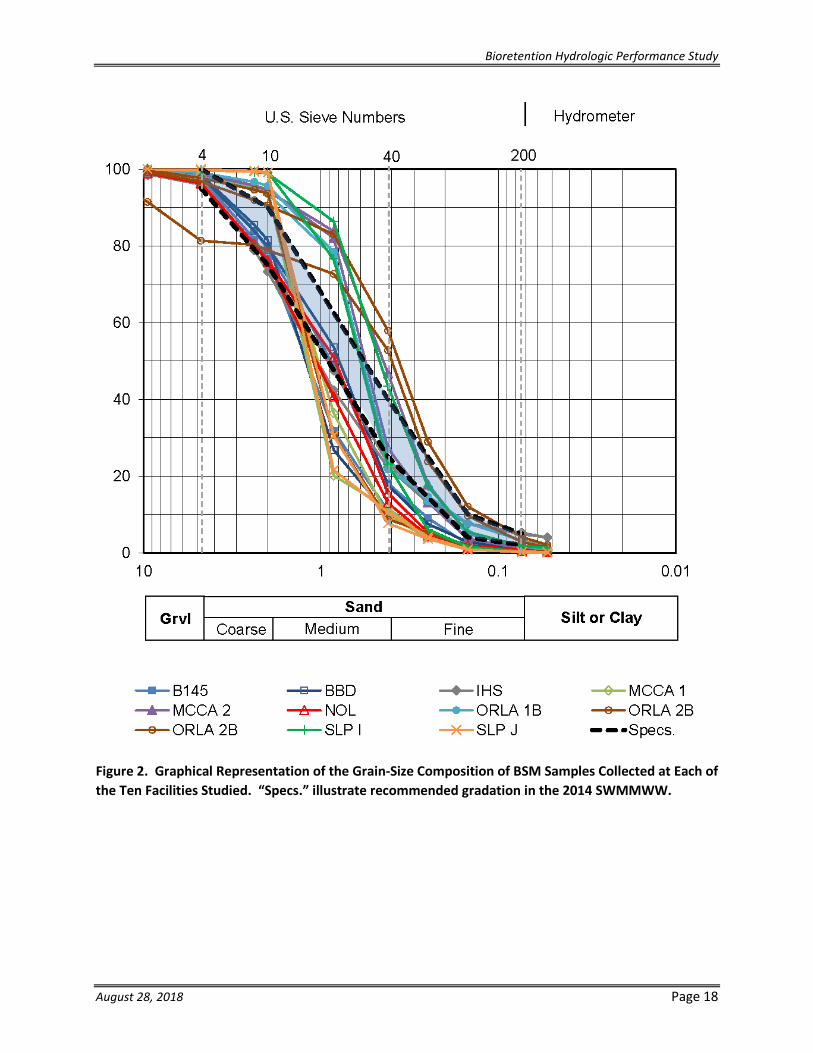
Overall, shrubs thrived well in the bioretention cells, and have high survival rates. Many common shrubs observed in the bioretention cells are red-osier dogwood (native and non-native varieties), native ninebarks, Douglas spireas, black twinberry, and the non-native dwarf arctic blue willow. The red-osier dogwoods provide the most stem density within the cells, since they tend to branch low.
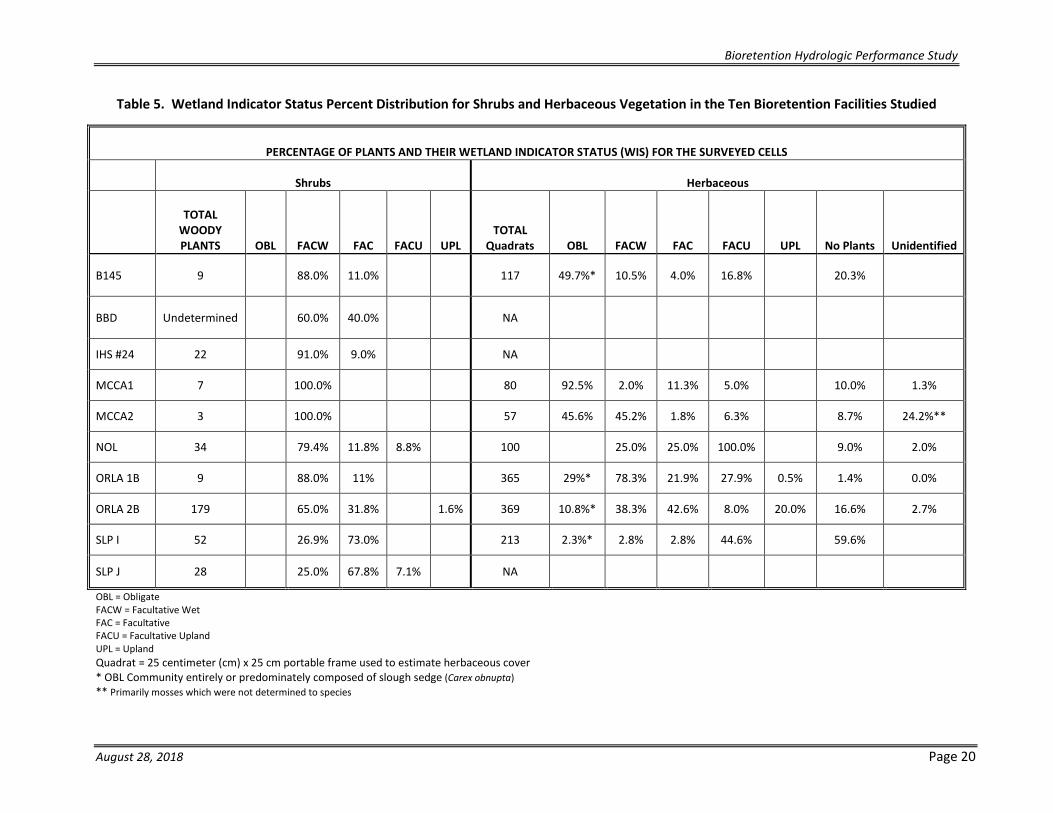
The plants identified in the ten facilities were categorized by their need for water using a common approach among plant biologists, the wetland indicator status (WIS), even though these bioretention sites are, by definition, not wetlands. This categorization is used to characterize the apparent survival conditions experienced in each of the facilities. Table 5 provides the distribution of the surviving shrubs and herbaceous plants found in the ten facilities. Appendix 10 provides additional detail on the vegetation monitoring.
Most of the shrubs observed tend to have a WIS of facultative or wetter, but native shrubs tend to be very versatile and are able to tolerate the wet winter and withstand drought conditions in the summer. Even in two unirrigated sites, the native shrubs were performing well.
The herbaceous vegetation appears to be less adaptable than the shrubs. Much of the herbaceous vegetation specified on the planting plans are obligate or facultative wetland species. In general, this means intended herbaceous vegetation required prolonged inundation, therefore it did not survive or thrive within the studied bioretention cells. Interestingly, Carex obnupta, slough sedge, an obligate wetland species, appears to be the primary obligate species that survives and even thrives within the facilities observed. The only cells where slough sedge was on the planting plans but not observed or was sparse was in the unirrigated cells. However, the unirrigated cells are maintained by volunteers, so it is possible the volunteers accidently weeded the slough sedge out of the cells.
We documented two cells that were planted with a variety of native herbaceous plants and a variety of landscape plants, such as Golden sedge and corkscrew rush. Our initial impression is that the landscape plants appear to have greater survival rates than the native plants and might be more adaptable to the repeated wet and dry conditions.
Many of the sites’ original planting plans included a variety of less drought-resistant species resulting in apparent low survival rates of these plants. A narrower palette of recommended herbaceous plant species based on observed survival may be beneficial for increased survival rates in future projects and possibly reduced costs of plant material. We recommended bioretention planting plans emphasize planting less obligate and more drought-tolerant species.
Plants play varying roles in a bioretention cell. Stem density is thought to be important, because the movement of stems allows for water movement through a siltier medium. We noted that the dwarf arctic blue willow is an extremely dense shrub which shades out all the vegetation underneath it. Some of the other shrubs, such as dogwood, are more sparse, allowing for herbaceous vegetation to grow around and through the stems, increasing the amount of stems in contact with the soil. In addition, the greater quantity of plants in a cell implies a greater overall root mass in the soils, and research is indicating that roots play an important role in the long-term tilth of the soil, thus maintaining infiltration capacity.
Bioretention Hydrologic Performance Study
August 28, 2018 Page 20
Table 5. Wetland Indicator Status Percent Distribution for Shrubs and Herbaceous Vegetation in the Ten Bioretention Facilities Studied
PERCENTAGE OF PLANTS AND THEIR WETLAND INDICATOR STATUS (WIS) FOR THE SURVEYED CELLS
Shrubs Herbaceous
TOTAL WOODY PLANTS OBL FACW FAC FACU UPL
TOTAL Quadrats OBL FACW FAC FACU UPL No Plants Unidentified
B145 9 88.0% 11.0% 117 49.7%* 10.5% 4.0% 16.8% 20.3%
BBD Undetermined 60.0% 40.0% NA
IHS #24 22 91.0% 9.0% NA
MCCA1 7 100.0% 80 92.5% 2.0% 11.3% 5.0% 10.0% 1.3%
MCCA2 3 100.0% 57 45.6% 45.2% 1.8% 6.3% 8.7% 24.2%**
NOL 34 79.4% 11.8% 8.8% 100 25.0% 25.0% 100.0% 9.0% 2.0%
ORLA 1B 9 88.0% 11% 365 29%* 78.3% 21.9% 27.9% 0.5% 1.4% 0.0%
ORLA 2B 179 65.0% 31.8% 1.6% 369 10.8%* 38.3% 42.6% 8.0% 20.0% 16.6% 2.7%
SLP I 52 26.9% 73.0% 213 2.3%* 2.8% 2.8% 44.6% 59.6%
SLP J 28 25.0% 67.8% 7.1% NA
OBL = Obligate FACW = Facultative Wet FAC = Facultative FACU = Facultative Upland UPL = Upland Quadrat = 25 centimeter (cm) x 25 cm portable frame used to estimate herbaceous cover * OBL Community entirely or predominately composed of slough sedge (Carex obnupta) ** Primarily mosses which were not determined to species
Bioretention Hydrologic Performance Study
August 28, 2018 Page 21
4.4 Hydrologic Modeling Discussion
The field monitoring provided information that was used to create a WWHM2012 model for each of the ten bioretention sites. Dimensions of the bioretention facility (length, width, maximum depth of ponding) and the outlet control structure(s) were field-measured and compared with design drawings, if available. The elevation of the inlets, outlet riser or weir, and the top of the facility were surveyed. The underdrain elevation and outlet diameter was also measured for the one site (NOLL) that had an active underdrain.
The hydrologic monitoring data collection (previously discussed) provided observed/recorded time series data for rainfall, inflow, overflow, groundwater, and ponding at 5-minute intervals for use in the individual site models. The recorded inflow, overflow, groundwater, and ponding data were compared with the WWHM2012’s simulated inflow, overflow, groundwater, and ponding results. Graphical and statistical comparisons of the recorded and simulated data were made.
The geotechnical data collection provided information about the bioretention soil mix found at each of the ten bioretention sites and the native soil infiltration rate, as measured onsite. Because these bioretention sites were designed and constructed before a standard BSM was specified by Ecology it was not expected that any of the soil mixes would meet a specific standard. However, their general soil characteristics, as they related to water movement, provided guidance in the selection of appropriate engineered soil mixes for each of the ten bioretention sites. The native soil infiltration rate was also used in the same way to determine the appropriate infiltration value to include in each model. As will later be discussed, there were sites where groundwater mounding influenced the native soil infiltration rate during the winter months and the input infiltration value was adjusted accordingly to represent these high groundwater periods.
The vegetation data collection was not used directly in the input to the individual site models. However, its potential impact on the hydrologic performance of each site was considered in terms of leaf litter impact on ponding and water infiltrating into the top bioretention soil layer. Also, vegetation influences evapotranspiration from the soil layer. WWHM2012 assumes a standard evapotranspiration rate from the soil that may be dependent based on the type and amount of vegetation.
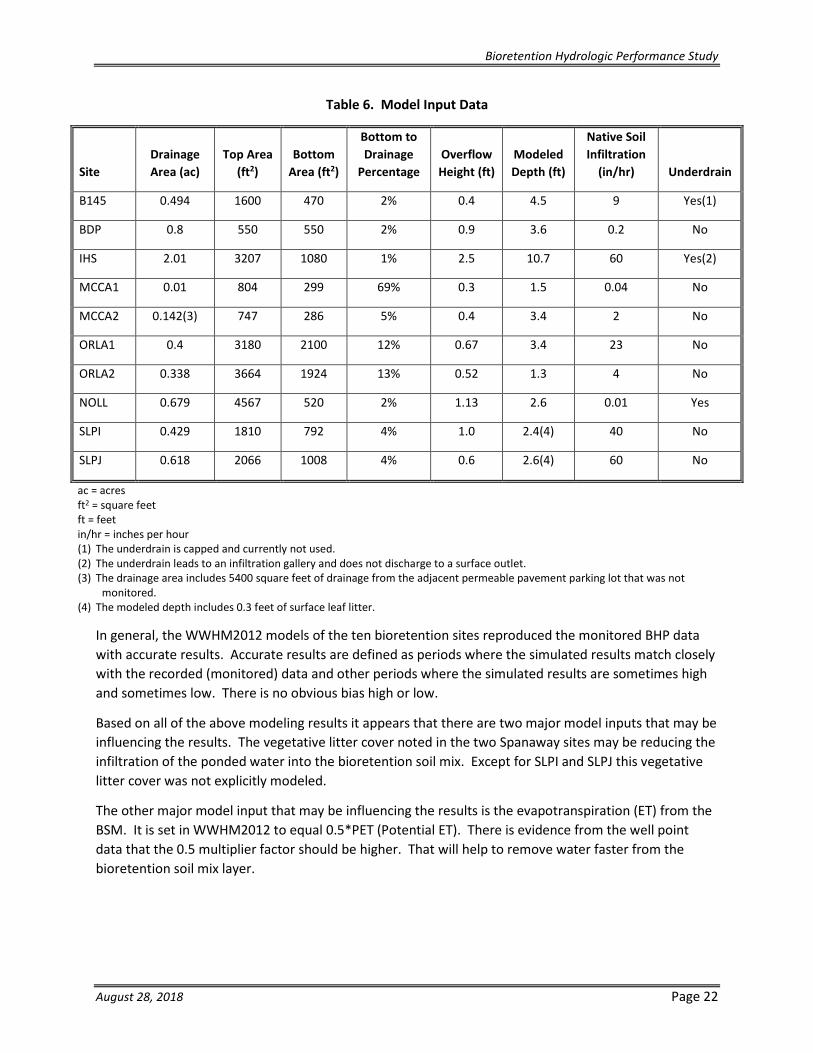
All of the above field data were used in one way or another in either the WWHM2012 model input for each of the ten bioretention sites or evaluating the model output. Table 6 summarizes the model input data.
The hydrologic performance of the ten early-design (pre-2014 SWMMWW) bioretention facilities was well represented by WWHM2012. The range in performance in terms of ponding depths and well point elevations met or exceeded the expected WWHM2012 model results comparison with the monitored data more often than not.
Appendix 11 provides a detailed discussion of the WWHM2012 modeling results and comparison with the monitored data.
Bioretention Hydrologic Performance Study
August 28, 2018 Page 22
Table 6. Model Input Data
Site Drainage Area (ac)
Top Area (ft2)
Bottom Area (ft2)
Bottom to Drainage
Percentage Overflow Height (ft)
Modeled Depth (ft)
Native Soil Infiltration
(in/hr) Underdrain
B145 0.494 1600 470 2% 0.4 4.5 9 Yes(1)
BDP 0.8 550 550 2% 0.9 3.6 0.2 No
IHS 2.01 3207 1080 1% 2.5 10.7 60 Yes(2)
MCCA1 0.01 804 299 69% 0.3 1.5 0.04 No
MCCA2 0.142(3) 747 286 5% 0.4 3.4 2 No
ORLA1 0.4 3180 2100 12% 0.67 3.4 23 No
ORLA2 0.338 3664 1924 13% 0.52 1.3 4 No
NOLL 0.679 4567 520 2% 1.13 2.6 0.01 Yes
SLPI 0.429 1810 792 4% 1.0 2.4(4) 40 No
SLPJ 0.618 2066 1008 4% 0.6 2.6(4) 60 No
ac = acres ft2 = square feet ft = feet in/hr = inches per hour (1) The underdrain is capped and currently not used. (2) The underdrain leads to an infiltration gallery and does not discharge to a surface outlet. (3) The drainage area includes 5400 square feet of drainage from the adjacent permeable pavement parking lot that was not
monitored. (4) The modeled depth includes 0.3 feet of surface leaf litter.
In general, the WWHM2012 models of the ten bioretention sites reproduced the monitored BHP data with accurate results. Accurate results are defined as periods where the simulated results match closely with the recorded (monitored) data and other periods where the simulated results are sometimes high and sometimes low. There is no obvious bias high or low.
Based on all of the above modeling results it appears that there are two major model inputs that may be influencing the results. The vegetative litter cover noted in the two Spanaway sites may be reducing the infiltration of the ponded water into the bioretention soil mix. Except for SLPI and SLPJ this vegetative litter cover was not explicitly modeled.
The other major model input that may be influencing the results is the evapotranspiration (ET) from the BSM. It is set in WWHM2012 to equal 0.5*PET (Potential ET). There is evidence from the well point data that the 0.5 multiplier factor should be higher. That will help to remove water faster from the bioretention soil mix layer.
Bioretention Hydrologic Performance Study
August 28, 2018 Page 23
References
Aspect Consulting. 2018. Bioretention Hydrologic Performance Study - Hydrologic Monitoring Results. June 26, 2018.
Associated Earth Sciences, Inc. 2016. Geotechnical/Soils Assessment Design Data and Current Conditions, Bloedel Donavan Park, Bellingham, Washington. Deliverable 4.5, Site BDP. October 25, 2016.
Associated Earth Sciences, Inc. 2016. Geotechnical/Soils Assessment Design Data and Current Conditions, Issaquah High School, Issaquah, Washington. Deliverable 4.5, Site HIS. October 25, 2016.
Associated Earth Sciences, Inc. 2016. Geotechnical/Soils Assessment Design Data and Current Condition, Mill Creek Community Association, Mill Creek, Washington. Deliverable 4.5, Site MCCA. October 25, 2016.
Associated Earth Sciences, Inc. 2016. Geotechnical/Soils Assessment Design Data and Current Conditions, Noll Roundabout, Poulsbo, Washington. Deliverable 4.5, Site NOLL. October 25, 2016.
Associated Earth Sciences, Inc. 2016. Geotechnical/Soils Assessment Design Data and Current Conditions, Olympia Regional Learning Academy, Thurston County, Washington. Deliverable 4.5, Site ORLA. October 25, 2016.
Associated Earth Sciences, Inc. 2016. Geotechnical/Soils Assessment Design Data and Current Conditions, 145th Place SE and SE 22nd Street Roadway Improvement Project, Bellevue, Washington. Deliverable 4.5, Site B145. October 25, 2016.
Associated Earth Sciences, Inc. 2016. Geotechnical/Soils Assessment Design Data and Current Conditions, Spanaway Lake Park, Pierce County, Washington. Deliverable 4.5, Site SLP. October 25, 2016.
Clear Creek Solutions. WWHM2012 User Manual. February 2016.
Clear Creek Solutions, Inc. 2018 Bioretention Hydrologic Performance Phase II. Deliverable 5.2, Hydrologic Modeling Results. June 26, 2018.
Raedeke Associates, Inc. 2016. Bellingham Bioretention Study - Vegetation Monitoring Methods and Results. October 19, 2016.
Taylor Aquatic Science. 2015. Bioretention Hydrologic Performance (BHP) Study Site Selection Process and List of Selected Sites Technical Memo. Deliverables 2.2 and 2.3 Combined. October 23, 2015.

Bioretention Hydrologic Performance Study
August 28, 2018 Page 24
Washington State Department of Ecology. 2014. 2012 Stormwater Management Manual for Western Washington, as amended in December 2014.
Washington State University, Pierce County Extension. 2009. Technical Memorandum: Bioretention Soil Mix Review and Recommendations for Western Washington. Prepared for Puget Sound Partnership. Prepared by Curtis Hinman WSU Extension Faculty. Laboratory analysis performed by Shannon and Wilson. Compost Specifications provided by David MacDonald Seattle Public Utilities. January 2009.
150387H005-3\Projects\20150387\KH\WP

APPENDICES 1-11
See separate file Bioretention Hydrology Performance Final Report 2018 - Appendices