ion beam imaging in a mass spectrometer using an mcp based
TRANSCRIPT

Journal of Physics Conference Series
OPEN ACCESS
Ion beam imaging in a mass spectrometer usingan MCP based imaging deviceTo cite this article Y Kumar et al 2008 J Phys Conf Ser 114 012052
View the article online for updates and enhancements
You may also likeHigh-voltage measurements on the 5 ppmrelative uncertainty level with collinearlaser spectroscopyJ Kraumlmer K Koumlnig Ch Geppert et al
-
Simulation and Optimization of the OpticalProperties of an Einzel lensR T Abdulla and O A Hussein
-
Determination of Radionuclides and HeavyElements in the Rising Dust in the SmallSide of Diwaniyah City due to theMovement of Wheels and CarsK H Obayes K H Mahdi R M Nassif et al
-
This content was downloaded from IP address 177385147 on 27112021 at 0312
Ion Beam Imaging in a Mass Spectrometer Using an MCP based Imaging Device
Yogesh Kumar Rajender K Bhatia S N Bindal T K Saha E RavisankarP Abhichandani V Natarajusup1 and V K Handu
Vacuum Physics amp Instrumentation Division VPID BARC Mumbai
Email vogiralabarcgovin
Abstract The application of ion beam imaging devices in mass spectrometers is proving to be very useful for validating the ion optical designs An attempt has been made to image the ion beam in mass spectrometer at two different locations ndash the first location is before the magnetic analyzer and the second one is at the final collector positions Experimental results of beam imaging studies under varying beam conditions and with or without einzel lenses will be presented Results of simulation studies of ion optics in the same mass spectrometer using commercial software will also be discussed Experiments with a movable strip type collector at first location give to estimate the beam dimensions are also discussed
1 Introduction Mass spectrometers with sector field magnetic analysers are routinely used for the high precision and accurate isotope ratio measurements The ion beam generated in the ion source most often either an electron impact (EI) or a thermal ionization (TI) source is accelerated to a few keV before being subjected to the magnetic field and finally detected using a faraday cup Ideally one would expect a narrow ribbon of the ion beam to reach the collector without any physical spread However the transmission of ions through the ion optical elements like focusing lenses and magnetic field is associated with many aberrations like chromatic spherical etc These aberrations influence the final shape of the beam and the net effect is a broader beam at the collector Correction methods are employed to minimise the effects of these aberrations and improve the focusing to obtain the desired instrumental sensitivity resolution and abundance sensitivity Use of stable electrical supplies reduces chromatic aberrations caused by the energy spread of the beam where as reduction of spherical aberration is accomplished by containing the divergence of the beam entering the magnetic analyser to within plusmn 050 by placing an aperture at the entrance of the magnet But this has a deleterious effect of obstructing the peripheral ions thereby limiting the overall transmission Ion optical elements in a mass spectrometer are designed using commercial software packages and SIMION [1] is the most popular among them This package is useful to arrive at an optimum geometry for the ion optical element for efficient transport of the ion beam through this element under varying input conditions However these designs have to be experimentally validated before incorporating them into the mass spectrometer Conventional methods of beam profiling are generally either indirect or time consuming With the recent availability of commercial imaging devices the imaging and profiling of low energy ion beams has become more realistic Application of such devices during design and development stages of a mass spectrometer greatly reduces the product development time This paper presents a case study conducted on an existing thermal ionization mass spectrometer
International Symposium on ldquoVacuum Science and Technologyrdquo (IVS 2007) IOP PublishingJournal of Physics Conference Series 114 (2008) 012052 doi1010881742-65961141012052
ccopy 2008 IOP Publishing Ltd 1
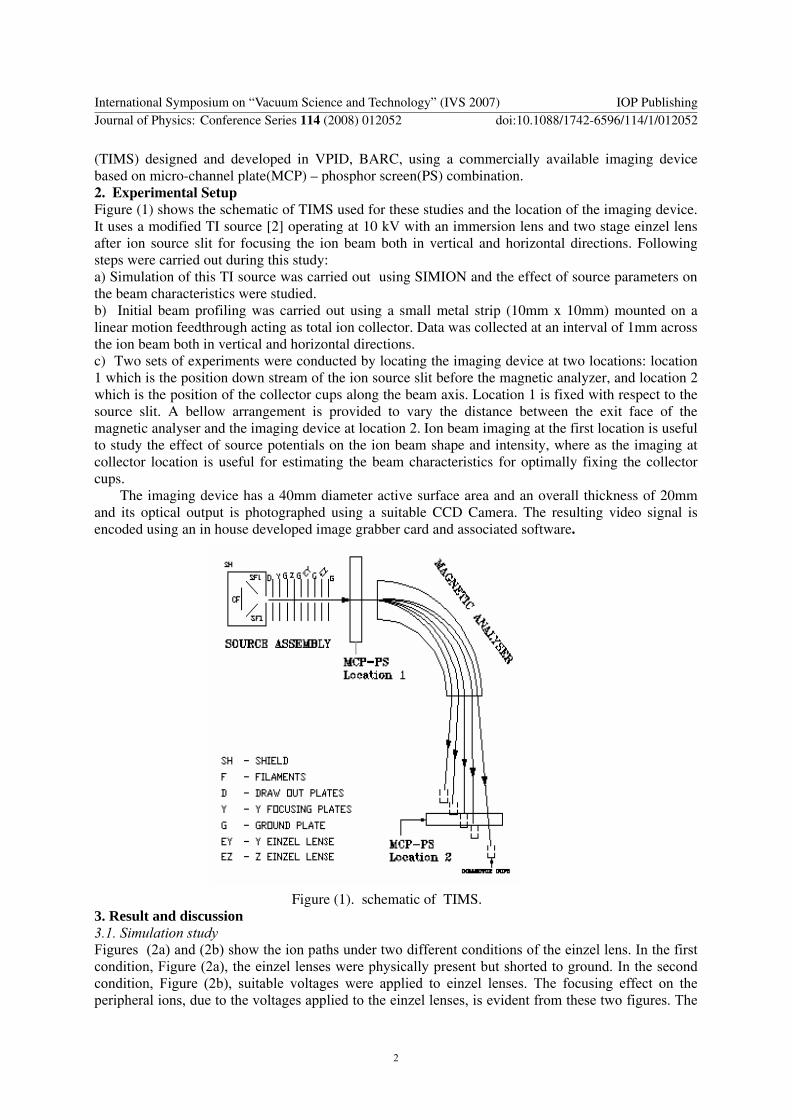
(TIMS) designed and developed in VPID BARC using a commercially available imaging device based on micro-channel plate(MCP) ndash phosphor screen(PS) combination 2 Experimental Setup Figure (1) shows the schematic of TIMS used for these studies and the location of the imaging device It uses a modified TI source [2] operating at 10 kV with an immersion lens and two stage einzel lens after ion source slit for focusing the ion beam both in vertical and horizontal directions Following steps were carried out during this study a) Simulation of this TI source was carried out using SIMION and the effect of source parameters on the beam characteristics were studied b) Initial beam profiling was carried out using a small metal strip (10mm x 10mm) mounted on a linear motion feedthrough acting as total ion collector Data was collected at an interval of 1mm across the ion beam both in vertical and horizontal directions c) Two sets of experiments were conducted by locating the imaging device at two locations location 1 which is the position down stream of the ion source slit before the magnetic analyzer and location 2 which is the position of the collector cups along the beam axis Location 1 is fixed with respect to the source slit A bellow arrangement is provided to vary the distance between the exit face of the magnetic analyser and the imaging device at location 2 Ion beam imaging at the first location is useful to study the effect of source potentials on the ion beam shape and intensity where as the imaging at collector location is useful for estimating the beam characteristics for optimally fixing the collector cups The imaging device has a 40mm diameter active surface area and an overall thickness of 20mm and its optical output is photographed using a suitable CCD Camera The resulting video signal is encoded using an in house developed image grabber card and associated software
Figure (1) schematic of TIMS 3 Result and discussion 31 Simulation study Figures (2a) and (2b) show the ion paths under two different conditions of the einzel lens In the first condition Figure (2a) the einzel lenses were physically present but shorted to ground In the second condition Figure (2b) suitable voltages were applied to einzel lenses The focusing effect on the peripheral ions due to the voltages applied to the einzel lenses is evident from these two figures The
International Symposium on ldquoVacuum Science and Technologyrdquo (IVS 2007) IOP PublishingJournal of Physics Conference Series 114 (2008) 012052 doi1010881742-65961141012052
2
central portion of the ion beam seen in Figure (2b) is uniformly dark over a wide region compared to that seen in Figure (2a) As will be shown later this gives an enhanced overall sensitivity
Figure (2a) Simulated ion beam with grounded einzel lenses
Figure (2b) Simulated ion beam with voltage on einzel lenses
32 Ion beam profiling by metallic strip The metallic strip was very useful for profiling the ion beam and the observations from the simulation studies were experimentally verified through this exercise Figure (3) shows the ion beam profile obtained with the metal strip without and with voltages applied to the einzel lenses The profile with einzel lenses having potential applied has less intensity in the tail portion and lower slope in the high intensity (central region of the beam) region as compared with that of grounded einzel lenses This is because with potential applied to einzel lenses the peripheral ions (tail portion of the profile) get focused inward thereby increasing the overall intensity of the ion beam in the central zone This helps in getting enhanced system sensitivity (~30 more) at the collectors
Figure (3) Ion beam profile at the entry of the analyzing magnetic field using a metallic strip
International Symposium on ldquoVacuum Science and Technologyrdquo (IVS 2007) IOP PublishingJournal of Physics Conference Series 114 (2008) 012052 doi1010881742-65961141012052
3
33 Imaging and profile study with MCP-PS 331 Device at location 1 Figure (4a) and (4b) show the images of the ion beam from TI source at about 300 mm from the source defining slit It is evident from these figures that the beam is more intense and converged with voltages on einzel lenses The corresponding profiles of the beam are shown in Figures (5a) and (5b) which give the numerical values for the beam dimensions(FWHM) and intensity The images of the beam at various accelerating potentials were also recorded and beam dimensions were measured at this position of the imaging device Table 1 presents this data It is clear from the table that higher accelerating voltage (higher energy of the beam) increases the ion intensity
Figure (4a) Ion beam profile at the entry of Figure (4b) Ion beam profile at the entry of
the analyzing magnetic field with grounded the analysing magnetic field with voltage einzel lens on einzel lens
Figure (5a) Ion beam profile at position 1 Figure (5b) Ion beam profile at position 1 (grounded einzel lens) (with voltage on einzel lens) Table 1
Accelerating voltage
Grounded einzel lens With voltage on einzel lens
Beam width in mm
(At 5FWHM)
Beam height
(At 5FWHM
)
Beam intensity
(arb Units)
Beam width in mm
(At 5FWHM)
Beam height
(At 5FWHM
)
Beam intensity
(arb Units)
3kV 7646 1065 120 6424 1078 145 4kV 8641 1065 150 7337 1179 180 5kV 9149 10173 165 7038 11586 195 6kV 85549 1163 195 7741 11282 215 7kV 8249 1268 220 7241 11286 235
International Symposium on ldquoVacuum Science and Technologyrdquo (IVS 2007) IOP PublishingJournal of Physics Conference Series 114 (2008) 012052 doi1010881742-65961141012052
4
332 Device at location 2 Though einzel lenses help in improving the overall transmission there is a chance that they introduce a marginal shift in the final focusing position of the beam at the collectors This shift can be taken care of by making minor adjustments in the position of the collector Table 2 shows the variations of the beam width with the position of the MCP along the ion beam This data helps in determining the final position of the collector cup so as to detect finely focused beam Table 3 shows the variation in the beam width with the exit angle of the analyzing magnetic field Using this data one can decide the exact angle for the given position of the collector Data shown in Table 4 reveals the improved transmission with increase in accelerating potential
Table 2 Table 3 Table 4 S No
MCP position along the beam
Beam Width (at 5 of
peak intensity)
S No
Exit angle
(degree)
Beam width (at 5 of
peak intensity)
S No
Accelerating Voltage
Intensity
in mm in mm in mm kV pixel 1 595 077 1 265 102 1 3 444 2 600 075 2 26 091 2 4 532 3 605 075 3 255 083 3 5 684 4 610 074 4 25 078 4 6 72 5 615 068 5 245 067 6 620 06 6 24 06 7 625 069 7 235 075 8 630 075 8 23 078 9 635 077 9 225 087
10 640 08 10 22 099 11 645 082 11 215 111 12 650 086
Imaging of ion beams of seven Neodymium isotopes was also carried out and is shown in Figure 6 From this figure it can be seen that the resolution of the mass spectrometer (mm) is adequate to clearly separate all the isotopes Thus it can be concluded that capturing the images of the ion beams helps in determining the inter cup separation in the final configuration of the multi collector mass spectrometer Presently five faraday cups are incorporated at the locations of optimum focal point each corresponding to the ion beam of a particular isotope
Figure (6) Ion beam images of Neodymium isotopes at location 2
International Symposium on ldquoVacuum Science and Technologyrdquo (IVS 2007) IOP PublishingJournal of Physics Conference Series 114 (2008) 012052 doi1010881742-65961141012052
5
Sources of error in the data MCP with phosphor screen has enough electron current before the screen to produce the space charge effect which can broaden the apparent beam size This effect has not been taken into consideration while collecting the data on beam size Hence the actual beam size may be less than the measured one 4 Conclusion The imaging device (MCP-PS) has proved to be a very useful tool in determining the ion beam profile in the mass spectrometer to ascertain the various design parameters of the instrument like beam size collector position and the exit angle of the analyzing magnetic field The experimental results obtained indicate that there is a definite improvement in overall sensitivity when einzel lenses with appropriate voltages are incorporated in the system 5 Acknowledgements Authors wish to thank DrV C Sahni Director Physics Group and DrS Kailas Associate Director Physics Group (N) BARC for their encouragement keen interest and support for this work They also wish to thank Shri SKLalwani Electronics Division BARC for providing the image grabber card and software for this work Reference [1] D A Dahl ldquoSIMION Version 70 ldquo Idaho National Engineering Laboratory 2000 [2] Indigenous Development of Mass Spectrometers Part1 - Development Of Magnetic Sector
Instruments With EI And TI Source S N Bindal etal Proceedings of Workshop cum Symposium ISMAS-2007 Goa
International Symposium on ldquoVacuum Science and Technologyrdquo (IVS 2007) IOP PublishingJournal of Physics Conference Series 114 (2008) 012052 doi1010881742-65961141012052
6

Ion Beam Imaging in a Mass Spectrometer Using an MCP based Imaging Device
Yogesh Kumar Rajender K Bhatia S N Bindal T K Saha E RavisankarP Abhichandani V Natarajusup1 and V K Handu
Vacuum Physics amp Instrumentation Division VPID BARC Mumbai
Email vogiralabarcgovin
Abstract The application of ion beam imaging devices in mass spectrometers is proving to be very useful for validating the ion optical designs An attempt has been made to image the ion beam in mass spectrometer at two different locations ndash the first location is before the magnetic analyzer and the second one is at the final collector positions Experimental results of beam imaging studies under varying beam conditions and with or without einzel lenses will be presented Results of simulation studies of ion optics in the same mass spectrometer using commercial software will also be discussed Experiments with a movable strip type collector at first location give to estimate the beam dimensions are also discussed
1 Introduction Mass spectrometers with sector field magnetic analysers are routinely used for the high precision and accurate isotope ratio measurements The ion beam generated in the ion source most often either an electron impact (EI) or a thermal ionization (TI) source is accelerated to a few keV before being subjected to the magnetic field and finally detected using a faraday cup Ideally one would expect a narrow ribbon of the ion beam to reach the collector without any physical spread However the transmission of ions through the ion optical elements like focusing lenses and magnetic field is associated with many aberrations like chromatic spherical etc These aberrations influence the final shape of the beam and the net effect is a broader beam at the collector Correction methods are employed to minimise the effects of these aberrations and improve the focusing to obtain the desired instrumental sensitivity resolution and abundance sensitivity Use of stable electrical supplies reduces chromatic aberrations caused by the energy spread of the beam where as reduction of spherical aberration is accomplished by containing the divergence of the beam entering the magnetic analyser to within plusmn 050 by placing an aperture at the entrance of the magnet But this has a deleterious effect of obstructing the peripheral ions thereby limiting the overall transmission Ion optical elements in a mass spectrometer are designed using commercial software packages and SIMION [1] is the most popular among them This package is useful to arrive at an optimum geometry for the ion optical element for efficient transport of the ion beam through this element under varying input conditions However these designs have to be experimentally validated before incorporating them into the mass spectrometer Conventional methods of beam profiling are generally either indirect or time consuming With the recent availability of commercial imaging devices the imaging and profiling of low energy ion beams has become more realistic Application of such devices during design and development stages of a mass spectrometer greatly reduces the product development time This paper presents a case study conducted on an existing thermal ionization mass spectrometer
International Symposium on ldquoVacuum Science and Technologyrdquo (IVS 2007) IOP PublishingJournal of Physics Conference Series 114 (2008) 012052 doi1010881742-65961141012052
ccopy 2008 IOP Publishing Ltd 1
(TIMS) designed and developed in VPID BARC using a commercially available imaging device based on micro-channel plate(MCP) ndash phosphor screen(PS) combination 2 Experimental Setup Figure (1) shows the schematic of TIMS used for these studies and the location of the imaging device It uses a modified TI source [2] operating at 10 kV with an immersion lens and two stage einzel lens after ion source slit for focusing the ion beam both in vertical and horizontal directions Following steps were carried out during this study a) Simulation of this TI source was carried out using SIMION and the effect of source parameters on the beam characteristics were studied b) Initial beam profiling was carried out using a small metal strip (10mm x 10mm) mounted on a linear motion feedthrough acting as total ion collector Data was collected at an interval of 1mm across the ion beam both in vertical and horizontal directions c) Two sets of experiments were conducted by locating the imaging device at two locations location 1 which is the position down stream of the ion source slit before the magnetic analyzer and location 2 which is the position of the collector cups along the beam axis Location 1 is fixed with respect to the source slit A bellow arrangement is provided to vary the distance between the exit face of the magnetic analyser and the imaging device at location 2 Ion beam imaging at the first location is useful to study the effect of source potentials on the ion beam shape and intensity where as the imaging at collector location is useful for estimating the beam characteristics for optimally fixing the collector cups The imaging device has a 40mm diameter active surface area and an overall thickness of 20mm and its optical output is photographed using a suitable CCD Camera The resulting video signal is encoded using an in house developed image grabber card and associated software
Figure (1) schematic of TIMS 3 Result and discussion 31 Simulation study Figures (2a) and (2b) show the ion paths under two different conditions of the einzel lens In the first condition Figure (2a) the einzel lenses were physically present but shorted to ground In the second condition Figure (2b) suitable voltages were applied to einzel lenses The focusing effect on the peripheral ions due to the voltages applied to the einzel lenses is evident from these two figures The
International Symposium on ldquoVacuum Science and Technologyrdquo (IVS 2007) IOP PublishingJournal of Physics Conference Series 114 (2008) 012052 doi1010881742-65961141012052
2
central portion of the ion beam seen in Figure (2b) is uniformly dark over a wide region compared to that seen in Figure (2a) As will be shown later this gives an enhanced overall sensitivity
Figure (2a) Simulated ion beam with grounded einzel lenses
Figure (2b) Simulated ion beam with voltage on einzel lenses
32 Ion beam profiling by metallic strip The metallic strip was very useful for profiling the ion beam and the observations from the simulation studies were experimentally verified through this exercise Figure (3) shows the ion beam profile obtained with the metal strip without and with voltages applied to the einzel lenses The profile with einzel lenses having potential applied has less intensity in the tail portion and lower slope in the high intensity (central region of the beam) region as compared with that of grounded einzel lenses This is because with potential applied to einzel lenses the peripheral ions (tail portion of the profile) get focused inward thereby increasing the overall intensity of the ion beam in the central zone This helps in getting enhanced system sensitivity (~30 more) at the collectors
Figure (3) Ion beam profile at the entry of the analyzing magnetic field using a metallic strip
International Symposium on ldquoVacuum Science and Technologyrdquo (IVS 2007) IOP PublishingJournal of Physics Conference Series 114 (2008) 012052 doi1010881742-65961141012052
3
33 Imaging and profile study with MCP-PS 331 Device at location 1 Figure (4a) and (4b) show the images of the ion beam from TI source at about 300 mm from the source defining slit It is evident from these figures that the beam is more intense and converged with voltages on einzel lenses The corresponding profiles of the beam are shown in Figures (5a) and (5b) which give the numerical values for the beam dimensions(FWHM) and intensity The images of the beam at various accelerating potentials were also recorded and beam dimensions were measured at this position of the imaging device Table 1 presents this data It is clear from the table that higher accelerating voltage (higher energy of the beam) increases the ion intensity
Figure (4a) Ion beam profile at the entry of Figure (4b) Ion beam profile at the entry of
the analyzing magnetic field with grounded the analysing magnetic field with voltage einzel lens on einzel lens
Figure (5a) Ion beam profile at position 1 Figure (5b) Ion beam profile at position 1 (grounded einzel lens) (with voltage on einzel lens) Table 1
Accelerating voltage
Grounded einzel lens With voltage on einzel lens
Beam width in mm
(At 5FWHM)
Beam height
(At 5FWHM
)
Beam intensity
(arb Units)
Beam width in mm
(At 5FWHM)
Beam height
(At 5FWHM
)
Beam intensity
(arb Units)
3kV 7646 1065 120 6424 1078 145 4kV 8641 1065 150 7337 1179 180 5kV 9149 10173 165 7038 11586 195 6kV 85549 1163 195 7741 11282 215 7kV 8249 1268 220 7241 11286 235
International Symposium on ldquoVacuum Science and Technologyrdquo (IVS 2007) IOP PublishingJournal of Physics Conference Series 114 (2008) 012052 doi1010881742-65961141012052
4
332 Device at location 2 Though einzel lenses help in improving the overall transmission there is a chance that they introduce a marginal shift in the final focusing position of the beam at the collectors This shift can be taken care of by making minor adjustments in the position of the collector Table 2 shows the variations of the beam width with the position of the MCP along the ion beam This data helps in determining the final position of the collector cup so as to detect finely focused beam Table 3 shows the variation in the beam width with the exit angle of the analyzing magnetic field Using this data one can decide the exact angle for the given position of the collector Data shown in Table 4 reveals the improved transmission with increase in accelerating potential
Table 2 Table 3 Table 4 S No
MCP position along the beam
Beam Width (at 5 of
peak intensity)
S No
Exit angle
(degree)
Beam width (at 5 of
peak intensity)
S No
Accelerating Voltage
Intensity
in mm in mm in mm kV pixel 1 595 077 1 265 102 1 3 444 2 600 075 2 26 091 2 4 532 3 605 075 3 255 083 3 5 684 4 610 074 4 25 078 4 6 72 5 615 068 5 245 067 6 620 06 6 24 06 7 625 069 7 235 075 8 630 075 8 23 078 9 635 077 9 225 087
10 640 08 10 22 099 11 645 082 11 215 111 12 650 086
Imaging of ion beams of seven Neodymium isotopes was also carried out and is shown in Figure 6 From this figure it can be seen that the resolution of the mass spectrometer (mm) is adequate to clearly separate all the isotopes Thus it can be concluded that capturing the images of the ion beams helps in determining the inter cup separation in the final configuration of the multi collector mass spectrometer Presently five faraday cups are incorporated at the locations of optimum focal point each corresponding to the ion beam of a particular isotope
Figure (6) Ion beam images of Neodymium isotopes at location 2
International Symposium on ldquoVacuum Science and Technologyrdquo (IVS 2007) IOP PublishingJournal of Physics Conference Series 114 (2008) 012052 doi1010881742-65961141012052
5
Sources of error in the data MCP with phosphor screen has enough electron current before the screen to produce the space charge effect which can broaden the apparent beam size This effect has not been taken into consideration while collecting the data on beam size Hence the actual beam size may be less than the measured one 4 Conclusion The imaging device (MCP-PS) has proved to be a very useful tool in determining the ion beam profile in the mass spectrometer to ascertain the various design parameters of the instrument like beam size collector position and the exit angle of the analyzing magnetic field The experimental results obtained indicate that there is a definite improvement in overall sensitivity when einzel lenses with appropriate voltages are incorporated in the system 5 Acknowledgements Authors wish to thank DrV C Sahni Director Physics Group and DrS Kailas Associate Director Physics Group (N) BARC for their encouragement keen interest and support for this work They also wish to thank Shri SKLalwani Electronics Division BARC for providing the image grabber card and software for this work Reference [1] D A Dahl ldquoSIMION Version 70 ldquo Idaho National Engineering Laboratory 2000 [2] Indigenous Development of Mass Spectrometers Part1 - Development Of Magnetic Sector
Instruments With EI And TI Source S N Bindal etal Proceedings of Workshop cum Symposium ISMAS-2007 Goa
International Symposium on ldquoVacuum Science and Technologyrdquo (IVS 2007) IOP PublishingJournal of Physics Conference Series 114 (2008) 012052 doi1010881742-65961141012052
6