iol - agri-réseau : le savoir et l’expertise du réseau ... · 6,740 (14 ) 5,150 ... 80% 90%...
TRANSCRIPT

Content (3rd session)
Organic profile - Ecobalance (LCA)
• Intensity levels of organic dairy farming
• LCA of agriculture in Hamburg
• LCA dairy grassland farming in southern Germany
Soil and plant nutrition adapted to organic agriculture:
European developments
Guido Haas
28 30 Novembre 2006 Cégep de Victoriaville, Victoriaville, Quebec, Canada SÉMINAIRE: Les sols et la nutrition végétale adaptée à l'agriculture biologique
Développements européen et américain
Organic AgroExpertise Consultancy www.agroexpertise.de www.iol.unibonn.de
IOL
Institute of Organic Agriculture University of Bonn

Organic dairy demonstration farm "Haus Riswick"
State extension agency NRW
IOL Institut für Organischen Landbau
Universität Bonn
10.100
Conventional
Comparison
9.400 8.200 7.400
Organic farming conversion
7.500 Milk kg/cow*yr
Conventional
Year
18 13 9 Concentrate dt/ cow*yr
4.800 4.800 5.000 kg/ cow*yr Milk roughage
9.770 9.700 FPCM
Profil - Leitbild
=> Organic dairy performance can be as high as conventional,
=> if high amounts of concentrates are fed.
2003 2003 2002 2001 2000
=> Is there a difference to conventional? Organic profile?
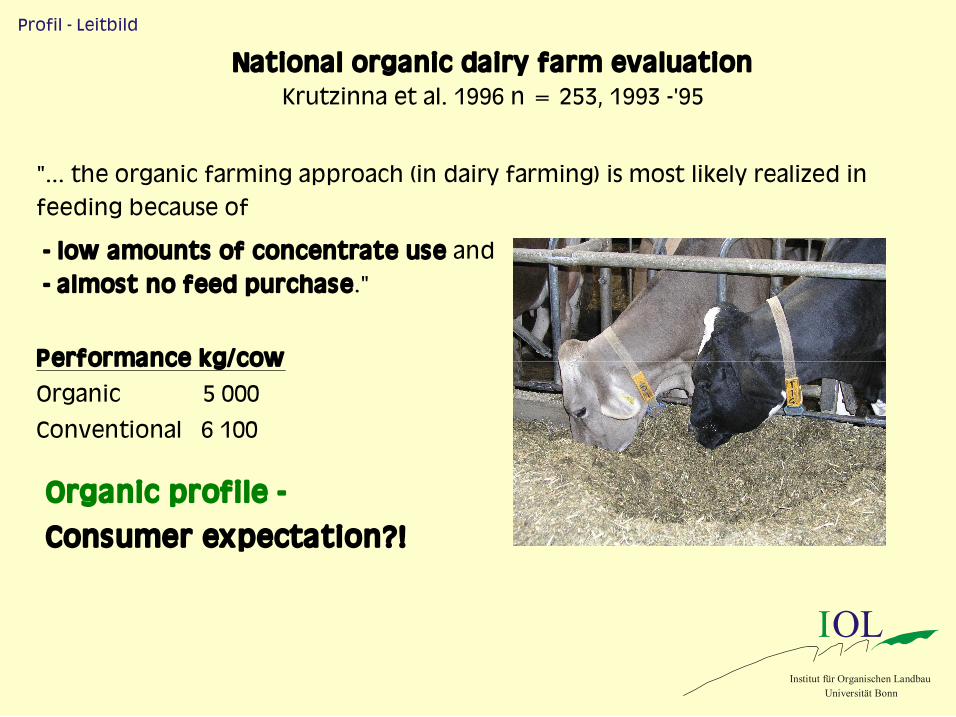
National organic dairy farm evaluation Krutzinna et al. 1996 n = 253, 1993 -'95
"... the organic farming approach (in dairy farming) is most likely realized in feeding because of
- low amounts of concentrate use and - almost no feed purchase."
Performance kg/cow
Organic 5 000
Conventional 6 100
Organic profile -
Consumer expectation?!
Profil - Leitbild
IOL Institut für Organischen Landbau
Universität Bonn

ÖkoMiB I Impact of feeding pattern and feed purchase on dairy performance and nutrient balances of organic farms
Förderung im Rahmen des Bundesprogramms Ökologischer Landbau des Bundesministeriums für Verbraucherschutz, Ernährung und Landwirtschaft
IOL Institut für Organischen Landbau
Universität Bonn Haas et al. 2006/2007: Livestock Science

Characteristics of the analysed organic dairy farms in two regions in Germany (North-Rhine Westphalia; Allgeau)
(mean, coefficient of variation [%] in parenthesis, range underneath)
23.2 (14) 14.4 38.5
26.0 (27) 14.4 45.5
Annual replacement rate [%]
29.2 (47) 19.1 45.5
6,325 (12) 5,150 7,460
1.55 (17) 1.06 1.96
48 (35) 25 75
83 (20) 42 100
53 (43) 25 109
Allgaeu n = 14
7,220 (13) 5,300 8,790
1.14 (26) 0.77 1.77
71 (45) 42 153
52 (19) 31 88
116 (59) 63 320
NRW n = 12
6,740 (14) 5,150 8,790
1.35 (25) 0.77 1.96
59 (46) 25 153
69 (25) 31 100
81 (70) 25 320
All farms n = 26
Annual milk yield 3) [kg cow 1 ]
Stocking 2) rate
[LU ha 1 ]
Herd size [no. of dairy
cows]
Proportion of grassland 1)
[%]
Farmed area [ha]
1) Almost all of it permanent grassland 2) LU livestockunit (each 500 kg live weight) including replacement stock. 3) Standardised fat and protein corrected milk (FPCM):
4.0% fat and 3.4% protein which is very close to average.
ÖkoMiB I
IOL Institut für Organischen Landbau
Universität Bonn Haas et al. 2006/2007: Livestock Science
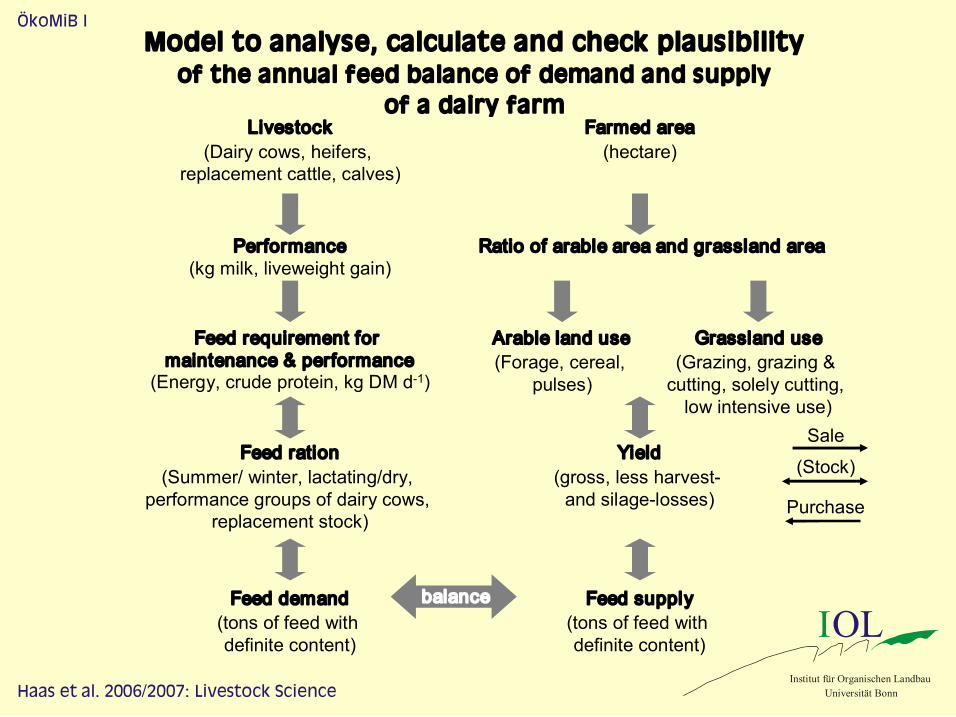
Performance (kg milk, liveweight gain)
Feed ration (Summer/ winter, lactating/dry,
performance groups of dairy cows, replacement stock)
Feed demand (tons of feed with definite content)
Livestock (Dairy cows, heifers,
replacement cattle, calves)
Feed requirement for maintenance & performance
(Energy, crude protein, kg DM d 1 )
Ratio of arable area and grassland area
Yield (gross, less harvest and silagelosses)
Feed supply (tons of feed with definite content)
Farmed area (hectare)
balance
Sale
Purchase
(Stock)
Arable land use (Forage, cereal,
pulses)
Grassland use (Grazing, grazing & cutting, solely cutting, low intensive use)
Model to analyse, calculate and check plausibility of the annual feed balance of demand and supply
of a dairy farm
ÖkoMiB I
IOL Institut für Organischen Landbau
Universität Bonn Haas et al. 2006/2007: Livestock Science

Proportion of feed type of total milk yield
0%
10%
20%
30%
40%
50%
60%
70%
80%
90%
100%
5.3 6.4 6.6 6.7 6.8 7.0 7.3 7.4 7.9 7.9 8.5 8.8 5.2 5.4 5.6 5.6 5.8 6.1 6.2 6.4 6.4 6.7 7.2 7.2 7.3 7.5
Concentrates Grass pellets Succulent feed Roughage
Milk yield [in 1,000 kg FPCM cow 1 yr 1 ]
NordrhineWestphalia Allgaeu
Proportion of feed type on energy basis [NEL MJ] of total milk yield
0%
10%
20%
30%
40%
50%
60%
70%
80%
90%
100%
ÖkoMiB I
IOL Institut für Organischen Landbau
Universität Bonn Haas et al. 2006/2007: Livestock Science
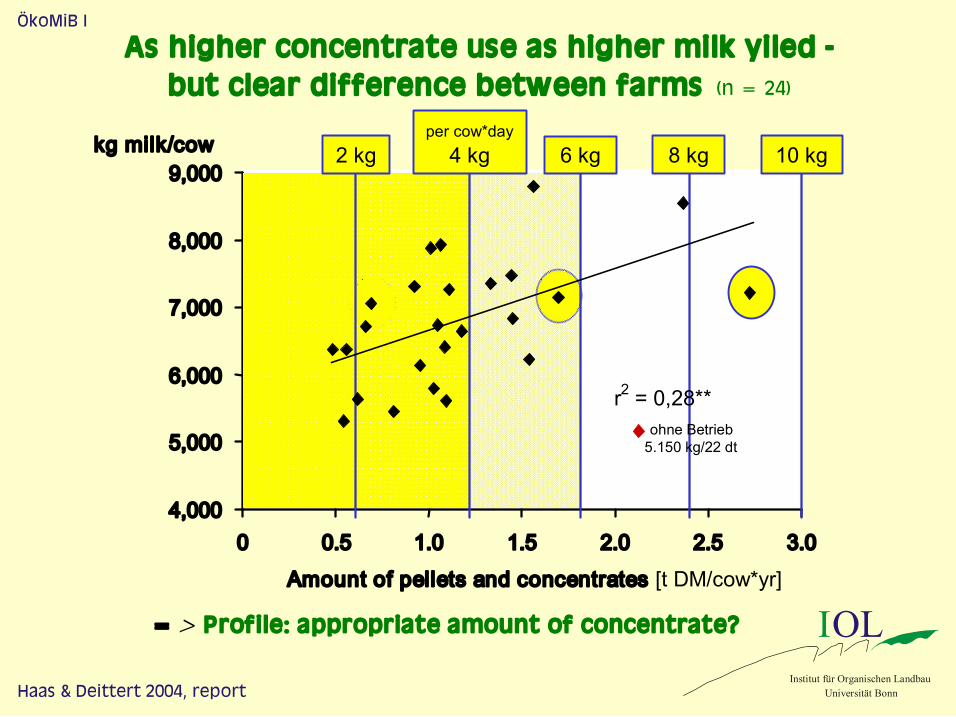
As higher concentrate use as higher milk yiled - but clear difference between farms (n = 24)
IOL Institut für Organischen Landbau
Universität Bonn
Amount of pellets and concentrates [t DM/cow*yr]
4,000
5,000
6,000
7,000
8,000
0 1.0 1.5 2.0 2.5 3.0 0.5
Haas & Deittert 2004, report
9,000 kg milk/cow
=> Profile: appropriate amount of concentrate?
6 kg per cow*day 4 kg 2 kg 8 kg 10 kg
ÖkoMiB I
r 2 = 0,28** ohne Betrieb 5.150 kg/22 dt

As higher milk from purchased feed as higher total milk performance- but farm variation is high (n = 24)
IOL Institut für Organischen Landbau
Universität Bonn
r 2 = 0,28**
4,000
5,000
6,000
7,000
8,000
9,000
0 500 1,000 1,500 2,000 2,500
Milk from purchased feed [kg FPCM/cow*yr]
kg milk/cow
ÖkoMiB I
Haas et al. 2006/2007: Livestock Science

Milk from purchased feed of organic dairy farms in two regions in Germany (n=26), mean, range underneath
IOL Institut für Organischen Landbau
Universität Bonn Haas et al. 2006/2007: Livestock Science
900 0 2.300
kg FPCM / cow*yr
Milch from purchased feed (concentrate/ succulent feed)
1.500 50 3.700
kg FPCM / cow*yr
Milk from concentrates and succulent feed
26 farms Unit
13% 0 27%
Proportion of milk from feed purchase of total milk yield
65% 0 100%
Proportion of milk from feed purchase of milk from concentrate & succulent feed
5.800 4.500 7.300
kg FPCM / cow*yr
Milk from homegrown feed
ÖkoMiB I
=> Up to ¼ of milk from purchased feed: Profile home-grown feed? Low external input?

0.11 0 0.32
0.85 0.46 1.44
0.96 0.60 1.52
6,968 4,237 10,186
Mean (coefficient of variation) Range
Offfarm area
Farm area Total area
Feed acreage per cow [ha cow 1 ]
Milk per acreage [kg FPCM ha 1 ]
Milk yield and feed acreage of organic dairy farms in two regions in Germany (n = 26)
Haas et al. 2006/2007: Livestock Science
IOL Institut für Organischen Landbau
Universität Bonn
ÖkoMiB I

R² = 0.61 p < 0.001
3,500
4,500
5,500
6,500
7,500
8,500
9,500
10,500
3,500 4,500 5,500 6,500 7,500 8,500 9,500 10,500
Milk yield organic farming [kg cow 1 yr 1 ]
Milk yield conventional farming [kg cow 1 yr 1 ]
Relationship between milk yield of organic and conventional dairy
farming in comparison studies in several European countries
Haas et al. 2006/2007: Livestock Science
IOL Institut für Organischen Landbau
Universität Bonn
ÖkoMiB I

Schema of a extended (including N 2 fixation) farm gate nutrient balance
Output
Livestock produce (milk, animals) Crops (cash crops, forage)
Input
Symbiotic N 2 fixation of legume crops Purchase of feed Straw for bedding, cattle, fertiliser seed potatoes
Annual area related farm gate nutrient balance [kg ha 1 farmed area] (rounded, mean, coefficient of variation [%] (in parenthesis), range underneath)
P
Input Output Balance
4.4(67) 0 10
7.2(33) 4 16
2.8(129 ) 14 4
K
Input Output Balance
10.3 (64) 0 20
9.4(38) 5 21
0.8(905 ) 13 15
N
Input Output Balance
All farms
n = 26
78(29) 43 125
35(22) 20 51
43 (51) 8 85
NPK balances ÖkoMiBI
IOL Institute of Organic Agriculture
University of Bonn
NPK-farmgate balances of 26 organic dairy farms in two regions
Haas et al. 2007, RAFS

Phosphorus balance: share [%] of input and output components
Output Milk Cash
crops Animals
75 (19) 29 90
8 (206) 0 65
17 (32) 6 30
Input Feed Straw Animals /
seed potatoes
All farms n = 26
86 (29) 2 100
11 (224) 0 98
2 (174) 0 15
Input N2fixation Feed Straw/ animals/
seed potatoes
All farms n = 26
72 (23) 34 100
25 (68) 0 58
3 (203) 0 26
Output Milk Cash
crops Animals
79 (15) 38 92
7 (192) 0 55
14 (31) 7 24
Nitrogen balance: share [%] of input and output components (rounded, mean,coefficient of variation [%] in parenthesis, range underneath)
NPK balances ÖkoMiBI
IOL Institute of Organic Agriculture
University of Bonn
NPK-farmgate balances of 26 organic dairy farms in two regions
=> Up to 58% of external N input - Profile almost closed inner farm nutrient cycle?
Haas et al. 2007, RAFS
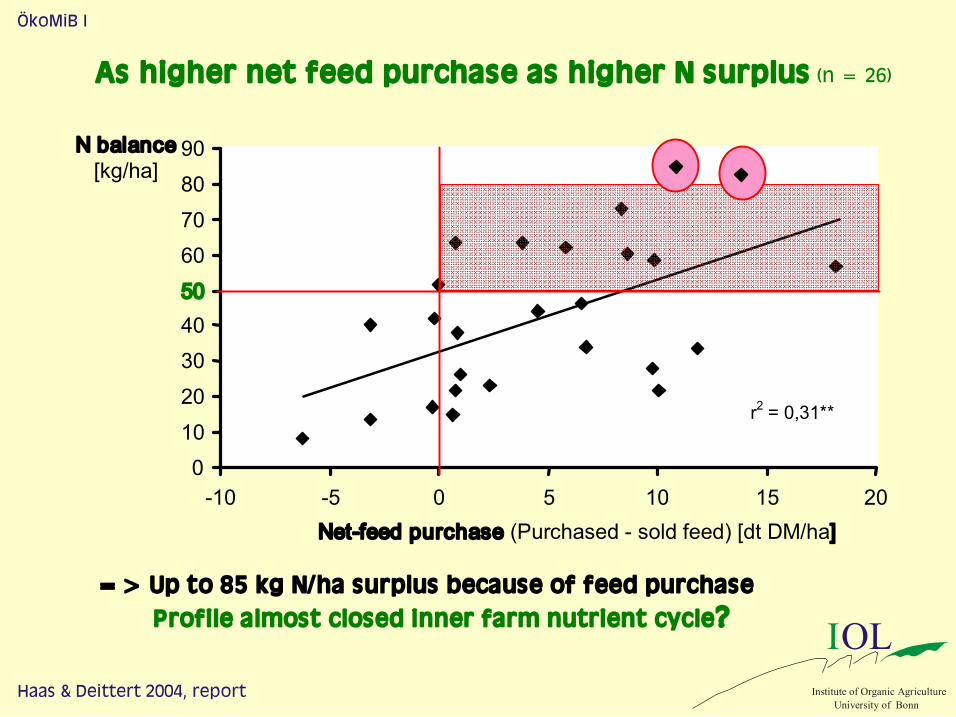
As higher net feed purchase as higher N surplus (n = 26)
Haas & Deittert 2004, report
r 2 = 0,31**
0 10
20
30 40 50
60 70
80
90
10 5 0 5 10 15 20 Netfeed purchase (Purchased sold feed) [dt DM/ha]
N balance [kg/ha]
ÖkoMiB I
=> Up to 85 kg N/ha surplus because of feed purchase Profile almost closed inner farm nutrient cycle? IOL
Institute of Organic Agriculture University of Bonn

Reported N surplus of organic and conventional dairy farms in Europe (Haas et al. 2007)
237 kg ha 1 7,837 kg milk
153 kg ha 1 8,073 kg milk
102 kg ha 1 7,350 kg milk
11 / 91 / 91 8) Smolders and Wagenaar 43 Beldman et al. 44 ; Netherland 7)
253 kg ha 1 8,450 kg milk
101 kg ha 1 6,930 kg milk
Transition of research farm
Veer 41 & Pinxterhuis et al. 42 Netherlands: 1997 conv. 2000 org.
258 kg ha 1 8,000 kg milk
90 kg ha 1 5,717 kg milk
Field scale experiment
Leach and Roberts 40 Scotland (1989 )1996 1998
174 kg ha 1 7,764 kg milk
112 kg ha 1 7,764 kg milk
104 kg ha 1 6,958 kg milk
133 / 93 / 212 6) on sandy soil
Kristensen 32 Denmark 2002
221 kg ha 1 8,200 kg milk
103 kg ha 1 5,600 kg milk
14 / 16 pilot farms
Halberg et al. 23 Denmark 19891991
158 kg ha 1 10,100 kg milk
114 kg ha 1 9,130 kg milk
71 kg ha 1 9,400 kg milk
6 / 8 5) / 9 Cederberg and Flysjoe 38 , p.19 Sweden (southwest) 2002
90 kg ha 1 8,038 kg milk
27 kg ha 1 7,892 kg milk
Field scale experiment
Jonsson 37 4) Sweden (northeast) 1990 2001
37 kg ha 1 6,100 kg milk
25 kg ha 1 4,650 kg milk
24 kg ha 1 4,710 kg milk
40 / 51 / 66 Taube and Poetsch 31 Austria
146 kg ha 1 6,900 kg milk
77 kg ha 1 6,660 kg milk
56 kg ha 1 5,300 kg milk
7 / 10 /[10+29] Scheringer 21 , p. 28 Lower Saxony 3) 1998/99
80 kg ha 1 6,760 kg milk
31 kg ha 1 6,390 kg milk
31 kg ha 1 5,280 kg milk
6 each Haas et al. 18 Bavarian Allgaeu 3) 1998
43 kg ha 1 6,740 kg milk
26 Presented study RW and Allgaeu 3) 2001/02
Conventional mainstream
Conventional optimised 2)
Organic Number of farms
Reference, region/country and year of investigation if reported

• Milk yield as high as conventional possible, if feeding particular concentrate use is similar.
Conclusion: Productivity and profile
organic dairy farming
• Optimizing conventional farms can result in similar performance, e.g. N balance: differentiation?
• Intensification in organic dairy farming must be considered carefully.
ÖkoMiB I
IOL Institute of Organic Agriculture
University of Bonn

References Dairy Haas, G., C. Deittert 2005: Stoffflußanalyse und Produktionseffizienz der Milchviehhaltung unterschiedlich intensiv oekologisch wirtschaftender Betriebe (Nutrient matter flow analyses and productivity of organic dairy farms at different intensity levels, research report). Projektbericht Bundesprogramms Oekologischer Landbau, 73 p.
Haas, G., C. Deittert, U. Koepke 2006/2007: Impact of feeding pattern and feed purchase on area and cow related dairy performance of organic farms. Livestock Science, online available, paper version in press.
Haas, G., C. Deittert, U. Koepke 2007: Farm gate nutrient balances of organic dairy farms at different intensity levels in Germany. Renewable Agriculture and Food Systems, in press.
Haas, G., U. Geier, B. Frieben, U. Koepke: Improving environmental impact by converting to organic farming in a rural area of the city of Hamburg: a scenario using the LifeCycleAssessment method. submitted.

For any further question do not hesitate to contact me:
Dr. Guido Haas
Email: [email protected]
www.agroexpertise.de (may check for more information,downloads, links)
Institute of Organic Agriculture (Head: Prof. Dr. Ulich Koepke)
University of Bonn
Katzenburgweg 3
D-53115 Bonn
Germany
www.iol.uni-bonn.de
Email: [email protected]