investors’ seminar september 2011. disclaimer this is not advice. please see mark before...
Post on 20-Dec-2015
214 views
TRANSCRIPT
Investors’ Seminar
September 2011
Disclaimer
This is not Advice. Please see Mark before considering any changes. Mark will put any recommendations in writing
The information contained in this presentation has been prepared for general use only and does not take into
account your personal investment objectives, financial situation or particular needs. Before you make any decision
about whether to invest in a financial product, you should obtain and consider the Product Disclosure Statement of
the financial product.
The information provided by HFS has been done so in good faith and has been derived from sources believed to be
accurate at the time of compilation. Changes in circumstances, including unlawful interference and unauthorised
tampering, after the date of publication may impact on the accuracy of the information. Neither HFS d nor any
member of HFS accepts responsibility for any inaccuracy or for investment decisions or any other actions taken by
any person on the basis of the information included. Past performance is not a reliable indicator of future
performance.
Neither HFS nor any member of HFS guarantees the performance of the Funds, the repayment of capital or any
particular rate of return. The performance of any unit trust depends on the performance of its underlying investment
which can fall as well as rise and can result in both capital losses and gains. Consequently, due to market influences,
no assurance can be given that all stated objectives will be achieved.

Investors’ SeminarSeptember 2011
Will I achieve my goals?
Will we achieve our goals?
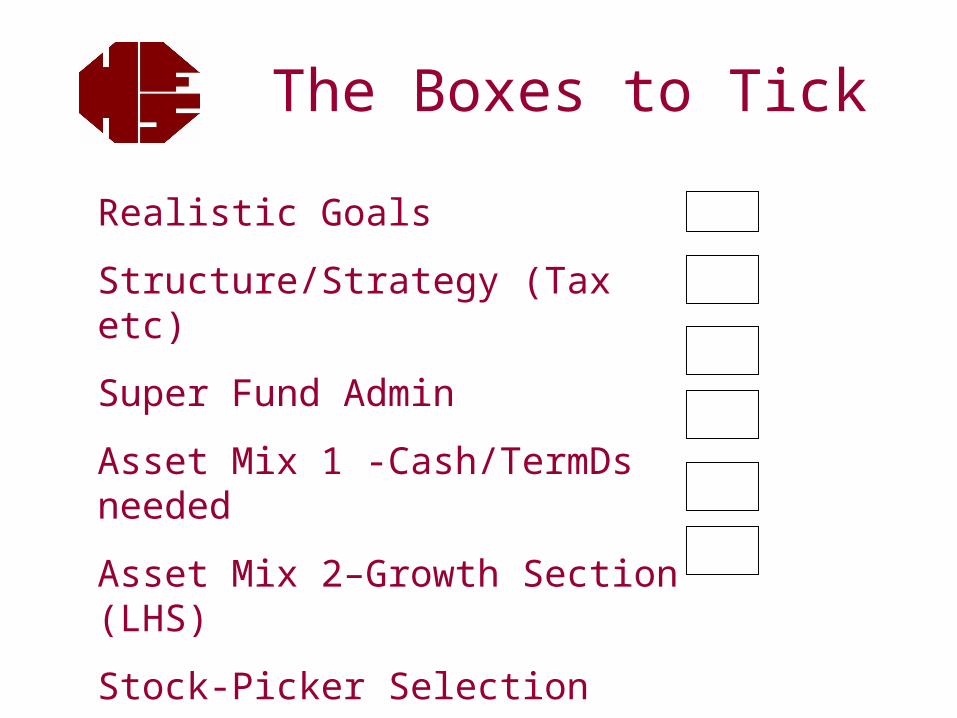
Realistic Goals
Structure/Strategy (Tax etc)
Super Fund Admin
Asset Mix 1 -Cash/TermDs needed
Asset Mix 2–Growth Section (LHS)
Stock-Picker Selection
The Boxes to Tick
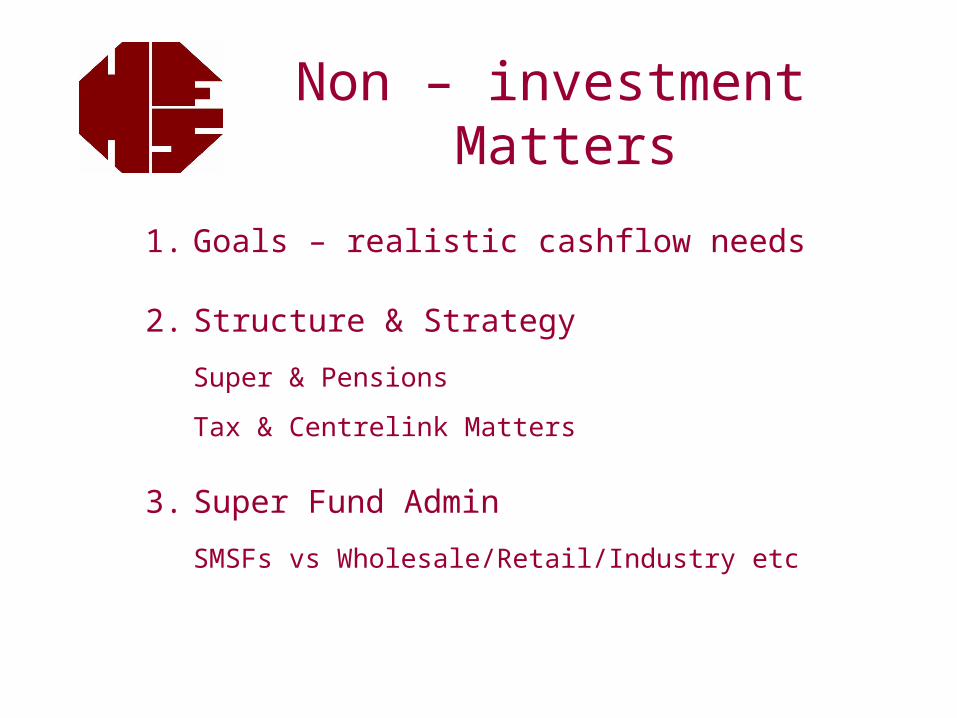
Non – investment Matters
1. Goals – realistic cashflow needs
2. Structure & Strategy
Super & Pensions
Tax & Centrelink Matters
3. Super Fund Admin
SMSFs vs Wholesale/Retail/Industry etc
Investors’ SeminarSeptember 2011
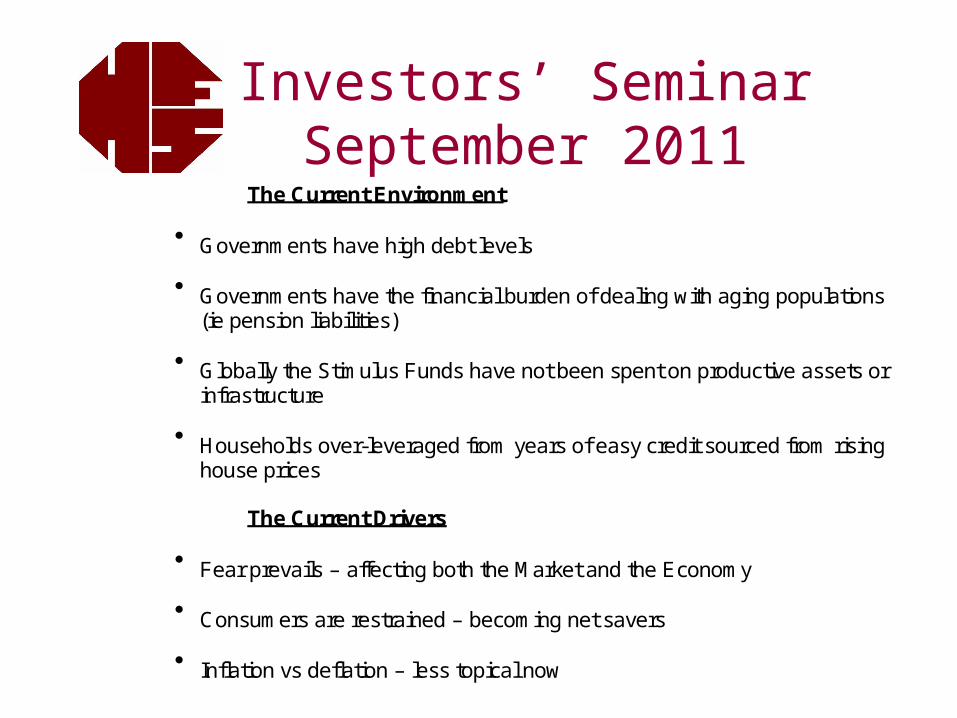
The Current Environment
Governments have high debt levels
Governments have the financial burden of dealing with aging populations (ie pension liabilities)
Globally the Stimulus Funds have not been spent on productive assets or
infrastructure
Households over-leveraged from years of easy credit sourced from rising house prices
The Current Drivers
Fear prevails – affecting both the Market and the Economy
Consumers are restrained – becoming net savers
Inflation vs deflation – less topical now
6 farrelly’s
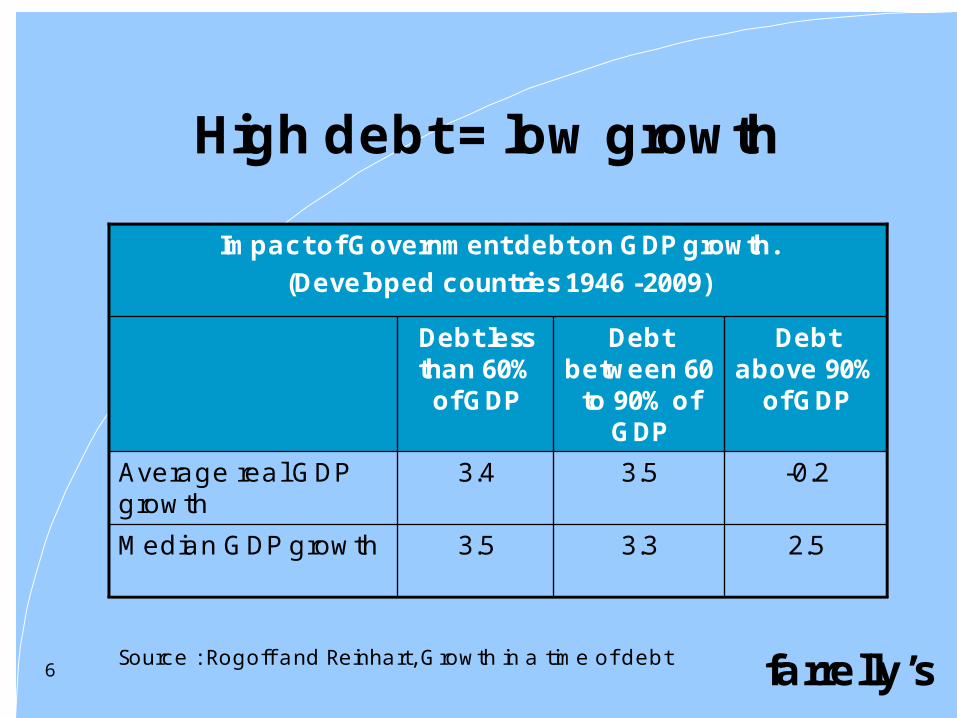
High debt = low growth
Impact of Government debt on GDP growth. (Developed countries 1946 -2009)
2.53.33.5Median GDP growth
-0.23.53.4Average real GDP growth
Debt above 90%
of GDP
Debt between 60 to 90% of
GDP
Debt less than 60% of GDP
Source : Rogoff and Reinhart, Growth in a time of debt
Investors’ SeminarSeptember 2011
Historical Data
Forecasts
Hayden Asset Allocation Model
Specific Investment Selection
Bad case scenarios
Investors’ SeminarSeptember 2011
Historical Data
How far back to go?
Is old “data” relevant in today’s world?
Predictive Data
Theory; Reasoned Rational Approach
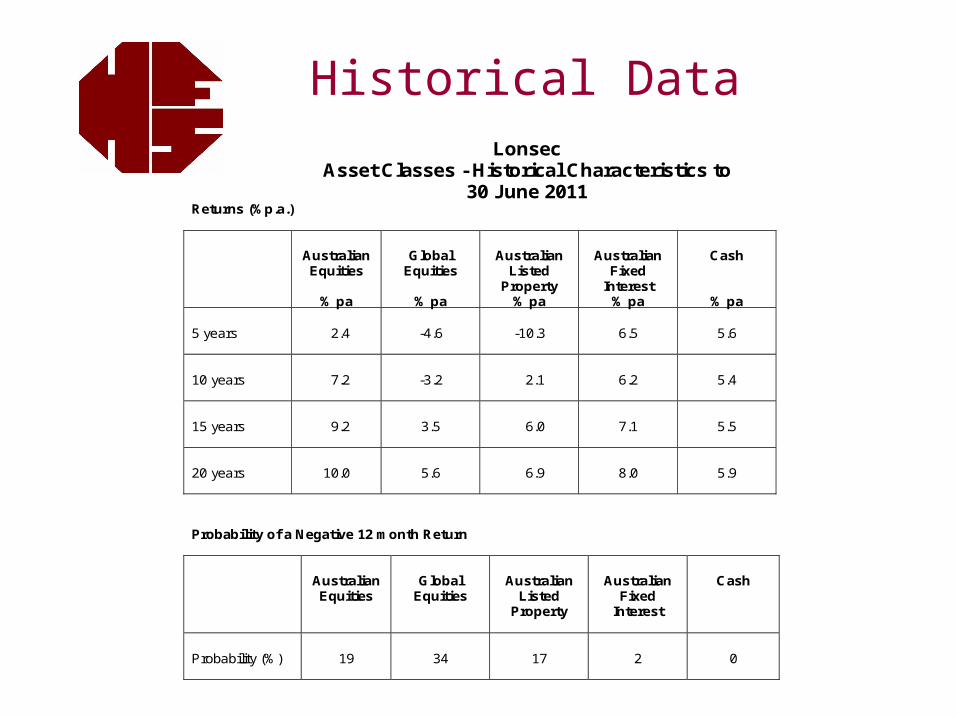
Historical DataLonsec
Asset Classes - Historical Characteristics to 30 June 2011
Returns (%p.a.)
Australian Equities
% pa
Global
Equities
% pa
Australian
Listed Property
% pa
Australian
Fixed Interest
% pa
Cash
% pa 5 years
2.4
-4.6
-10.3
6.5
5.6
10 years
7.2
-3.2
2.1
6.2
5.4
15 years
9.2
3.5
6.0
7.1
5.5
20 years
10.0
5.6
6.9
8.0
5.9
Probability of a Negative 12 month Return
Australian Equities
Global
Equities
Australian
Listed Property
Australian
Fixed Interest
Cash
Probability (%)
19
34
17
2
0
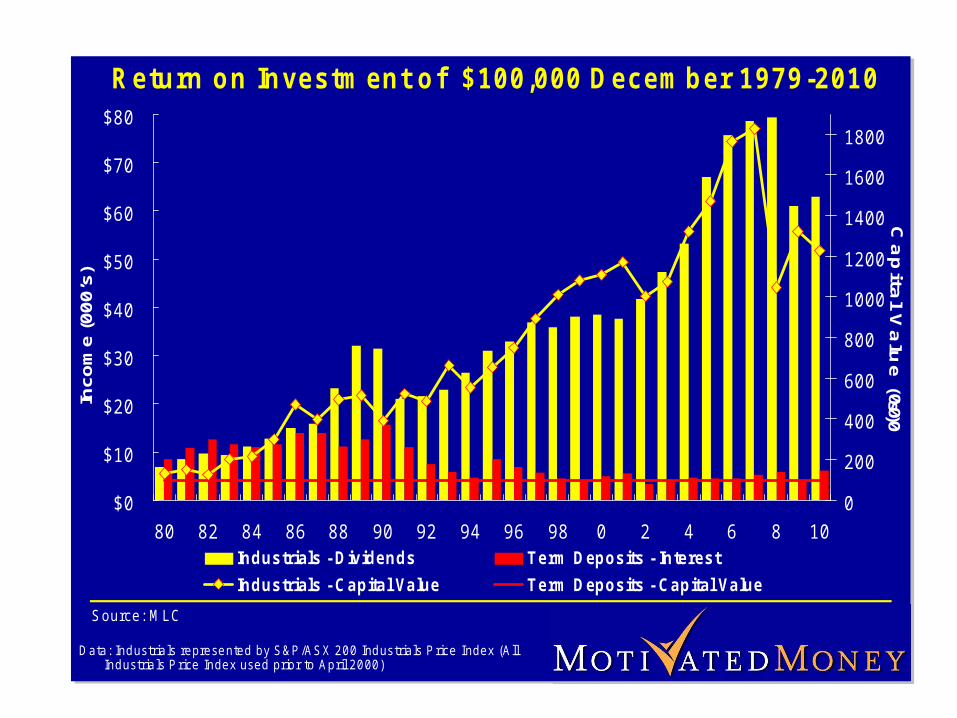
$0
$10
$20
$30
$40
$50
$60
$70
$80
80 82 84 86 88 90 92 94 96 98 0 2 4 6 8 10
0
200
400
600
800
1000
1200
1400
1600
1800
Industrials - D iv idends T erm D eposits - Interest
Industrials - C apita l Value T erm D eposits - Capital Value
R eturn o n In vestm en t o f $100 ,000 D ecem b er 1979 -2010In
com
e (0
00’s
)
S ource : M LC
D ata : Ind ustria ls re prese n ted by S & P /A S X 2 00 Ind us tr ia ls P rice Index (A ll Ind ustria ls P rice Index used prio r to A p ril 20 00 )
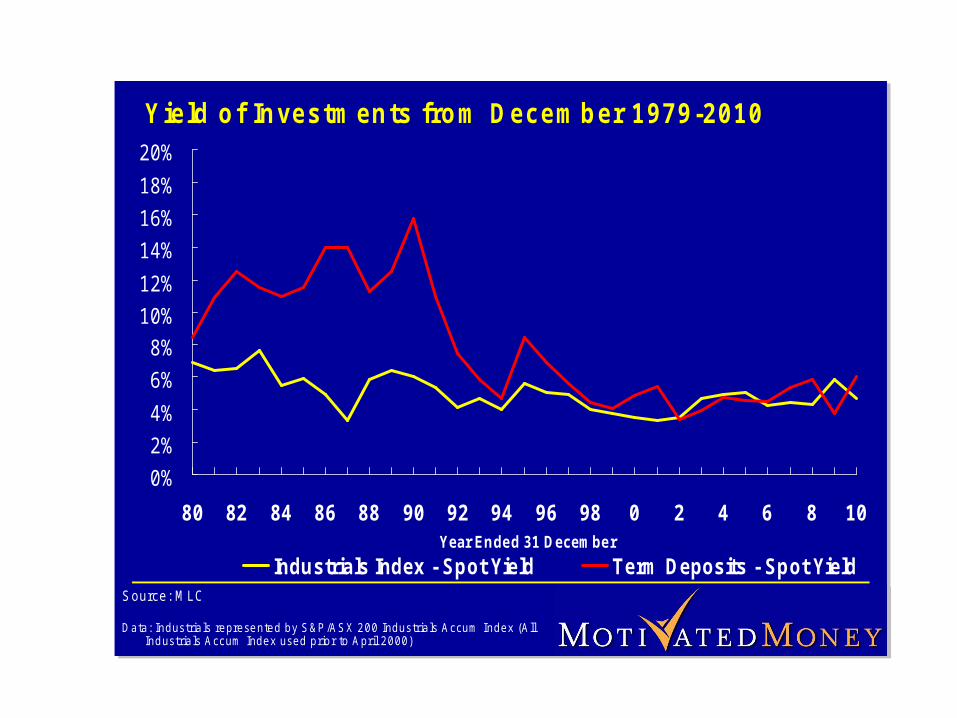
0%
2%
4%
6%
8%
10%
12%
14%
16%
18%
20%
80 82 84 86 88 90 92 94 96 98 0 2 4 6 8 10Year Ended 31 December
Industrials Index - Spot Yield Term Deposits - Spot Yield
Y ie ld o f In ve s tm en ts fro m D e ce m b er 1 9 79 -2 01 0
S ourc e : M L C
D a ta : In d us tria ls re pre se n te d b y S & P /A S X 2 0 0 Ind us tr ia ls A ccu m In d e x (A ll In d us tria ls A cc um Ind e x use d p rio r to A pr il 2 0 0 0 )
TD’s V Shares
Source: RBA, IRESS. Data as at 31 J uly 2011.
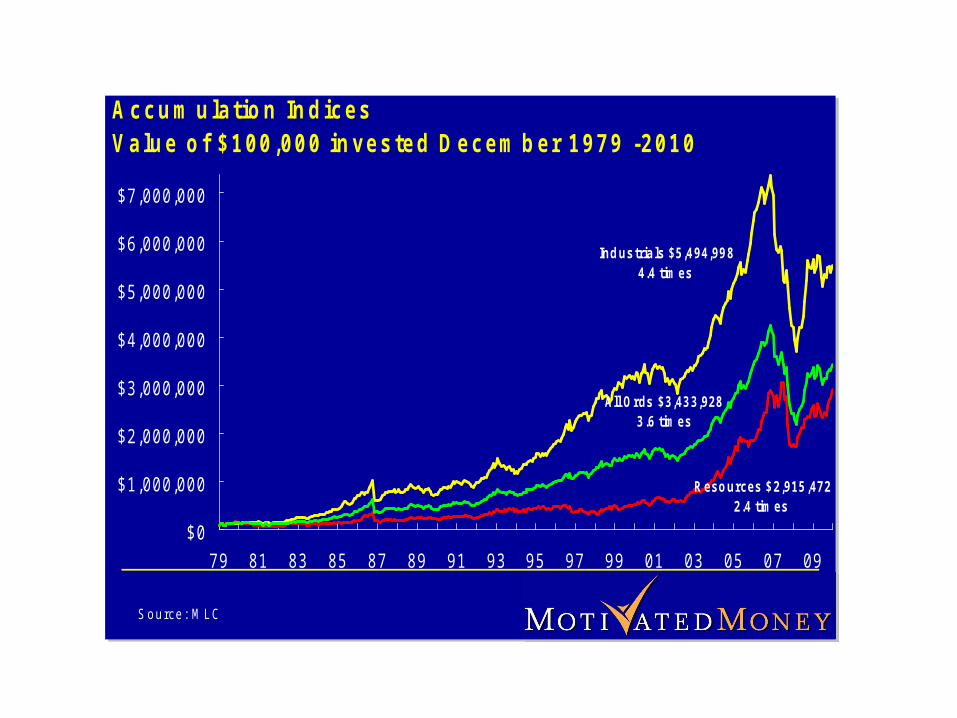
Ind us tria ls $5 ,4 94 ,99 84.4 tim es
R eso urces $ 2 ,915 ,4722.4 tim es
All O rds $3 ,43 3 ,9283 .6 tim es
$ 0
$ 1 ,0 0 0 ,0 0 0
$ 2 ,0 0 0 ,0 0 0
$ 3 ,0 0 0 ,0 0 0
$ 4 ,0 0 0 ,0 0 0
$ 5 ,0 0 0 ,0 0 0
$ 6 ,0 0 0 ,0 0 0
$ 7 ,0 0 0 ,0 0 0
7 9 8 1 8 3 8 5 8 7 8 9 9 1 9 3 9 5 9 7 9 9 0 1 0 3 0 5 0 7 0 9
A c c u m u la t io n In d ic e s V a lu e o f $ 1 0 0 ,0 0 0 in v e s te d D e c e m b e r 1 9 7 9 -2 0 1 0
S o u rc e : M L C
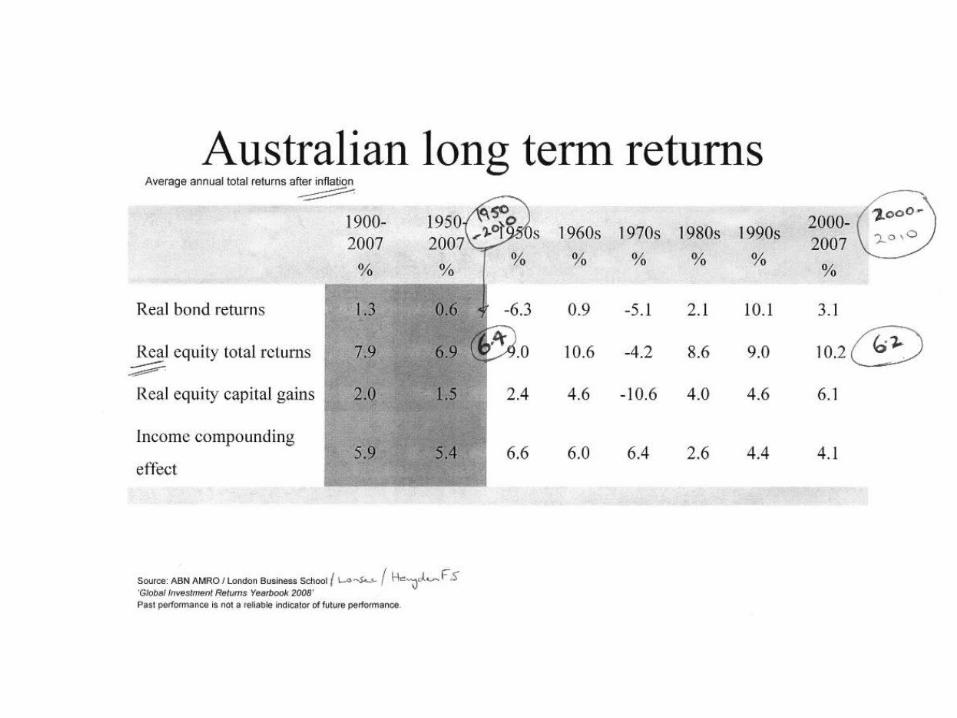
Average annual total returns after inflation
Australian long term returns
4.14.42.66.46.06.65.45.9Income compounding
effect
4.6
9.0
10.1
1990s
%
2.4
9.0
-6.3
1950s
%
1.5
6.9
0.6
1950-2007
%
-10.6
-4.2
-5.1
1970s
%
4.6
10.6
0.9
1960s
%
10.28.67.9Real equity total returns
3.12.11.3Real bond returns
6.14.02.0Real equity capital gains
2000-2007
%
1980s
%
1900-2007
%
Source: ABN AMRO / London Business School :‘Global Investment Returns Yearbook 2008’Past performance is not a reliable indicator of future performance.
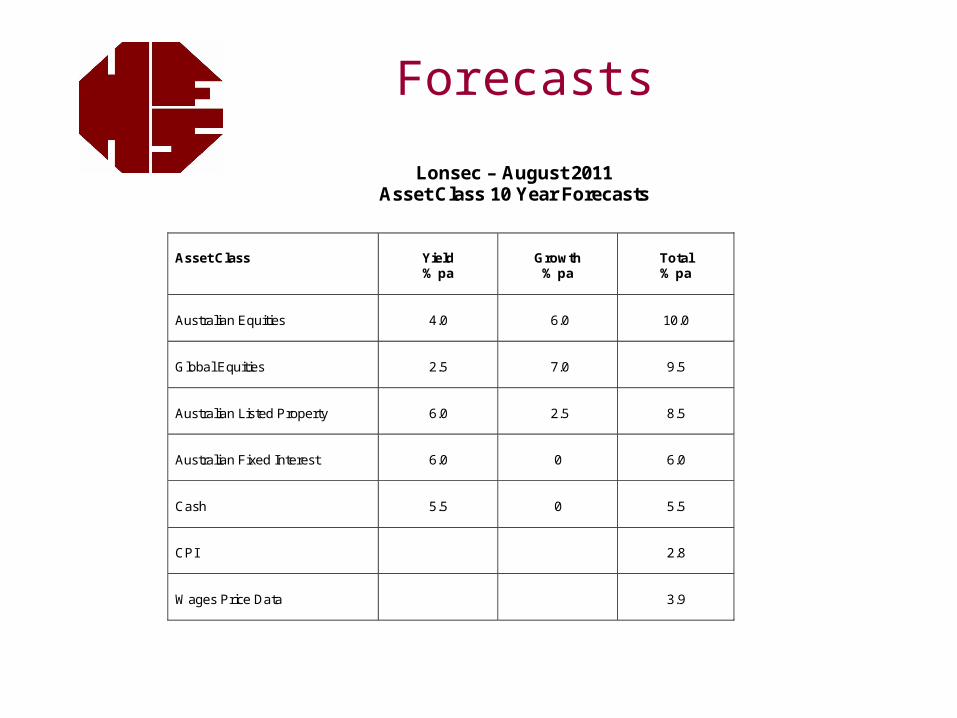
Forecasts
Lonsec – August 2011 Asset Class 10 Year Forecasts
Asset Class
Yield % pa
Growth
% pa
Total % pa
Australian Equities
4.0
6.0
10.0
Global Equities
2.5
7.0
9.5
Australian Listed Property
6.0
2.5
8.5
Australian Fixed Interest
6.0
0
6.0
Cash
5.5
0
5.5
CPI
2.8
Wages Price Data
3.9
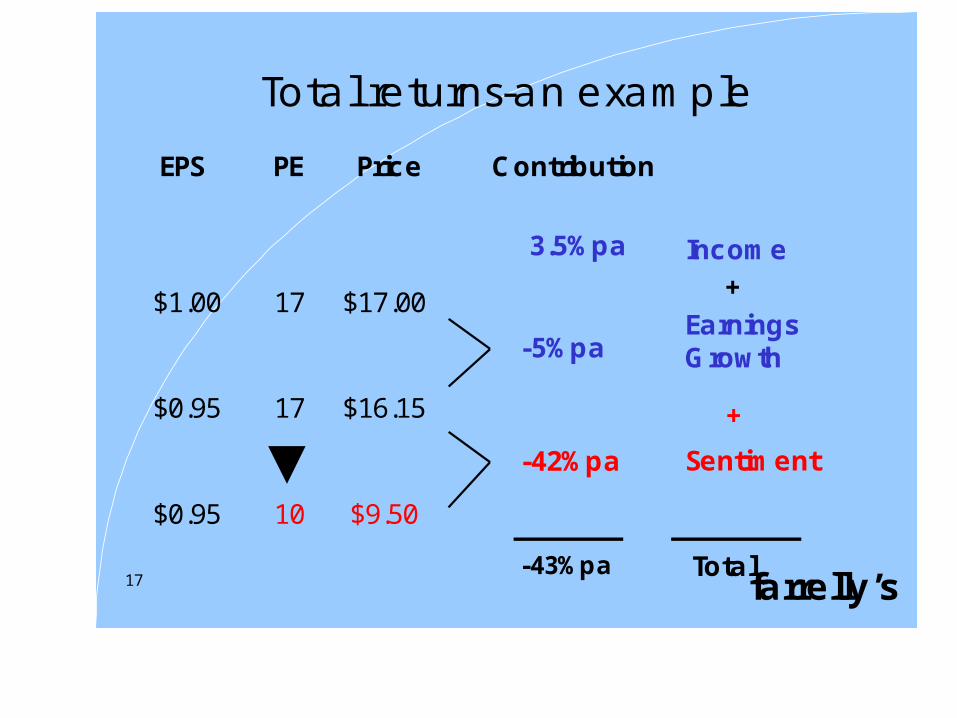
farrelly’s17
Total returns-an example
3.5%pa
EPS PE Price Contribution
$1.00 17 $17.00
$0.95 17 $16.15
$0.95 10 $9.50
-5%pa
-42%pa
Earnings Growth
Income
Sentiment
Total-43%pa
+
+
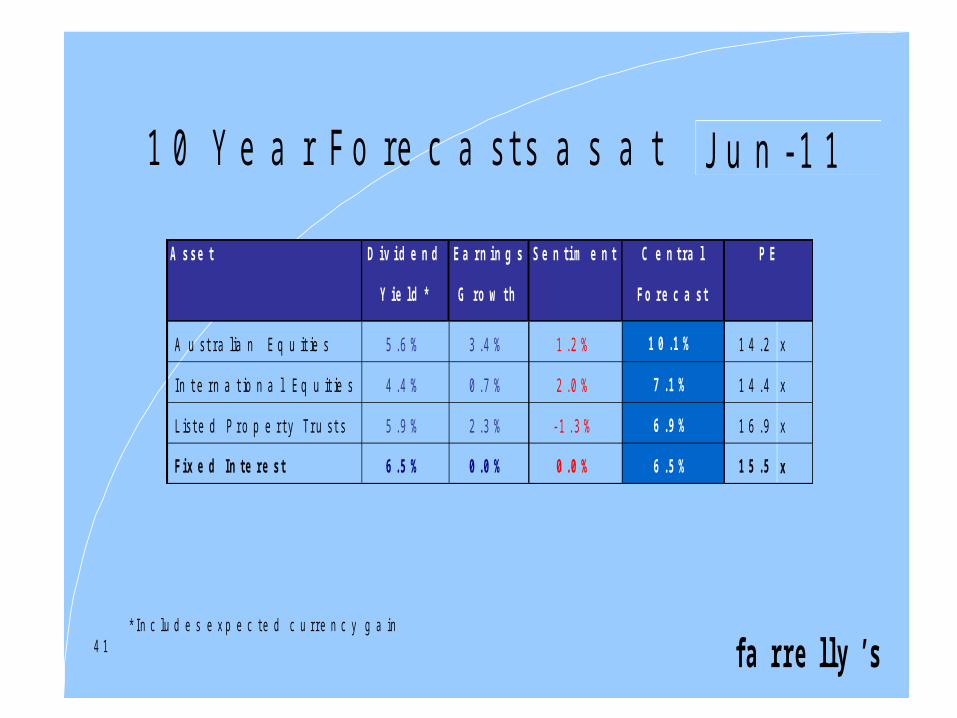
fa rre l ly ’ s4 1
1 0 Y e a r F o r e c a s t s a s a t J u n - 1 1
* I n c lu d e s e x p e c t e d c u r r e n c y g a in
D iv i d e n d E a rn in g s C e n t ra l
Y ie ld * G ro w th Fo re c a s t
A u s t r a lia n E q u it ie s 5 . 6 % 3 . 4 % 1 . 2 % 1 0 .1 % 1 4 . 2 x
I n t e r n a t io n a l E q u it ie s 4 . 4 % 0 . 7 % 2 . 0 % 7 .1 % 1 4 . 4 x
L is t e d P r o p e r t y T r u s t s 5 . 9 % 2 . 3 % - 1 . 3 % 6 .9 % 1 6 . 9 x
F ix e d In te re s t 6 .5 % 0 .0 % 0 .0 % 6 .5 % 1 5 .5 x
A s s e t S e n ti m e n t P E
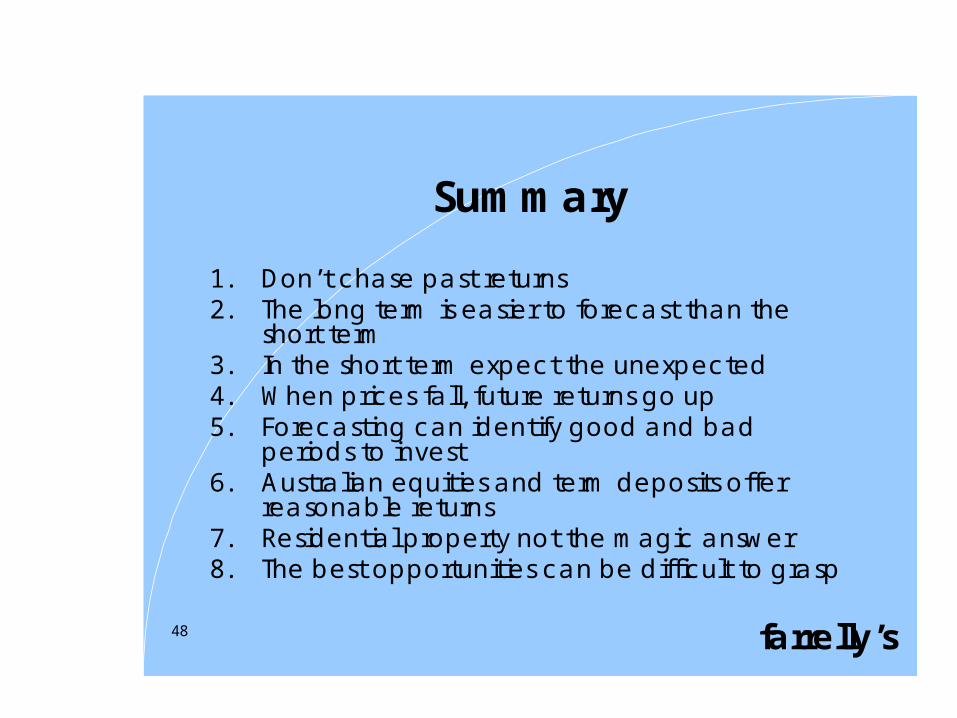
farrelly’s48
Summary
1. Don’t chase past returns2. The long term is easier to forecast than the
short term3. In the short term expect the unexpected4. When prices fall, future returns go up5. Forecasting can identify good and bad
periods to invest6. Australian equities and term deposits offer
reasonable returns7. Residential property not the magic answer8. The best opportunities can be difficult to grasp
Investors’ SeminarSeptember 2011
Historical Data
Forecasts
Hayden Asset Allocation Model
Specific Investment Selection
Bad case scenarios
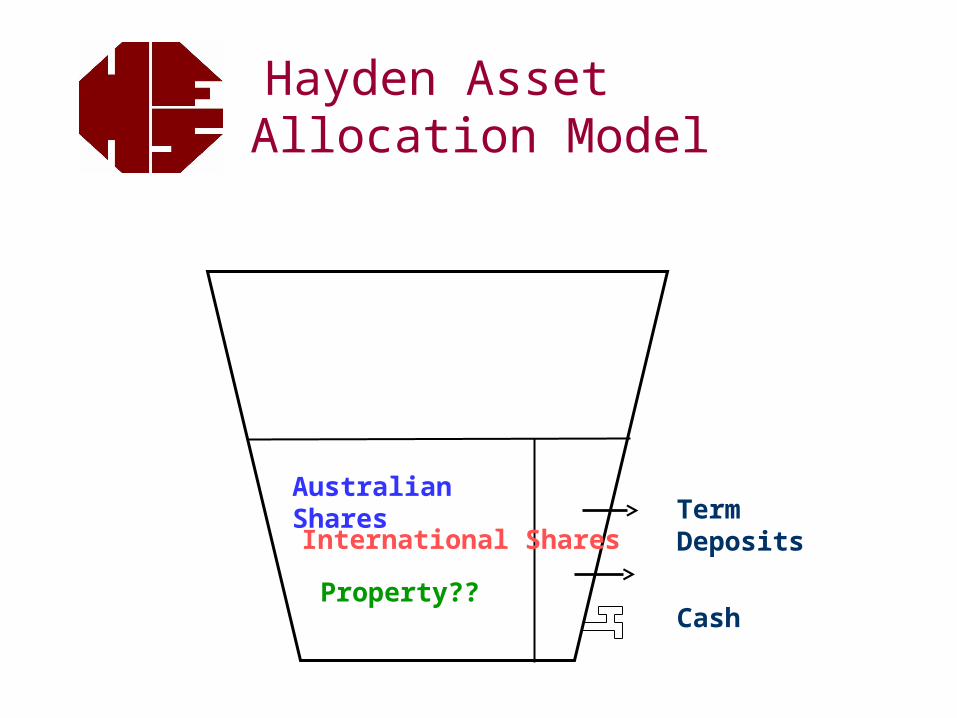
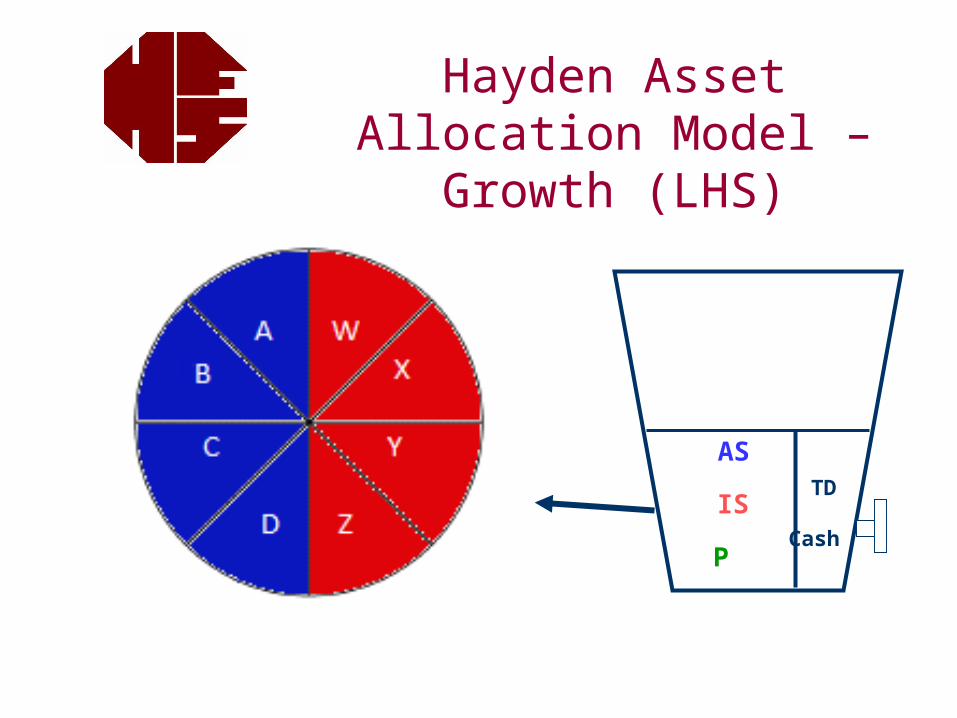
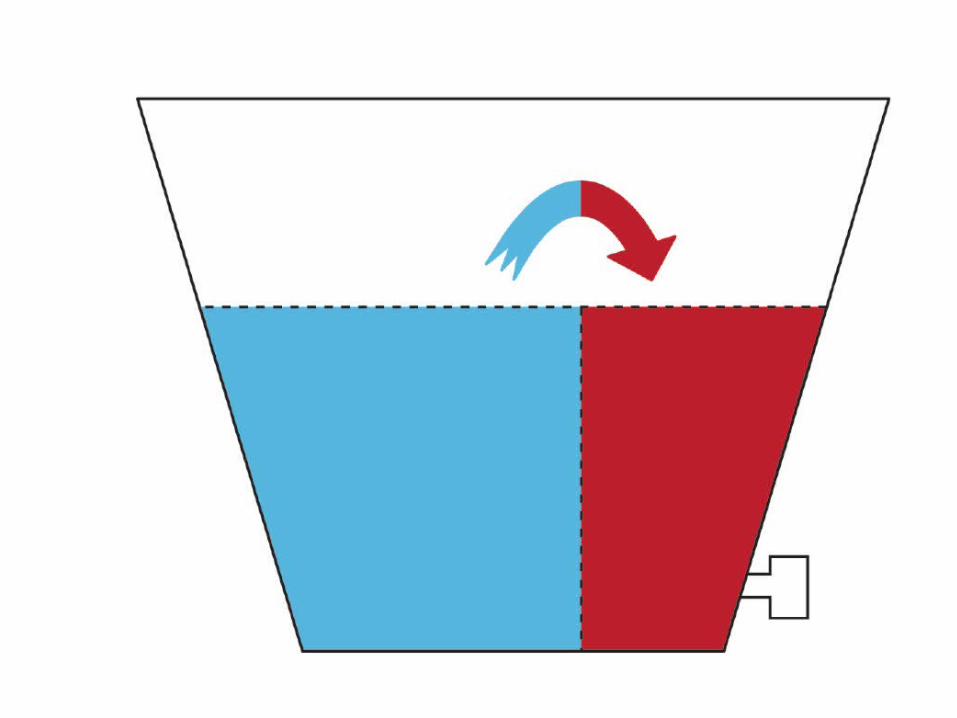
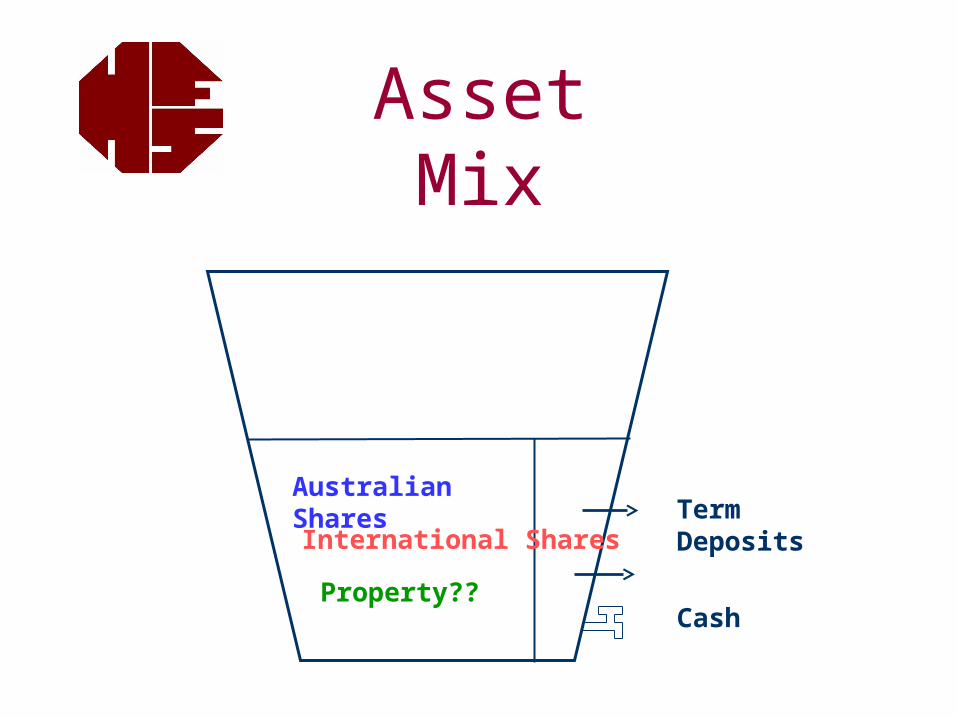
Hayden Asset Allocation Model
Australian SharesInternational Shares
Property??
Term Deposits
Cash
Segmentation Bar
RHS – Cash and Term Deposits
LHS – 10+ Year Focus
Never need to address the best investment for say 2 to 8 years.
Never need to predict the return of Growth assets over the short-term.
We do need dividends etc to replenish the RHS – but regularity is not relevant. It can be zero for 1 or 2 years (most unlikely because the businesses will not exist if they do not make profits).
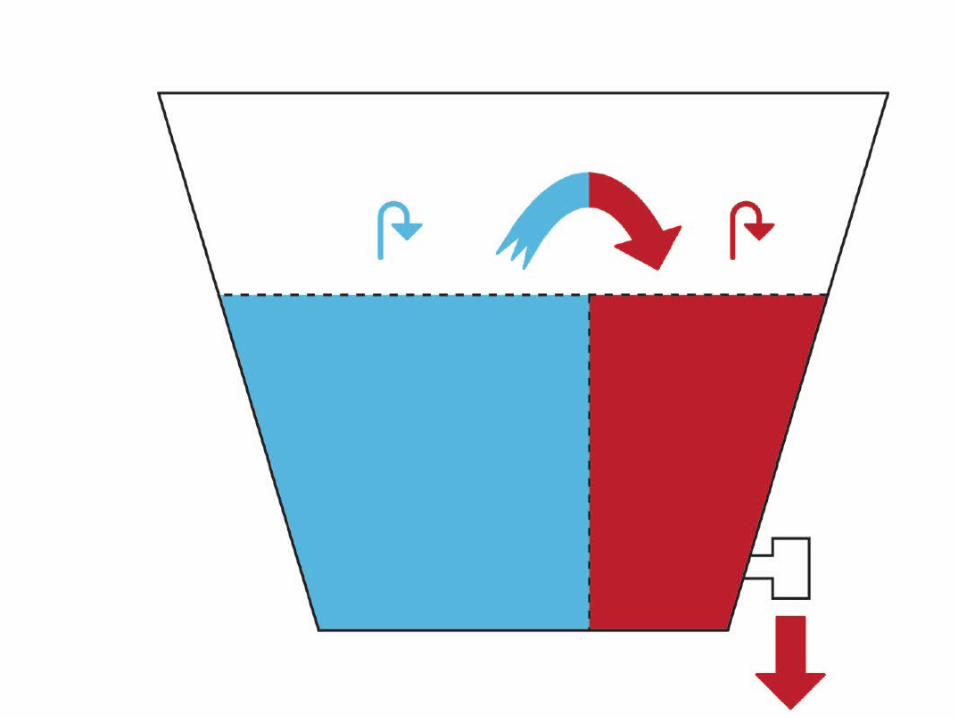
The Hayden Asset Allocation Model
The Segmentation Bar – ie vertical bar that segregates the short-term RHS and the LHS
RHS - Return of the $ invested at the designated time; has a 0-2 year focus.
CashFlow Needs are the main determinator.
Cash and Term Deposits - this section is structured to be “Consumed”
Asset Mix - Decision 1
The LHS Side of the Bucket. The Goals are:
Main Goal - Long-Term Total Returns – 10 Year Targets
Sub Goal – replenish the Cash
Volatile Returns are not a concern
Income is not a focus – maximising returns is the goal. A business that reinvests is not any less attractive than one that pays out all profit as a dividend.
Asset Mix - Decision 2
Projections
What are the key timeframes:
0-2 years – no projections needed. Cash and Term Deposits cover all goals in this time frame
2-8 years – not necessary to invest in this timeframe if we can have a 10 year focus which incorporates better returns
10+ years – the key goals. Again we use the Tim Farrelly Projections
AS
IS
P
TD
Cash
Hayden Asset Allocation Model – Growth (LHS)
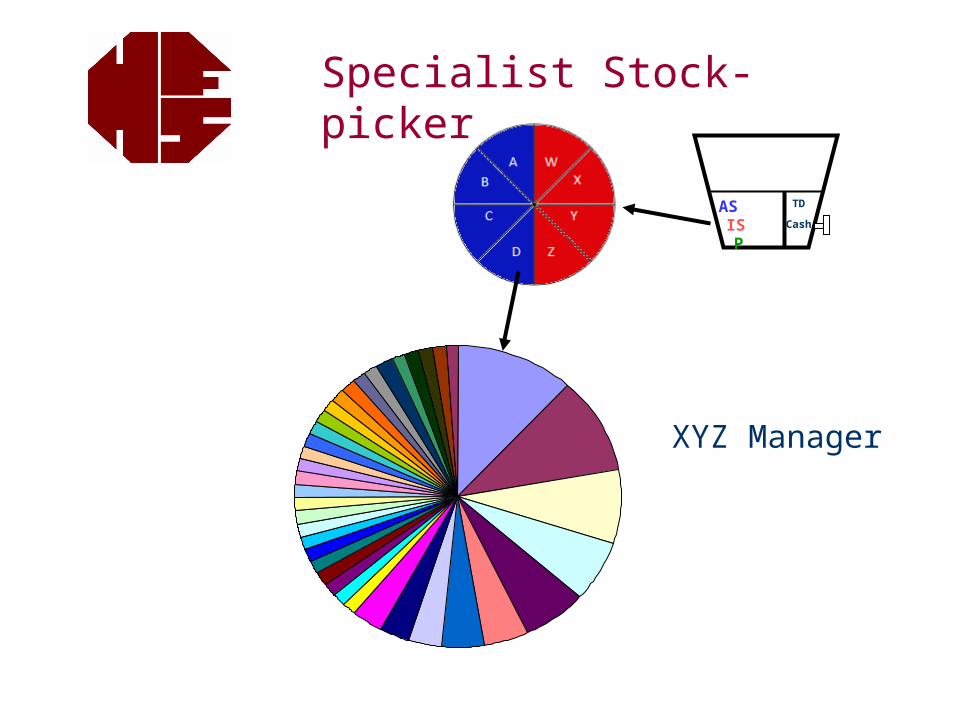
Specific Investments for the LHS
Australian/International Shares
We have a 10 year plus time frame so we are sharing in the profits generated by the business – ie either dividends and/or capital growth generated by higher profits
We want a good portfolio and we want it monitored and changed when needed
Best way - contract Specialist Stock-pickers
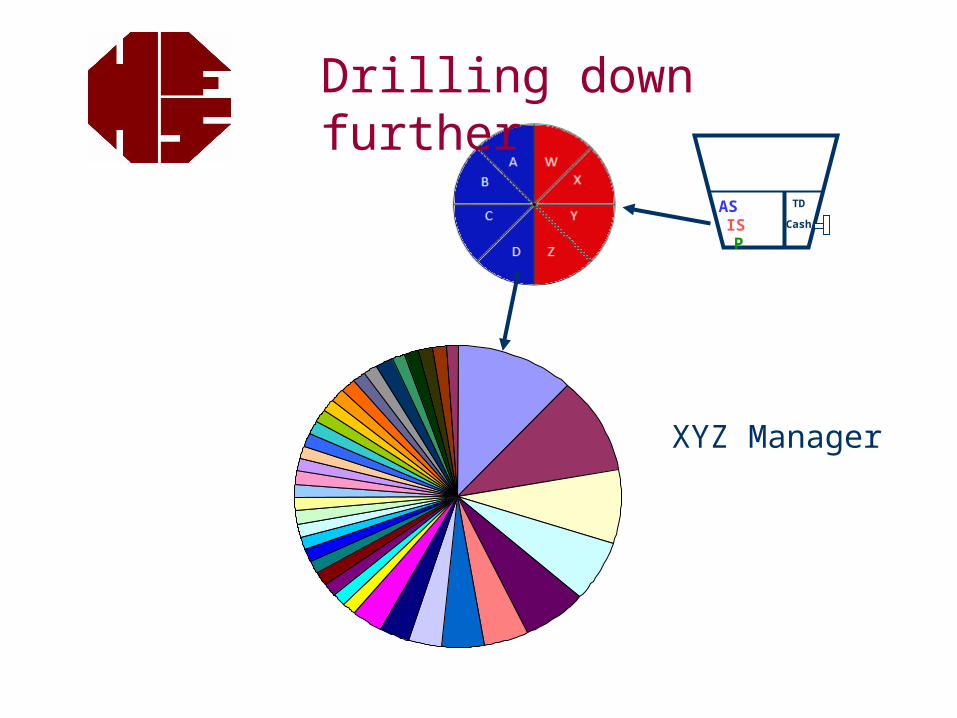
ASISP
TD
Cash
Drilling down further
XYZ Manager
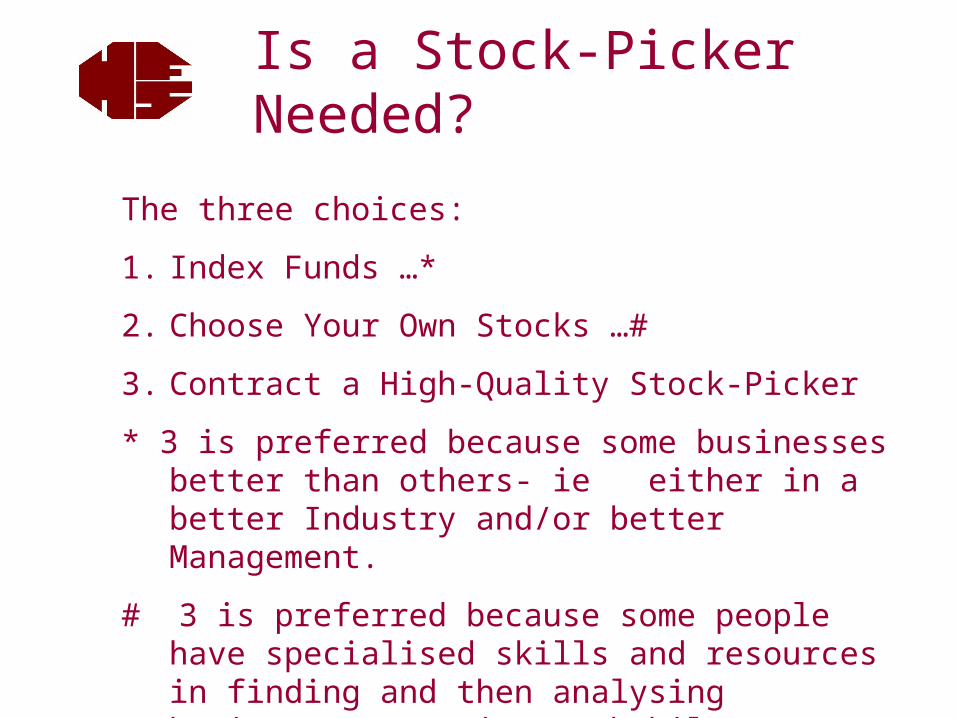
The three choices:
1. Index Funds …*
2. Choose Your Own Stocks …#
3. Contract a High-Quality Stock-Picker
* 3 is preferred because some businesses better than others- ie either in a better Industry and/or better Management.
# 3 is preferred because some people have specialised skills and resources in finding and then analysing businesses? It is worthwhile contracting these skills.
Is a Stock-Picker Needed?
A quality stock-picker is contracted for
Their selected portfolio of shares and
Their skills in monitoring and changing that portfolio
For each underlying investments we can ask them why they part-own that business and what are the key factors that would lead them to sell that business
The investee businesses must either have High Profit Margins or High Turnover and Reasonable Profit Margins. And this advantage must be sustainable.
Choosing a Stock-Picker

Specific Investments
We, via the Specialist Stock-pickers, want :
** the best performing businesses over a 10+ year time frame
We want to buy these on the stock-market
Most stock-market participants are looking for the best 1 year performers. Their time frame may be shorter, eg 3 months,or……even intra-day!
This can be to our advantage. Avoid the noise.
How Many Managers -ie stock-pickers?
Obtain diversification – ie different processes and different people/perspectives
Not too many that we dilute the best performers
Around 3-5 in both Australian and International Shares
The businesses that we part-own (via our specialist Fund Managers) should, or must, meet these criteria:
We want to select Good Businesses – ie those with a Durable Competitive Advantage
We want to avoid Poor Businesses - ie those where price is the major motivating factor in the consumer’s decision to buy their product or service.
The Buffett Overlay
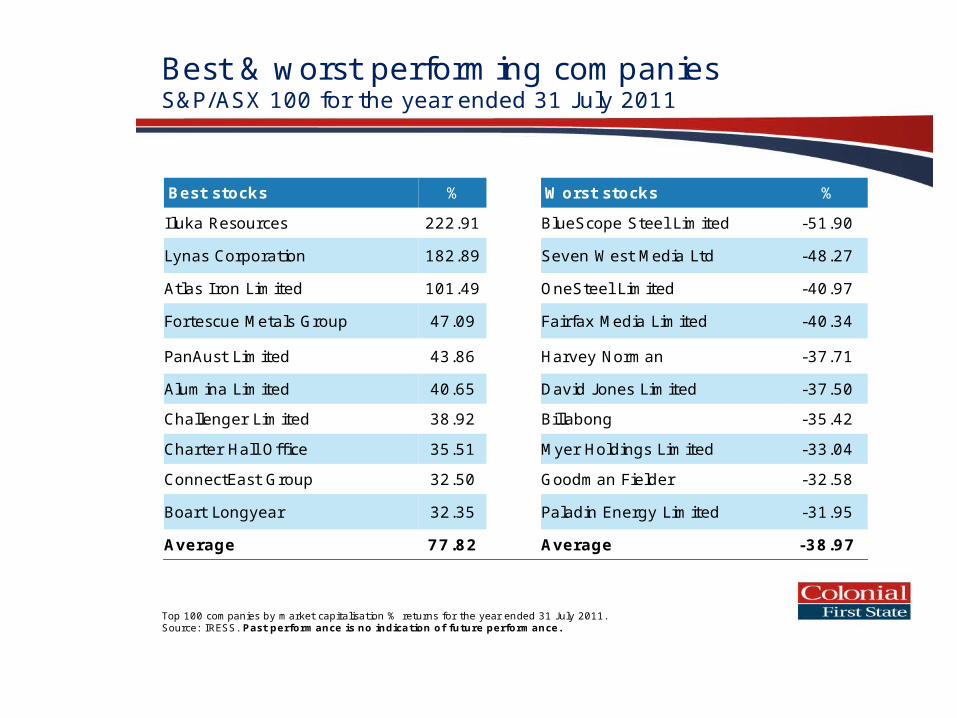
Top 100 companies by market capitalisation % returns for the year ended 31 July 2011. Source: IRESS. Past performance is no indication of future performance.
Best & worst performing companiesS&P/ASX 100 for the year ended 31 J uly 2011
Best stocks % Worst stocks %
Iluka Resources 222.91 BlueScope Steel Limited -51.90
Lynas Corporation 182.89 Seven West Media Ltd -48.27
Atlas I ron Limited 101.49 OneSteel Limited -40.97
Fortescue Metals Group 47.09 Fairfax Media Limited -40.34
PanAust Limited 43.86 Harvey Norman -37.71
Alumina Limited 40.65 David J ones Limited -37.50
Challenger Limited 38.92 Billabong -35.42
Charter Hall Office 35.51 Myer Holdings Limited -33.04
ConnectEast Group 32.50 Goodman Fielder -32.58
Boart Longyear 32.35 Paladin Energy Limited -31.95
Average 77.82 Average -38.97
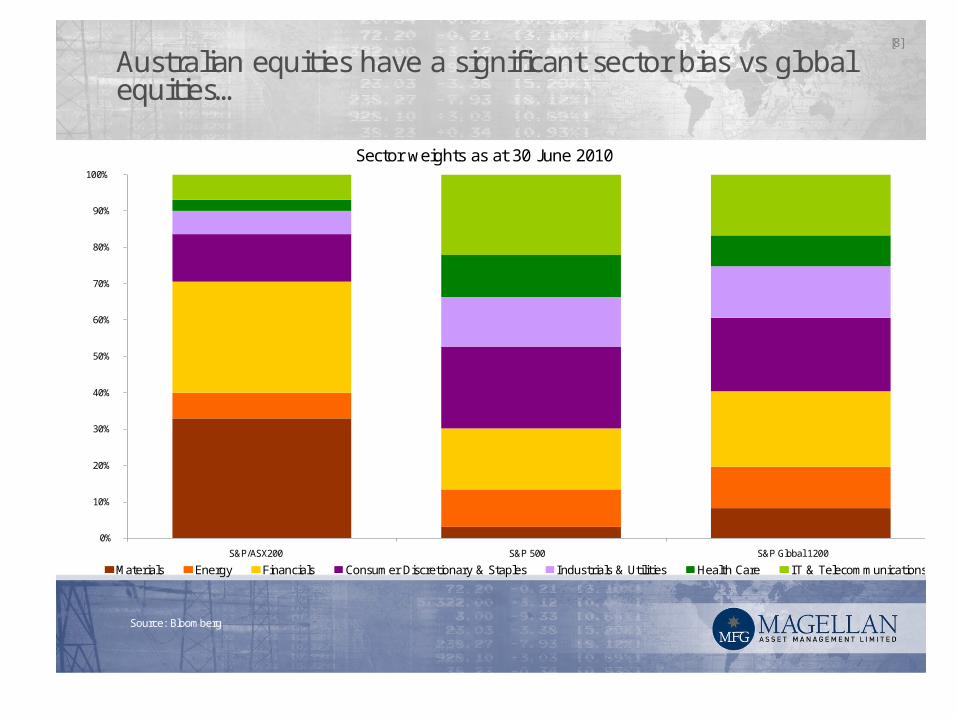
[8]
Source: Bloomberg
Australian equities have a significant sector bias vs global equities…
Sector weights as at 30 June 2010
0%
10%
20%
30%
40%
50%
60%
70%
80%
90%
100%
S&P/ASX200 S&P 500 S&P Global 1200
Materials Energy Financials Consumer Discretionary & Staples Industrials & Utilities Health Care IT & Telecommunications
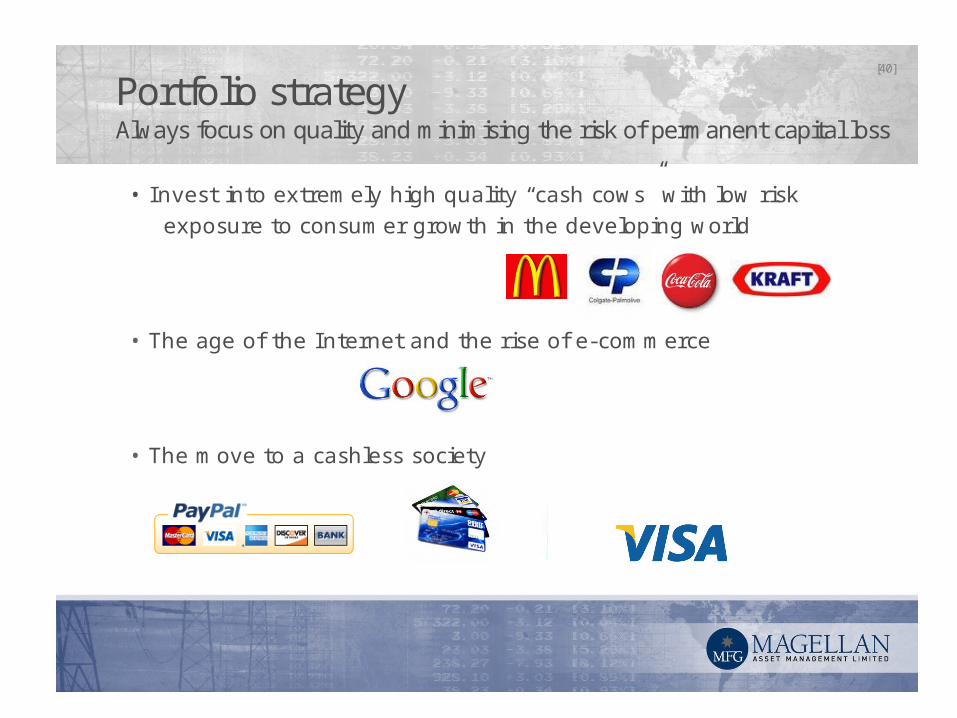
[40]
Portfolio strategyAlways focus on quality and minimising the risk of permanent capital loss
• Invest into extremely high quality “cash cows” with low risk exposure to consumer growth in the developing world
• The age of the Internet and the rise of e-commerce
• The move to a cashless society
Investors’ SeminarSeptember 2011
Historical Data
Forecasts
Hayden Asset Allocation Model
Specific Investment Selection
Bad case scenarios

Investors’ SeminarSeptember 2011
What is our greatest fear?
“running out of money”
“not achieving lifestyle goals”
“losing money”…..readily addressed; we need patient capital; there is no value-add by counting it daily…..need the faith to leave it; let it grow; leave it in a Bank, a Property, a Business etc
Investors’ SeminarSeptember 2011
The Fear:
Not achieving our goals (including running out of money)
What’s needed:
The “tap” turned on at a reasonable rate
Reasonable long-term returns
Bad case scenarios:
Share Prices “crash”; Dividends reduce; Cash and Term Deposit Rates are very low
Investors’ SeminarBad Scenarios
Cash and Term Deposit Rates are very low – not a concern – liquidity and security the RHS’ focus
Dividends reduce – zero for one year is no concern; Some businesses will survive (ie some employment) hence some Earnings
Share Prices “crash”- What part is “noise” – relatively minor and what part is “fundamental” – changing the economy.
Good Businesses will still generate Earnings. This will show partly as Dividends; partly in increased future Dividends; and partly an increased intrinsic value of the Business.
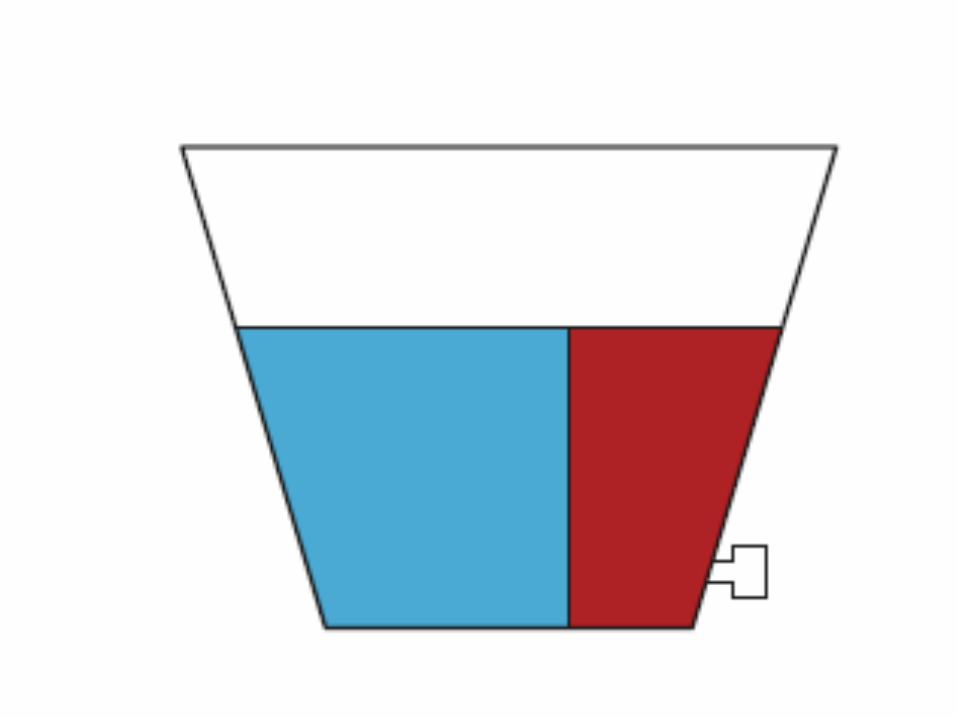


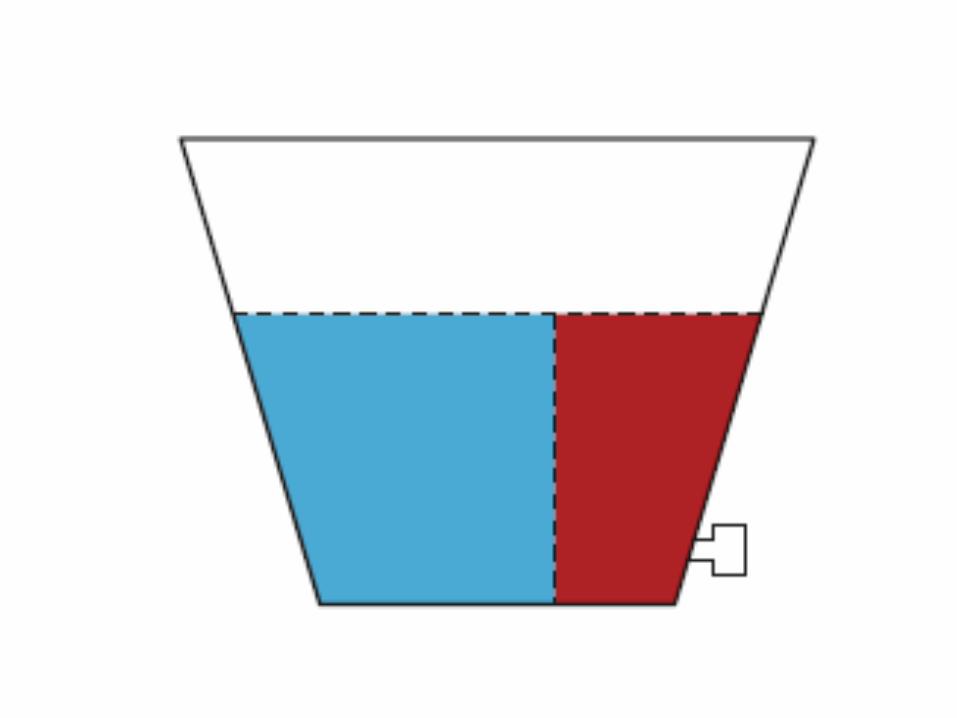
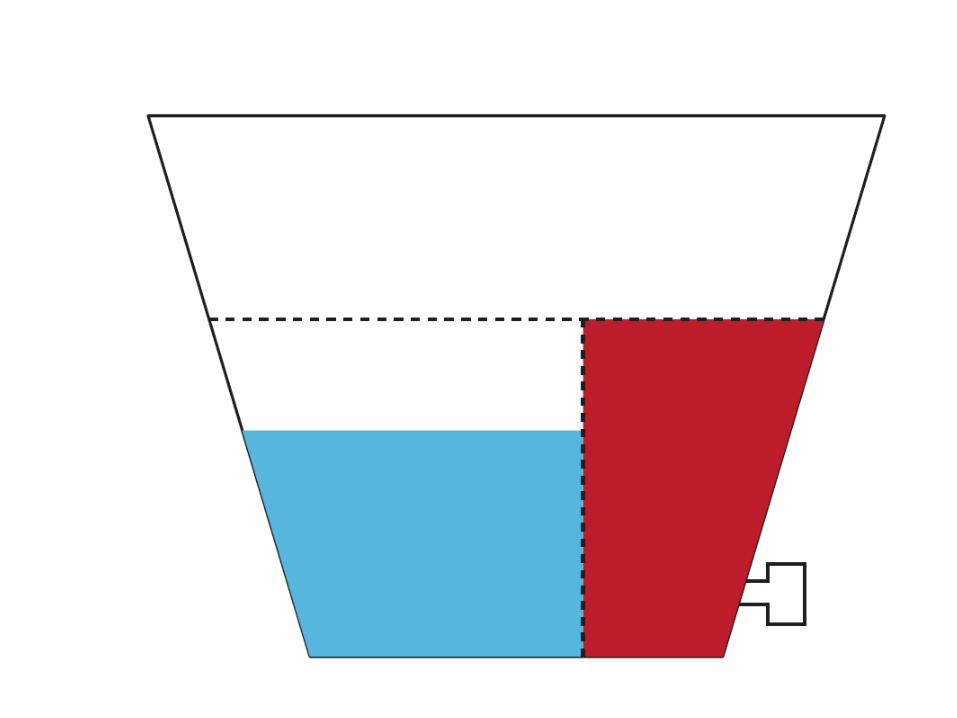
Illustrating theBad Case Scenarios
Cash and Term Deposit Rates - zero
Dividends reduce – NB Still will be some dividends (ie any surviving business will pay dividends most years)
Share Prices “crash”- The LHS will never be zero – there will always be some businesses
AssetMix
Australian SharesInternational Shares
Property??
Term Deposits
Cash
ASISP
TD
Cash
Specialist Stock-picker
XYZ Manager
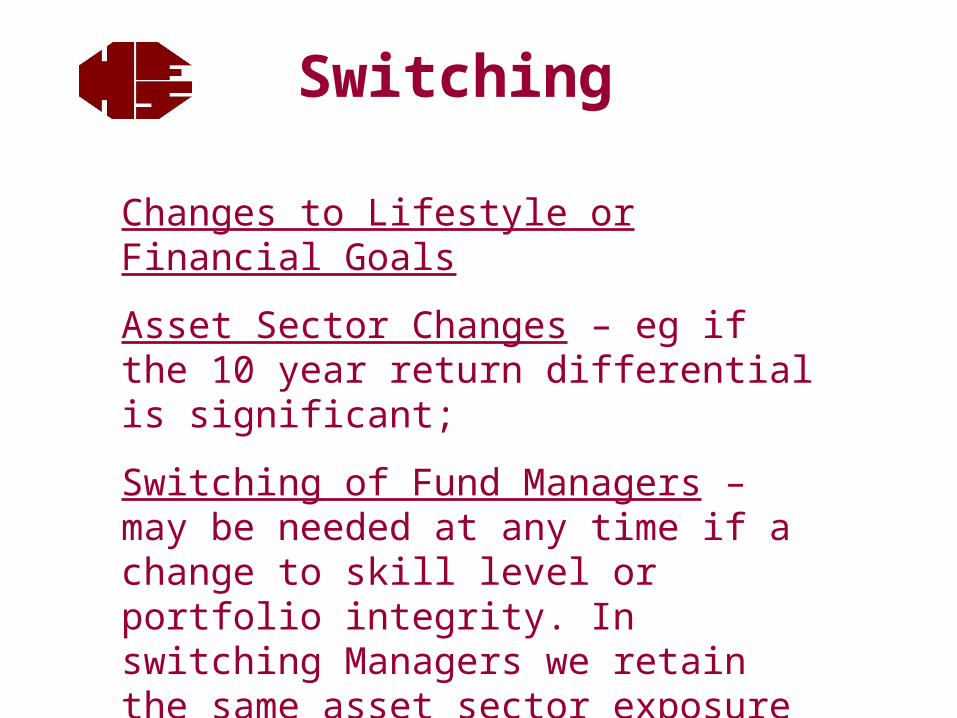
Changes to Lifestyle or Financial Goals
Asset Sector Changes – eg if the 10 year return differential is significant;
Switching of Fund Managers – may be needed at any time if a change to skill level or portfolio integrity. In switching Managers we retain the same asset sector exposure –eg to shares.
Switching
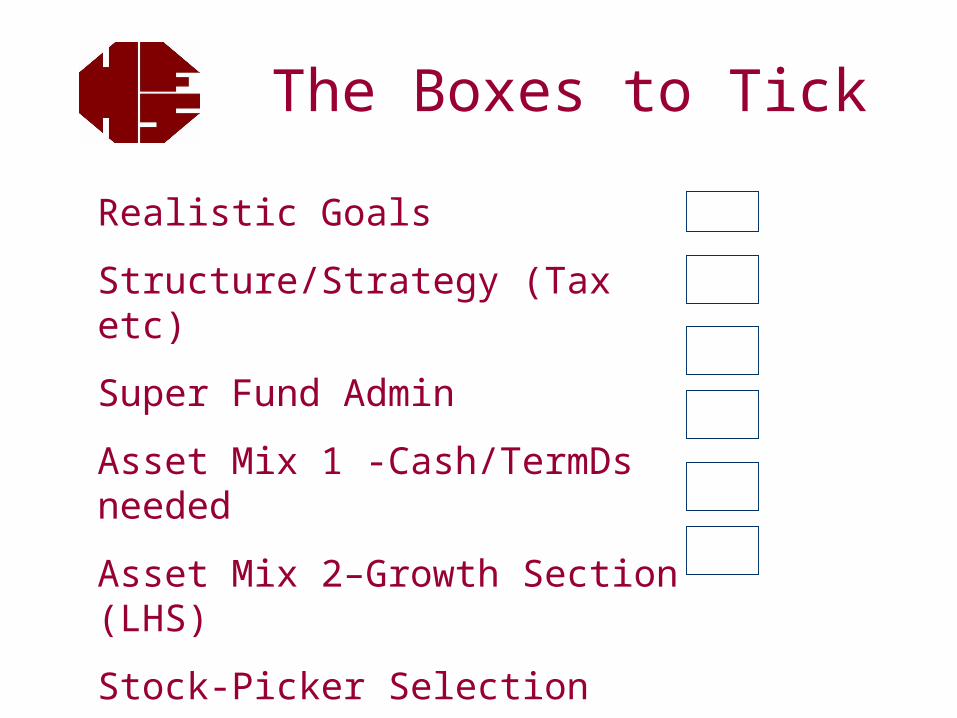
Realistic Goals
Structure/Strategy (Tax etc)
Super Fund Admin
Asset Mix 1 -Cash/TermDs needed
Asset Mix 2–Growth Section (LHS)
Stock-Picker Selection
The Boxes to Tick

Peace-of-mind for Investors
1. Part-own a lot of great businesses. We have a portfolio of businesses that is well diversified across locations, industries and size.
2. Employing (contracting) some very wise people to monitor and change our portfolio of investee businesses when necessary.