investors presentation · -92(3)-641(3) 70 127 81(3) 30(3) 5 -1 ... •e.g. cyber defence and air...
TRANSCRIPT

Investors PresentationApril 2018
2
This presentation has been produced by Indra for the sole purpose expressed therein. Therefore, neither this presentation nor any of the information
contained herein constitutes an offer sale or exchange of securities, invitation to purchase or sale shares of the Company or any advice or recommendation
with respect to such securities.
Its content is purely for information purposes and the statement it contains may reflect certain forward-looking statements, expectations and forecasts about
the Company at the time of its elaboration. These expectations and forecasts are not in themselves guarantees of future performance as they are subject to
risks, uncertainties and other important factors beyond the control of the Company that could result in final results materially differing from those contained in
these statements. The Company does not assume any obligation or liability in connection with the accuracy if the mentioned estimations and is not obliged to
update or revise them.
This document contains information that has not been audited. In this sense, this information is subject to, and must be read in conjunction with, all other
publicly available information.
This disclaimer should be taken into consideration by all the individuals or entities to whom this document is targeted and by those who consider that they
have to make decisions or issue opinions related to securities issued by Indra.
Disclaimer

3
What is Indra?
Our Strategic Plan
Transport & Defence (T&D)
Information Technologies (IT)
Annex 1: Last quarterly results
01
02
03
04
05
Index

4
€3.0BnRevenues 2017
>40,000employees
+140countries
Global
consulting
and technology
company
Business Model
based on our
Proprietary
Products and
R&D
Information Technology(61% of total sales)
Leading Digital companyin Spain and Latam
Energy & Industry
Financial Services
Public Administration & Healthcare
Telecom & Media
Transport & Defence(39% of total sales)
Leading worldwide providerof proprietary solutions in niche areas
Transport & Traffic
Defence& Security
01. Whats is Indra?
Indra: A global Consulting and Technology company
Technology Partner for core business operations

5
16%
20%
8%
17%
20%
19%
Sales 2017
Transport & Traffic
• Air Traffic Management
systems and
Communications,
Navigation and
Surveillance systems
• Transport: Revenue
Collection, Control &
Enforcement, Operational
Systems and Safety &
Signaling
Defence & Security
• Air Defence & Border
Surveillance
• Electronic Warfare: Airborne,
Naval and Land Platforms
• Simulation
• Satellite Communications
Telecom & Media
• Operations and business
support systems
• New media and digital
television solutions
Financial Services
• Payment systems & Payment
processing platform
• Insurance and banking core
systems
• Operations transformation and
process efficiency services
Public Admin
& Healthcare
• Comprehensive offer on Electoral processes
• Educational and justice management systems
• Healthcare management platform
Energy & Industry
• Energy: generation, distribution and
commercial management solutions
• Industry: Retail and Airlines
management solutions
01. Whats is Indra?
We deliver core business operations technologyin various industries
• Business consulting
• Digital solutions
• Cybersecurity
(17% IT Sales)
T&DIT

6
25.081
11.326
1.811 1.802
0
5.000
10.000
15.000
20.000
25.000
30.000
46%
22%
16%
16%
Sales 2017 Employees 2017
Spain America Europe Asia, Middle East & Africa (AMEA)
01. Whats is Indra?
With a strong presence in international markets

7
(*) Board of Directors representation
CNMV data. Identified shareholders with a
position in excess of 3%
18,7%
10,5%
9,4%
5,1%
4,1%3,2%
49,0%
Sociedad Estatal de Participaciones Industriales S.E.P.I (*)
Fidelity Management Research
Corporación Financiera Alba (*)
Others
T. Rowe Price Associates
Norges Bank
Schroders
01. Whats is Indra?
Main Shareholders
8
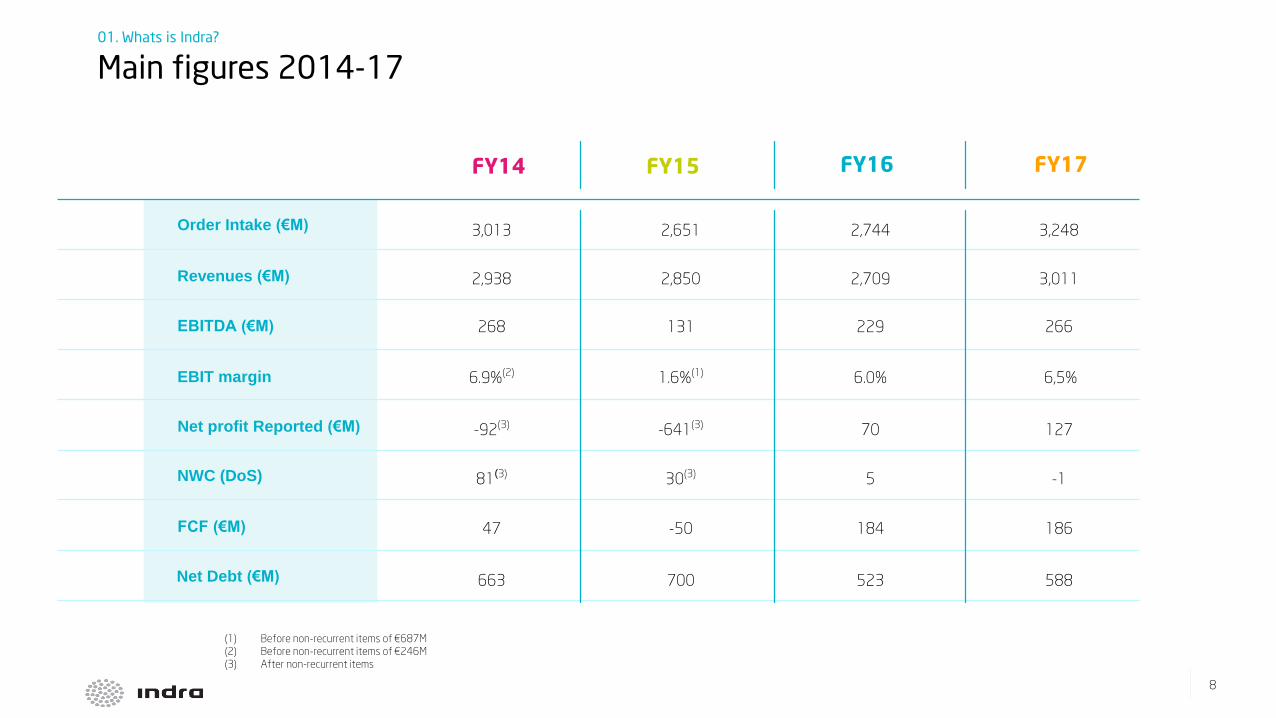
3,013 2,651 2,744 3,248
2,938 2,850 2,709 3,011
268 131 229 266
6.9%(2) 1.6%(1) 6.0% 6,5%
-92(3) -641(3) 70 127
81(3) 30(3) 5 -1
47 -50 184 186
663 700 523 588
(1) Before non-recurrent items of €687M
(2) Before non-recurrent items of €246M
(3) After non-recurrent items
FY15FY14
Order Intake (€M)
Revenues (€M)
EBITDA (€M)
EBIT margin
Net profit Reported (€M)
NWC (DoS)
FCF (€M)
Net Debt (€M)
01. Whats is Indra?
Main figures 2014-17
FY16 FY17
9
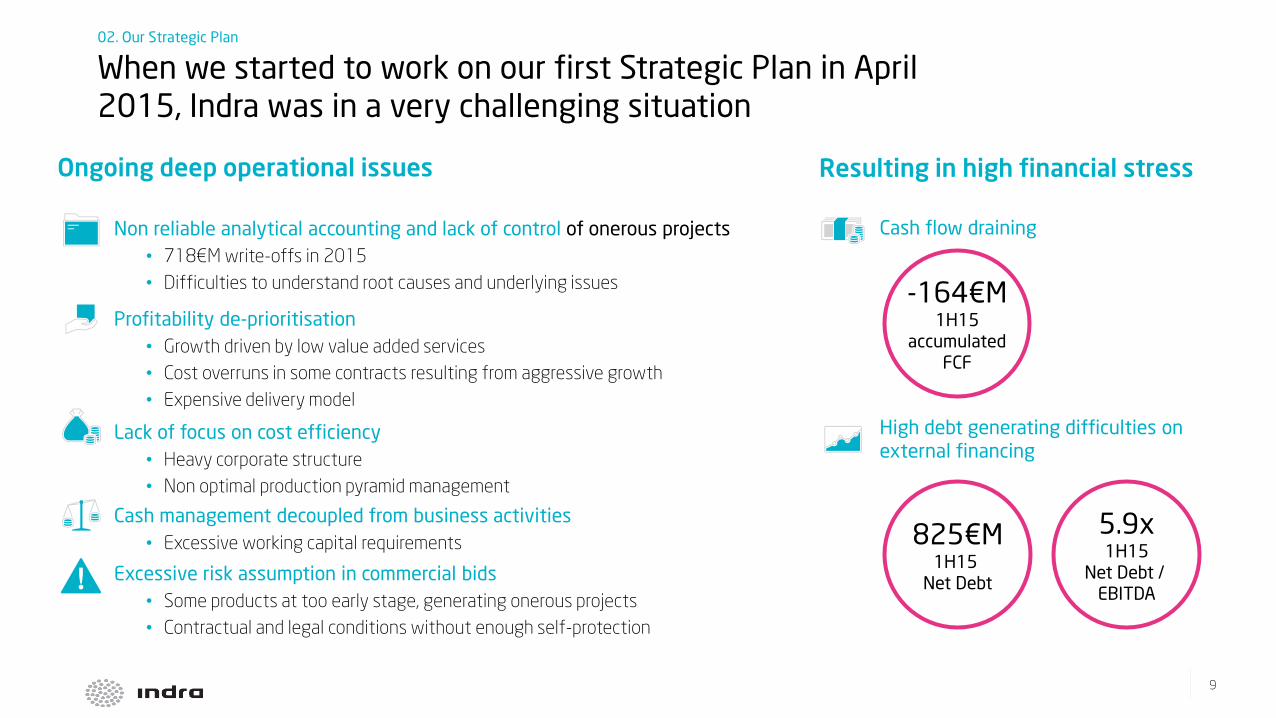
Resulting in high financial stress
Cash flow draining
High debt generating difficulties on
external financing
-164€M1H15
accumulatedFCF
5.9x1H15
Net Debt / EBITDA
825€M1H15
Net Debt
Ongoing deep operational issues
Non reliable analytical accounting and lack of control of onerous projects
• 718€M write-offs in 2015
• Difficulties to understand root causes and underlying issues
Profitability de-prioritisation
• Growth driven by low value added services
• Cost overruns in some contracts resulting from aggressive growth
• Expensive delivery model
Lack of focus on cost efficiency
• Heavy corporate structure
• Non optimal production pyramid management
Cash management decoupled from business activities
• Excessive working capital requirements
Excessive risk assumption in commercial bids
• Some products at too early stage, generating onerous projects
• Contractual and legal conditions without enough self-protection
02. Our Strategic Plan
When we started to work on our first Strategic Plan in April 2015, Indra was in a very challenging situation

10
Much more reliable balance sheet after write-offs
2.2x
Jun
16
Dec
15
6.6x
Jun
15
Jun
17
Dec
16
Sustainable cash generation
FCF accumulated LTM (€M)
* Indra Stand Alone
Net debt on the lowest point since 2015 peak
Net Debt / EBITDA LTM (Times)
Healthy P&L and balance sheet
Recurring EBIT LTM (€M)
45 196
Dec 17Dec 15
1.6% 6.5%
163181 184 184
-136
132
186
Jun
17
104
Jun
15
Jun
16
-50
Dec
16
76
-114
Dec
15
Includes 78€M cash cost from
personnel optimisation plan in
2015, and 51€M in 2016
By implementing our 2015 Strategic Plan, we have achieved significant structural improvements in Indra's financials…
02. Our Strategic Plan
Dec
17
Dec
17
1.2x*
7.2%*
224*

11
We have a stronger proprietary product portfolio
More relevant weight of high value solutions• T&D solutions remained predominantly high value• TI high value solutions increased their relative weight
Minsait, our new transformational vehicle,
already launched and is currently up to speed
We have a strong pipeline in T&D
• New references in Ecuador in Defence & Security, Middle Eastin ATM, UK in Transport
We strengthened our commercial position internationally
• Launched in January 2016 and already growing more than the rest of IT
• ~300€M sales 100% Minsait, ~2,700 FTEs
• E.g. Cyber Defence and Air Defence solutions• E.g. Developed ERTMS technology in Safety in Transport• E.g. IT solutions are more standardised and packaged
• 4.9€Bn in T&D (2.3€Bn in Defence & Security, 0.9€Bn in ATM and 1.7€Bn in Transport)
We were able to acquire Tecnocom and are on our way to make a successful integration• Gaining scale, positioning and complementing our product portfolio
• E.g. Payment processing solution of Tecnocom has reinforced Indra's Financial Services portfolio
• 30.5€M in cost synergies targeted
Note: ERTMS (European Rail Traffic Management System)
02. Our Strategic Plan
…and we have also improved our competitive positioning for the future

12
Sources: EIA Annual Energy Outlook 2015; real data from World Bank (for GDP growth 2016 estimate, 2017 projection)
We had internalissues…
• Unexpected large restructuring needs in Brazil and Transport (~300€M and ~90€M impact on EBIT respectively
in 2015-2017)
• Slower than planned portfolio rotation
– Exit from onerous projects took longer than expected
• Difficulties to capture the full potential of efficiency and off-shoring opportunities without growing in IT
• Longer than expected cultural transformation challenge
• Management focus on both turnaround and growth at the same time has been difficult
Lower than forecasted economic growth
in LatAm
201720162015
2.0
0.80.4
-1.4
-0.8
2.8
Real
World Bank
2015 Forecast
Lower than forecasted oil prices resulting in lower than
expected GDP growth and T&D investments
0
50
100
2015 20172016
Real
US Energy
Information
Administration
2015 forecast
1st ID
~15$/barrel gap
average
Brent Price ($/barrel)Real GDP growth (%)
... and the macro environment did not help
But we found some unexpected issues in our transformation process
02. Our Strategic Plan

13
Greater focus, accountability,agility and flexibility
Healthy sales growth
Marginenhancement
New Specialised Operating Model
Ongoing Productivity Upgrades
Product
Portfolio Evolution
Segmented
Commercial Processes
02 03
04
01
02. Our Strategic Plan
In order to ensure Indra's profitable growth under this positive environment we have defined our 2018-2020 Strategic Plan…
14
Operational synergies
Corporate services will continue to be shared to leverage the
scale effect and without losing synergies
Economies of scale within the T&D and the IT business (in
Offering Development, Cross-Selling and Production) will be
totally captured
Improved strategic flexibility
Easier potential alliances, joint-ventures and M&A
Increased management focus and accountability
Businesses split facilitates specialisation (e.g. more focused
international commercial activity)
Split allows for clearer accountabilities
Increased agility and time-to-market
Simplified management structure within the new division
Decision-making and execution processes will be faster and
better suited to each single business needs
~
Indra
T&D
Corporate functions +
shared services
IT
02. Our Strategic Plan
By incorporating our IT business into a fully-owned subsidiary we intend to gain focus, accountability, agility and flexibility

15
• Deploy Lean manufacturing, Lean IT production and apply Automation
• Extend scope of our Global Business Services and rationalise our indirect costs base
• Intensify our Pyramid management and Delayering
• Optimise procurement
Ongoing Productivity UpgradesProduct
Portfolio EvolutionSegmented Commercial
Processes
• Invest to reinforce those productswhere we already have a leading position
• Apply digital technologies to further position our offering in the smart ecosystem
• Complement selectively our proprietary products portfolio to sell complete end-to-end solutions
• Increase commercial intensity with strong incentives and systematic tools
• Apply a segmented commercial approach with new more specialised profiles
• Establish alliances / JVs for commercial acceleration in selected geographies
02. Our Strategic Plan
Product Portfolio Evolution, Segmented Commercial Processes and Ongoing Productivity Upgrades will produce profitable growth

16
Other uses (€M) (5)
2015-2017E
CAPEX (€M) (4)
1. Pro-forma values including full consolidation from Tecnocom
2. Organic growth. Constant exchange rates as of 2016 (average FX in 2016)
3. Includes the estimated CF generated in 2015-17E, excluding the estimated impact from the cash outflows from Tecnocom acquisition (191€M), headcount plans (129€M), onerous projects (~145€M)
and the accumulated CAPEX in the period
4. Accumulated CAPEX in the 2015-2017E and 2018-2020E period respectively
5. The uses of the cash flow generated in the 2018-2020E period are contingent upon fulfilment of the Strategic Plan
6. Includes the FCF generated in the period according to Indra’s definition, excluding CAPEX and the last part of the pending cash outflows associated with the headcount reduction plan in Spain (~40€M)
~610 (3)
100-110
550-650 (6)
150-200
Restructuring Plan 129Tecnocom acquisition 191Onerous projects ~145Deleverage (consensus end FY17) ~40
2018-2020E
Continue deleveragingReinstate dividend policySelective bolt-on acquisitions
Revenues (€M)
EBIT (€M)
CAGR 2016-2020 (2)
3,121
180
Low single digit
>10% (p.a. growth)
2016 (1)
Total Cash Flow (€M) [~€775m since First Investors Day]
02. Our Strategic Plan
Guidance

17
T&D
Transport Mid to high single digit
ATM Mid single digit
Defence & Security
Mid to high single digit
IT Low single digitIT
1. Organic growth. Constant exchange rates as of 2016 (average FX in 2016). 2. Proforma including full 2016 revenues from Tecnocom
Source: Indra
CAGR1 (16-20)Excluding
2018
Eurofighter
revenues fall
355€M
270€M
599€M
1,897€M2
Revenues 2016
02. Our Strategic Plan
T&D and TI businesses growth expectations

18
Amortisation will increase due to:
• Finalisation and commercial launch of proprietary products
• Larger CapEx
• Tecnocom Purchase Price Allocation
Increased level of CapExin 2018-2020…
Total CapEx
(€M)• Invest to reinforce those products where we already have a
leading position
• Apply digital technologies to further position our offering in the smart ecosystem
• Complement selectively our proprietary products portfolioto sell complete end-to-end solutions
…to accelerate growth while migrating to high value
2015 - 2017
100 -110 €M
2018 - 2020
150 – 200 €M
x1.5 – x2
increase
We will increase CapEx to foster growth in selected areas02. Our Strategic Plan

19
The new norm specifies, in a more restrictive way, how and when
corporates will recognise revenue
The standard provides a five-step model to be applied to all contracts with customers:
• Identify the contract
• Identify the performance obligations in the contract
• Determine the transaction price
• Allocate the transaction price to the performance obligations in
the contract
• Recognise revenue when the entity satisfies a performance
obligation
The new standard includes requirements for recognition and
measurement, impairment, de-recognition and hedge accounting
The directive implies the recognition of a potential provision under
the principle of expected losses versus incurred losses over our existing assets (mainly clients and unbilled clients)
The purpose is to provide a high-level overview of the IFRS requirements on the following areas:
• Classification and measurement of financial assets and liabilities
• Impairment
• Hedge accounting
IFRS 15 IFRS 9
Note: New effective date of IFRS 15 and IFRS 9 – 1st January 2018
• Impact on reserves: 1st January to be determined
• Some moderate impact on revenues (from 2018 onwards)
• Limited impact on margins (from 2018 onwards)
02. Our Strategic Plan
IFRS 15 and IFRS 9 implementation details
20
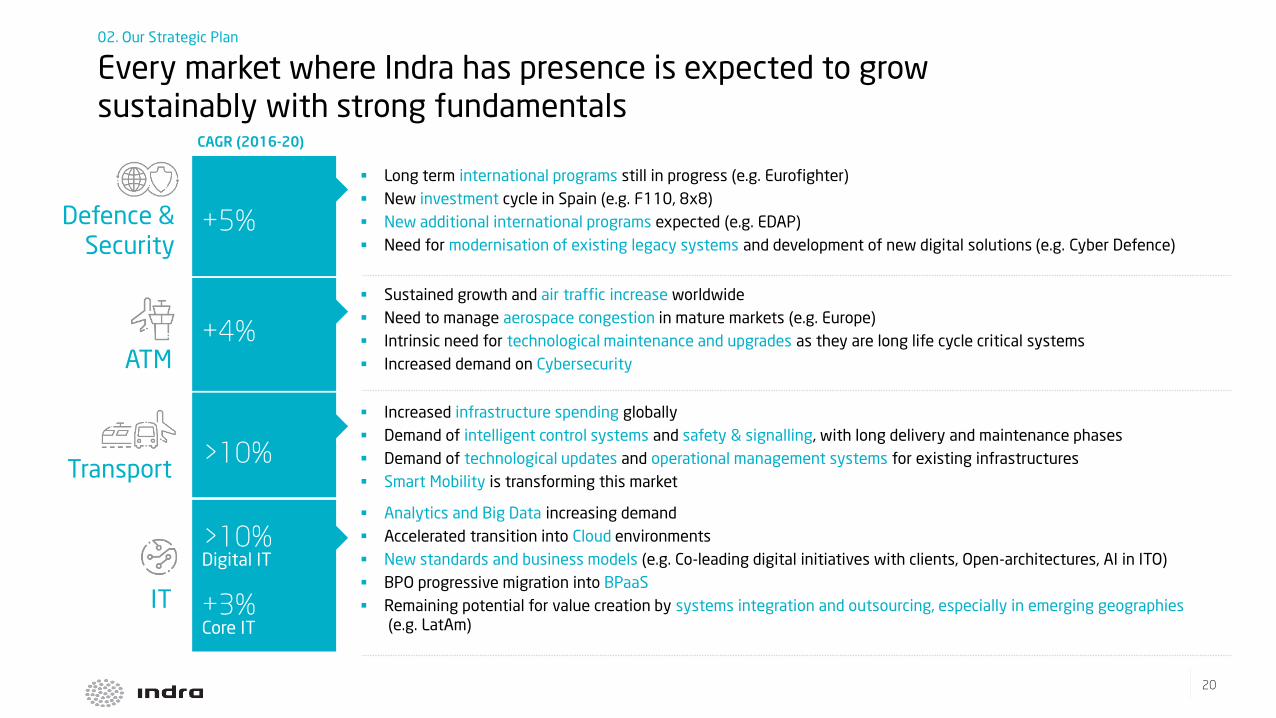
Long term international programs still in progress (e.g. Eurofighter)
New investment cycle in Spain (e.g. F110, 8x8)
New additional international programs expected (e.g. EDAP)
Need for modernisation of existing legacy systems and development of new digital solutions (e.g. Cyber Defence)
Sustained growth and air traffic increase worldwide
Need to manage aerospace congestion in mature markets (e.g. Europe)
Intrinsic need for technological maintenance and upgrades as they are long life cycle critical systems
Increased demand on Cybersecurity
Increased infrastructure spending globally
Demand of intelligent control systems and safety & signalling, with long delivery and maintenance phases
Demand of technological updates and operational management systems for existing infrastructures
Smart Mobility is transforming this market
Defence &Security
ATM
Transport
+5%
+4%
>10%
CAGR (2016-20)
Analytics and Big Data increasing demand
Accelerated transition into Cloud environments
New standards and business models (e.g. Co-leading digital initiatives with clients, Open-architectures, AI in ITO)
BPO progressive migration into BPaaS
Remaining potential for value creation by systems integration and outsourcing, especially in emerging geographies(e.g. LatAm)
IT
>10%Digital IT
+3%Core IT
02. Our Strategic Plan
Every market where Indra has presence is expected to grow sustainably with strong fundamentals

21
All our clients are facing the digital transformation of their operations
Satellite
Communications>10%
Simulation 4%
Electronic Warfare 4%
Border Surveillance 6%
Air Defence 3%
Safety &
Signalling>10%
Operational Systems >10%
Control &
Enforcement6%
Revenue Collection 8%
Sources: Markets and markets, Indra Analysis
TransportAir Traffic ManagementDefence & Security
Communications,
Navigation,
Surveillance
5%
Air Traffic
Management 3%
The smart
segment
of all
these
solutions
is growing
over 20%
Expected CAGR (%)Expected CAGR (%) Expected CAGR (%)
03. Transport & Defence
Positive market outlook in every business in T&D

22
Revenue Collection Control & Enforcement Safety & Signalling
59
6
27
8
309Transport
(26%)
1,183
Defence &Security
(23%)
ATM
2017
(50%)
Transport
Defence & Security
Air Defence & Border Surveillance
Electronic Warfare SimulationSatellite
Communications
ATM
ATM systems Communications Navigation Surveillance
Indra is a global reference in many of these technological niche markets
Operational systems
03. Transport & Defence
Indra has a portfolio of leading proprietary solutions in T&D

23
Shared engineering and manufacturing capabilities
Shared technologies
Clear offering development and operational synergies within T&D
Radars ControlNavigation
aids
Communi-
cations
Cyber &
analytics
Procurement
Production
management
Post sales support and
maintenance
DeliveryLife cycle
management
Defence & Security
ATM
Transport
We will continue improving our operations as part of our strategic guidelines
Increased
efficiency
(10-15%
in 2020 vs
2017)
• Building blocks standardisation
• Lean manufacturing
• Make vs buy optimisation
• Delayering
• Increased interaction between
commercial, manufacturing and
delivery
End-to-end process review
Improved
agility,
improved
time to
market
03. Transport & Defence
We will continue taking advantage of synergies and economies of scale within T&D

24
Indra's accessible geographies will grow
• Revitalised NATO push for 2% GDP defence expenditure
• European Defence Fund investing up to 5.5€Bn/year
Geopolitical uncertainty is increasing amidst growing security threats
"Cyber threats are becoming more common, sophisticated and damaging (…) In 2016 NATO experienced an average of 500 incidents per month – an increase of roughly 60% over 2015"
NATO Cyber Defence Factsheet, May 2017
"The events that shaped 2016 added a new sense of urgency and determination to see Europe delivering on its potential in defence"
European Defence Agency 2016 Annual Report
0
500
20202016 2018
Global Defence procurement
(ex North America), $Bn
+4%
Indra's home market in Spain is launching a new investment cycle
• Strong R&D programs launched by 2015 will be
progressing into production phase
• Additionally, new R&D programs starting
+3% CAGREurope
+13% CAGRLatAm
+9% CAGRMiddle East & Africa
+6% CAGRAsia Pacific
Note: NATO (North Atlantic Treaty Organisation). UN (United Nations). Source: IHS Jane's Defence Budgets 2017
"Effective border security is key to the effective implementation of counter-terrorism measures"
UN, 2017
And Security market gaining relevance linked to an increase in border control and surveillance
03. Transport & Defence
Defence & Security is an attractive market with a clear growth trend

25
A400M
2003-2024
NH90
1992-2024
Tiger
1988-…
Eurofighter
1986-…
There have been significant developments linked with the new Spanish investment cycle
Existing long-term high volume programs are still in progress
SST
2003-2024
Note: DASS (Defensive Aids Sub-System). DIRCM (Directional Infrared Counter Measures). CAS (Close Air Support).
SST (Space Surveillance & Tracking)
Integrated
frigate mast
• 90€M in R&D phase
• ~350€M in
production phase
Electronic
warfare system
• ~350€M project,
not including
associated
platforms
Space surveillance radar
• 15€M R&D
• ~340€M
production
project, with EU
funding
Vehicle systems
• 28€M in R&D
phase
• ~500€M in
production phase
Sustainment, sales and export opportunities
Future upgrades of main subsystems (e.g. radar, DASS)
Systems (e.g. DIRCM) and simulation
Systems (e.g. CAS)
and aftermarket
+8x8
2015-2026
F110
2014-2026
Santiago
2015-…
03. Transport & Defence
Defence & Security is a long maturity market, with still ongoing high volume programs and local programs entering into production

26
Air Defence Electronic Warfare
Airborne
Platforms
•BPE
•BAC
•BAM
•FFG
•F122
•K130
•Eurofighter
•A400M
•C-295
•F/A-18
•F1
•NH90
•P3
•B707
Naval
Platforms
•Chinook
•CH53
•Tigre
•Cougar
•U212/214
•T-209
•OPV
•F100
•F105
•S70
Land based
Air Defence Electronic Warfare
Border Surveillance
Border Surveillance
Naval
Land
based
•BPE
•BAC
•BAM
•F100
•F105
•FFG
•S70
•S80
•F122
•K130
•U212
•U214
•T-204
•AWD
•ASW
•OPV
Satellite Communications
•Eurofighter
•A400M
•A330 MRTT
•F-18
•AV-8B
•Tiger
•Seahawk
•NH90
•Wildcat
Simulation
•Chinook
•Cougar
•H135
•H225
•H175
•H145
•A320
•B737…
Military Simulation
03. Transport & Defence
Indra is a significant European player with a proven track record, and with an already relevant international business
27
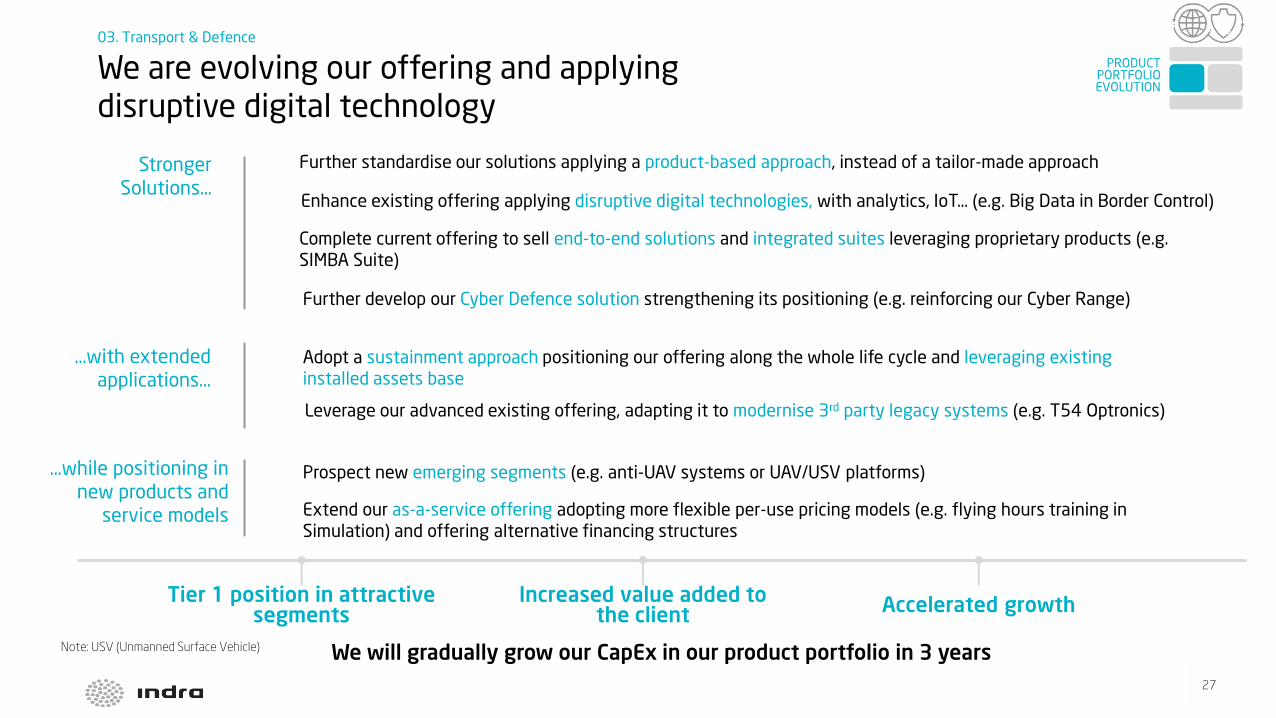
Enhance existing offering applying disruptive digital technologies, with analytics, IoT… (e.g. Big Data in Border Control)
Extend our as-a-service offering adopting more flexible per-use pricing models (e.g. flying hours training in
Simulation) and offering alternative financing structures
Prospect new emerging segments (e.g. anti-UAV systems or UAV/USV platforms)
Further develop our Cyber Defence solution strengthening its positioning (e.g. reinforcing our Cyber Range)
Leverage our advanced existing offering, adapting it to modernise 3rd party legacy systems (e.g. T54 Optronics)
Further standardise our solutions applying a product-based approach, instead of a tailor-made approach
Complete current offering to sell end-to-end solutions and integrated suites leveraging proprietary products (e.g.
SIMBA Suite)
Adopt a sustainment approach positioning our offering along the whole life cycle and leveraging existing
installed assets base
Tier 1 position in attractive segments
Increased value added to the client Accelerated growth
Stronger
Solutions…
…with extended
applications…
…while positioning in
new products and
service models
We will gradually grow our CapEx in our product portfolio in 3 years
PRODUCT PORTFOLIO EVOLUTION
Note: USV (Unmanned Surface Vehicle)
03. Transport & Defence
We are evolving our offering and applying disruptive digital technology

28
Specific commercial action plans per solution and strengthened alliances with platform integrators
Specific action plans
(e.g. Borders, Simulation)
END USER
Naval LandAir
Special focus on markets with high potential
• Europe, as extended home market
• Specific LatAm countries (e.g. Colombia, Ecuador)
• Asia, Middle East and Oceania
Develop strategic alliances with local partners
• Offering our full portfolio
• Gaining recurrence
Approach Aftermarket where local installed base and recurrence have enough scale for a sustainable business
Strengthened commercial action in target geographies
We already identified a solid pipeline (~2.3€Bn) to sustain future growth
Strengthen existing +
new alliances with platform integrators
SEGMENTED COMMERCIAL
PROCESSES
03. Transport & Defence
We will grow our international sales selectively
29
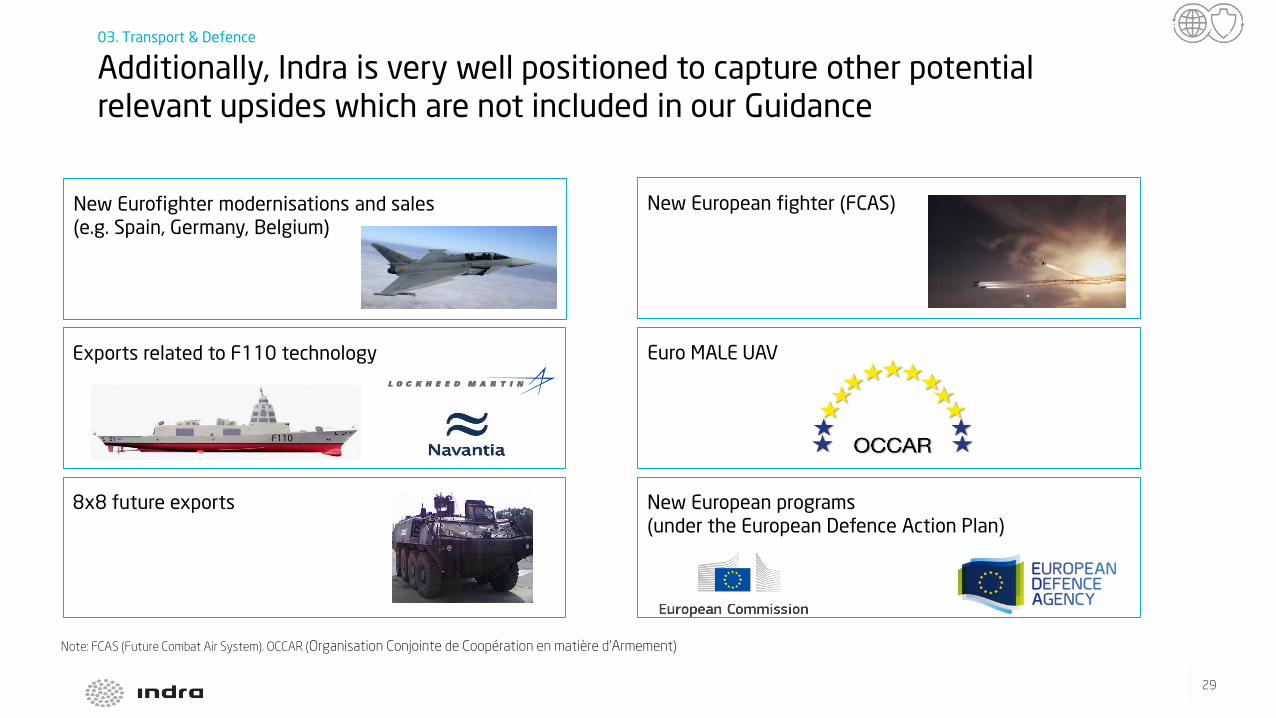
New European fighter (FCAS)New Eurofighter modernisations and sales
(e.g. Spain, Germany, Belgium)
8x8 future exports New European programs
(under the European Defence Action Plan)
Exports related to F110 technology
F110
Euro MALE UAV
Note: FCAS (Future Combat Air System). OCCAR (Organisation Conjointe de Coopération en matière d'Armement)
03. Transport & Defence
Additionally, Indra is very well positioned to capture other potential relevant upsides which are not included in our Guidance

30
Expected stable ~4% growth in the ATM market
10
20
30
0
7
17
2016
Passenger traffic (RPKs Bn)
4.7%
2036
Note: RPKs (Revenue per kilometre). Source: Boeing Market Outlook 2017-2036; Markets and markets; Global airport construction review, CAPA
Maintenance and replacementof legacy systems
• Very long development cycles,
high client loyalty
Potential new ATM systems operators
• Already ~400 airports under
construction or planned for
Innovative technology to solve aerospace congestion (e.g. Europe)
Increase of air passenger traffic worldwide
Increase of flying aircrafts worldwide
3 drivers of sustained demand for ATM systems
80
0
20
60
40
23
Aircrafts in service worldwide (k)
2016
47
3.5%
2036
03. Transport & Defence
ATM is a growing market with very strong fundamentals
31
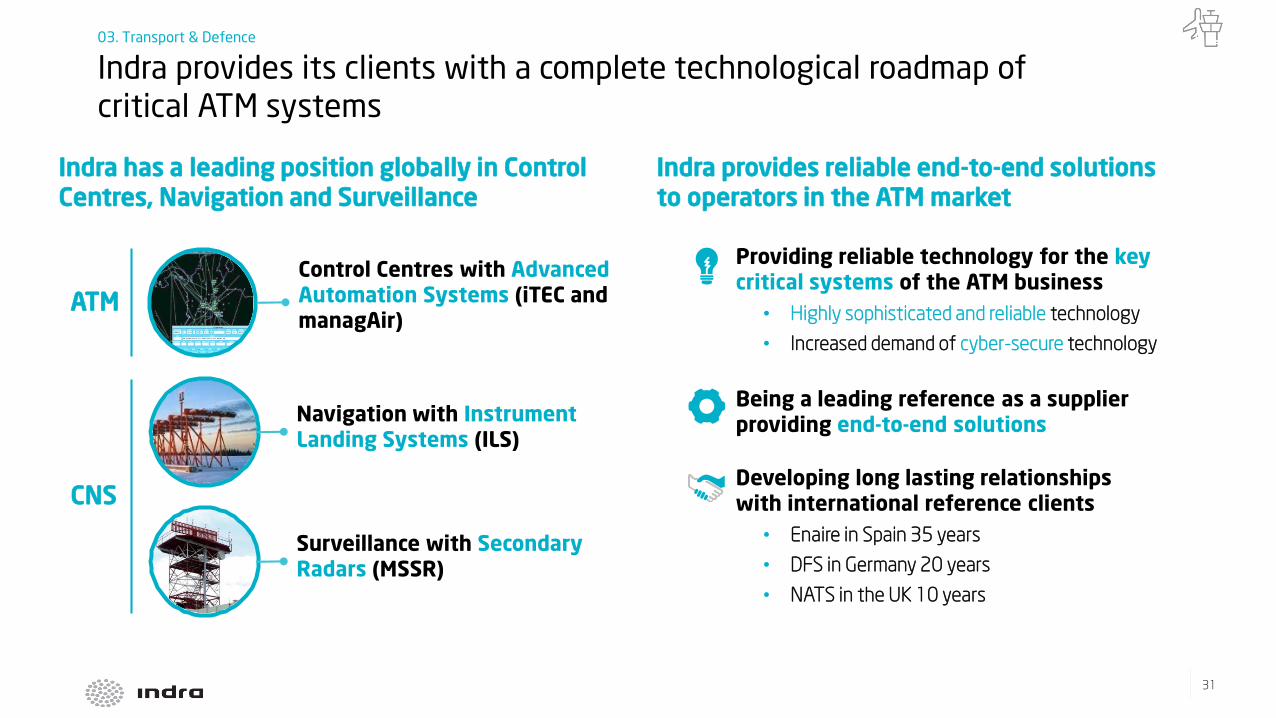
Indra provides reliable end-to-end solutions to operators in the ATM market
Being a leading reference as a supplier providing end-to-end solutions
Providing reliable technology for the key critical systems of the ATM business
• Highly sophisticated and reliable technology
• Increased demand of cyber-secure technology
Developing long lasting relationships with international reference clients
• Enaire in Spain 35 years
• DFS in Germany 20 years
• NATS in the UK 10 years
Indra has a leading position globally in Control Centres, Navigation and Surveillance
Control Centres with Advanced Automation Systems (iTEC and managAir)
ATM
CNS
Surveillance with Secondary Radars (MSSR)
Navigation with Instrument Landing Systems (ILS)
03. Transport & Defence
Indra provides its clients with a complete technological roadmap of critical ATM systems

32
Europe has a challenge in air traffic management due to air traffic congestion and the fragmentation of aerospace
Note: SESAR (Single European Sky ATM Research)
iTEC by Indra
Coflight
Coopans
Other potential
iTEC partners
In 2004 Eurocontrol, the European Commission and a selection of industrial partners took the lead to solve this issue and increase interoperability
Indra is one of the key industrial partners of SESAR
7 European countries have already joined the iTECAlliance along with Indra to fulfil present and future SESAR requirements, and +20 countries still pending to adopt a decision
03. Transport & Defence
Indra is the leading player in the Single European Sky with the iTEC system...

33
~200 Control Centres
~1,700 Instrument Landing Systems (ILS)
~400 Secondary Radars (MSSR)
Note: Most significant countries with Indra's presence highlighted
Indra ATM businessis present in
176 countries
03. Transport & Defence
… and one of the leading ATM systems providers in the world, having a large footprint of references globally

34
Further develop remote towers to be a reference
supplier, leveraging SESAR
Indra already has leading technology installed
(e.g. Norway)
Grow on aftermarket leveraging our
significant asset base of ~200 control
centres, ~1700 ILS and ~400 radars installed
Develop leading Cybersecurity technology,
fulfilling latent demand
Successfully evolve iTECwith the future
requirements of the Single European Sky,
leading the SESARinteroperability
Evolve CNS products and service model
(e.g. GBAS) to maintain the
technological and commercial leading
position
Expanding into new segments to complement Indra's offering
Keep evolving leading products in current segments with technological updates
Note: ILS (Instrument Landing System). GBAS (Ground Based Augmentation Systems). ADS–B (Automatic dependent surveillance – broadcast). SESAR (Single European Sky ATM Research)
We will gradually grow our CapEx in our product portfolio in 3 years
PRODUCT PORTFOLIO EVOLUTION
03. Transport & Defence
We are evolving and expanding our offering into new segments

35
LatAm is a very strong Indra market,
but still with important
opportunities to come
America
Further expand iTECand continue
growing with other CNS technologies
Europe
Potential upside to continue growing,
entering new countries
Africa
Indra's recent successful projects
allows us to continue growing
Middle East
Continue capturing opportunities in a
fast growing market
Asia Pacific
Strong positioningLeader in LatAm and Europe
SEGMENTED COMMERCIAL
PROCESSES
Multination program (ATM and
CNS) for COCESNA countries
20 years supplying ATM and
CNS systems to Morocco
Countrywide Advanced ATM
systems in Oman
Coverage of ~60% of China's
aerospace
Note: COCESNA (Central American Corporation for Air Navigational Services). ATM (Advanced automation systems for Air Traffic Management), CNS (Communications, Navigation and Services), ILS (Instrument Landing System)
Key relationships with Enaire (Spain),
NATS (UK) and DFS (Germany)
03. Transport & Defence
We will continue internationalising our business by leveraging our strong offering

36
Change in infrastructure operating models are generating additional opportunities
Increased demand for intelligent systems adapting to
the coming trend of Smart Transport
• Requiring mobility, interconnectivity and real time
steering
More flexible asset management demand is requiring
new systems
• More efficient and scalable
New opportunities for private players, as public
administrations are externalising their operations and
sharing risks (PPPs)
Change of cycle in infrastructure investment and therefore increased technology demand
+5% growth in global
investment for Transportinfrastructure
expected until 2025
Changed trend in
Spanish infrastructureinvestment
• -4% growth 2010-2014
• +2% growth 2015-2025
Indra has the perfect mix: transport business
know-how, proprietary products and digital capabilities
+10% expected growth
(+20% for Smart Transport)
Transport infrastructure technology demand increased by
• New investment cycle
• Need for maintenance and upgrade of already existing
infrastructure
+
Source: Oxford Economics, Assessing the global transport infrastructure market
03. Transport & Defence
Very attractive technology Transport market, entering into a phase of expansion
37
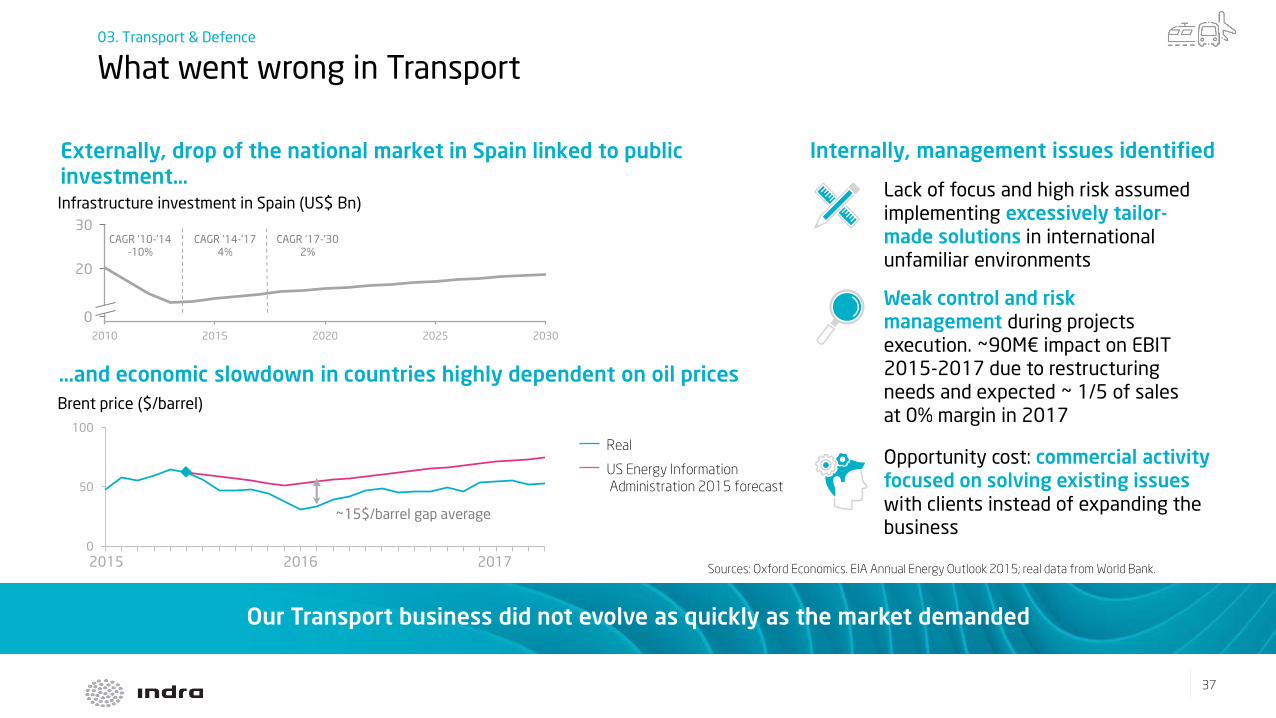
Our Transport business did not evolve as quickly as the market demanded
0
50
100
20172015 2016
Lack of focus and high risk assumed
implementing excessively tailor-made solutions in international unfamiliar environments
Weak control and risk management during projects
execution. ~90M€ impact on EBIT 2015-2017 due to restructuring
needs and expected ~ 1/5 of sales
at 0% margin in 2017
Opportunity cost: commercial activity focused on solving existing issues with clients instead of expanding the business
2010 2015 2020 2025 2030
0
20
30
Real
US Energy Information
Administration 2015 forecast
Internally, management issues identifiedExternally, drop of the national market in Spain linked to public investment…Infrastructure investment in Spain (US$ Bn)
Brent price ($/barrel)
…and economic slowdown in countries highly dependent on oil prices
Sources: Oxford Economics. EIA Annual Energy Outlook 2015; real data from World Bank.
CAGR '10-'14-10%
CAGR '14-'174%
CAGR '17-'302%
~15$/barrel gap average
03. Transport & Defence
What went wrong in Transport

38
Portfolio rationalisation and development of more standardised and packaged solutions
Evolve proprietary products, strengthening our position in the Smart Transport market by taking them to the next technological step by gradually growing CapEx
Product Portfolio Evolution
New organisation and team
New governance model (e.g. new organisation, new profiles, increased specialisation)
Improved commercial processes (e.g. competitors intelligence, KPIs and incentives)
New commercial plans on existing clients and prioritised geographies
Segmented Commercial Processes
Opportunity to become an international reference in rail Safety & Signalling (ERTMS) beyond the local market
Potential upsides
Restructured organisation and new team already in charge
New operational plan improving control and risk management
Ongoing Productivity Upgrades
New structure and external talent recruited for top management positions• Reinforced clients and competitors view
Note: ERTMS (European Rail Traffic Management System)
03. Transport & Defence
We have started a clear plan to execute Transport turnaround
39
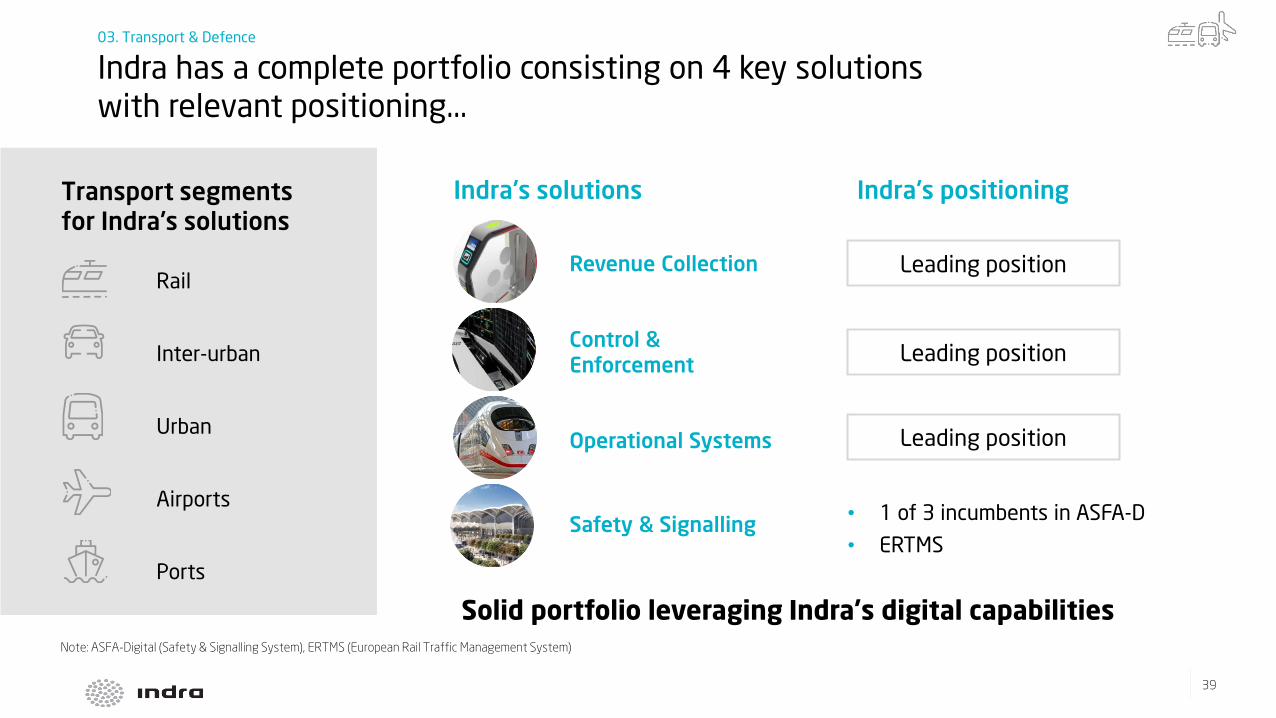
Indra's solutions
Safety & Signalling
Control & Enforcement
Revenue Collection
Operational Systems
Indra's positioning
• 1 of 3 incumbents in ASFA-D
• ERTMS
Transport segments for Indra's solutions
Rail
Urban
Inter-urban
Airports
Ports
Leading position
Leading position
Leading position
Solid portfolio leveraging Indra's digital capabilitiesNote: ASFA-Digital (Safety & Signalling System), ERTMS (European Rail Traffic Management System)
03. Transport & Defence
Indra has a complete portfolio consisting on 4 key solutions with relevant positioning...

40
Revenue Collection
Control & Enforcement
OperationalSystems
Safety & Signalling
T-Mobilitat, Spain
• Biggest integration fare
& contactless project
Nation-wide Road Traffic
Control Centre, Spain
• Spanish traffic
management
Port Community
System, Portugal
• National port network
installation
High Speed, Spain
• Rail communications
& surveillance
Riyadh Ticketing
• Biggest greenfield
contactless ticketing
worldwide
Urban Tunnels Control
Centre, UK
• Iconic and complex due
to London constraints
High Speed
Mecca – Medina, Arabia
• Most complex project in
Middle East
Sydney Trains, Australia
• Advanced security
system
Ticketing, The Netherlands
• Innovative AFC machines
Tunnel Control Centre,
UK
• New smart trends in
traffic management
High Speed Rail Control
Centre, Spain
• Worldwide showroom
ASFA-D, Spain
• High end solution for
traditional rail safety in
Spain
Note: ASFA-Digital (Safety & Signalling System)
03. Transport & Defence
... with strong references in the most innovative projects globally

41
We will gradually grow our CapEx in our product portfolio in 3 years
Consolidate Indra's positioning in the traditional segmentIncrease recurrence and profitability
Evolve existing product portfolio to capture opportunities in the Smart Transport ecosystemPosition in the rapidly growing and fragmented smart transport market
Culmination of our investment in ERTMSOur goal is to become the Spanish big player in the
international safety market
PRODUCT PORTFOLIO EVOLUTION
Note: ERTMS (European Rail Traffic Management System)
03. Transport & Defence
3 key priorities in our offering enhancement

42
New governance model New selective Commercial Plans
+Volume +Profitability +Recurrence
• Product managers focused on
pre-sales activities
• Key account managers structured
according to our 4 solutions, clients
and geographies
• Specialised profiles per client and
geography with stronger commercial
skills
• Focused commercial efforts geographically
– Consolidate existing presence assuring
recurrence clients in Europe, LatAm, Middle East
and Asia Pacific
– Gain additional penetration in US, Canada, UK
and Nordic Countries
• Product portfolio taxonomy
• Client segmentation and prioritisation
New KPIs and incentives
SEGMENTED COMMERCIAL
PROCESSES
03. Transport & Defence
For this new stage we will strongly reinforce our commercial activity to generate quality pipeline and higher win-rate

43
Digitalisation is a direct driver
for value
In 2015 digital was an emerging
business, today it is on the CEO
main agenda
Market conditions are
expected to be favourable
NASDAQ 100 outperformed S&P500 by 17 p.p. since our first IDay in 2015
Top 5 most valued companies
2006 2016
Source: Market and markets, Gartner, International Data Corporation (IDC), BCG Perspectives 1. Cyber 17-22 CAGR, IoT 16-20 CAGR, Cloud 17-20 CAGR, AI 16-22 CAGR
16%
Cloud
55%
11%
20%
Cyber IoT AI
Expected average annual
growth1
Technology is the 2nd most cited priority for CEOs after growth……42% of CEOs say "digital first" or "digital to core" is their company digital business posture
"CIOs now have a unique opportunity, but they must 'flip' their information, technology, value and people leadership practices to deliver on the digital promise"
Technology is becoming increasingly relevant on CEO agenda and market expectations are favourable for growth…
04. Information Technology

44
Need to address the
full Board of Directors
Need to build new types of deals /
pricing / risk models
Need to reinforce our
position as an E2E specialised player
Need to attract,
retain and develop
top digital talent
New technologybuyers
New digital capabilities
New contracting models
New types of competitors
Digital transformation as
top topic on the CEO
agenda
Greater involvement and
IT budgets in business areas
New roles like Chief Data
Officer or Chief Digital
Officer & transition from CTO to CIO
Increasing demand of
digital capabilities
(e.g. Analytics, Cyber)
Increasing market
competition for digital talent
Imperative to transform,
develop and hold
in-house talent
Cloud/As-A-Service
models becoming
mainstream for SW
Success fee and value
based deals gaining relevance
Strategic topics demand
exclusivity
and JV models
Strategic consulting
firms moving into digital
New digital players
growing into
implementation
In some cases, clients are becoming real
competitors (e.g. telcos)
Changing market demands force IT companies to rapidly adapt their offering and operating model...
04. Information Technology

45
-67€MEBIT
+17€MEBIT*
Pending write-offs
Brazil´s losses
Heavy cost structure
Limited standardisation of
proprietary products and
disperse portfolio
Lack of control and proliferation
of onerous projects
No additional significant write-offs
Brazil´s business under control
Leaner cost structure
Rationalised portfolio and structured product offering
Increased control and tracking due to an improved analytical
accounting and reduction of onerous projects
2015 LTM Sep 2017
(*) Sep 17 displayed data includes Tecnocom consolidation since April 18th, 2017
04. Information Technology
In the last three years, we have performed a successful turnaround of our IT business

46
Minsait launch High value brand, focused on digital transformation
Transformation trigger of our move to high value
Source of margin, growth and talent attraction
Product and service portfolio enhancement
Rationalisation and standardisation of our product portfolio easing implementation
Migration of our products to Cloud
New product delivery model with specialised centres of excellence Development of new digital offering (e.g. Analytics, Cloud services, Cybersecurity)
Portfolio mix enrichment
Migration of our portfolio towards high value-added services and solutions for digital
transformation
Successful integration of Tecnocom
Consolidated leadership in Spain and increased client base due to high portfolio
complementarity
Reinforcement of our product portfolio with Tecnocom's payment processing solutions Cost synergies on track and identified potential for efficiency in production
Reinforced control and delivery model
Increased control in tender offering process
Closer monitoring of less profitable projects
Sharp reduction in the number of unprofitable projects
04. Information Technology
We have strengthened the fundamentals of our business, setting up a solid starting point for the next growth cycle

47
2,500
1,500
500
0
1,702
IT revenues (€M)
LTM Sep
2017*
1,686
LTM Sep
2015
Lower growth in Latin
America where Indra has
high exposure
Delayed public contracts
due to lack of government
during several quarters in
Spain
Low commodity prices and
oil crisis limiting GDP growth
in key markets
... resulting in lower sales than expected
... in a difficult macro context...Despite of our progress, we faced challenges...
Harder restructuring, needing greater
focus and efforts than expected
Longer and more difficult transition to exit from onerous projects
• High impact of non profitable sales
lost (Brazil)
• Focus on healthy growth, instead of
growth at any cost
Slower mix change towards high value
• Market evolved from generating digital
needs for our clients…
• ..to be the highly demanded topic
Cultural change is not immediate
(*) Sep 17 displayed data includes Tecnocom consolidation since April 18th, 2017
However, our focus on building a healthy business had an impact on the overall sales volume
04. Information Technology

48
Build digital products and capabilities to operate in
an Open ecosystem
Seek for business through digital initiatives (Analytics) of our clients' business lines (channels,
operations, products)
Actively pursue
transformational projects
leveraging our vertical product portfolio and deep knowledge of core systems
Legacy No legacy
Digital
Core
ProductivityOutsourcing& BPO
Core Legacytransformation
DigitalInitiatives
New Digital Businesses
4
1
2
3
4
3 Proactively seek
opportunities to deliver productivity on Outsourcing & BPO of core legacy systems, leveraging new
technologies and a culture of
continuous improvement
We are internally pushing forward the digital transformation we will bring to our clients
1
2
Transformation roadmap
We have identified 4 waves to evolve from "core businesses" to "digital business platforms"
04. Information Technology
PRODUCTPORTFOLIOEVOLUTION

49
New digitalbusinesses
Digitalinitiatives
Improve internal
productivity and offering
of multiclient ITO
maintenance with Lean
• Automation of low complexity
tasks
• Implement predictable
mechanism to reduce lead
times (AI)
• New ways of working
• Process streamlining: reduce
bouncing
Transform Indra payment
platform to create a high
performance multi-client
service
• Redefinition of the
architecture to work on open
environments
• Omnichannel client
experience
• SaaS models of delivery
• Operating on Cloud
environments
Transform patient - doctor
interaction offering new
digital services following a
mobile-only strategy
• Definition of new business
model
• Definition of digital customer
journey
• Integration with customer'
personal health folder
• Orchestration of an ecosystem
of functionality providers
Co-create, together with
our client, a circular
economy platform
delivered to cities on Cloud
• Business platform approach
• Country-wide intelligence,
enabling best practices
adoption
• Innovation through geo-
analytics, IoT and Artificial
Intelligence
Core legacytransformation
ProductivityOutsourcing & BPO
1 2 3 4
PRODUCTPORTFOLIOEVOLUTION
Multi-clientITO
Tecnocom's Payment Processing Solution
Leading healthcare firm
Leading recycling company
We have already started our digital transformation journey with successful references
04. Information Technology

50
SEGMENTED COMMERCIAL
PROCESSES
Actively focus on big deals
Minsait as trigger for transformation projects
Upgrade sales for legacy systems with new features
Alliances reinforcement
Third party specialised channels
Vertical specialised commercial forces
Focus on E2E transformational projects accompanied by an innovative pricing scheme
Prioritise product specialisation to internationalise growth
Proprietary productsE2E value propositions
We have segmented our commercial approach based on client needs, opportunities and offering
04. Information Technology

51
Rest of the worldLatAmSpain
Use Minsait as trigger of end-to-end projects for digital transformation
Emphasise co-leading digital initiatives and businesses to accelerate migration to high value and build references
Prioritise portfolio mix shift towards
digital, while maintaining market
positioning on traditional services
Leverage specialised global teams of our products
Launch Minsait commercially in key countries
Take advantage of growth opportunities (SAP in I&R, payments solutions)
Establish new alliances to expand the reach of our products (e.g. Microsoft's Azure)
Actively commercialise (push) more efficient digitalised traditional offering – taking advantage of transformation
Grow profitably and sustainably while
expanding Minsait and seizing
transformation opportunities
Base growth on our proprietary
products and strategic alliances
Proactively pursue big transformational deals with dedicated teams (e.g. externalisations in Banking)
Leverage global teams specialised in proprietary products
• e.g. Energy distribution
solution (InGrid), payment
processing solutions, Hotel
Management solution
Seek for more efficient digitalised traditional projects (e.g. directly implement Outsourcing in Cloud)
Explore third party channels
End-to-end value propositions Proprietary products
Leverage vertical specialised teams to accelerate high value migration
SEGMENTED COMMERCIAL
PROCESSES
Adapting our commercial approach to our client needs in each of our geographies prioritising digital growth
04. Information Technology

52
4Global Production
3Pyramid Optimisation
2 Delayering
1Lean & Automation
Apply full end-to-end Lean approach, fostering a culture of continuous improvement and placing automation at the core of our operations
Reduce management layers to increase agility and accountability while maximising efficiency
Reshape our production and delivery pyramid
Increase off-shoring by leveraging our existing capabilities in Latin America
~1.5-2ppinduced direct
margin increase
by 2020
ONGOING PRODUCTIVITY
UPGRADES
We have designed an aggressive efficiency plan by applying new technologies
04. Information Technology

53
New Specialised Operating Model
Ongoing Productivity Upgrades
ProductPortfolio Evolution
Segmented Commercial Processes
02 03
04
01
IT Market outlook and Indra's positioning
• IT is a highly attractive market, disrupted by digital transformation
• Indra is in a privileged position to capture profitable growth opportunities
Product Portfolio Evolution
• Push forward end-to-end value propositions to accelerate our high value
migration
• Consolidate our proprietary products
Segmented Commercial Processes
• Focus on E2E transformational projects accompanied by an innovative
pricing scheme
• Prioritise product specialisation to internationalise growth
Ongoing Productivity Upgrades
• Continue applying full end-to-end Lean approach and automations
• Optimize delayering and intensify management of our production and
delivery pyramid
• Increase off-shoring by leveraging our existing capabilities in Latin
America
IT closing remarks04. Information Technology

54
LatAmaccelerated
growth
Seasonal Electoral
Processes
Accelerated digital
transformation
04. Information Technology
Additional potential upsides not considered in the guidance

Annex I:
Last quarterly results

565656|
6 • 2017 Net Income up by +82% totaling 127€m and 2017 EPS up by +73%
1 • 2017 Order Intake up +18%, Revenues +11% and EBIT +21% due to Tecnocom’s consolidation and the acceleration of organic growth in 2H17
5 • Net Debt/EBITDA LTM down to 2.2x. Ex-acquisitions, it would have decreased to 1.2x
3 • EBIT margin of 6.5% in 2017 vs 6.0% in 2016. EBIT margin Ex-Tecnocom of 7.2% in 2017.
4 • Solid 2017 FCF generation (€186m) backed by the operating improvement.
2 • Organic revenues (Ex-Tecnocom) +1.8% in 2017 and +8,3% in 4Q17.
• Fast execution of Tecnocom cost synergies with lower than expected restructuring costs.7
In summary, 2017 has shown double digit growth in all P&L items, guidance fully achieved and Tecnocom successfully integrated
MAIN HEADLINESAnnex I. Last quarterly results

575757|
FY17 GUIDANCE RESULTS FY17
Low Single Digit in local currency
> 2016 EBIT Margin (6,0%)
> 2016 FCF before Working Capital (118 M€)
+1,8%
7,2%
202M€
INDRA Ex-Tecnocom
Revenues
EBIT Margin
Free Cash Flow
WE HAVE FULFILLED ALL OUR GUIDANCE METRICS FOR 2017Annex I. Last quarterly results

585858|
Reported +11%
FY17 Sales Growth 4Q17 Sales Growth
Local Currency +11%
Organic Terms (Ex-Tecnocom)(1) +2%
Reported +18%
Local Currency +20%
Organic Terms (Ex-Tecnocom)(1) +8%
(1) Sales excluding Tecnocom and in local currency
(*) Displayed data includes Tecnocom, consolidated since April 18th, 2017
€M €M
2.709
2
255 48
3.011
FY16 FX Impact Tecnocom Underlying
growth
FY17*
759
15
8963
895
4Q16 FX Impact Tecnocom Underlying
growth
4Q17*
REVENUES UP +11% (+2% IN ORGANIC TERMS)Annex I. Last quarterly results

595959|
368 477
524492
653656
1.164
1.387
2.709
3.011
FY16 FY17*
43%
14%
19%
24%
46%
16%
16%
22%
-6% / -6%
+31% / +30%
+19% / +19%
-0% / +0%
+11% / +11%
Local Currency / Reported
Revenues (€M)
(*) Displayed data includes Tecnocom, consolidated since April 18th, 2017
Local Currency / Reported
Order Intake (€M)
400 443
542
832
584
724
1.218
1.249
2.744
3.248
FY16 FY17*
44%
15%
20%
21%
38%
14%
26%
22%
+53% / +53%
+11% / +11%
+3% / +3%
+23% / +24%
+18% / +18%
Spain
America
Europe
AMEA
REVENUES AND ORDER INTAKE BY REGIONAnnex I. Last quarterly results

606060|
FY17 EBIT Margin Evolution Ex-TecnocomFY17 EBIT Margin Evolution
4Q EBIT Margin Evolution Ex-Tecnocom
(*) Displayed data includes Tecnocom, consolidated since April 18th, 2017
4Q EBIT Margin Evolution
162
196
FY16 FY17*
6,0%
6,5%
21,1%
+0,5pp
57
72
4Q16 4Q17*
7,6%
8,0%
25,7%
+0,4pp
162
199
FY16 FY17
6,0%
7,2%
23,1%
+1,2pp
57
80
4Q16 4Q17
7,6%
9,9%
39,4%
+2,3pp
Including €49m of write-offs
(1.8% of sales) Including €47m of write-offs (1.6% of sales)
EBIT MARGIN EVOLUTIONAnnex I. Last quarterly results

616161|
625 587
599 596
FY16 FY17
49%-1% / -1%
50%
-3% / -3%1.224 1.183
51% 50%-6% / -6%
FY17 Order Intake (€M)
T&D
Transport & Traffic
Defence & Security
Revenues 4Q17 (€M)
Local Currency / Reported
672 647
569 601
FY16 FY17
46%+6% / +6%
48%
+1% / +1%1.241 1.248
54% 52%-3% / -4%
179 184
198 188
4Q16 4Q17
52%
-5% / -5%
51%
-1% / -2%377 372
48% 49%
+4% / +2%
Local Currency / Reported
Revenues FY17 (€M)
Local Currency / Reported
T&D ORDER INTAKE AND REVENUESAnnex I. Last quarterly results

626262|
13,0%
11,6%
FY16 FY17
-1,4pp
4Q17 EBIT Margin (%)FY17 EBIT Margin (%)
FY17 EBIT (€M) 4Q17 EBIT (€M)
160
137
FY16 FY17
58
32
4Q16 4Q17
15,4%
8,6%
4Q16 4Q17
-6,9pp
T&D MARGIN AND EBIT EVOLUTIONT&DAnnex I. Last quarterly results

636363|
212 236
398506
476
605
400
4811.485
1.828
FY16 FY17*
14%
27%
32%
27%
13%
28%
33%
26%
+11% / +12%
+27% / +27%
+27% / +27%
+21% / +20%
+23% / +23%FY17 Order Intake (€M)
(*) Displayed data includes Tecnocom, consolidated since April 18th, 2017
IT
4Q Revenues (€M)
FY17 Revenues (€M)
Energy & Industry
Financial Services
Telecom & Media
PPAA & Healthcare
Local Currency / Reported
Local Currency / Reported
Local Currency / Reported
165 220
399
628
513
631427
522
FY16 FY17*
11%
27%
34%
28%
11%
31%
32%
26%
+33% / +33%
+58% / +57%
+23% / +23%
+22% / +22%
+33% / +33%
1.504
2.000
51 65
101
151
124
168106
140
4Q16 4Q17*
13%
26%
32%
28%
12%
29%
32%
27%
+32% / +28%
+53% / +50%
+39% / +36%
+34% / +31%
+40% / +37%
381
524
Revenues Ex-Tecnocom up by 6% in both local and reported terms
Revenues Ex-Tecnocom up by 17% in local currency (14% in reported terms
IT ORDER INTAKE AND REVENUESAnnex I. Last quarterly results

646464|
-0,2%
7,7%
4Q16 4Q17*
+7,9pp
2
58
FY16 FY17*
4Q17 EBIT Margin (%)
(*) Displayed data includes Tecnocom, consolidated since April 18th, 2017
FY17 EBIT Margin (%)
4Q17 EBIT (€M)FY17 EBIT (€M)
-1
40
4Q16 4Q17*
0,1%
3,2%
FY16 FY17*
+3,1pp
IT MARGIN AND EBIT EVOLUTIONITAnnex I. Last quarterly results

656565|
FY15* FY16 FY17
614 718 904
928 841 777
-181 -16 -30
-19,5% -1,9% -3,9%
Revenues
EBIT(*)
EBIT Margin(*)
(local currency)
Order Intake
(*) FY15 EBIT Data: excluding write-offs and provisions
(*) EBIT includes contingencies
All onerous projects already closed/finished
Order intake increased by 47% from 2015 to 2017
IT
BRAZILAnnex I. Last quarterly results
666666|
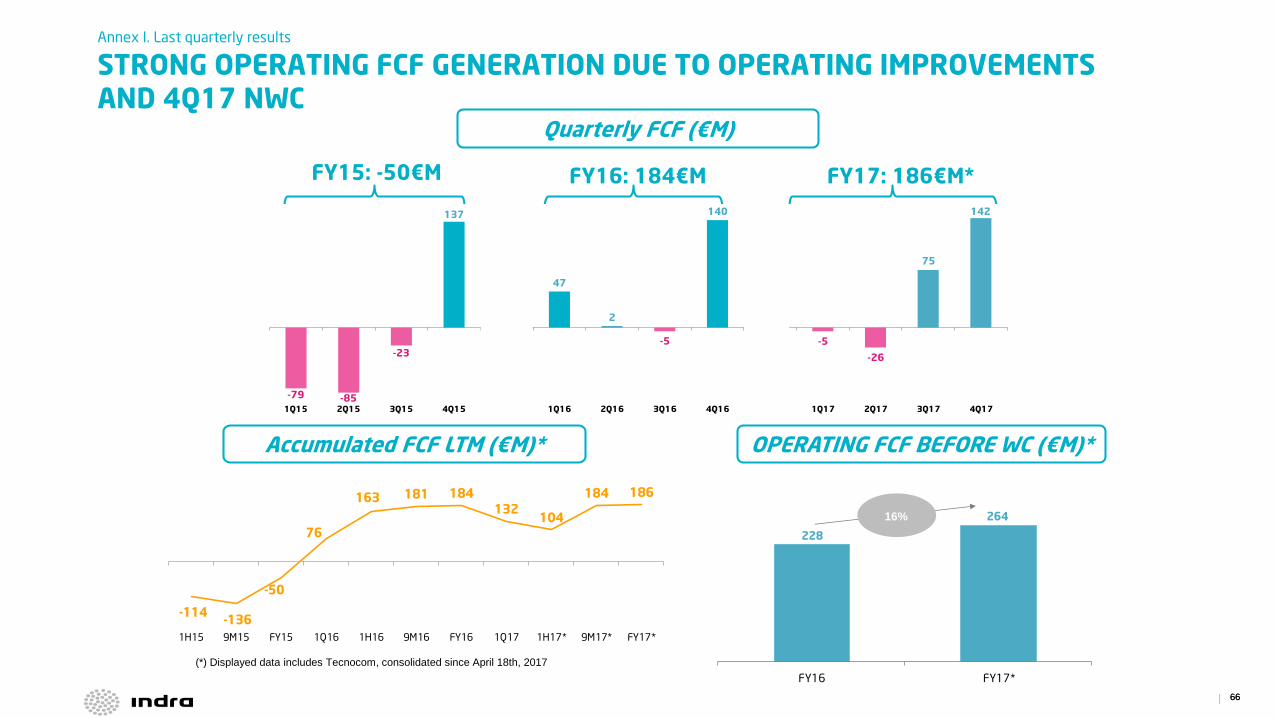
Quarterly FCF (€M)
Accumulated FCF LTM (€M)*
FY15: -50€M FY16: 184€M
OPERATING FCF BEFORE WC (€M)*
FY17: 186€M*
(*) Displayed data includes Tecnocom, consolidated since April 18th, 2017
-114-136
-50
76
163 181 184132
104
184 186
1H15 9M15 FY15 1Q16 1H16 9M16 FY16 1Q17 1H17* 9M17* FY17*
228
264
FY16 FY17*
16%
-79 -85
-23
137
47
2
-5
140
-5
-26
75
142
1Q15 2Q15 3Q15 4Q15 1Q16 2Q16 3Q16 4Q16 1Q17 2Q17 3Q17 4Q17
STRONG OPERATING FCF GENERATION DUE TO OPERATING IMPROVEMENTSAND 4Q17 NWC
Annex I. Last quarterly results

676767|
Net Debt Bridge – Cash Flow (€M)
Net Debt Bridge – Tecnocom’s split(€M)
(*) Acquisitions including Tecnocom, Paradigma and GTA
523
264
20 56 4053 21
252
588
Net Debt FY16 Operating Cash
Flow
Net Working Capital Other Operating
Changes
Capex Taxes Net interest &
Subsidies
Financial
Investments & Non-
CF items & Others
Net Debt FY17*
FCF = €186M
523
186
248 3
588
Net Debt FY16 FY17* Free Cash Flow Acquisitions payment* Net Debt Acquisitions &
Others
Net Debt FY17*
NET DEBT BRIDGEAnnex I. Last quarterly results

686868|
Net Working Capital (DoS)
2 945 -81-1 10
Accounts Receivable Accounts Payable Inventory
(*) Displayed data includes Tecnocom, consolidated since April 18th, 2017
77 71
-82 -82
9 10
5 -1
FY16 FY17*
-0
-6
+1
71 71
-77 -82
11 10
4 -1
9M17* FY17*
-5
+0
-0
NET WORKING CAPITAL EVOLUTIONAnnex I. Last quarterly results

696969|
6,6x
5,4x
2,3x 2,2x
3Q15 4Q15 4Q16 4Q17
837
700
523
588
3Q15 4Q15 4Q16 4Q17
(1) Non-recourse factoring(2) Excluding 2017 M&A
Net Debt (€M)
Net Debt
ND/ EBITDA LTM
(Factoring)(1)
(173)
(187)(187)
Indra Stand-alone
ND/ EBITDA LTM (2)
Indra Stand-alone
Net Debt (2)309
Net Debt/EBITDA LTM (Times)
1,2x
(187)
NET DEBT EVOLUTIONAnnex I. Last quarterly results

707070|
503
188 191
639
Credit Facilities 2018 2019 2020 Beyond 2021
1.520699
270188 191
639
Cash 2018 2019 2020 Beyond 2021
Available Credit Facilities
FY17* FY2016
Total % of total(€M)
(€M)
Gross Debt Maturity Profile
Total % of total
(*) Displayed data includes Tecnocom, consolidated since April 18th, 2017
Net Debt
Available Facilities
(€M)
L/T Debt 1.016 79% 1.136 95%
S/T Debt 271 21% 61 5%
Gross Debt 1.287 100% 1.197 100%
Cost of Gross Debt 2,2% 2,8%
Cash & Others 699 n.m. 674 n.m.
Net Debt 588 n.m. 523 n.m.
Cost of Net Debt 3,0% 3,3%
DEBT STRUCTUREAnnex I. Last quarterly results

Investor [email protected]
Avda. de Bruselas 35
28108 Alcobendas,
Madrid Spain
T +34 91 480 50 00
F +34 91 480 50 80
www.indracompany.com