investor strategy day inputs industry includes 'non-crop' $5.4 billion chemistry global...
TRANSCRIPT

March 2009
Investor Strategy Day

2
Investor Strategy Day
Agenda
Strategic overview Brian Benson
Regional overview – Australia/New Zealand Lachie McKinnon
Regional overview – Europe Alain Chalandon
Hugo Schweers
Regional overview – North America Dale Mellody
Nufarm innovation & product development Mike Pointon
Seeds strategy Brent Zacharias
Plant tours David Pullan
Mick O'Donnell

Global growth strategy
Nufarm Investor Strategy Day
March, 2009
Brian Benson
Group General Manager Agriculture

Agricultural inputs industry
Includes 'non-
crop' $5.4 billion
CHEMISTRY
Global crop
protection 2007 $38.8
billion
Combined markets
$69 billion
Includes ag bio
$6.9 billion
Global seeds market
2007 - $30 billion
BIOLOGY
2008 strong growth in chemistry & biology

Key growth drivers remain in place
Eating more protein/meat
Using crops to produce energy
Growing population
Growing in wealth
De
man
d

Demand and supply imbalance
Source: USDA, FAO, Goldman Sachs Commodities Research
Strong demand will require a substantial increase
in acreage and Yield ImprovementsIndices

Key strategic elements
Consolidate
the base
Build the brand
Build the
organisationDrive for growth
Build strategic
relationships
& alliances

Strategic growth drivers
Build
geographic
platform
Mostly in place
Seeds &
seed
treatment
Emerging growth
platform
Broaden
product
portfolio
Activity is now
focused here

Australia 80%
Total sales
NZ$306m(crop protection)
1995
Australia
80%
ROW
20%
Total sales
$763m(crop protection)
2000
Australia
65%
ROW
35%
Strategic growth drivers
Globalising the business
Total sales
$2.49 billion
(crop protection)
2008
Australia
29%
ROW
71%

Products and pipeline
Expanding product portfolio
Product Category 2007 sales value (US$m)
Herbicides 800
Insecticides 1,350
Fungicides 1,448
Other 50
TOTAL 3,648
Products coming off-patent 2009-2014
Source: Phillips McDougall
Nufarm will continue to target the substantial number of
products coming off patent over the next 5-10 years
25 global projects plus regional projects

Products and pipeline
Portfolio expansion driven by
Access to 'new' off-patent chemistry
New formulations and mixtures
Improved delivery systems
Co-marketing agreements with other companies
Targeted acquisition

Products and pipeline
12
An active, full pipeline …
New herbicide positions
Sulfonylureas
Pyridines
HBNs & mixtures
„Fops‟ and Dims graminicides
New fungicide positions
Fluazinam
Triazoles & mixtures
Strobilurins & mixtures
copper mixtures
New insecticide positions
Global roll-out of neonicotinoids
Pyrethroids
IGRs
Mixtures
New seed treatment positions
Neonicotinoid straights
Triazole straights
Neonicotinoid based mixtures
Triazole based mixtures

Nufarm growth strategy
Key pillars consistent
Growth drivers evolving
Global consistency with regional adaption
Delivering
strongly

March, 2009
Lachie McKinnon
General Manager
Australasia
Nufarm Investor Strategy Day
Australia

Nufarm Australia
The bigger picture …
Water
Crop efficiencies
Availability
Biotechnology / GM crops
The 'corporate' farmer
Seasonal swings
Carbon trading

Australia – major crops
Broadacre – 67% Horticulture – 14%
Pasture – 3%
Cotton – 3%
Sugarcane – 4%
Seed treatment – 3%
Other – 6%
Consumption of crop protection products

Australia – major crops
2001/02 2002/03 2003/04 2004/05 2005/06 2006/07 2007/08 est 2008/09
WHEAT 11,513,265 11,161,874 13,046,798 12,218,512 11,715,000 10,938,349 12,029,115 13,396,409
BARLEY 3,678,229 3,843,984 4,454,917 3,577,292 3,964,550 3,488,463 4,170,752 4,471,268
CANOLA 1,327,488 1,294,539 1,209,346 1,134,000 960,600 854,914 1,037,500 1,311,641
OATS 775,362 910,447 1,104,238 658,900 841,200 768,875 833,999 885,260
SORGHUM 809,672 654,876 722,632 765,850 729,800 541,566 766,500 800,000
TRITICALE 400,814 401,903 439,982 256,450 373,550 359,535 342,929 387,922
LUPINS 1,138,325 1,024,577 850,105 737,850 831,350 441,556 450,862 455,454
COTTON 350,000 350,000 350,000 350,000 150,000 150,000 63,000 120,000
FIELD PEAS 334,528 379,111 353,168 279,350 321,450 327,988 300,996 286,576
CHICK PEAS 243,241 200,372 199,611 135,200 155,680 247,635 305,141 318,211
FABA BEANS 180,549 174,688 146,309 209,800 183,850 162,225 133,039 172,124
LENTILS 201,245 179,950 122,950 129,800 131,600 139,210 139,000 128,678
RICE 105,000 105,000 80,000 105,000 80,000 20,000 6,000 10,000
21,057,718 20,681,321 23,080,056 20,558,004 20,438,630 18,440,317 20,578,833 22,743,543
Planted area (hectares)
Australian Crop Forecasters Feb 2009

Change in $500k to $2mill farms
-
1,000
2,000
3,000
4,000
5,000
6,000
7,000
Grain andMixed
Farming
Sugar Cotton LivestockExtensive
LivestockIntensive
Fruit Grapes HorticultureOther
Vegetables
Industry
Farm
Nu
mb
ers
2001 $500k to $2mill 2006 $500k to $2mill
Australia – farm sizes

Change in $2million farms
-
50
100
150
200
250
300
350
400
450
Grain andMixed
Farming
Sugar Cotton LivestockExtensive
LivestockIntensive
Fruit Grapes HorticultureOther
Vegetables
Industry
Farm
Nu
mb
ers
2001 >$2mill 2006 >$2mill
Australia – farm sizes

Ag-Chem distribution channel
Importing Manufacturer Local Manufacturer
Local Formulation
Third Party
“Trader”
Distributors – eg Landmark, Elders, CRT, IHD etc.
End-user – farmers etc
Technical
sales
Branded Product
eg “Roundup®”

Distribution customers

Nufarm / Crop Care
Nufarm Limited(all back end functions)
R&D, Finance, Logistics, Manufacturing
Nufarm Australia Ltd
Lachlan McKinnonGeneral Manager
Melbourne
National Sales & MarketingRegional Sales teams
Crop Care
Simon AdamGeneral Manager
Brisbane
National Sales & MarketingRegional Sales teams

Nufarm / Crop Care
Separate TMsSeparate CSO
Separate TMsSeparate CSO
Separate Product Range
TriflurXRoundup
Amicide 625Avadex Extra
Separate Product Range
AchieveFusionSusconTalstar
Same logistics

Business overview
A full service model
Manufacturing
Synthesis
& formulation
Logistics
Regional
service
centers
Regulatory
Substantial
resources
Intellectual
property
Product
Development
New
formulations
Mixture
products
Innovative
packaging
Marketing
'Agricentres'
Loyalty
programs
Sales
Field force
After Sales
Service -
admin etc
Global
partners

Market position
Nufarm has a clear market leadership position
Ranked no. 1 in all major crop segments
Only fully integrated supplier based in Australia
2nd brand position with Crop Care
Maximise molecule share
Comprehensive and varied offering
Seeds (including GMO position)
Farm machinery / Croplands

Nufarm Australia
The challenge …
To retain leadership position … every market share
point of it!
To improve the 'quality' of the business
Move customers / end users up the value chain
Regularly 'renew' product offerings
Strengthen customer loyalty
Improve efficiencies: supply chain / logistics
To anticipate and adapt to changes in agriculture
Climate
Customer base

Nufarm Australia
Adding value
Product development
Regulatory / technical support
Innovative marketing
Loyalty programs
Spraywise decisions
Agricentres
After sales support

Strategy & Drivers – 2009 - 2013
Grow EBIT
Resource Allocation
Customer Focus
End User Development
Product Development
Personnel
Cost management
Improve Quality of
Sales
Focused R&D
Enhanced Supply Chain

Q & A

March, 2009
Alain Chalandon
General Manager
South West Europe
Nufarm Investor Strategy Day
South West Europe

Crop protection market by crop
1.7
4.5
4.7
5.8
8
9.5
9.5
10.7
13.3
32.3
0 5 10 15 20 25 30 35
Sunflower
Pome Fruit
Sugarbeet
Potato
Rape
Maize
Vine
Other Crop
Other F & V
Cereals
2008 European Ag Chem Market : 8191 M€
(% of total)
Europe

Crop protection market
Product split
Global sales* European sales*
Fungicides
36.3%
Others
4.2%
Herbicides
46.3%
Insecticides
13.2%
Fungicides
24%
Others
3.2%
Herbicides
47.7%
Insecticides
25.1%
* Phillips McDougall 2007

Market share positions
28.6%
21.3%16.7%
5.5%
4.8%
2.8%
2.7%
15.3%2.3% BCS
Syngenta
BASF
Dupont
Dow
Monsanto
MAI
Nufarm
Others
Europe

Growth by region 2008
0%
5%
10%
15%
20%
25%
NAFTA Latin America Europe Asia
5%
22%
15.10%
10.90%
Phillips McDougall November 2008

South West Europe - Snapshot
Regional markets covered
Direct presence:
France
Spain
Portugal
Italy
Greece
Egypt
Sales into:
North Africa & Africa
Middle East
Turkey & South Balkans
Major crop focus
Cereals
Corn
Vineyards
Horticulture
Major product positions
Current: Coming:
Glyphosate Imidacloprid
Bromoxynil Nicosulfuron
Amitrole Fluazinam
Phenoxies Lambda Cyhalothrin
DFF Tebuconazole
Copper fungicides

Market evolution 2002-2008 (M€)
Key South European markets

33
%3
%
65
%
PRIVATESWHOLESALER
SCOOPS
FARMERS
AGCHEM COMPANIES
64 %
35 %
1 % 2 %
Distribution structure

South West Europe
Success factors
Building the organisation
Recruitment of good people
Improved reporting systems
Better supply chain management
Small acquisitions
Italy, Portugal, Greece
Developing the product portfolio
Internally developed products
3rd party products
New formulations and mixtures
Last five years
Regional sales have grown
by 73%

South West Europe
The opportunity
Market access potential for Nufarm in SWE is
roughly 50% of the overall SWE market
We need to:
1. Expand our distribution network in implementing new
country sales forces (Morocco, Bulgaria, Turkey)
2. Feed our portfolio and address gaps in our product
range
3. Expand our distribution base
4. Develop our team and competencies
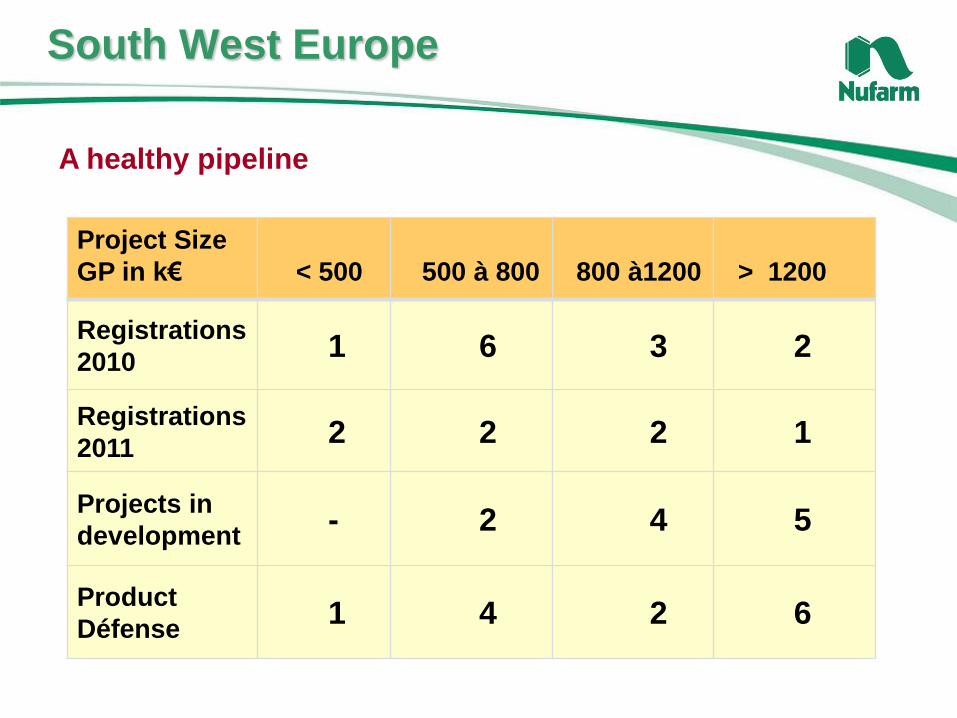
Project Size
GP in k€ < 500 500 à 800 800 à1200 > 1200
Registrations
20101 6 3 2
Registrations
20112 2 2 1
Projects in
development- 2 4 5
Product
Défense1 4 2 6
South West Europe
A healthy pipeline

South West Europe
Conclusion
Nufarm is an active player now in South West
Europe
Our potential is to double our turnover in the
next 4-5 years
Team and customer focus

Q & A

March, 2009
Hugo Schweers
General Manager
North East Europe
Nufarm Investor Strategy Day
North East Europe

North East Europe - Snapshot
Regional markets covered
Direct presence:
Germany
UK / Ireland
Benelux
Nordics
Baltics
Austria
Poland
Czech
Slovakia
Hungary
Romania
Sales into:
Ukraine
Russia
Belarus
Kazakhstan and other 'Stans'
Poland
Czech
Slovakia}F&N
Joint venture
Major crop focus
Cereals
Corn
Oil seed rape (OSR)
Potatoes
Major product positions
Current: Coming:
Phenoxy herbicides Cereal fungicides
Glyphosate Potato fungicides
Fenoxaprop & insecticides
Copper fungicides OSR fungicides &
MSM insecticides
Chlortoluron Seed treatment
Fluquinconazole

Germany/ AU/CH 54
BeNeLux/Nordics/ Baltics 132
UK/Ire 178
Poland/CZ/SK 53
Hungary 28
Rumania 20
CIS 83
NEE Total 548
Nufarm owned registrations (labels)
NEE - Product registrations

North East Europe - Snapshot
Distribution structure
Western Europe
Wholesalers: Co-ops & privates
Retailers: Decreasing; consolidation
Farmers: Farm size increasing
Officials: Local recommendations
Central & Eastern Europe
Distributors: Co-ops and independents
Farmers: Large farming enterprises

North East Europe
Nufarm's strong growth driven by …
New product introductions
Expansion into new markets
Broader distribution base
Strengthening of commercial
capabilities
Last three years
Industry growth → 15%
Nufarm growth → 40%

Eastern Europe portfolio – key launches
Market
segment
Est.
Value
2013 - $m
2008-09 2010-11 2012-13 Impact
Cereal
fungicides
790 Tebuconazole Tebuconazole -
mix
Strobilurin-
mix
Growth
Cereal
herbicides
860 U 46 D
U 46 M
Duplosan
Alliance
Carmina
Phenoxies
Bio enhancers
Strong growth
Corn
herbicides
650 Zeagran
Ultimate
Emblem flo Nicosulfuron-
Bromoxynil
Strong growth
Seed
treatments
860 Gizmo Nuprid-max Tebuconazole-
mix
Growth

NEE - targeting strong share growth in key segments
Cereal
herbicides
Corn
herbicides
18
22
IPU/ CTU/ Phenoxies/ DFF/ HBN/ MSM
BEE - / Sobie - / Bio-enhancer - Technologies
Bromoxynil / Terbutylazin / Nicosulfuron
Mixed Ester - Technology
North-Western European market shares

North East Europe
Competitive strengths
Development - New product launches delivering 40% of
growth
Distribution - Building commercial capabilities
Shaping the future - New businesses
Operations - From sustainability to out performance
People - Strong team; development potential

Risk management in Eastern Europe
Supply to distributors
Payment terms follow crop pattern (90-240 days)
Under-developed banking systems; Austrian Bank
assurance
Challenges

Risk management in Eastern Europe
Instruments
Professional credit management team in Linz
Commercial terms include:
Rebates paid after debt collection
Cash discounts for early payment
Customer financing scheme with pre-payment included
Customer classification to support credit limit setting
North East Europe
Opportunities
20 new major product launches in the next five years
Move into seeds in Eastern Europe
Build a strong seeds and seed treatment portfolio
Expand operating base

Q & A

North America
& Central America
Dale Mellody
General Manager, North America
Group General Manager, Marketing
March, 2009
Nufarm Investor Strategy Day

The Region – North & Central America
57
Herbicide = 65%, Insecticide = 18%, Fungicide = 12% , Other = 5%
Raleigh
CalgaryChicago
Cali
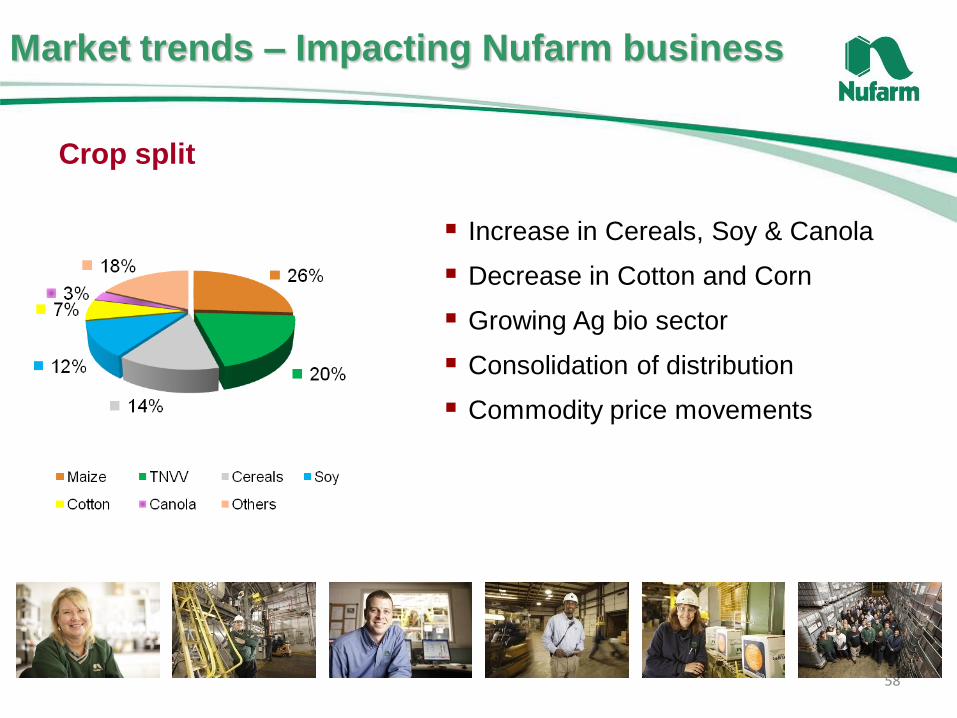
Market trends – Impacting Nufarm business
58
Increase in Cereals, Soy & Canola
Decrease in Cotton and Corn
Growing Ag bio sector
Consolidation of distribution
Commodity price movements
Crop split

Nufarm presence
Regional HQ – Chicago
Manufacturing bases in Chicago, Calgary & Colombia
Development center in Research Triangle Park, North Carolina
US Segments:
- Crop protection - Turf & ornamental
- Seed treatment - Vegetation management & forestry
Key Product Positions - Glyphosate
- Phenoxy Herbicides
- Imidacloprid
National field force in Canada & Colombia
400+ employees
In excess of 800 registrations
59

60
Less than 4% market share
Branded & Private Label business
Targeted Crop + portfolio approach
- Cereals - TNVV
- Pasture - US turf
- Cotton
Low cost business model
Support key distribution
Growth by acquisition – product & company
Focus on Nufarm Brand
AUD$NAFTA & Central America Sales
$334M
$386M$464M
$496M
$619M
High quality, flexible supplier of
value-added generic chemistry
Nufarm business

Nufarm People – part of branding campaign
We recognize that you have a
choice in suppliers
Our entire team is empowered,
enabled and dedicated to providing
better choices to help our customers
build better businesses
Why this matters: we will work with
you to deliver the value you need to
make the best business decision for
the customer

Growth & opportunity
Low market share – organic growth
Recognize benefits of recent
acquisitions
New products – 26 product launches in
2008 & 2009
New markets
New segments
Diversification – 12 herbicides, 9
insecticides & 5 fungicides
3rd Party Relationships & bolt-on
acquisition opportunities
62
A new high load
GLYPHOSATE
with superior
performance in
tankmixes, and
LESS product
to HANDLE
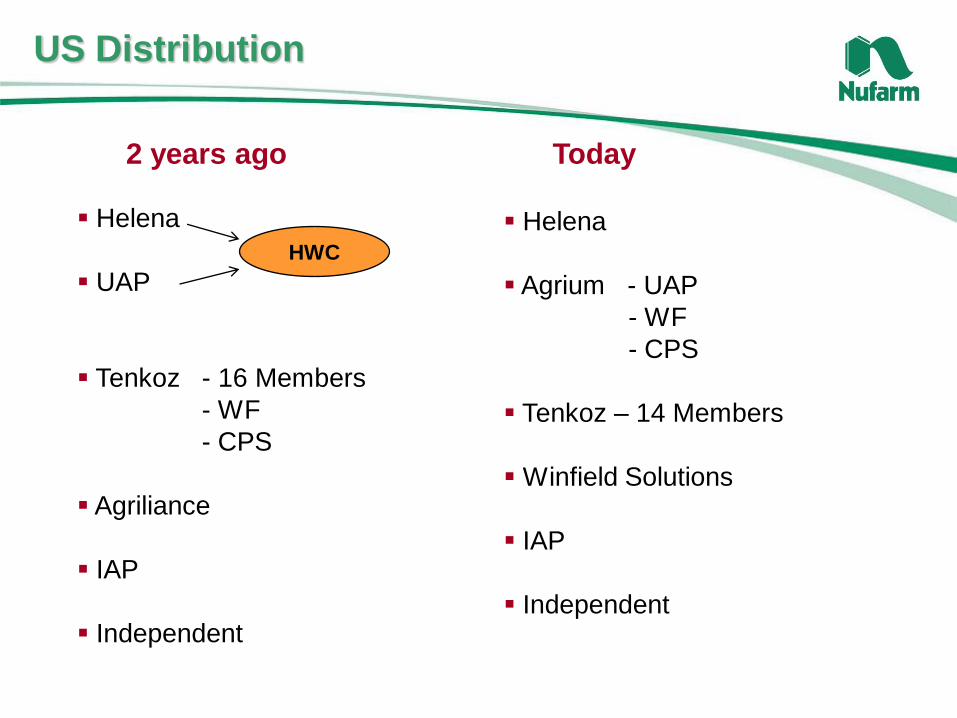
US Distribution
Helena
UAP
Tenkoz - 16 Members
- WF
- CPS
Agriliance
IAP
Independent
HWC
Helena
Agrium - UAP
- WF
- CPS
Tenkoz – 14 Members
Winfield Solutions
IAP
Independent
2 years ago Today

Canada Distribution
Agricore
SAS Wheat Pool
Federated Co-op
Cargill
James Richardson Int
Univar
UAP
IPCO
Viterra
Federated Co-op
Cargill
James Richardson Int
Univar
UAP/Agrium
2 years ago Today

Short term challenges & opportunities
Operational excellence
New product introductions
Development & people
Product stewardship &
maintenance
Events „out of our control‟
65

March, 2009
Mike Pointon
Group General Manager
Innovation & Development
Nufarm Investor Strategy Day
Product development
and innovation

Strategic growth drivers
Build
geographic
platform
Broaden
product
portfolio
Innovation and
product
development focus

… in the largest – and fastest growing – segment of
the industry
28.3%
patented
32.1%
Proprietary off patent
39.6%
generic
Patented Off patent
28.3% 71.7%
Total 2007 industry sales
Source - Phillips McDougall
Nufarm competes …
US$33.4bn
Industry segments
focused here
68

Global innovation and development
Chicago
BrisbanePerth
Melbourne
São PauloSantiago
19
4
1
5
2
Europe (31)
6
8
14
4
Australia (32)
3
1
2
NZ (6)
11
Indonesia (2)
21
Malaysia (3)
1
Japan (1)
2
Canada (2)Calgary
8
7
2
USA (17)
1
Chile (1)
Regulatory Affairs 51
Formulation Development 23
Field Trial 24
GLP Laboratory 5
Process Technology 8
Total Group: 111
Paris
Belvedere
Barcelona
Linz
Tokyo
Kuala Lumpur
Jakarta
Columbia (2)2
Brazil (13)
Fortaleza
5
3
3
2
Wyke
Cologne
Fortaleza
Costa Rica (2)2

Product development
Product development in Nufarm …
Defends and maintains existing registrations ('license to
sell')
Upgrading registration packages to new standards
Develops new registration packages for approved new
projects
New data for toxicology, product chemistry, field
efficacy and crop selectivity
Developed to global standards for different regulatory
requirements
Projects are both global and regional

Nufarm global registrations
2002 Total : 1,377 product
registrations
2008 Total : 2,787 product
registrations
Source – NUF registrations database adjusted to include Agripec

Innovation
Innovation in Nufarm…
Focused on delivery systems for existing active ingredients
Resources are not directed to discovery of new active
ingredients
Must be driven to provide better products for farmers
New ideas from the field
Improved value proposition through differentiation
Sustainable differentiation where possible through
Intellectual Property

Global and regional project
Global projects …
Funded / managed globally
Involved detailed analysis of 'radar' molecules'
Includes strategic and economic return
analysis
No shortage of opportunities …
25 currently approved global
development projects

Global and regional projects
Regional projects …
Selected / proposed by regional management
Address ' local' opportunities
Specific crops
Specific competitive dynamics
Specific pests and diseases
Examples of regional projects:
- Europe: Fluazinam, Tebuconazole / Prochloraz
- USA: Introduction of SU‟s
- Brazil: Replacement of OP‟s Acephate, Neonicotinoids & SPs

Resourcing and prioritising
Global Projects Regional Projects
Correct Prioritisation
Regional Human Resource

Innovation projects in Nufarm
Sorbie
Some active ingredients can only be
delivered as an EC liquid
Sorbie technology allows these
products to be delivered as a
granule
A.I. is dissolved in solvent
Solvent is applied to Sorbie™ granule
Granule is delivered to the spray tank
where it disintegrates and releases ai
Value add:
Significant reduction in operator exposure
Elimination of contaminated packaging

Innovation projects in Nufarm
Suscon®
Soil applied granules providing controlled release of A.I.
Established and proven technology in Australia sugar cane
Suscon Blue and Suscon Maxi now developed for
Different active ingredients
Several global markets
Value add:
Provides very flexible product delivery
system
Allows extension of residual activity
Adapts a.i.‟s to new use applications

Sugarcane efficacy
Untreated
Strips
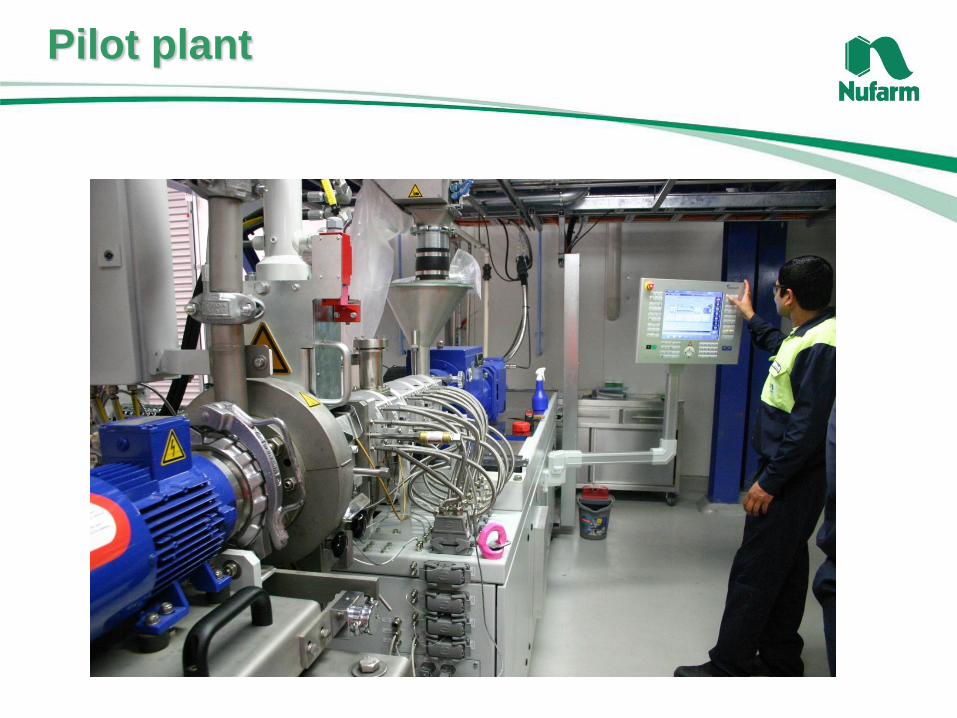
Pilot plant

Innovation projects in Nufarm
Micro carrier system
Technology being applied to developing a new system for
phenoxy and other herbicides
Targeted uptake in solventless system
Objective is to establish a product with the following benefits:
Reduced dose while maintaining efficacy
Reduced cost
Increased adherence to leaf surface = improved rainfastness
Reduced crop effect: no surfactant, reduced dose, no damaging
solvent
Technology partner identified; contracts established
Has significant potential to be extended to other products
Early development stage

High throughput screening
Time to develop agricultural products is limited
by seasons. A number of projects are now being fast
tracked using high throughput screen with indicator species
A partnership has been developed with RMIT Melbourne and
Deakin
Provides earlier confirmation and rapid feedback of
formulations / technologies
Benefits of system
Increase testing capacity / throughput (improved volume and time)
Rapid response time 7-10 days turnaround versus 3+ months in glasshouse
Less materials required for testing
Greater capacity and reduced cost for patent exemplification
Can be used for herbicides and fungicides
Control
0.001 mM 2,4-D
0.01 mM 2,4-D 0.1 mM 2,4-D 1.0 mM 2,4-D

Maintaining registrations for our core products is
key
Consolidate the base
In summary
Innovation and development in Nufarm
Building new products to balance and expand our
portfolio
Drives internal growth

Q & A

March, 2009
Brent Zacharias
General Manager, Seeds
Nufarm Investor Strategy Day
The Seeds Strategy

Strategic objectives
Lead genetic and value improvements via R&D investment
Global branded player: select core crops, target geographies
Downstream influence and
value capture (beyond
seed)
Synergy with Nufarm base
(chemistry, formulations,
treatments)
85
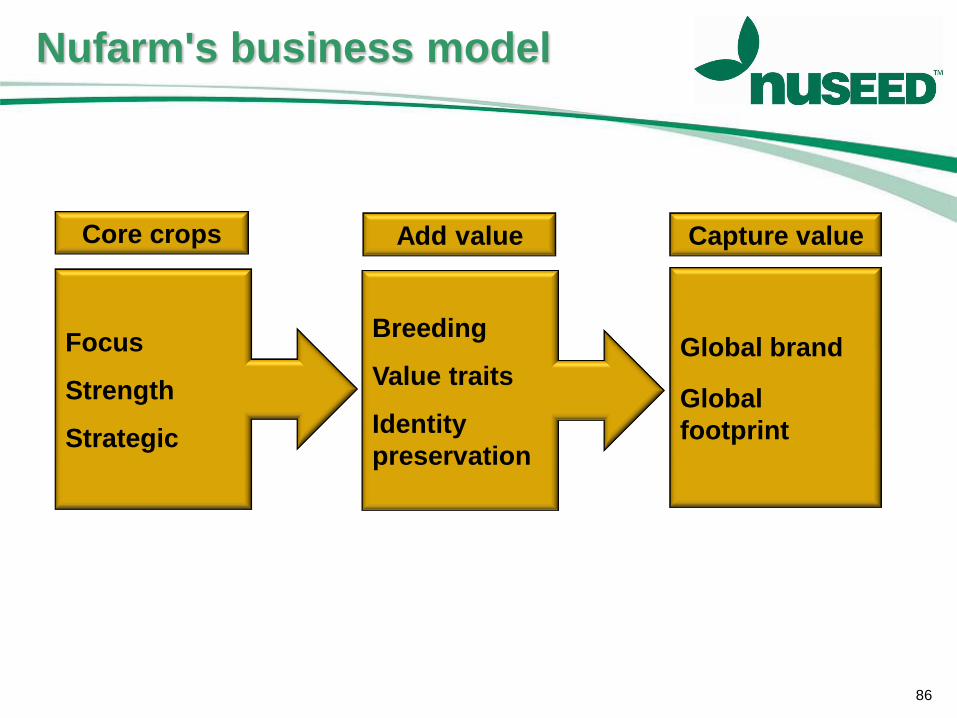
Nufarm's business model
Focus
Strength
Strategic
Core crops
Breeding
Value traits
Identity
preservation
Add value
Global brand
Global
footprint
Capture value
86
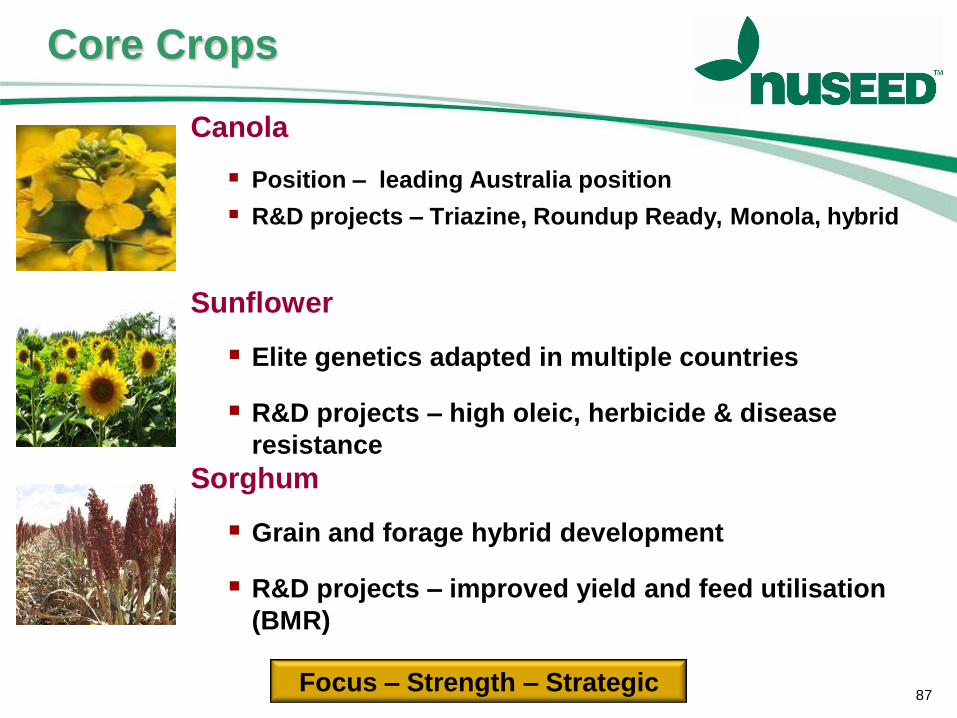
Core Crops
87Focus – Strength – Strategic
Canola
Position – leading Australia position
R&D projects – Triazine, Roundup Ready, Monola, hybrid
Sunflower
Elite genetics adapted in multiple countries
R&D projects – high oleic, herbicide & disease
resistance
Sorghum
Grain and forage hybrid development
R&D projects – improved yield and feed utilisation
(BMR)

Roundup Ready Canola
88
Australia
Commercialisation status
2008 release: 10,000 ha NSW, VIC
“22% yield over TT”; 100% “grow again”
2009 expect >100,000 ha
Nufarm position
Dominant canola share
One of three players in RR
Projected adoption of technology
75% conversion in 5 years
5 products on every hectare
GT61 (seed)
Roundup Ready (trait)
Senator + Jockey (treatment)
Roundup Ready (herbicide)

Core Crops
89Focus – Strength – Strategic
Canola
Position – leading Australia position
R&D projects – Triazine, Roundup Ready, Monola, hybrid
Sunflower
Elite genetics adapted in multiple countries
R&D projects – high oleic, herbicide & disease
resistance
Sorghum
Grain and forage hybrid development
R&D projects – improved yield and feed utilisation
(BMR)

Three primary canola nursery locations
Five primary sunflower / sorghum
nursery locations
Two generation cycles / year
65,000 nursery rows per annum
Trait enhanced
glasshouse
research
Breeding effort
90Breeding

Output Value Creation
End Users
Trait enhanced
seed
Retail partners &
crop protection
Grower Marketing and
Contracting
Processing
Partners
91Value traits / Identity preservation

Managing a value ladder
Canola
SorghumSunflower
92

5 Year Plan
Significant organic sales & value growth
2-3 strategic global acquisitions
20-25% EBIT return on revenue

Nuseed current footprint
Current markets
Partner breeding
Proprietary breeding
94Global platform

95
Summary
Strengthen global position in select
core crops
Drive technologies that enhance value
Extend global branded sales positions
(via Nufarm footprint)

Q & A
Nufarm Limited
Head office: 103-105 Pipe Road, Laverton North, Vic. Australia.
Tel: 61 3 9282 1000 Fax: 61 3 9282 1111 www.nufarm.com
A great time to be
in the business of
agriculture