investor presentationinvestor presentation - oceaneering · connections – grayloc connectors and...
TRANSCRIPT

Investor PresentationInvestor PresentationInvestor PresentationInvestor PresentationJune June 2016 2016

Forward-Looking StatementsStatements we make in this presentation that express a belief, expectation, or intention are forward looking. Forward-looking statements are generally accompanied by words such as “estimate,” “project,” “predict,” “believe,” “expect,” “anticipate,” “plan,” “forecast,” “budget ” “goal ” or other words that convey the uncertainly of future events or outcomesbudget, goal, or other words that convey the uncertainly of future events or outcomes. These forward-looking statements are based on our current information and expectations that involve a number of risks, uncertainties, and assumptions. Among the factors that could cause the actual results to differ materially from those indicated in the forward-looking statements are: industry conditions prices of crude oil and natural gas our abilitylooking statements are: industry conditions, prices of crude oil and natural gas, our ability to obtain and the timing of new projects, and changes in competitive factors. Should one or more of these risks or uncertainties materialize, or should the assumptions underlying the forward-looking statements prove incorrect, actual outcomes could vary materially from those indicatedfrom those indicated.
For additional information regarding these and other factors, see our periodic filings with the Securities and Exchange Commission, including our most recent Reports on Forms 10-K and 10-Q.
2

Why OII?
Global Provider of Diversified Services and Products in All Phases f h Off h Oilfi ld Lif C l
Global Provider of Diversified Services and Products in All Phases f h Off h Oilfi ld Lif C lof the Offshore Oilfield Life Cycle
Strong Balance Sheet and Cash Flow
of the Offshore Oilfield Life Cycle
Strong Balance Sheet and Cash Flow
Continue to Maintain or Grow Our Market Positions Continue to Maintain or Grow Our Market Positions
Return Capital to Our Shareholders
Experienced Management Team
Return Capital to Our Shareholders
Experienced Management Team Experienced Management Team
Longer Term, Deepwater is Still Critical to Reserve Replenishment
Experienced Management Team
Longer Term, Deepwater is Still Critical to Reserve Replenishment
3

About Oceaneering – Five Operating Segments
ROVROV
Subsea ProductsSubsea Products
Subsea ProjectsSubsea Projects
Asset Integrity
Ad d T h l i
Asset Integrity
Ad d T h l iAdvanced Technologies Advanced Technologies
4

EXPLORATION DEVELOPMENT PRODUCTION DECOMMISSIONINGPHASE
About OII – In All Phases of Offshore Oilfield Life CycleEXPLORATION
10%
DEVELOPMENT
50%
PRODUCTION
35%
DECOMMISSIONING
5%
# of OperatingFloating Drilling Rigs
# Subsea Tree Installations
# Subsea TreesIn Service
# of Field Abandonments
PHASE
% OII Revenue
#1 Market Driver g g ge
Business Segment P d t
•• ROVROV•• Survey (SP)Survey (SP)•• Tooling (SSP)Tooling (SSP)
Product and
Service Revenue Streams
• ROV• Survey (SP)• Tooling (SSP)
IWOCS I t ll ti &
• ROV• Tooling (SSP)• IWOCS (SSP)
S b H d (SSP)
• ROV • Tooling (SSP)• IWOCS (SSP)
• IWOCS – Installation & Workover Control Systems (SSP)
• Subsea Hardware (SSP)• Umbilicals (SSP)• Vessel-based Installation
Services (SP)Inspection Ser ices (AI)
• Subsea Hardware (SSP)• Vessel-based Inspection,
Maintenance & Repair Services (SP)
• Inspection Services (AI)
ROV = Remotely Operated Vehicles SSP = Subsea Products SP = Subsea Projects AI = Asset Integrity
• Inspection Services (AI)
5
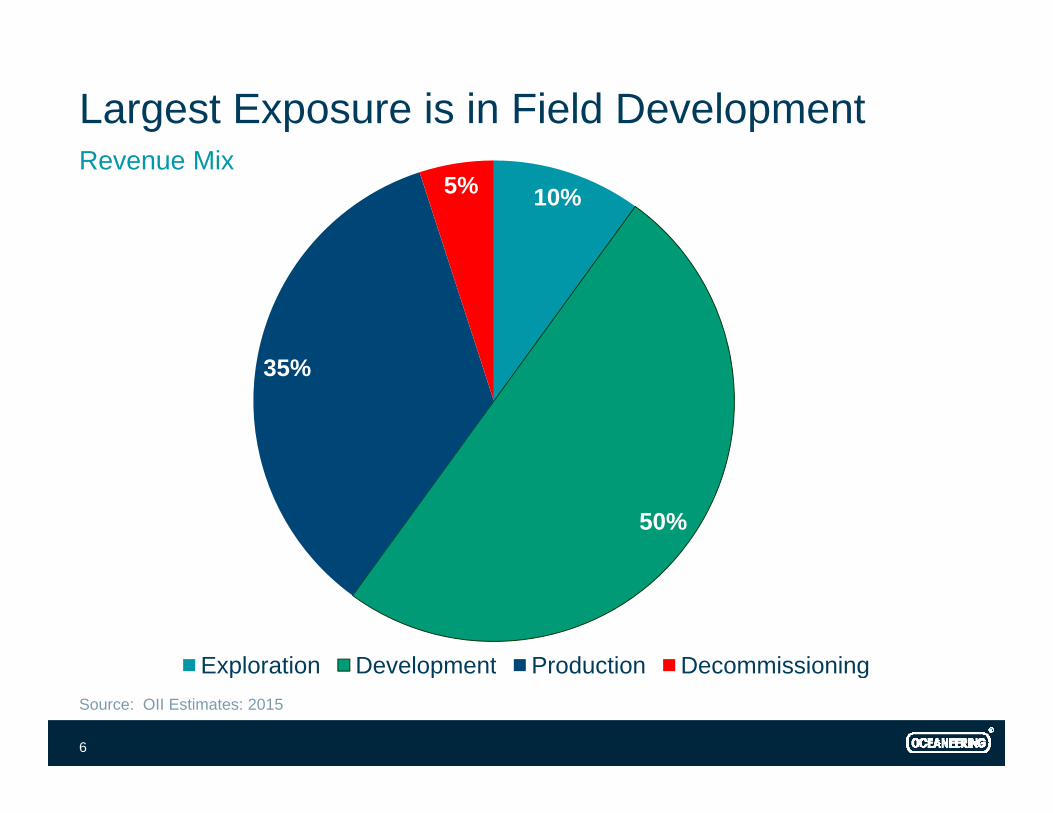
Largest Exposure is in Field DevelopmentR Mi
10%5%Revenue Mix
35%
50%
Exploration Development Production DecommissioningExploration Development Production DecommissioningSource: OII Estimates: 2015
6

Revenue by Business Segment
7% 10% %
2014 2015 2016 Q1
29%14%
7%
27%12%
10%24%
12%
11%
16%20%
32%
21%
34% 31% 32%
$3.7 Billion $3.1 Billion $600 Million
ROV Subsea Products Subsea Projects Asset Integrity Advanced Technologies
2015
7

REMOTELY OPERATED VEHICLES 24%
Revenue Contribution Q1 2016
8

Oceaneering ROV Fleet Size318 ROV f M h 2016
336350
318 ROVs as of March 2016
315 318
300riod
End
300
Cou
nt a
t Per
250
Vehi
cle
2002008 2009 2010 2011 2012 2013 2014 2015 2016 Q1
9
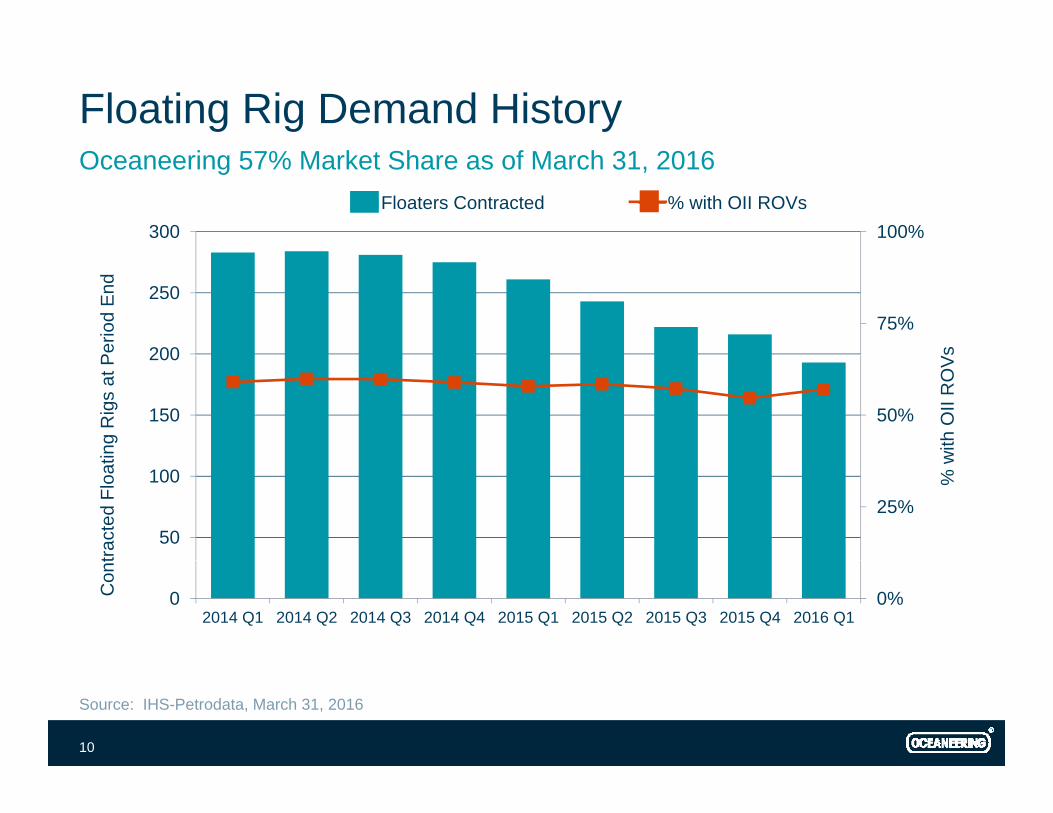
Floating Rig Demand HistoryO i % M k Sh f M h 31 2016
100%300Floaters Contracted % with OII ROVs
Oceaneering 57% Market Share as of March 31, 2016
75%200
250
sPerio
d E
nd
50%150
200
with
OII
RO
V
ing
Rig
s at
P
25%50
100 % w
tract
ed F
loat
0%02014 Q1 2014 Q2 2014 Q3 2014 Q4 2015 Q1 2015 Q2 2015 Q3 2015 Q4 2016 Q1
Con
t
Source: IHS-Petrodata, March 31, 2016
10
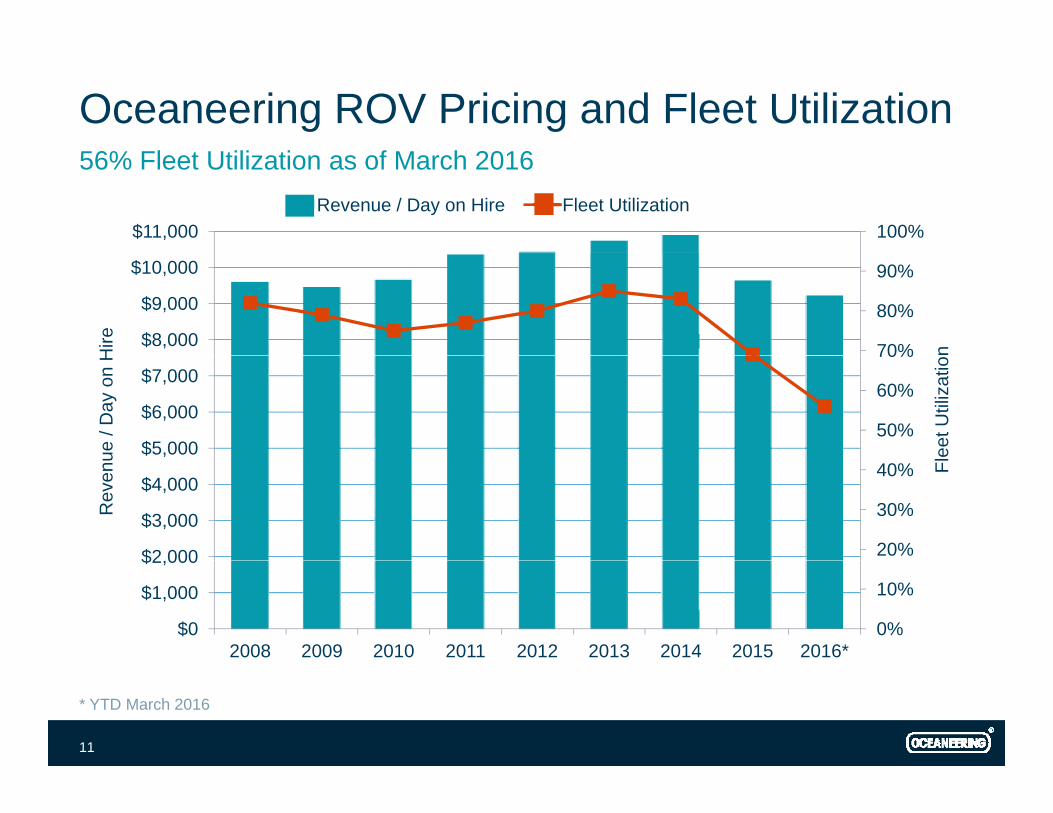
Oceaneering ROV Pricing and Fleet Utilization6% Fl U ili i f M h 2016
100%$11,000Revenue / Day on Hire Fleet Utilization
56% Fleet Utilization as of March 2016
70%
80%
90%
$8,000
$9,000
$10,000
nHire
50%
60%
70%
$5,000
$6,000
$7,000
eet U
tiliz
atio
ue /
Day
on
H
20%
30%
40%
$2 000
$3,000
$4,000
Fl
Rev
enu
0%
10%
$0
$1,000
$2,000
2008 2009 2010 2011 2012 2013 2014 2015 2016*
* YTD March 2016
11
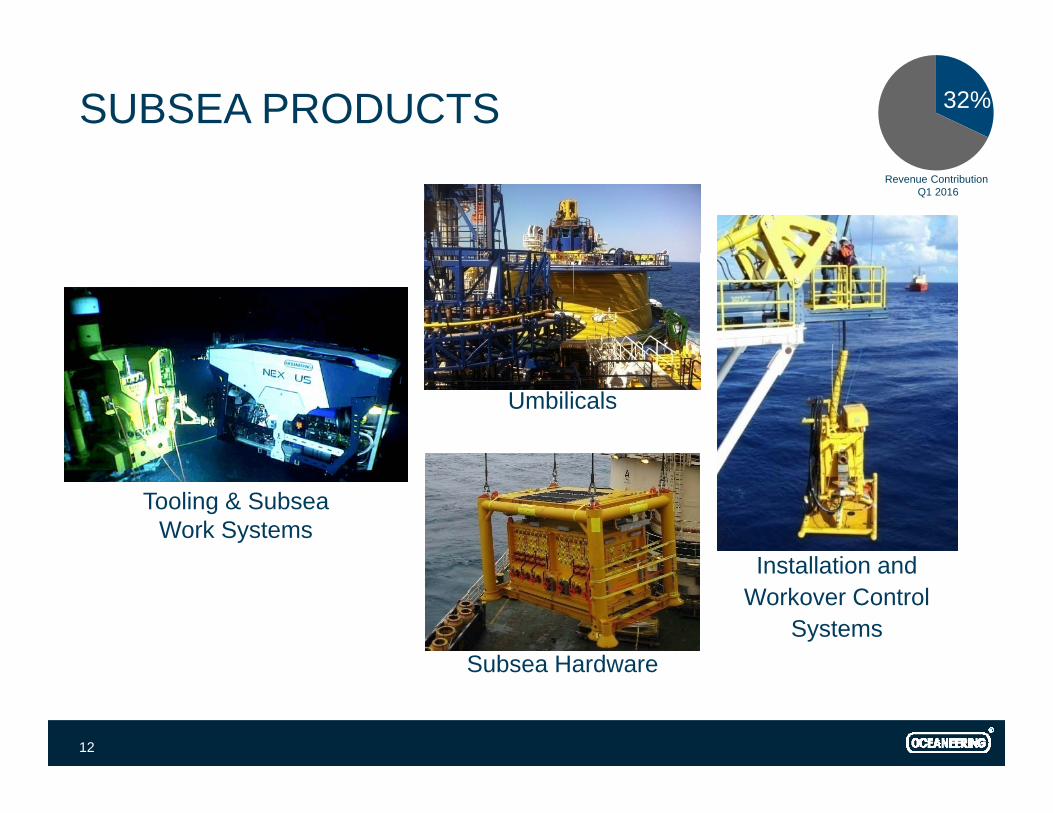
SUBSEA PRODUCTS 32%
Revenue Contribution Q1 2016
Umbilicals
Tooling & Subsea Work Systems
I t ll ti dInstallation andWorkover Control
SystemsSubsea HardwareSubsea Hardware
12

Subsea Products
Required for Every Subsea Completion Required for Every Subsea Completion
Product Line Categories Service Technology and Rentals – IWOCS and Tooling
Product Line Categories Service Technology and Rentals – IWOCS and ToolingService Technology and Rentals IWOCS and Tooling Subsea Distribution – Umbilicals and
Field Development Hardware Connections – Grayloc Connectors and Pipeline Repair Systems
Service Technology and Rentals IWOCS and Tooling Subsea Distribution – Umbilicals and
Field Development Hardware Connections – Grayloc Connectors and Pipeline Repair Systemsy p p y Flow Control Solutions – BOP Control Spares and Rotator Valves
Highly Engineered
y p p y Flow Control Solutions – BOP Control Spares and Rotator Valves
Highly Engineered Highly Engineered
Worldwide Coverage
Highly Engineered
Worldwide Coverage
13

Subsea Installations Forecast
$1,500500
Tree Installations SSProducts Revenue
$1,200400
D in
Mill
ions
ns
$600
$900
200
300
Rev
enue
, US
D
e In
stal
latio
n
$300
$600
100
00
SSP
rodu
cts
R
Tre
$002011 2012 2013 2014 2015 2016F 2017F 2018F 2019F 2020F
S
Source: Quest Offshore, May 2016
14
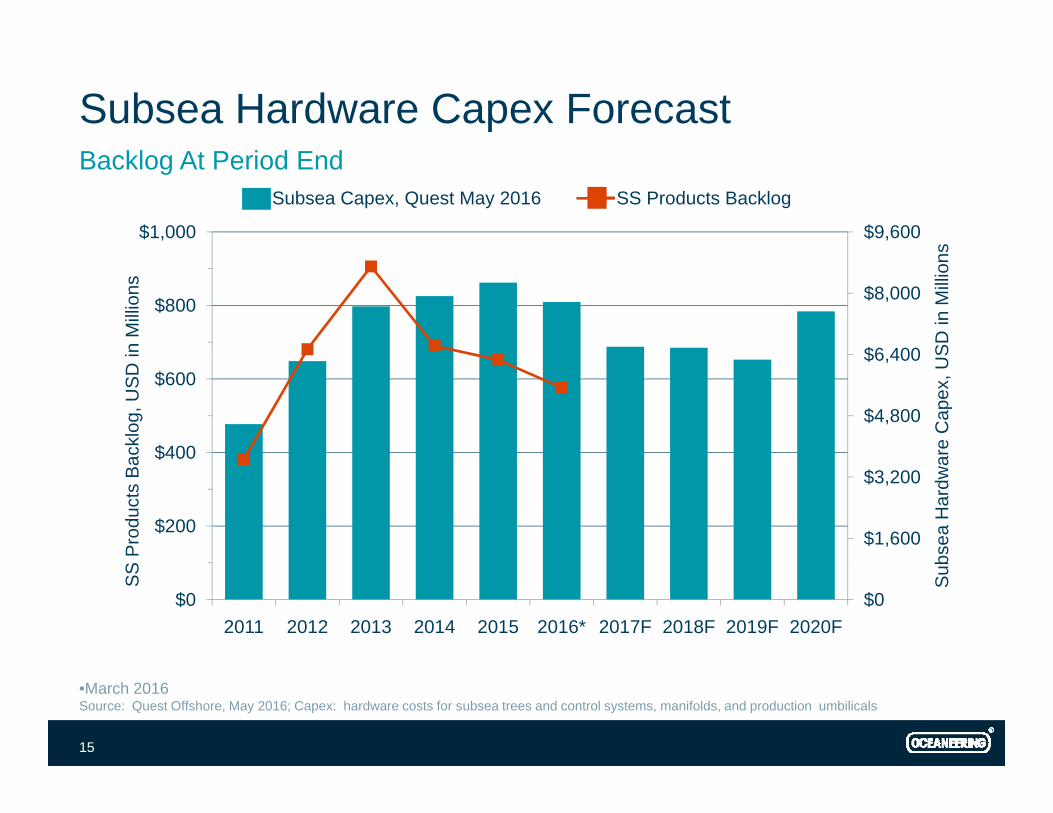
Subsea Hardware Capex ForecastB kl A P i d E d
$9,600$1,000
s
Subsea Capex, Quest May 2016 SS Products Backlog
Backlog At Period End
$6 400
$8,000$800
SD in
Mill
ion
in M
illio
ns
$4,800
$6,400
$400
$600
are
Cap
ex, U
S
ackl
og, U
SD
i
$1,600
$3,200
$200
$400
bsea
Har
dwa
Pro
duct
s B
a
$0$02011 2012 2013 2014 2015 2016* 2017F 2018F 2019F 2020F
Sub
SS
•March 2016Source: Quest Offshore, May 2016; Capex: hardware costs for subsea trees and control systems, manifolds, and production umbilicals
15

SUBSEA PROJECTS21%
Revenue Contribution Q1 2016
Diving
Deepwater
16

Subsea Projects Overview f
GOM Shallow Water Installation and IRM
Assets Available for this Market
4 Oceaneering Vessels, Diving Support 3 Saturation Diving Systems
Deepwater Installation and IRM 6 Chartered Vessels, DP 2 Oceaneering Vessels, DP
1 O i V l DP d li t th d f 2016 1 Oceaneering Vessel, DP, delivery at the end of 2016
Global Data Solutionsi l di AIRSIS i d i 2014 including AIRSIS, acquired in 2014
Survey/AUV Services - C&C Technologies i d i 2015 acquired in 2015
17

Leveraged to Deepwater
Projects Take Years to Develop Projects Take Years to Develop
Largely Oil Reservoirs with High Production Flow Rates
Largely Oil Reservoirs with High Production Flow Rateswith High Production Flow Rates
Well Capitalized Customer Base 50% Revenue from E&P Majors in Prior 3 Years
with High Production Flow Rates
Well Capitalized Customer Base 50% Revenue from E&P Majors in Prior 3 Years ~50% Revenue from E&P Majors in Prior 3 Years
Investment Based on Long-Term Commodity Price
~50% Revenue from E&P Majors in Prior 3 Years
Investment Based on Long-Term Commodity Price
18

Long Term: Offshore is EssentialD R i Si ifi
Source of90
Incremental Bbls Existing Fields Bbls
Deepwater Remains Significant
Source of Additional ~26Mm B/D
Crude Production80
e
32%
68%60
70
d C
onde
nsat
eM
B/D
68%
50
60
Cru
de a
nd MM
Offshore Onshore
40
Source: Morgan Stanley Research , Wood Mackenzie, Rystad Energy, and Company Data – March 2016
19

Expect Extended Declines from Producing Fields
4.0
New Production from New Fields Decline from Aging Fields
3.0
3.5
Day
1 5
2.0
2.5
Barr
els
Per
D
0.5
1.0
1.5
Mill
ion
B
0.02014 2015 2016 2017 2018
Inverting Balance presented by Bloomberg; Source data from Rystad
20

Strong Balance Sheet and LiquidityC i l S d All i
Liquidity (at end of First Quarter 2016)$371 Million of Cash
Capital Sources and Allocations
o $371 Million of Cash o $500 Million Undrawn Revolving Credit Facility, Expiring October 2020o Only $19 Million of Debt Maturities Until October 2018
Organic Capital Expenditureso Expect to Range From $125 Million to $175 Million in 2016
Dividends Dividendso Expect to Continue the Quarterly Dividend of $0.27 Per Share –
Subject to Anticipated EPS Levels and Board Approval
A i iti Acquisitions o Continue to Consider Investments that Augment Our Service or Product
Offerings
Consider Share Repurchases
21
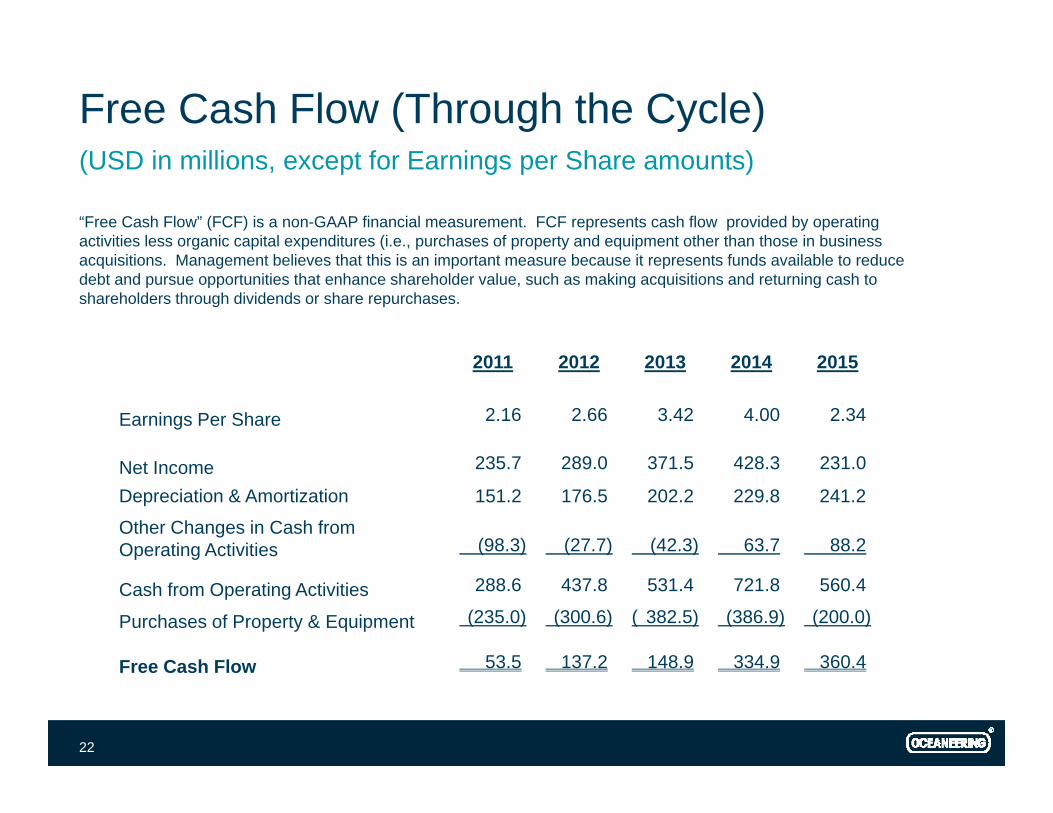
Free Cash Flow (Through the Cycle)(USD i illi f E i Sh )
“Free Cash Flow” (FCF) is a non-GAAP financial measurement. FCF represents cash flow provided by operating activities less organic capital expenditures (i.e., purchases of property and equipment other than those in business
(USD in millions, except for Earnings per Share amounts)
2011 2012 2013 2014 2015
acquisitions. Management believes that this is an important measure because it represents funds available to reduce debt and pursue opportunities that enhance shareholder value, such as making acquisitions and returning cash to shareholders through dividends or share repurchases.
2011 2012 2013 2014 2015
Earnings Per Share 2.16 2.66 3.42 4.00 2.34
235 7 289 0 371 5 428 3 231 0Net Income 235.7 289.0 371.5 428.3 231.0
Depreciation & Amortization 151.2 176.5 202.2 229.8 241.2
Other Changes in Cash from Operating Activities (98.3) (27.7) (42.3) 63.7 88.2
Cash from Operating Activities 288.6 437.8 531.4 721.8 560.4
Purchases of Property & Equipment (235.0) (300.6) ( 382.5) (386.9) (200.0)
Free Cash Flo 53 5 137 2 148 9 334 9 360 4Free Cash Flow 53.5 137.2 148.9 334.9 360.4
22
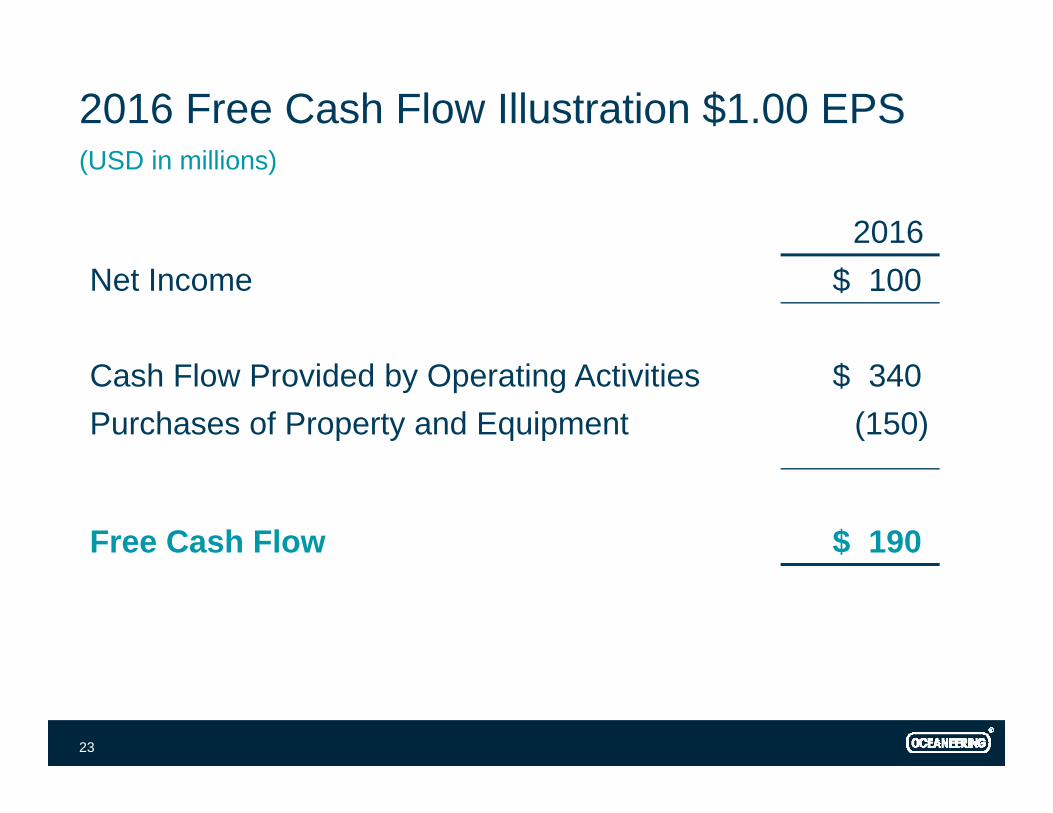
2016 Free Cash Flow Illustration $1.00 EPS(USD i illi )
2016
(USD in millions)
Net Income $ 100
Cash Flow Provided by Operating Activities $ 340Purchases of Property and Equipment (150)
Free Cash Flow $ 190
23

2016 Outlook
Shaping Up to be a Challenging Year
Aligning our Operations with Current Activity
Forecasting Declines in Each Oilfield Segment, Most Notably:
o ROV, Outlook Remains Cloudyo Subsea Products, Margins to Weaken Throughout the Year
Subsea Projects Impacted by Angola althougho Subsea Projects, Impacted by Angola, although expecting some Seasonal Uptick
2Q16 vs 1Q16 Operational Results Flat to Down
24

Conclusion
Longer Term, Deepwater is Still Critical to Reserve Replenishment
Global Provider in All Phases of Offshore Oilfield Life Cycle, with a Deepwater Focusp
Further Differentiate with Integrated Solutions
Strong Liquidity and Cash Flow
Maintain or Grow Our Market Positions Maintain or Grow Our Market Positions
Emerge from the Current Cycle Ready for the Upturn
25

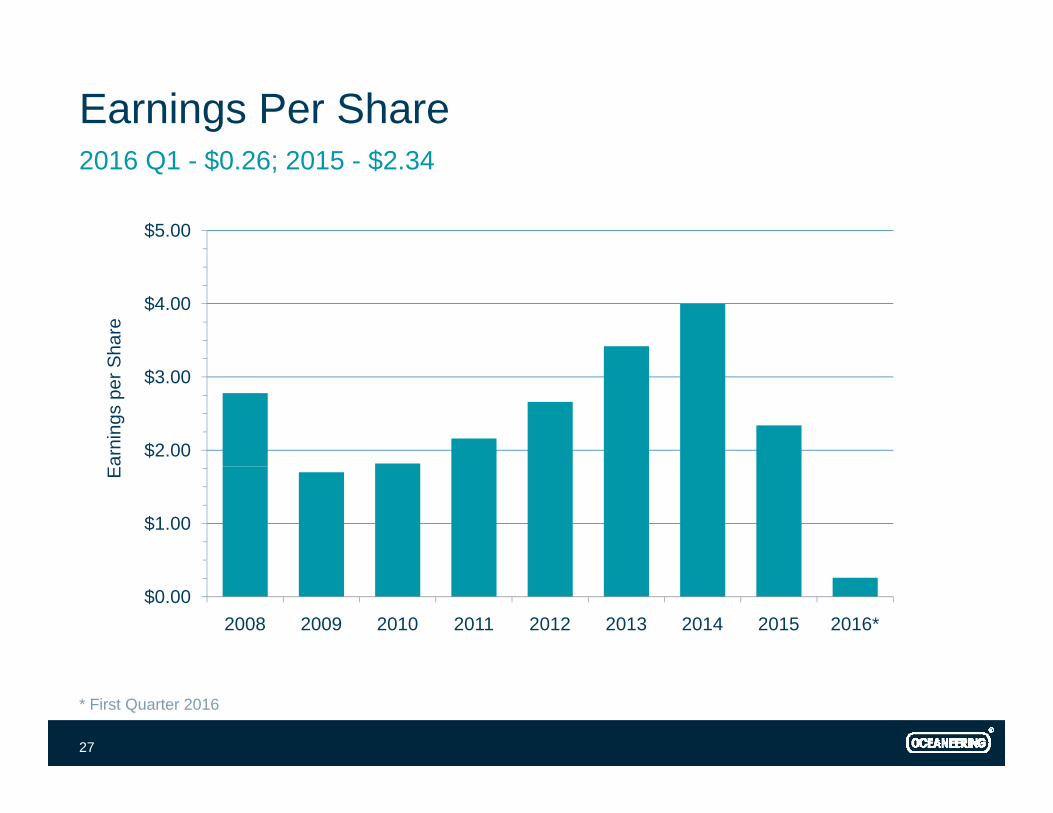
Earnings Per Share2016 Q1 $0 26 201 $2 34
$5.00
2016 Q1 - $0.26; 2015 - $2.34
$4.00
hare
$2.00
$3.00
arni
ngs
per S
$1.00
$
Ea
$0.002008 2009 2010 2011 2012 2013 2014 2015 2016*
* First Quarter 2016
27

EBITDA
$1,000
$750
s
$500
SD in
Mill
ions
$250
US
$02008 2009 2010 2011 2012 2013 2014 2015 2016*
* First Quarter 2016
28

EBITDA Reconciliation to Net Income(USD i illi )Earnings before interest, taxes, depreciation and amortization (EBITDA) is a non-GAAP financial measurement. Oceaneering’s management uses EBITDA because we believe that this measurement is a widely accepted financial indicator used by investors and analysts to analyze and compare companies on the basis of operating performance, and that this measurement may be used by some investors and others to make informed investment decisions. You should not consider EBITDA in isolation from or as a substitute for net
(USD in millions)
Q1 Q1
investors and others to make informed investment decisions. You should not consider EBITDA in isolation from or as a substitute for net income or cash flow measures prepared in accordance with generally accepted accounting principles or as a measure of profitability or liquidity. EBITDA calculations by one company may not be comparable to EBITDA calculations made by another company. The following table provides a reconciliation between net income (a GAAP financial measure) and EBITDA (a non-GAAP financial measure) for Oceaneering’s historical and projected results on a consolidated basis for the periods indicated:
Period Ended 2011 2012 2013 2014 2015Q1
2015Q1
2016
Net Income 235 7 289 0 371 5 428 3 231 0 69 5 25 1Net Income 235.7 289.0 371.5 428.3 231.0 69.5 25.1
Depreciation & Amortization 151.2 176.5 202.2 229.8 241.2 58.0 59.8
Subtotal 386.9 465.5 573.7 658.1 472.2 127.5 84.9
Interest Expense/Income, Net .2 2.3 1.7 4.4 23.4 5.6 5.8
Income Tax Expense 102.2 132.9 170.8 195.2 105.3 31.7 11.4
EBITDA 489.3 600.7 746.2 857.7 600.9 164.8 102.1
29


Oceaneering ROV Leading Market PositionR l O d V hi l
Ownership Drill Support Market Share
Remotely Operated Vehicles
31531%
OIISubsea 7
11057%
FugroDOF SubseaC-InnovationsHelixSaipemTMTTMTTechnipHarkandIKM GroupOtherWorldwide Fleet
1027 Vehicles*193 Floating Rigs Contracted**
1027 Vehicles
Source: *OII Estimates - December 2015; **IHS Petrodata and OII Estimates – March 31, 2016
31

Oceaneering ROV FleetG hi P fil M h 2016
36
Geographic Profile – March 2016
10330
25
52
72
GOM Africa Norway Brazil Asia/Pac Other
318 Vehicles
32

Oceaneering ROVs on Vessels M h 2016March 2016
Locations Customers
24
12
18 4537
2828
GOM Africa Norway Other Operators Contractors
82 Vehicles
33

Investor Relations Contact
Suzanne SperaDirector Investor RelationsDirector, Investor [email protected]
34