investor presentation - september 2014
TRANSCRIPT

© 2013 Iron Mountain Incorporated. All rights reserved. Iron Mountain and the design of the mountain are registered trademarks of Iron Mountain Incorporated.
All other trademarks and registered trademarks are the property of their respective owners.
September 2014
Durable Fundamentals and Differentiated Business Model Deliver Enhanced Returns

2
Safe Harbor Language
Safe Harbor Statement Under the Private Securities Litigation Reform Act of 1995:
This presentation contains certain forward-looking statements within the meaning of the Private Securities Litigation Reform Act of 1995 and other securities laws and
is subject to the safe-harbor created by such Act. Forward-looking statements include our financial performance outlook and shareholder returns and statements
regarding our operations, economic performance, financial condition, goals, beliefs, future growth strategies, investment objectives, plans and current expectations,
such as projected revenues from our emerging market acquisition pipeline, valuation creation and returns associated with our data center business and the
anticipated benefits of our conversion to a real estate investment trust for federal income tax purposes, including the opportunity to create value by acquiring leased
space, our potential for a broadened investor base and enhanced valuations and the estimated range of our remaining special distribution and our ordinary dividends.
These forward-looking statements are subject to various known and unknown risks, uncertainties and other factors. When we use words such as "believes,"
"expects," "anticipates," "estimates" or similar expressions, we are making forward-looking statements. You should not rely upon forward-looking statements except
as statements of our present intentions and of our present expectations, which may or may not occur. Although we believe that our forward-looking statements are
based on reasonable assumptions, our expected results may not be achieved, and actual results may differ materially from our expectations. Important factors that
could cause actual results to differ from our other expectations include, among others: (i) the actual 2014 special distribution and our expected ordinary dividends may
be materially different from our estimates (ii) the cost to comply with current and future laws, regulations and customer demands relating to privacy issues; (iii) the
impact of litigation or disputes that may arise in connection with incidents in which we fail to protect our customers' information; (iv) changes in the price for our
storage and information management services relative to the cost of providing such storage and information management services; (v) changes in customer
preferences and demand for our storage and information management services; (vi) the adoption of alternative technologies and shifts by our customers to storage of
data through non-paper based technologies; (vii) the cost or potential liabilities associated with real estate necessary for our business; (viii) the performance of
business partners upon whom we depend for technical assistance or management expertise outside the U.S.; (ix) changes in the political and economic environments
in the countries in which our international subsidiaries operate; (x) claims that our technology violates the intellectual property rights of a third party; (xi) changes in
the cost of our debt; (xii) the impact of alternative, more attractive investments on dividends; (xiii) our ability or inability to complete acquisitions on satisfactory terms
and to integrate acquired companies efficiently; (xiv) other trends in competitive or economic conditions affecting our financial condition or results of operations not
presently contemplated; and (xv) other risks described more fully in our Annual Report on Form 10-K filed on February 28, 2014 under “Item 1A. Risk Factors”, our
Quarterly Report on Form 10-Q filed on July 31, 2014 under “Item 1A Risk Factors” and other documents that we file with the SEC from time to time. Except as
required by law, we undertake no obligation to release publicly the result of any revision to these forward-looking statements that may be made to reflect events or
circumstances after the date hereof or to reflect the occurrence of unanticipated events.

3
We Store & Manage Information Assets
73% 17% 10%
Records Management Data Management Shredding

4
Diversified Global Business
$3B annual revenues
>155,000 customers
Serving 95% of Fortune 1000
67MM SF of real estate in >1,000 facilities
Compelling Customer Value Proposition
Reduce costs and risks of storing and protecting information assets
Broadest range of footprint and services
Most trusted brand
Leading Global Presence
36 Countries
5 Continents

5
Able to execute strategy within REIT framework
Significant global real estate footprint – over 1,000 facilities in 67MM square feet worldwide
Successfully structured the business to deliver services and aligned international businesses within structure
REIT Structure Supports Value Creation

6
What You Will Hear Today
We are uniquely positioned to create value through our operating model and real estate strategy
We have a defensible moat that protects long-term value
Fundamentals support stable growth in storage rental
Leading storage rental-driven business, supported by defensible market leadership and stable fundamentals, drives attractive shareholder returns

7
Global Real Estate Portfolio of More than 1,000 Facilities

8
Illustrative North America RM Storage
Annual Economics(1) (per square foot, except for ROIC)
Investment
Customer acquisition $ 42
Building and outfitting 54
Racking structures 54
Total investment $ 150
Storage Rental Income
Storage rental revenue $ 27
Direct operating costs (3)
Allocated field overhead (3)
Storage rental income $ 21
Pre-Tax Storage Rental ROIC(2) ~14%
High storage rental revenues per square foot
Occupancy costs incurred by the square foot; revenue earned by the cubic foot
Storage rental value creation drivers
Facility design expertise
Low maintenance capex requirements
Network utilization
Portfolio management of multiple tenants
Related services
Attractive, High-Return Storage Rental Businesses
(1) Reflects average portfolio pricing and assumes an owned facility (2) Includes maintenance CapEx, assumed at 2% of revenue

9
NA Leased (47%) Owned (36%) INTL Leased (17%)
Potential to create value and reduce financing costs through acquisition of select leased facilities
Acquisition opportunity of $700MM to $1B over 10-year timeframe
Solid investment return potential
Supports REIT Asset Test
Higher real estate residual value
Real Estate Acquisitions to Enhance Returns
Potential $2.5B - $3.0B Purchase Universe

10
Global Market $23B Unvended
IRM
Recall
Cintas (DocumentManagement)
Shred-it
Other
Defensible Moat Protects Long-term Value
Global platform and industry-leading scale provide competitive advantage
Global network difficult to replicate
High degree of operating leverage
Unparalleled presence and brand support further penetration of unvended opportunity
Relationships at high levels within customer organizations
Demonstrated ability to help customers reduce overall cost of records management

11
2%
11%
16%
8%
3%
3% 3%
37%
19%
North America Revenue by Vertical
Other2
Insurance
Financial
Healthcare
Federal
Legal
Energy
Business
Services
Life Sciences
High-quality, Diversified Customer Base
155,000 customers
Serving 950 of Fortune 1000
No single customer represents greater than 2%
Top 20 customers have historically represented between 6% to 7% of consolidated revenues
Customer retention is consistently high with annual losses of less than 3% (on a volume basis) attributable to customer terminations
Long average life of a box in storage (~15 yrs.)1
(1) Based on annual volume churn rate of ~7%
(2) No single vertical within ‘Other’ comprises more than 1% of North America Revenue

12
-6%
-4%
-2%
0%
2%
4%
6%
8%
10%
2007 2008 2009 2010 2011 2012 2013
Same Store NOI Growth (Historical)
Industrial average Self-storage average
Storage Rental Revenue is Stable Throughout Cycles
Source: Benchmark data provided by Green Street Advisors
IRM average internal storage rental revenue growth

13
Large & growing
59% of revenues ($1.8B)
4% - 5% constant dollar growth
GDP correlated & inflation hedged
25 Consecutive Years of Storage Rental Growth
2013
$1,785
Storage Rental ($MM)
14
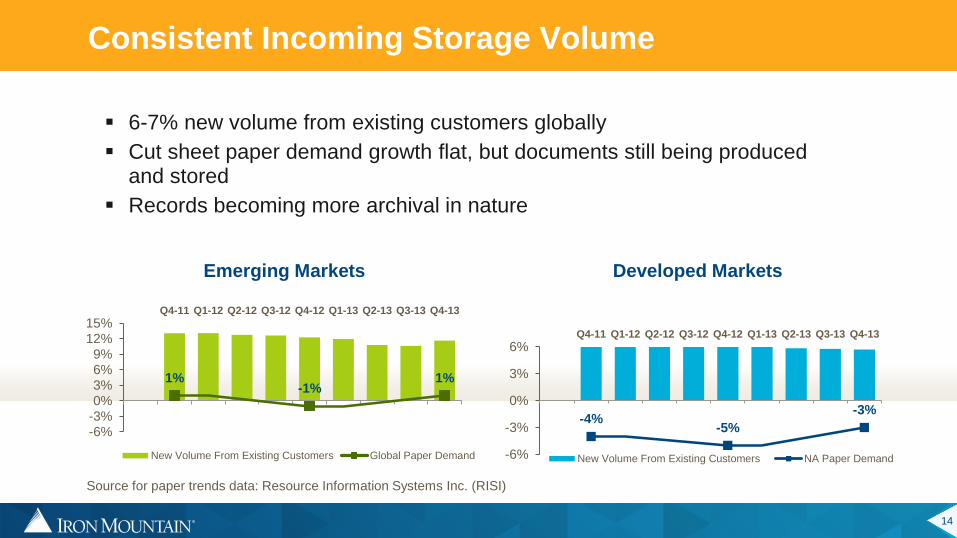
Consistent Incoming Storage Volume
6-7% new volume from existing customers globally
Cut sheet paper demand growth flat, but documents still being produced and stored
Records becoming more archival in nature
-4% -5%
-3%
-6%
-3%
0%
3%
6%Q4-11 Q1-12 Q2-12 Q3-12 Q4-12 Q1-13 Q2-13 Q3-13 Q4-13
New Volume From Existing Customers NA Paper Demand
1% -1%
1%
-6%-3%0%3%6%9%
12%15%
Q4-11 Q1-12 Q2-12 Q3-12 Q4-12 Q1-13 Q2-13 Q3-13 Q4-13
New Volume From Existing Customers Global Paper Demand
Developed Markets Emerging Markets
Source for paper trends data: Resource Information Systems Inc. (RISI)

15
Secular Trends Impact Lower Margin Service Business
Main impact of technology is on service activity
Archival data – Documentation or Proof
Active File – Business process or Query
“Query”
2013 NA RM Storage and
Handling Transport Services
$0 $500 $1,000 $1,500
File (Active)
Box(Archival)
Storage Service$MM
“Proof”
75%
32% $-
$200
$400
$600
$800
$1,000
$1,200
$1,400
$1,600
$1,800
$2,000
Storage Service
Gross Margin
$1.8 B
$1.2 B
2013 Storage and Service Revenue % Represents Gross Margin

16
Global Footprint and Growth in Emerging Markets
88%
12%
Developed Emerging
% of Global Revenues Global presence in 36 markets
Growing in 31 markets
Strong leadership positions in key emerging markets
Represents 12% of total revenue
Organic growth of 11%
Figures above are as of Q2 2014

17
Strategy to Extend Durability of Business
Speed and Agility Simplification, Process Automation and Efficiency
Developed
Markets Drive Profitable Revenue
Growth; Grow Tape and
Cube Volume
Strategic Plan
Emerging Markets Expand and Leverage
Emerging
Businesses Identify, Incubate,
Scale or Scrap
(Data Center)
Organization and Culture Organizational Capabilities, Talent and Processes
CO
RE
PIL
LA
RS
E
NA
BL
ER
S
18
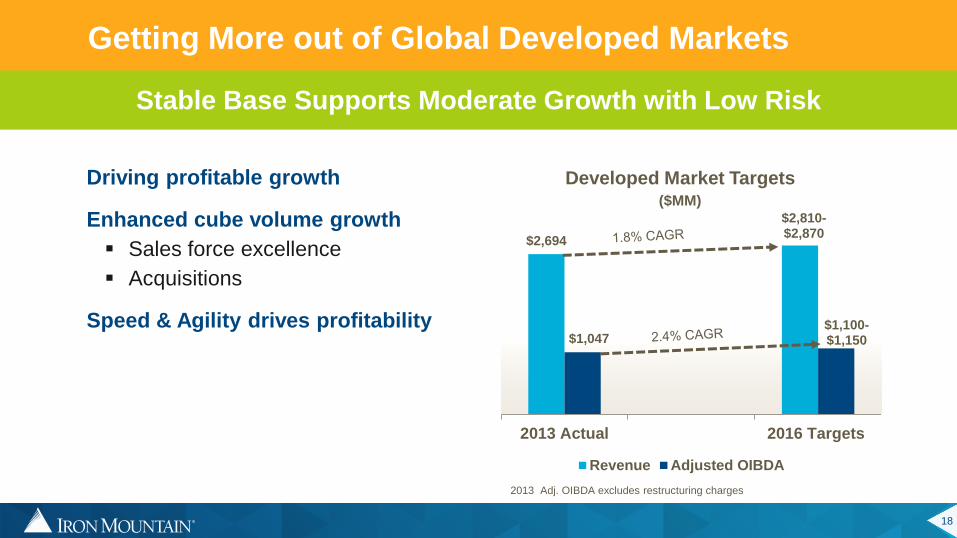
$2,694
$2,810-$2,870
$1,047 $1,100- $1,150
2013 Actual 2016 Targets
Revenue Adjusted OIBDA
Developed Market Targets ($MM)
Driving profitable growth
Enhanced cube volume growth
Sales force excellence
Acquisitions
Speed & Agility drives profitability
Getting More out of Global Developed Markets
Stable Base Supports Moderate Growth with Low Risk
2013 Adj. OIBDA excludes restructuring charges

19
Improved Retention and Acquisition Drive Net Volume Growth
6.7% 6.8% 6.6% 6.3% 6.3% 6.3% 6.2% 6.1%
1.9% 1.9% 1.9% 1.9% 2.0% 2.1% 2.1% 2.2%
1.5% 1.5% 1.5% 0.3% 2.1% 4.5% 5.2% 5.9%
-4.7% -4.7% -4.7% -4.6% -4.6% -4.6% -4.5% -4.7%
-2.8% -2.7% -2.7% -2.6% -2.6% -2.5% -2.3% -2.0%
2.7% 2.7% 2.6% 1.4% 3.2% 5.8% 6.7% 7.6%
Q3-12 Q4-12 Q1-13 Q2-13 Q3-13 Q4-13 Q1-14 Q2-14
Organic New Sales Acquisitions Destructions Outperm/Terms
Year-over-Year Global Net Volume Growth Rates (Records Management Only)
Net Volume Growth Rate

20
Capturing Opportunity in Emerging Markets
Investing to drive leadership in key emerging markets
~50% of emerging market growth driven by acquisitions
First wave of outsourcing
Enterprise customers demand global service
Benefits to having consistent standards and records management programs across the globe
2013 Adjusted OIBDA excludes restructuring charges
Expand and Leverage Emerging Markets Presence
$319
$510-$550
$65
$100- $150
2013 Actual 2016 Targets
Revenue Adjusted OIBDA
Emerging Market Targets
($MM)
100-120
Base
M&A Key Driver of Emerging Market Leadership Strategy
90-110
Acquisitions

21
$160
$50
$145
$55
$85
$30
IMLA EMEA Asia
New Territories Current Territories
Acquisition opportunities in both emerging and developed markets
Developed markets – strategy to enhance storage growth while maintaining attractive returns
Emerging markets – investing to build strong leadership positions
$500 MM+ revenue pipeline > 4X target for 2016
Diversified portfolio of targets
Streamlined acquisition process
M&A Pipeline is Strong and Execution Well Underway
Projected Annualized Revenues from
Emerging Market M&A Pipeline

22
Evaluating Data Center Potential for Emerging Business Opportunities
Illustrative Value Creation and
Estimated Stabilized Returns Post-2014
($ MM)
Revenue $27
Adjusted OIBDA ~$15
NOI ~$16
Capital invested ~$100
Data center cap rate 7.5% - 8.5%
Implied value $185 - $215
Implied value creation $85 - $115
ROIC 10% - 14%
Adjusted OIBDA reflects stabilized SG&A expenses

23
$3,026
$3,360- $3,470
$2,200
$2,400
$2,600
$2,800
$3,000
$3,200
$3,400
$3,600
2013 Base Incremental M&A 2016 E
Strategic Plan Drives Solid Revenue Growth
($MM)
$200 - $265
$135 - $175 + Potential
Upside from EBOs
+ Potential Upside
from EBOs

24
Low-volatility, Moderate Growth with Attractive Yield
$919
$35-$60
$20-$45 $20-$30 $995 - $1,055
Adj. OIBDA 2013 Base Incremental M&A Speed and Agility Adj. OIBDA 2016 E
*Assumes a 4% dividend yield
2013 excludes restructuring charges
ROIC 9.7% 10% - 11%
Avg. Inv. Capital
~$5.5B ~$6.3B
($MM)
Driving Total Shareholder Returns - projected to be between 8% to 9%*
+ Potential Upside from
EBOs
+ Potential Upside
from EBOs

25
Ordinary distribution and core
real estate investment covered by
Free Cash Flow
Data Center business,
opportunistic Real Estate
purchases and acquisitions
funded by incremental borrowing
at targeted leverage ratio and/or
potential equity proceeds
Growth in OIBDA and Free Cash
Flow may allow for some de-
levering
Cash Available for Distributions and Investment ($MM) Normalized
2014(1)
Normalized
2015(2)
Adjusted OIBDA $930 $965
Add: Other Non-Cash Items & Adjustments ~$40 ~$40
Less: Interest
Cash Taxes (run rate)
Maintenance CapEx
Other (non-Real Estate) CapEx
Customer Acquisition Costs
~$260
~$60
~$90
~$50
~$30
~$260
~$65
~$90
~$45
~$30
Cash Available for Distributions and Investment $480 $515
Normalized, Growing Cash Flows Support Capital Allocation Strategy
Ordinary Distributions(3) ~$400 ~$416
Excess Cash Flow Available for Investment: ~$ 80 ~$ 99
(1) Normalized amounts exclude REIT conversion costs , restructuring costs and cash portion of special distribution
(2) Not intended to represent specific projections for 2015. Adjusted OIBDA and dividends in line with 4% CAGR growth implied by Strategic Plan as shown on page 24
Real Estate (Building Purchases and Data
Centers)
Core Acquisitions
Core Real Estate (Racking, Building &
Leasehold improvements)

26
Stockholder Distributions
Receipts and Reporting for 2014
Distributions paid in Jan, April, July, Oct. & Dec. 2014 should be reported as ordinary distributions in 2014
$400mm expected to be paid in 2014
First REIT distribution declared on 09/15/14 at $0.475 per share
Also reflects the quarterly rate expected in December following issuance of shares associated with Special Distribution
For 2014, IRM stockholders should report:
$400mm quarterly distributions PLUS Special Distribution
Under IRS rules, historical C-Corp earnings and profits need to be distributed prior to any REIT distributions
Character of each distribution to stockholders (including qualified vs non-qualified ordinary distributions) will vary, depending upon each stockholder’s specific situation, final amounts distributed, and the final characterization of such distributions at year-end, among other factors
Mid-year Conversion Results in Catch-up Distribution
Declaration
Date Paid Date
Distribution
Amount
Cash
Amount
Distribution
Per Share
Dec 16, ‘13 Jan 15, ‘14 $52mm $52mm $0.27
Mar 14, ‘14 Apr 15, ‘14 $52mm $52mm $0.27
May 28, ‘14 Jul 15, ‘14 $52mm $52mm $0.27
Sept 15, ‘14 Oct 15, ‘14 $92mm $92mm $0.475
2014 Special
Distribution1 Nov 4, ’14 $700mm $140mm $3.62
Nov ’14 2
(catch-up)
Dec ‘14 ~$52mm ~$52mm ~$0.2475
Nov ’14 2 Dec ‘14 ~$100mm ~$100mm $0.475
1 80% stock / 20% cash 2 Subject to Board approval

27
Key Messages
We are uniquely positioned to create value through our operating model and real estate strategy
We have a defensible moat that protects long-term value
Fundamentals support stable growth in storage rental
Leading storage rental-driven business, supported by defensible market leadership and stable fundamentals, drives attractive shareholder returns

28
Questions?

© 2013 Iron Mountain Incorporated. All rights reserved. Iron Mountain and the design of the mountain are registered trademarks of Iron Mountain Incorporated.
All other trademarks and registered trademarks are the property of their respective owners.
Appendix

30
“Enterprise Storage” Compares Favorably
Iron Mountain Self-storage Industrial
North America annual rental revenue/SF $27.00 $13.80 $5.50
Tenant Improvements/SF N/A N/A $1.96
CapEx(1) ~7% 5.3% 12%
Average lease term Large customers: 3 Yrs.
Small customers: 1 Yr. Month-to-Month ~4-6 yrs.
Customer retention ~98% ~85% ~75%
Customer concentration Very low Very Low Low
Customer type Business Consumer Business
Non-Real Estate %(2) 30% 20% 10%
Stabilized Occupancy
(building & racking utilization)
Building: 80% to 85%
Racking: 90% to 95% 90% 93%
Operating Margin(3) Storage: 70% - 75% 68% 70%
(1) IRM CapEx includes maintenance, racking and leasehold improvements as a percentage of revenue; excludes real estate purchases, IT investment and REIT conversion costs. Comps represent recurring CapEx as a percentage of NOI. Excludes leasing commissions.
(2) Non-Real Estate % for IRM is as a % of Total Adj. OIBDA. Comps are as a % of Assets. (3) Operating margin for IRM is storage gross margin.
Source: Company estimates and filings. Benchmark data provided by Green Street Advisors and J.P. Morgan

31
Potential for Broadened Investor Base and Enhanced Valuation
14.2
15.6
16.5
17.1
18.3
18.6
22.1
18.3
21.3
22.2
14.6 x
LPT
DRE
DCT
PSB
EGP
FR
PLD
CUBE
EXR
PSA
IRM
Price-to-2014 Pro Forma FFO
5.5%
3.7%
3.5%
2.4%
3.4%
2.2%
3.2%
2.7%
3.5%
3.2%
6.1%
LRY
DRE
DCT
PSB
EGP
FR
PLD
CUBE
EXR
PSA
IRM
Pro Forma Current Dividend Yield
*Based on a pro forma 2014 dividend of $2.12 per share, and 193MM shares outstanding and a stock price of $34.75 as of 08/14/2014. REIT pricing as of 08/14/2014
Source: Company estimates and FactSet mean FFO and AFFO estimates.
19.0
18.7
24.8
24.7
24.0
22.5
27.8
19.2
22.8
23.5
11.6 x
LRY
DRE
DCT
PSB
EGP
FR
PLD
CUBE
EXR
PSA
IRM
Price-to-2014 Pro Forma AFFO
SE
LF
-ST
OR
AG
E
IND
US
TR
IAL