investor presentation - nutrien conference... · this presentation is prepared in accordance with...
TRANSCRIPT
Investor PresentationFebruary 2018
Legal Disclaimer
Certain statements and other information included in this presentation constitute "forward-looking information" or "forward-looking statements" (collectively, "forward-looking statements") under applicable securities laws. All statements in this presentation, other than those relating to historical information or current conditions, are forward-looking statements, including, but not limited to, statements relating to certain strategic benefits expected to result from the combination of Agrium and PotashCorp, the nature and timing of operating synergies and Nutrien's expected capital allocation strategy and dividend policy.
Forward-looking statements in this presentation are based on certain key expectations and assumptions made by Nutrien, including expectations and assumptions concerning: customer demand for Nutrien's products; commodity prices and interest and foreign exchange rates; operating synergies, capital efficiencies and cost-savings; applicable tax laws; future production rates; future debt ratings; the sufficiency of budgeted capital expenditures in carrying out planned activities; and the availability and cost of labour and services. Although Nutrien believes that the expectations and assumptions on which such forward-looking statements are based are reasonable, undue reliance should not be placed on the forward-looking statements because Nutrien can give no assurance that they will prove to be correct.
Forward-looking statements are subject to various risks and uncertainties which could cause actual results and experience to differ materially from the anticipated results or expectations expressed in this presentation. Key risks and uncertainties include, but are not limited to: general global economic, market and business conditions; weather conditions including impacts from regional flooding and/or drought conditions; crop plant area, yield and prices; supply and demand and price levels for major products of Nutrien may vary from what we currently anticipate; failure to realize anticipated synergies or cost savings in connection with the combination of Agrium and PotashCorp; risks regarding the integration of Agrium and PotashCorp; failure to realize governmental and regulatory requirements and actions by governmental authorities, including changes in government policy, government ownership requirements, changes in environmental, tax and other laws or regulations and the interpretation thereof; political risks, including civil unrest, actions by armed groups or conflict; regional natural gas supply restrictions; counterparty and sovereign risk; relationships with employees, customers, business partners and competitors and risk factors set forth in Nutrien’s business acquisition report dated February 20, 2018 and in Agrium’s and PotashCorp’s respective annual information forms, each dated February 20, 2018, all filed under respective corporate profiles on SEDAR and EDGAR.
For material assumptions and risks associated with our 2018 guidance, see “Forward-Looking Statements” in our press release dated February 5, 2018.
Nutrien disclaims any intention or obligation to update or revise any forward-looking statements in this presentation as a result of new information or future events, except as may be required under applicable U.S. federal securities laws or applicable Canadian securities legislation.
All reference to “$” and “USD$” are to U.S. dollars.
IFRS Advisory This presentation is prepared in accordance with International Financial Reporting Standards as issued by the International Accounting Standards Board (“IFRS”). IFRS financial information of Nutrien in 2018 reflects the operations of Nutrien. IFRS financial information for 2017 and prior reflects the operations of PotashCorp. For comparative purposes, certain historical financial information presented reflects the combined results of Agrium and PotashCorp.
Non-IFRS Financial Measures AdvisoryWe consider adjusted net earnings (loss) from continuing operations before finance costs, income tax (recovery) expense and depreciation and amortization ("EBITDA") , EBITDA margin, free cash flow, cash cost of goods sold and all adjusted combined financial information, all of which are non-IFRS financial measures, to provide useful information to both management and investors in measuring our financial performance and financial condition. Refer to the disclosure under the heading “Non-IFRS Financial Measures” and “Non-IFRS Financial Measures in MD&A included in Agrium and PotashCorp’s annual reports each as filed on SEDAR at www.sedar.com and EDGAR at www.sec.gov under our corporate profile on February 26, 2018, for a reconciliation of these non-IFRS measures to the most directly comparable measures calculated in accordance with IFRS and for a further discussion of how these measures are calculated and their usefulness to users including management. Non-IFRS financial measures are not recognized measures under IFRS and our method of calculation may not be comparable to that of other companies. These non-IFRS financial measures should not be considered as a substitute for, or superior to, measures of financial performance prepared in accordance with IFRS.
February 26, 2018
2
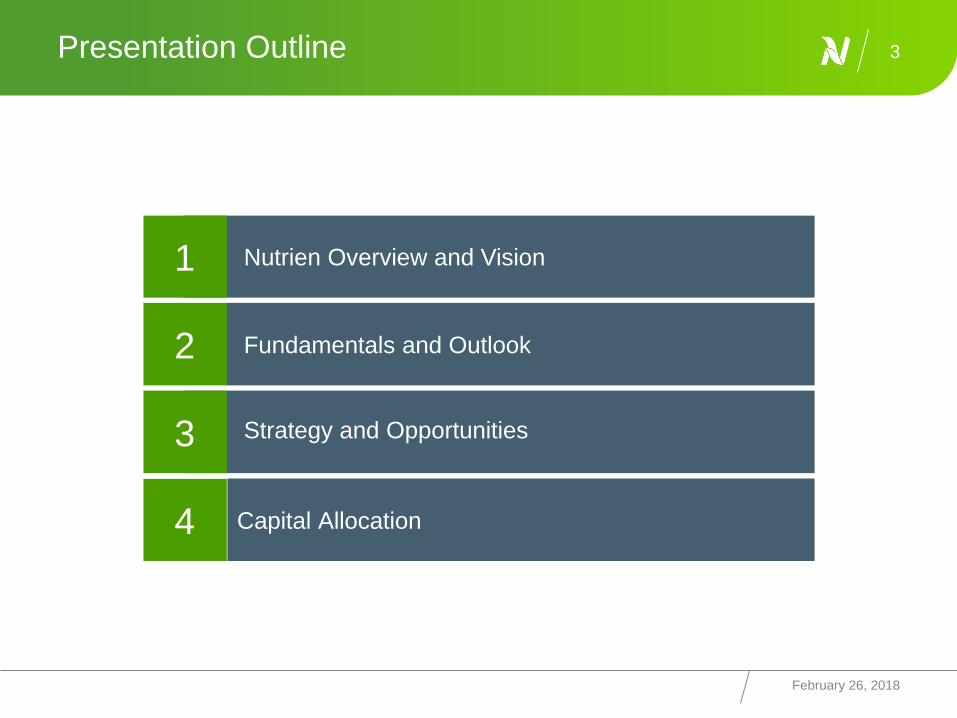
Presentation Outline
February 26, 2018
3
1 Nutrien Overview and Vision
2 Fundamentals and Outlook
3
Capital Allocation4
1
Strategy and Opportunities
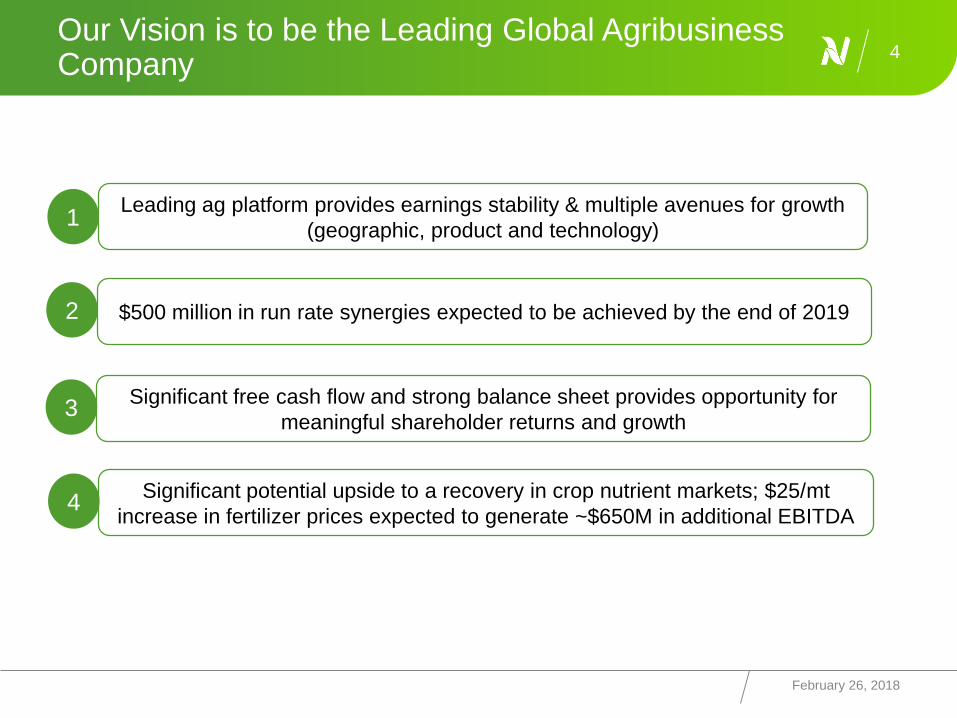
Our Vision is to be the Leading Global Agribusiness Company
February 26, 2018
4
$500 million in run rate synergies expected to be achieved by the end of 2019
Leading ag platform provides earnings stability & multiple avenues for growth
(geographic, product and technology)1
2
Significant free cash flow and strong balance sheet provides opportunity for
meaningful shareholder returns and growth3
Significant potential upside to a recovery in crop nutrient markets; $25/mt
increase in fertilizer prices expected to generate ~$650M in additional EBITDA4
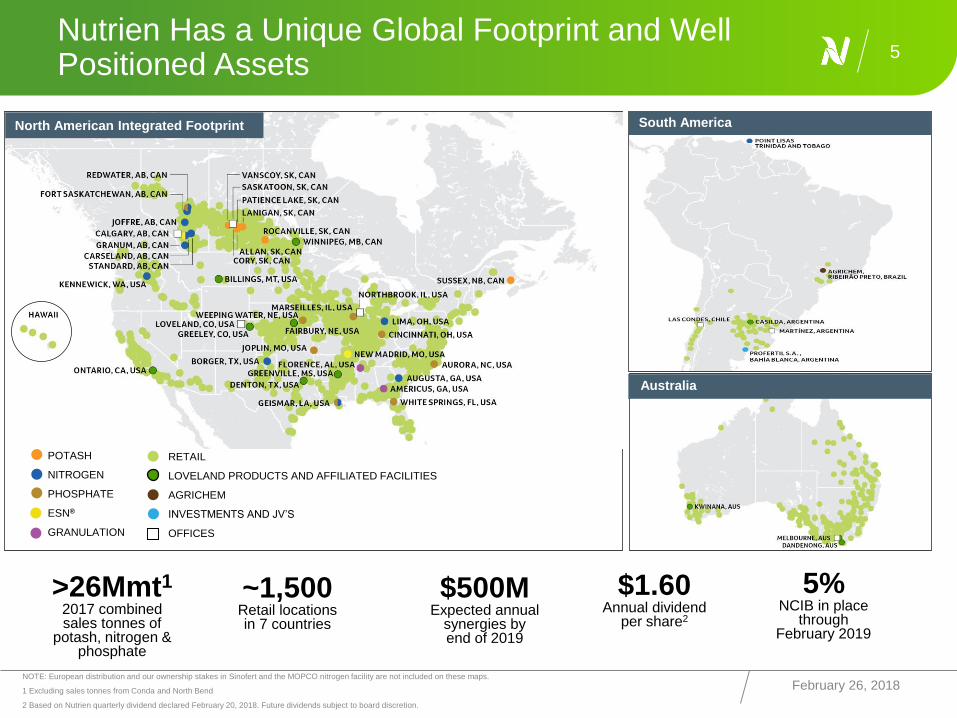
Nutrien Has a Unique Global Footprint and Well Positioned Assets
NOTE: European distribution and our ownership stakes in Sinofert and the MOPCO nitrogen facility are not included on these maps.
1 Excluding sales tonnes from Conda and North Bend
2 Based on Nutrien quarterly dividend declared February 20, 2018. Future dividends subject to board discretion.
5
>26Mmt1
2017 combined sales tonnes of
potash, nitrogen & phosphate
$500MExpected annual
synergies by end of 2019
$1.60Annual dividend
per share2
~1,500Retail locations in 7 countries
LEGEND:
POTASH
NITROGEN
PHOSPHATE
ESN®
GRANULATION
RETAIL
LOVELAND PRODUCTS AND AFFILIATED FACILITIES
AGRICHEM
INVESTMENTS AND JV’S
OFFICES
South America
Australia
5%NCIB in place
through February 2019
North American Integrated Footprint
February 26, 2018

~33%
~24%~7%
~36%
Diversified Portfolio Provides Stability and Multiple Avenues for Growth
February 26, 2018
6
Retail
Phosphate
and Sulfate Nitrogen
Potash
2017 Adjusted
Combined EBITDA Split1
1 Reflects adjusted combined EBITDA, which is derived from historical financial information of PotashCorp and Agrium and do not include the effects of a) intersegment eliminations, b) the equity earnings
and operating results of completed or anticipated divestitures in connection with the merger, c) allocation of certain corporate costs or d) the impairment charge related to Phosphate. Determination of
Adjusted Combined EBITDA required allocation of historical amounts on a basis consistent with how Nutrien will report financial information in the future. This information does not purport to project the
future operating results of Nutrien, and is not necessarily indicative of what Nutrien’s results of operations would have been had the merger been completed on January 1, 2017.
2 Cash provided by operating activities from continuing operations excluding the impact of net changes in non-cash working capital less sustaining capital expenditures.
3 Calculated as (EBITDA less sustaining capital)/ EBITDA. 2018F based on mid-point of guidance as of Feb 5, 2018.
4 Based on Nutrien quarterly dividend declared February 20, 2018. Future dividends subject to board discretion.
USD billions (unless otherwise noted)
2017 Adjusted
Combined
Revenue $18.3
EBITDA1 $2.7
Free Cash Flow 2 $1.3
Sustaining Capital $1.0
Free Cash Flow
Conversion3
63% (2017)
~70% (2018F)
Annual Dividend per
Share4 $1.60
Summary Financial
Performance
~25% increase in estimated 2018 EBITDA
versus proforma 2017
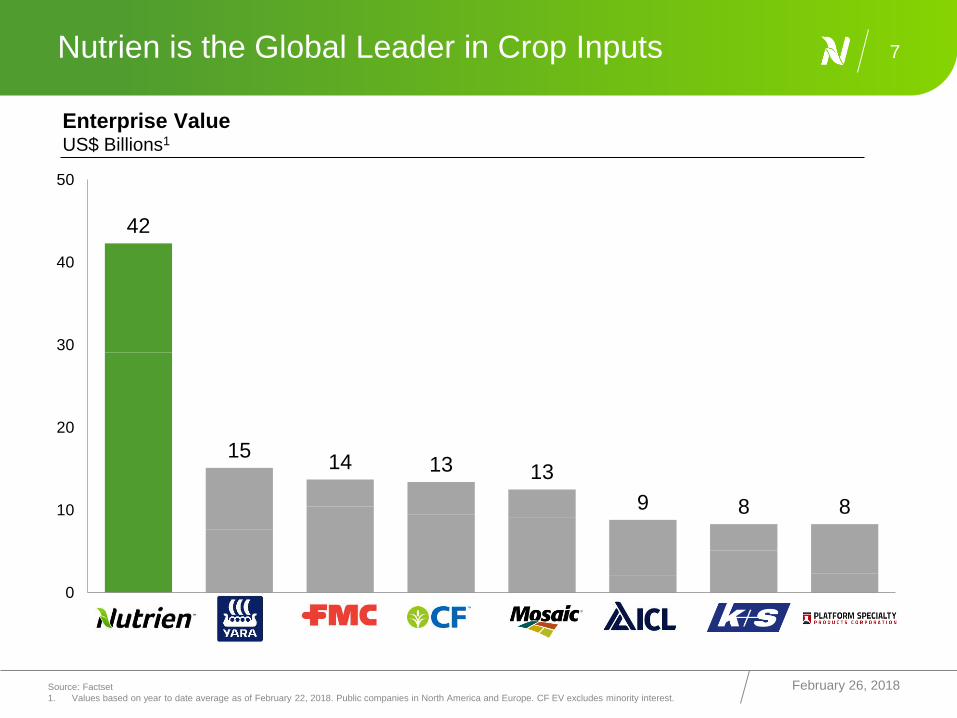
Nutrien is the Global Leader in Crop Inputs
42
15 14 13 13
9 8 8
0
10
20
30
40
50
Nutrien YAR FMC CF MOS ICL K+S PAH
February 26, 2018Source: Factset
1. Values based on year to date average as of February 22, 2018. Public companies in North America and Europe. CF EV excludes minority interest.
7
Enterprise ValueUS$ Billions1

Fundamentals and Outlook
INVESTOR PRESENTATION February 26, 2018
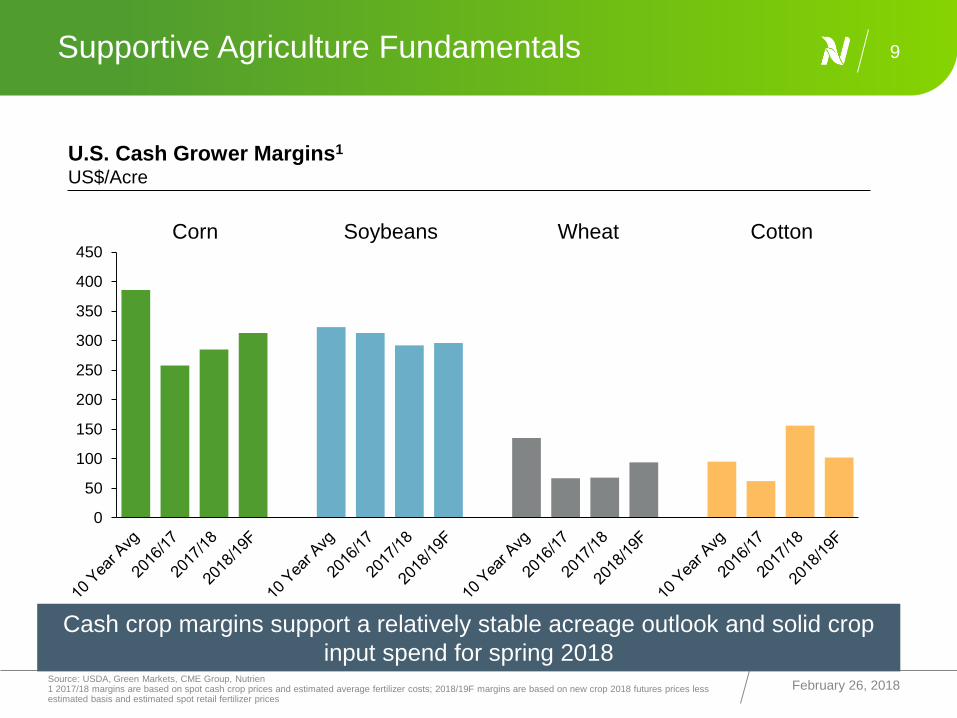
Supportive Agriculture Fundamentals
February 26, 2018
9
0
50
100
150
200
250
300
350
400
450Corn Soybeans Wheat Cotton
U.S. Cash Grower Margins1
US$/Acre
Cash crop margins support a relatively stable acreage outlook and solid crop
input spend for spring 2018Source: USDA, Green Markets, CME Group, Nutrien1 2017/18 margins are based on spot cash crop prices and estimated average fertilizer costs; 2018/19F margins are based on new crop 2018 futures prices less estimated basis and estimated spot retail fertilizer prices
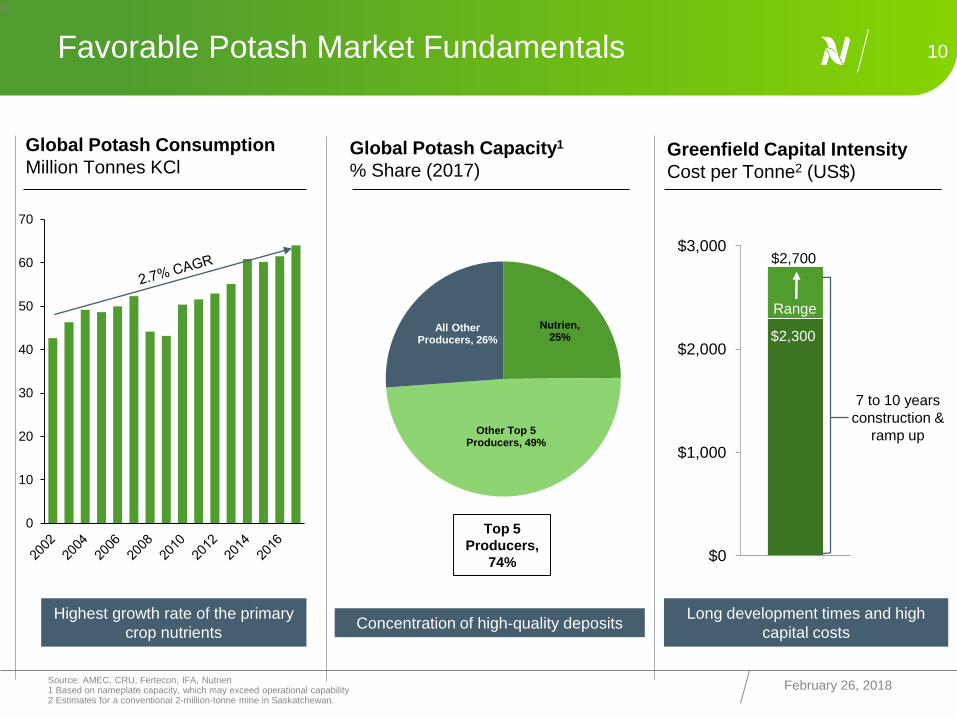
Favorable Potash Market Fundamentals
February 26, 2018
1
0
10
Highest growth rate of the primary
crop nutrients
Nutrien, 25%
Other Top 5 Producers, 49%
All Other Producers, 26%
Concentration of high-quality depositsLong development times and high
capital costs
$0
$1,000
$2,000
$3,000
0
10
20
30
40
50
60
70
Top 5
Producers,
74%
$2,700
$2,300
7 to 10 years
construction &
ramp up
Global Potash Consumption
Million Tonnes KClGlobal Potash Capacity1
% Share (2017)Greenfield Capital Intensity
Cost per Tonne2 (US$)
Source: AMEC, CRU, Fertecon, IFA, Nutrien1 Based on nameplate capacity, which may exceed operational capability 2 Estimates for a conventional 2-million-tonne mine in Saskatchewan.
Range

70%
75%
80%
85%
90%
95%
100%
Relatively Tight Potash Supply & Demand 11
February 26, 2018
0
10
20
30
40
50
60
70
80
Demand Growth @ 3.0%/yr
Demand Growth @ 2.7%/yr
Operational Capability
Global Potash S&DMillion Tonnes KCl
Global Utilization Rate1
Percent
Expect demand growth and capacity closures to offset capacity additions;
operating rates expected to be at or above historical average
Demand Growth @ 2.7%/yr*
Demand Growth @ 3.0%/yr*
Source: CRU, Fertecon, IFA, Nutrien1 Based on estimated operational capability * Demand growth based on 20 year CAGR 2002 to 2022

Tightening Global Nitrogen Supply & Demand 12
February 26, 2018
Global Nitrogen S&DMillion Tonnes Nitrogen
70%
75%
80%
85%
90%
95%
100%
0
20
40
60
80
100
120
140
160
180 Demand Operational Capability
Forecast improvement in nitrogen capacity utilization expected over the medium-term
Global Utilization Rate1
Percent
Source: CRU, Nutrien1 Based on estimated operational capability. Adjusted for idled capacity in China and Eastern Europe. * Demand growth based on 20 year CAGR 2002 to 2022
Demand Growth @ 2.0%/yr*
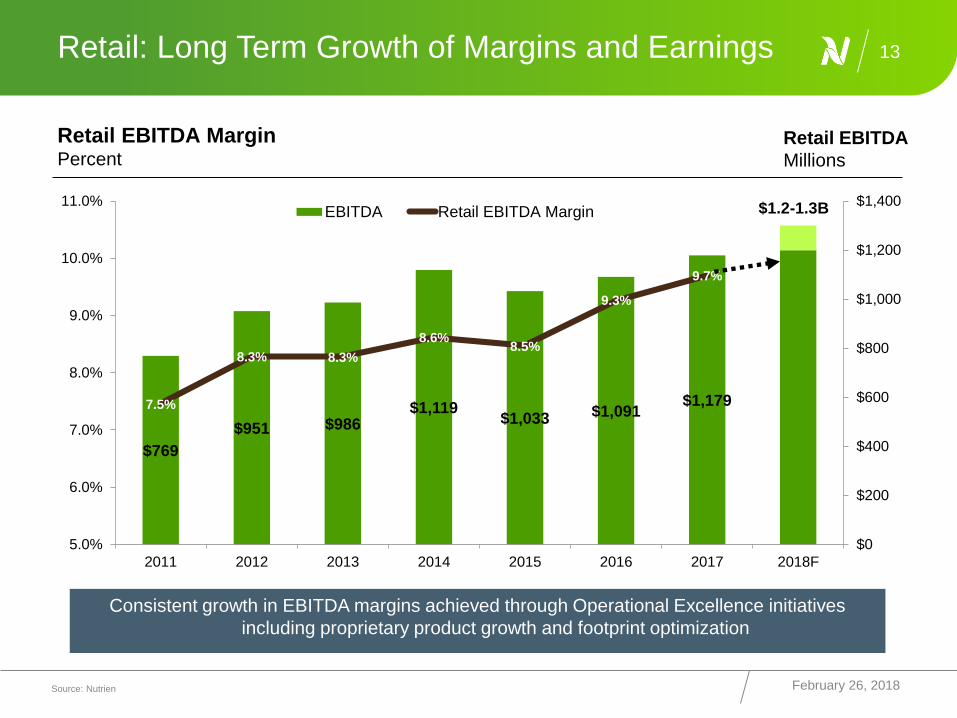
Consistent growth in EBITDA margins achieved through Operational Excellence initiatives
including proprietary product growth and footprint optimization
Retail: Long Term Growth of Margins and Earnings
February 26, 2018
13
$769
$951 $986$1,119
$1,033 $1,091$1,1797.5%
8.3% 8.3%
8.6%8.5%
9.3%
9.7%
$0
$200
$400
$600
$800
$1,000
$1,200
$1,400
5.0%
6.0%
7.0%
8.0%
9.0%
10.0%
11.0%
2011 2012 2013 2014 2015 2016 2017 2018F
EBITDA Retail EBITDA Margin $1.2-1.3B
Retail EBITDA MarginPercent
Retail EBITDA
Millions
Source: Nutrien

Strategy and Opportunities
INVESTOR PRESENTATION February 26, 2018
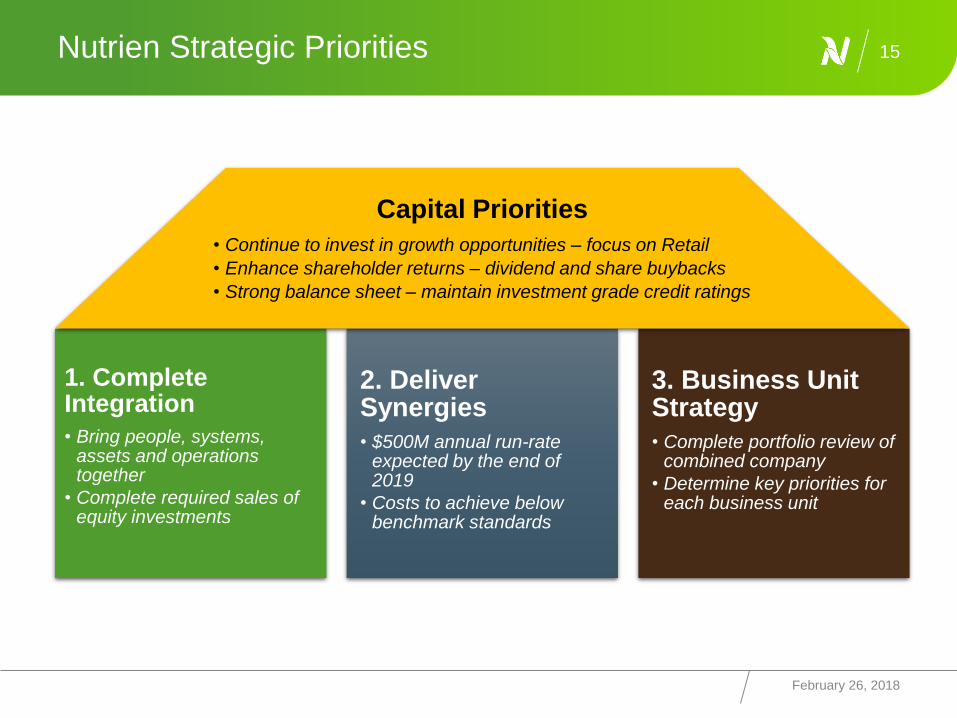
1. Complete Integration
• Bring people, systems, assets and operations together
• Complete required sales of equity investments
2. Deliver Synergies
• $500M annual run-rate expected by the end of 2019
• Costs to achieve below benchmark standards
3. Business Unit Strategy
• Complete portfolio review of combined company
• Determine key priorities for each business unit
Nutrien Strategic Priorities
February 26, 2018
15
Capital Priorities
• Continue to invest in growth opportunities – focus on Retail
• Enhance shareholder returns – dividend and share buybacks
• Strong balance sheet – maintain investment grade credit ratings

Highly confident in full synergy realization by the end of 2019. Achieved ~$60 million in run-rate
synergies year-to-date.
Significant Value Creation from Merger Synergies 16
$150
$500
$125
$100
$125
$0
$100
$200
$300
$400
$500
$600 Distribution /
Optimization• Rail Fleet
Optimization
• Distribution
and
Warehouse
Optimization
• Logistics
Savings
• Portfolio
Integration
Production
Optimization• Phosphate
Integration
• Potash
network
efficiencies
• Nitrogen
optimization
Procurement• Procurement
optimization
SG&A• SG&A
Efficiencies
Target
++
+
Expected Run-Rate SynergiesUS$ Millions
February 26, 2018Source: Nutrien
$250
End of
2019
End of
2018
~$60 YTD
2018

Nutrien to Supply Western Canada MAP Market from Increased Production at White Springs & Aurora
February 26, 2018
17
Source: Nutrien1 White Springs rock costs are lower, partly offset by higher transport cost and higher sulfur & NH3 costs, variable cost advantage varies depending on MAP price. Assumptions include: Variable cost savings ranges represent $30/mt higher and lower than 2019 MAP price forecast for Western Canada.
~15 ~15
~15 ~15
5
24
30
40
Lower P price Higher P price
0
20
40
60
80
100 ~$95M
~$65M
Phosphate and sulfate synergy potential of
~$80M made possible by the merger
Additional Potential Benefits
• Improved N.A. phosphate S/D balance
• Capital cost to convert Redwater MAP to AS
lower than other options
Lower Net
sustaining
Lower Fixed cost
Variable cost
Savings
AS expansion
Phosphate and Sulfate Synergy PotentialUS$ Millions
• Ammonium Sulphate conversion at Redwater
delivers $30-40M gross margin
• Variable cost savings = White Springs rock
costs are $140-180/mt lower than Redwater’s
delivered rock costs1
• Repurposing Redwater phosphate = lower
expected sustaining/fixed costs & running
White Springs/Aurora @ higher utilization
which lowers per tonne costs
Direct Synergy Potential

Business Unit Priorities
February 26, 2018
18
• Growth (acquisitions and proprietary products), Optimize network, Advance digital capabilitiesRetail
• Optimize network, Respond to market conditionsPotash
• Optimize network, Grow opportunisticallyNitrogen
• Deliver synergies, Optimize networkPhosphate and Sulfate
Integrated business to drive stable and growing free cash flow
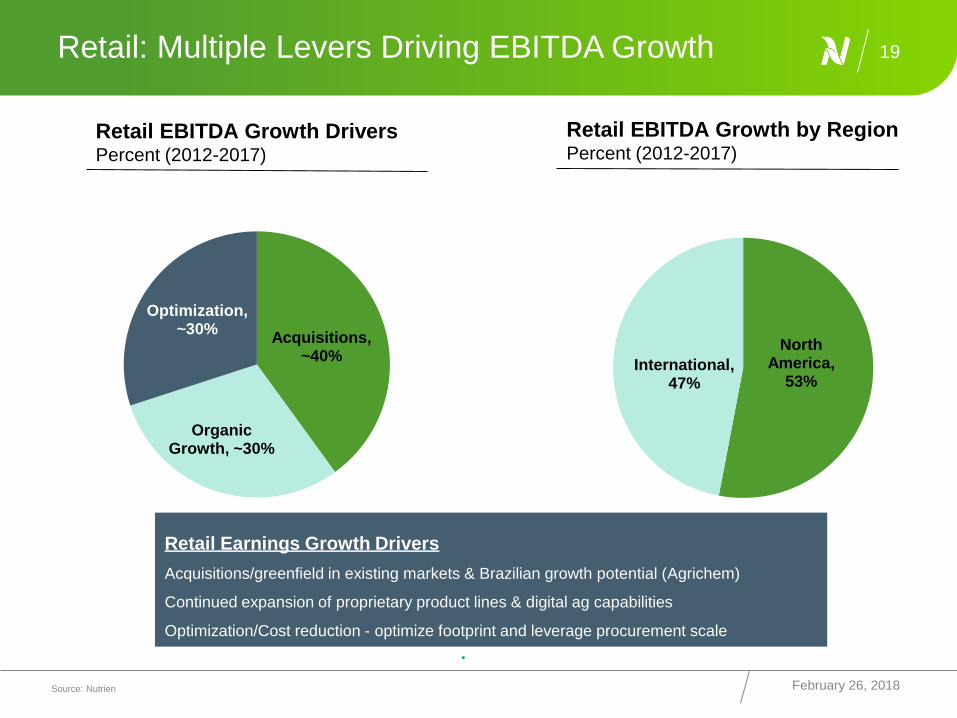
Retail: Multiple Levers Driving EBITDA Growth
Retail Earnings Growth Drivers
Acquisitions/greenfield in existing markets & Brazilian growth potential (Agrichem)
Continued expansion of proprietary product lines & digital ag capabilities
Optimization/Cost reduction - optimize footprint and leverage procurement scale
•
February 26, 2018
19
$75
$75
$75
North America,
53%International,
47%
Retail EBITDA Growth DriversPercent (2012-2017)
Source: Nutrien
Retail EBITDA Growth by RegionPercent (2012-2017)
Acquisitions, ~40%
Organic Growth, ~30%
Optimization, ~30%
Capital Allocation
INVESTOR PRESENTATION February 26, 2018

Multiple Levers to Generate Strong Free Cash Flow
February 26, 2018
21
Capture
Identified
Synergies
Stable and
Growing
Retail Base
Equity
Investment
Sales
$500M/year 1 Expect
$50-$140M of
EBITDA / Yr
~$4.5B estimated
net of tax
Fertilizer prices are more than
$100/mt lower than mid-cycle
(8 year avg prices)
Within
Nutrien’s
Control
External
Factors:
Leverage
to Upside
If fertilizer prices rise $25/mt = ~$650M EBITDA
If fertilizer prices rise $100/mt = ~$2.6B EBITDA
Capital
Priorities
Value Adding Growth
• Increase share in existing
markets (N.A & Australia)
• Focus on growing in Brazil
• Expand proprietary
business; digital ag
Enhance Shareholder
Returns
• Announced 5% NCIB
• Potential to further
increase dividend
(40-60% of FCF)
Enhance Balance Sheet
• Maintain investment grade
credit rating
1 Full $500M per year expected to be achieved by the end of 2019.
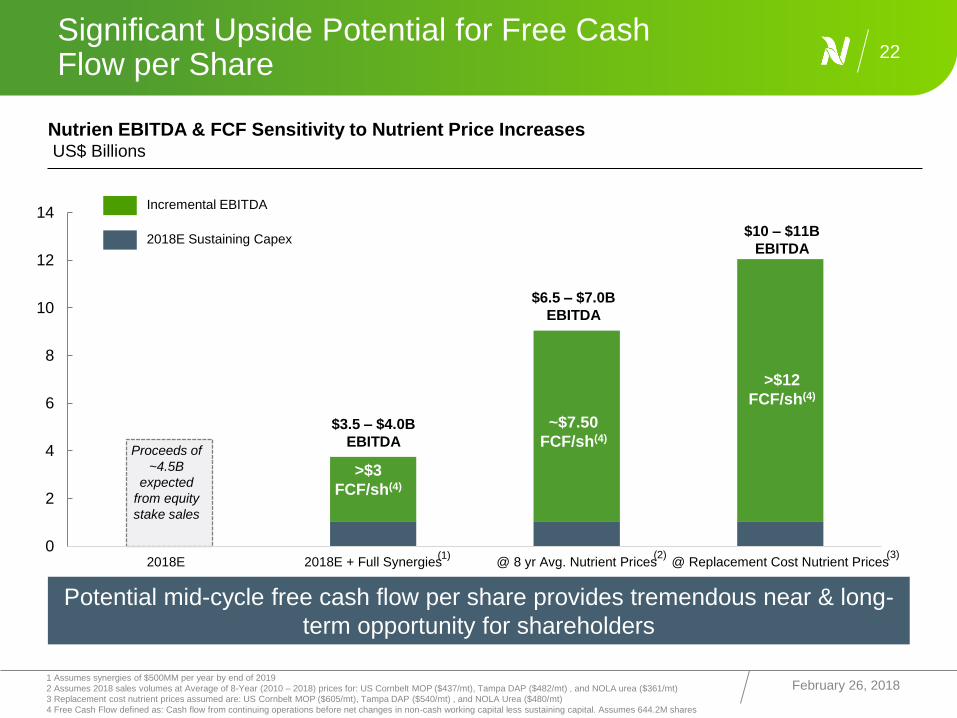
0
2
4
6
8
10
12
14
2018E 2018E + Full Synergies @ 8 yr Avg. Nutrient Prices @ Replacement Cost Nutrient Prices
$3.5 – $4.0B
EBITDA
$6.5 – $7.0B
EBITDA
$10 – $11B
EBITDA
Proceeds of
~4.5B
expected
from equity
stake sales
Significant Upside Potential for Free Cash Flow per Share
22
February 26, 2018
(1) (2)
2018E Sustaining Capex
Incremental EBITDA
1 Assumes synergies of $500MM per year by end of 2019
2 Assumes 2018 sales volumes at Average of 8-Year (2010 – 2018) prices for: US Cornbelt MOP ($437/mt), Tampa DAP ($482/mt) , and NOLA urea ($361/mt)
3 Replacement cost nutrient prices assumed are: US Cornbelt MOP ($605/mt), Tampa DAP ($540/mt) , and NOLA Urea ($480/mt)
4 Free Cash Flow defined as: Cash flow from continuing operations before net changes in non-cash working capital less sustaining capital. Assumes 644.2M shares
Potential mid-cycle free cash flow per share provides tremendous near & long-
term opportunity for shareholders
Nutrien EBITDA & FCF Sensitivity to Nutrient Price IncreasesUS$ Billions
>$3
FCF/sh(4)
~$7.50
FCF/sh(4)
(3)
>$12
FCF/sh(4)
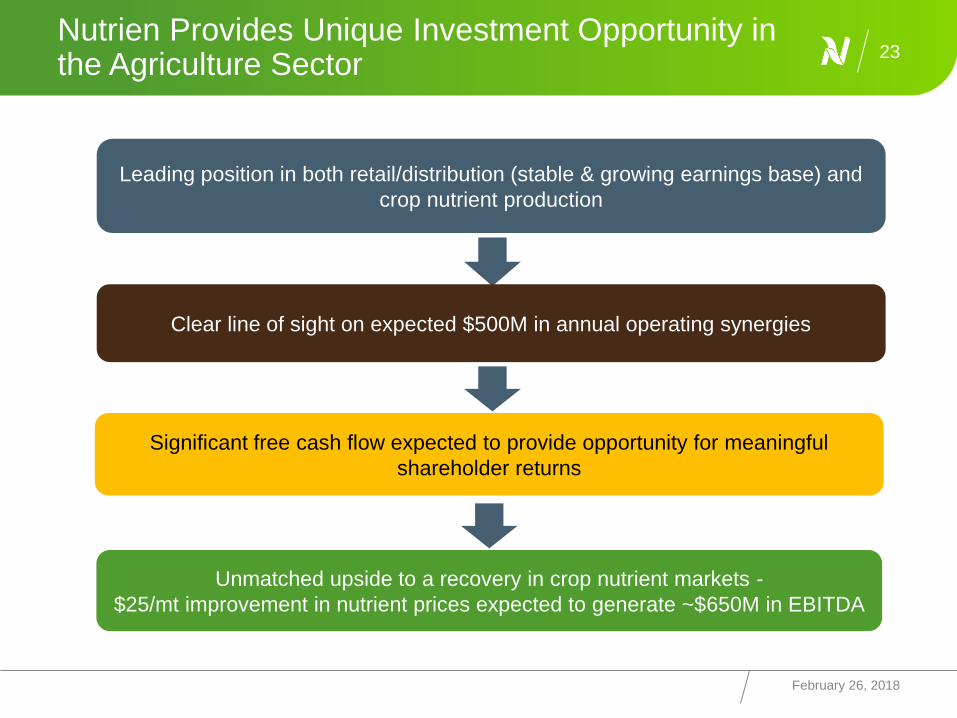
Nutrien Provides Unique Investment Opportunity in the Agriculture Sector
February 26, 2018
23
Leading position in both retail/distribution (stable & growing earnings base) and
crop nutrient production
Unmatched upside to a recovery in crop nutrient markets -
$25/mt improvement in nutrient prices expected to generate ~$650M in EBITDA
Clear line of sight on expected $500M in annual operating synergies
Significant free cash flow expected to provide opportunity for meaningful
shareholder returns

Thank you!
INVESTOR PRESENTATION February 26, 2018
For further information please visit Nutrien’s website at: www.nutrien.com
Follow Nutrien on:
twitter.com/nutrienltd
facebook.com/nutrienltd
linkedin.com/company/nutrien