investor presentation - international biotechnology trust...
TRANSCRIPT

Investor
PresentationThis document has been issued in the UK by SV Life Sciences
Managers LLP (authorised and regulated by the Financial Conduct
Authority), and may only be distributed to persons falling within the
definition of authorised persons, investment professionals or high net
worth bodies as defined in the Financial Services & Markets Act 2000.
2016

2
This document is issued for information purposes only by SV Life Sciences Managers LLP (‘SVLS’) who is authorised and regulated by the
Financial Conduct Authority (“FCA”). It does not constitute an offer by SVLS to enter into any contract/agreement nor is it a solicitation to buy,
sell, hold or subscribe for any investment. Nothing in this document should be deemed to constitute the provision of financial, investment or
other professional advice in any way. The contents of this document are based upon sources of information believed to be reliable, however,
save to the extent required by applicable law or regulations, no guarantee, warranty or representation (express of implied) is given as to its
accuracy or completeness and SVLS, its members, officers and employees of the managing member do not accept any liability or responsibility
in respect of the information or any views expressed herein. Holdings are subject to change and should not be construed as research or
investment advice. Similarly, any reference to a specific company does not constitute a recommendation to buy, sell, hold or subscribe in any
company or its securities.
Prospective investors should inform themselves as to any applicable legal requirements, taxation and exchange control regulations in the
countries of their citizenship, residence or domicile which might be relevant. Past performance is not indicative of future results, which may vary.
The value of investments and the income derived from investments can go down as well as up. Future returns are not guaranteed, and a loss of
principal may occur.
All views expressed in this document are current as of the date of this presentation and may be subject to change. No part of this material may,
without SVLS’s prior written consent, be (i) copied, photocopied or duplicated in any form, by any means, or (ii) distributed to any person that is
not an employee, officer, director, or authorised agent of the recipient.
Copyright © 2016, SV Life Sciences Managers LLP. All rights reserved.
Disclaimer

3
Agenda
Introduction and management team
Biotech sector
International Biotechnology Trust

4
Introduction
Award winning
closed end
fund
NAV GBP 217M
Biotechnology
Sector focused
Yield and capital
growth
Adding value through active
management
Managed by
specialist experts
Diversified
portfolio
Investment and
Wealth Management
Awards 2015
Cumulative Return Return Return Return
31 August 2016 1 YR 2YR 3YR
IBT Cum NAV (GBP) -1.7% 45.3% 83.7%
NASDAQ Biotechnology Index (GBP) -3.8% 29.0% 72.6%
Source: Bloomberg,
Note: Data to 31 August 2016

5
Management Team
, MSc
, BA Hons

6
SV Life Sciences
One of the world’s leading dedicated life sciences investors
Founded 1993
100% focused on life sciences
USD 2.4bn raised in seven venture funds
55 staff worldwide
External recognition, through winning the
Dementia Discovery Fund in a highly competitive
process
International Biotechnology Trust significant part of SV Life
Sciences (SVLS), based in a busy London office. SVLS has advised
or managed since 2001
Global reach
- Boston, San Francisco and London Offices
Over 170 live venture investments in
Healthcare, Biotechnology and Medical Devices
11PhD’s, 7MD’s, 13 MBA’s
- Oncology, Molecular biology, Neuroscience,
Neuropharmacology, Physiology, Biochemistry, Chemistry

7
Agenda
Introduction and management team
Biotech sector
International Biotechnology Trust

8
NASDAQ biotech index
has outperformed the
broader world equity market
Source: Bloomberg
12.5% y/y
NASDAQ Biotech
Index
Over last 20 years
6.6% y/y
Morgan Stanley
World Equity Index
Over last 20 years

9
The ageing population
is a powerful sector driver
The proportion of the WW population 65+ will
double to c.14% by 2040 from c.7% in 2008 Healthcare spending is increasing
Source: CMS, Robert Woods Johnson Foundation
%
Source: US Census Bureau
7%14%
93%86%
0
10
20
30
40
50
60
70
80
90
100
2008 2040
>65 years <65 years
0
20
40
60
80
100
120
140
160
180
0
500
1000
1500
2000
2500
3000
3500
4000
4500
200
0
200
1
200
2
200
3
200
4
200
5
200
6
200
7
200
8
200
9
201
0
201
1
201
2
201
3
201
4
201
5
201
6
201
7E
201
8E
201
9E
By 2020 nearly half of the US
population will be affected by
chronic diseases
US National Health Expenditure ($BN)
Number of people living with Chronic Conditions in the US (millions)
US
National H
ealth E
xpenditure
s (
$B
N)
Num
ber o
f people
livin
g w
ith C
hro
nic
Conditio
ns
in th
e U
S(M
)

10
FDA Product Approvals 2000-2015
Productivity is improving
Source: Food and Drug Administration (FDA)
0
5
10
15
20
25
30
35
40
45
50
Nu
mb
er
of d
rug
s
Source: Pharmaceutical Research and Manufacturers of America (PhRMA),
Pharmaprojects, Bank of America Merrill Lynch Global Research
Phase 2
Worldwide Active R&D Projects in
Development by Stage
Phase 3
*N.B. Most large pharmaceutical companies do not
disclose all their phase 1 programs due to “lack of
materiality”.2100
1800
1500
1200
900
600
300
20
02
20
04
20
06
20
08
20
10
20
12
20
14
20
16
Phase 1*

11
What is driving this
improvement?
Source: Pharmaprojects; HBM Healthcare Investments 2013 report
In-licensed products vs in
house
Increased use of
biologics
Better candidate selection
2007
2016+
Improved
regulatory
environment
*R&D spend is expected to remain flat at 20% of WW Rx sales
Scientific
advancements

12
Valuation
Biotech P/E and PEG
Source: Bloomberg / Institutional Brokers' Estimate System (IBES)
9 November 2016 MCap (GBP)M 2016-2019 EPS CAGR (%) 2016 P/E (x) 2017 P/E (x) 2018 P/E (x) 2019 P/E (x)
Alexion 22,963 27.4 27.3 22.1 17.1 13.2
Amgen 87,716 5.8 12.7 11.7 11.2 10.7
Biogen 56,042 7.1 15.8 15.3 14.1 12.9
Celgene 74,955 21.2 20.4 17.0 13.9 11.4
Gilead 83,251 -2.2 6.8 7.2 7.5 7.3
Regeneron 35,538 25.1 36.1 29.5 22.9 18.4
Vertex 18,552 96.4 121.1 41.7 22.2 16.0
Mean 51,145 25.8 34.3 20.6 15.5 12.9
S&P 500 12.8 18.2 15.9 14.2
LTM P/E to Growth Ratio of Profitable Biotech Companies (1/92-2/16)
Source: Stifel Note: July 2016 calculation; The 31/7/16 stock price divided by the LTM of EPS. Then divide that number by the compounded annual growth rate of …
(((2017 FactSet consensus EPS divided by 2014 EPS)^(1/3))-1)*100. That is used for each company and then average each companies’ PEG. AMGN (since 1992), BIIB (since 1999), CELG (since
2005), GILD (since 2004), ALXN (since 2011). BGEN (from 1993-2003), CHIR (from 1992-2005), DNA (from 1994-2009), GENZ (from 1992-2010), IMNX (from 2000-2001), MEDI (from 1999-2005),
ACOR (only 2012).
2/18/16PEG:1.27

13
Chart for US Large cap biotech vs S&P 500
Include: GILD AMGN CELG BIIB + GENZ DNA IMNX MEDI CHIR before acquisition Source: EvercoreISI
P/E
Valuation large cap
Biotech vs S&P500 P/E
Biotech P/E multiple less than S&P 500 for the first time in a decade
5.0x
10.0x
15.0x
20.0x
25.0x
30.0x
35.0x
18/1
1/2
016
19/1
2/2
014
18/0
1/2
013
18/0
2/2
011
20/0
3/2
009
20/0
4/2
007
US LC Biotech (Mean) S&P500

14
M&A a hallmark of
the biotech sector
0
50
100
150
200
250
300
350
400
450
500
2006 2007 2008 2009 2010 2011 2012 2013 2014 2015
Average 320
events/year
Announced M
&A
tra
nsactio
ns
Source: ‘Life Sciences Dealmaking 2015’ Thomson Reuters
Volume of announced life sciences industry-wide M&A events by year
Premiums for listed U.S and European Biopharma Companies
42%
49% 49%
61%
50%
43%
69%
53%
33%
55%
36%
0%
10%
20%
30%
40%
50%
60%
70%
80%
2005 2006 2007 2008 2009 2010 2011 2012 2013 2014A
vera
ge P
rem
ium
s P
aid
*
Source: HBM Pharma/Biotech M&A Report 2016*US Deals, no data for European
Over the past three years, 10 companies in International Biotechnology Trust’s portfolio have been acquired
• Pharmacyclics (AbbVie $21BN), Medivation (Pfizer $14BN), Synergeva (Alexion $8.4BN),
Intermune (Roche $8.3BN), Receptos (Celgene $7.2BN), Dyax (Shire $5.9BN), Questcor (Mallinkrodt $5.6BN),
Anacor (Pfizer $5.2BN), ZS Pharma (AstraZeneca $2.7BN), Chelsea Therapeutics (Lundbeck $658M)
2015

15
Drug pricing
Pricing pressure is here to stay
• Payer consolidation will continue to enhance insurance company negotiation power but this is not a new phenomenon.
Therapeutic drugs make up approx. 10% of healthcare costs
• Hospitals and Services are a huge burden on the system and need to be addressed first.
• New Republican party’s plan is to aim to reduce costs within the Medicare/Medicaid system through Paul Ryan’s ‘A Better Way’ published in June 2016.
• Innovative drugs aim to keep patients out of the hospital thereby reducing cost burden.
Society benefits from generic drugs once the patent has expired
• True innovation with significant clinical benefit should be relatively immune to pricing pressure.
• Intellectual property rights are highly unlikely to be removed or reduced materially as it is ’unconstitutional’.
Estimated Distribution of U.S. Federal Spending on Healthcare 2015-2024
U.S.A
UK U.S.A.
16.9%
% of GDP Spent on Healthcare
in UK and US
Source: Avalere Health, Piper Jaffray, Organisation for Economic Co-operation and Development
9.8%

16
Agenda
Introduction and management team
Biotech sector
International Biotechnology Trust

17
Performance and Awards
International Biotechnology Trust (IBT) has outperformed vs our benchmark in rising and falling markets
Source: Bloomberg *to 28 August 2015, as market closed on 31 August 2015
*
Cumulative Return to 31 August 2016 1m (%) 3m (%) 6m (%) 12m (%) 2yr (%) 3yr (%)
IBT Share Price (GBP) -6.1 10.6 17.1 -9.8* 58.2 84.9
IBT Cum NAV per share (GBP) -2.7 10.7 19.4 -1.7* 45.3 83.7
NASDAQ Biotechnology Index (GBP) -2.3 11.1 17.2 -3.8 29.0 72.6
S&P 500 (GBP) 0.8 15.0 20.3 31.4 42.7 66.8
FTSE All-Share (GBP) 1.9 9.0 13.2 11.8* 9.1 20.4
FTSE 100 (GBP) 1.7 10.1 14.1 13.0* 7.3 18.2
-20 0 20 40 60 80 100
6m
1yr*
2yr
3yr
NBI IBT NAV
2015 Best Tech Fund Manager
Best Specialist Fund
Most Significant Contribution
Kate Bingham
Investment and
Wealth Management
Awards 2015

18
Profitable 58%
Turning profitable 4%
Unprofitable 38%
Source: SV Life Sciences Managers
Geography
Portfolio breakdown
Profitability Status
US 78%
Europe 22%
Large cap >USD 10BN 55%
Mid cap USD 1-10BN 25%
Small cap <USD 1BN 10%
Unquoted 10%
Market cap
31 August 2016, NAV GBP 217M
Therapeutic areas
Oncology 34%
Rare Disease 22%
CNS 10%
Inflammation 9%
Ophthalmology 8%
Medtech 1%
Other 16%

19
Investment process
Investment
ProcessSell Discipline
Risk Mitigation News Flow
Management
Medical
Conferences
DCF Valuation M&A
Macro trends
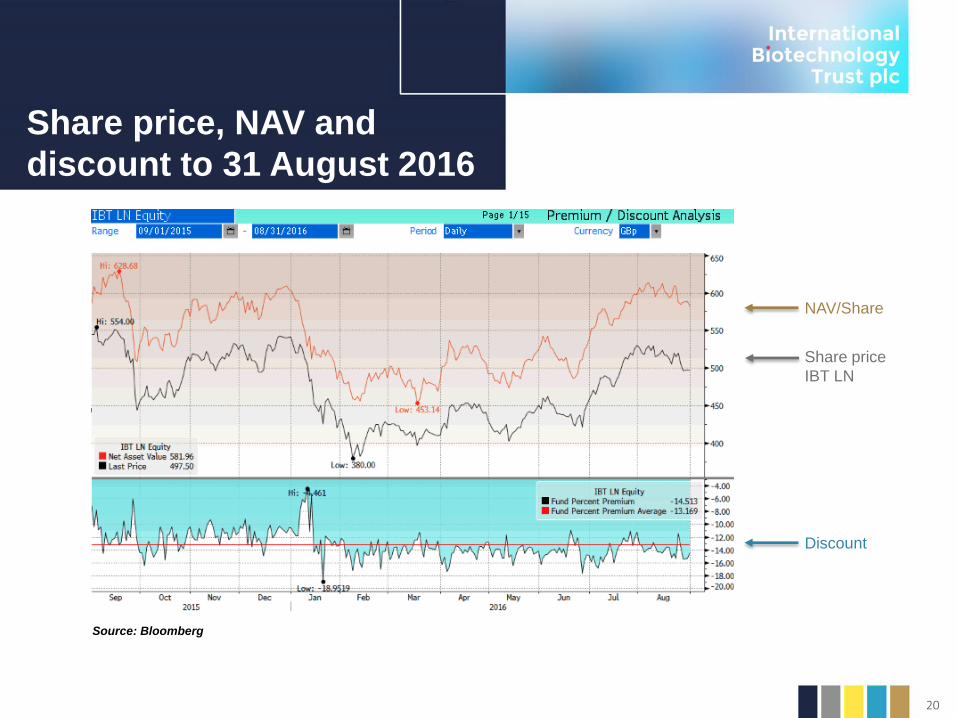
20
Share price, NAV and
discount to 31 August 2016
Source: Bloomberg
NAV/Share
Share price
IBT LN
Discount

21
Top ten holdings
at 31 August 2016
Company
name% NAV
Market Cap
GBP (BN) Rationale
Therapeutic
Area
Biogen 7.7 51.0 Defensive Growth Inflammation
Celgene 7.0 63.0 Earnings Growth Oncology
Regeneron 6.3 31.0 Earnings Growth Ophthalmology
Incyte 5.2 12.0 Earnings Growth / M&A Oncology
Alexion 4.7 21.0 Earnings Growth Rare Disease
Actelion 4.6 14.0 Strong new launch Respiratory
Amgen 3.8 97.0 Defensive Growth Oncology
Vertex 3.6 18.0 Earnings Growth / M&A Rare Disease
Biomarin 3.3 12.0 Earnings Growth / M&A Rare Disease
Exelixis 3.1 2.7 Strong new launch / M&A Oncology
Total 49.3

22
Recent Developments
• Offering investors both capital growth and yield
– International Biotechnology Trust has responded to the current low yield environment by offering a
dividend
– A sustainable and predictable yield of 4% of NAV per annum
– Met out of capital reserves, allowing International Biotechnology Trust to continue to seek high
growth investments
• Investing in unquoted funds
– Competition for access to investments in unquoted biotechnology has risen
– To ensure access to the best opportunities, International Biotechnology Trust can now invest
through unquoted funds
– This will also mean greater liquidity in unquoted portfolio
All changes were approved at General Meeting on 29 September 2016
International Biotechnology Trust responds innovatively to market conditions
23
Summary
Biotech sector has strong fundamentals but is currently undervalued
Top performing trust in sector, outperforming in rising and falling markets
Access to full spectrum of quoted and unquoted biotech companies
Unusual combination of growth and yield