investor presentation dezember 2016 - bmw group · 2020-05-13 · strategy number one next. bmw...
TRANSCRIPT

December 2016
BMW GROUPINVESTOR PRESENTATION

CORPORATE
CULTURE
STRATEGIC
APPROACH
COMPETITIVE
ADVANTAGE
VISION
BMW Group Investor Presentation, December 2016 Page 2
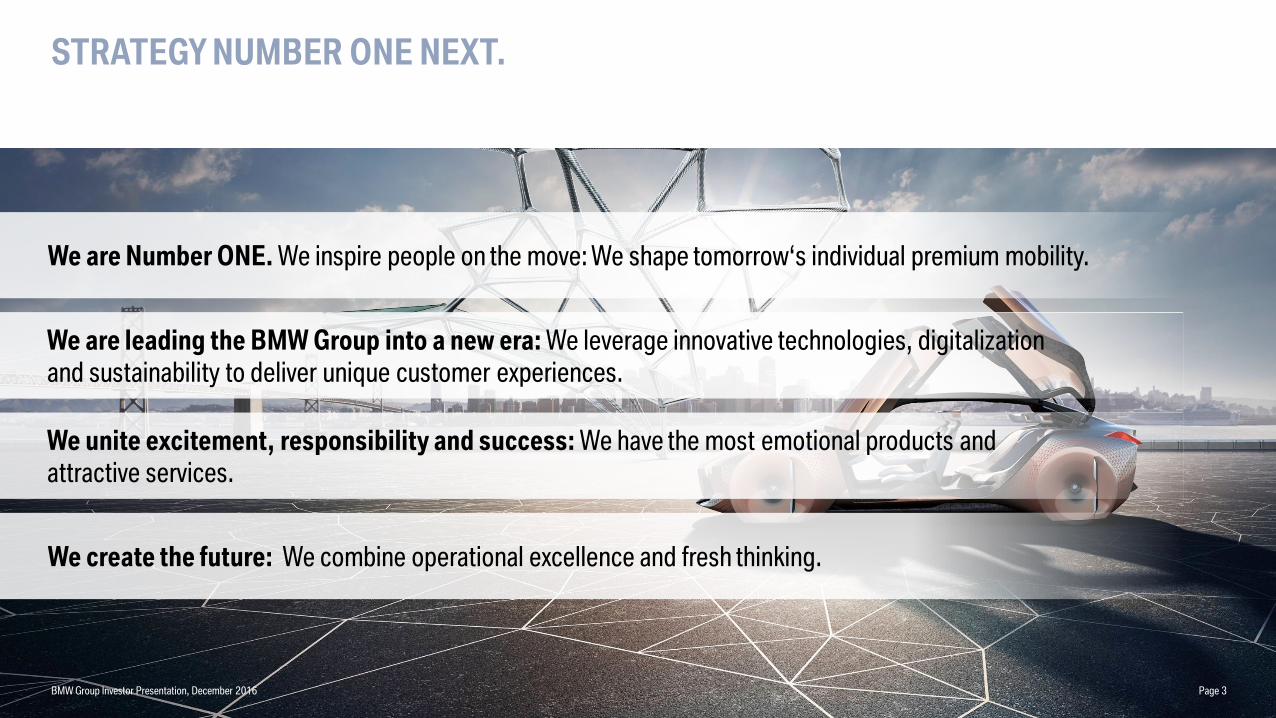
STRATEGY NUMBER ONE NEXT.
BMW Group Investor Presentation, December 2016 Page 3
We create the future: We combine operational excellence and fresh thinking.
We unite excitement, responsibility and success: We have the most emotional products and
attractive services.
We are leading the BMW Group into a new era: We leverage innovative technologies, digitalization
and sustainability to deliver unique customer experiences.
We are Number ONE. We inspire people on the move: We shape tomorrow‘s individual premium mobility.

MOBILITY OF THE FUTURE: HIGHLY AUTOMATED, ZERO-EMISSION VEHICLES COMBINED WITH INNOVATIVE MOBILITY SERVICES.
BMW Group Investor Presentation, December 2016 Page 4
E-MOBILITY AUTONOMOUS DRIVING MOBILITY SERVICES

BMW GROUP’S ELECTRIFICATION PATHWAY.
BMW Group Investor Presentation, December 2016 Page 5
PIONEERING
ELECTRIFICATION OF
CORE PORTFOLIO
SCALABILITY
AND FLEXIBILITY
Building-up expertise
Technology innovation
Project i
Roll-out i Performance
Upgrade BMW i3
MINI BEV
BMW X3 BEV
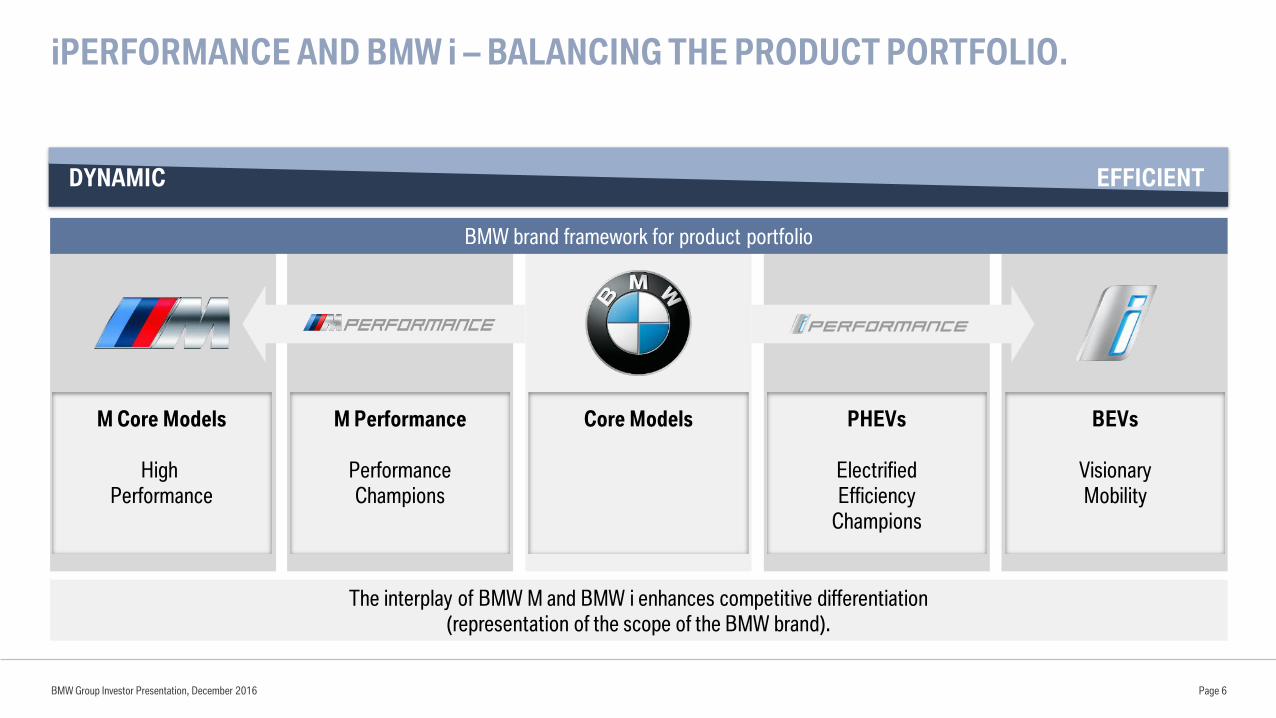
iPERFORMANCE AND BMW i – BALANCING THE PRODUCT PORTFOLIO.
BMW Group Investor Presentation, December 2016
DYNAMIC EFFICIENT
M Core Models
High
Performance
M Performance
Performance
Champions
Core Models PHEVs
Electrified
Efficiency
Champions
BEVs
Visionary
Mobility
The interplay of BMW M and BMW i enhances competitive differentiation
(representation of the scope of the BMW brand).
BMW brand framework for product portfolio
Page 6

OVER 100,000 ELECTRIFIED BMW VEHICLES SOLD YTD 2016.
BMW Group Investor Presentation, December 2016 Page 7
i3 60 Ahi8
X5 xDrive40e
iPerformance530Le*
330e
iPerformance
225e
iPerformance
740e / 740 Le iPerformance
i3 94 Ah
* Only available in ChinaFigures are for cumulative sales of BEV and PHEV vehicles
0
20.000
40.000
60.000
80.000
100.000
120.000
Nov 13 Dez 13 Jan 14 Feb 14 Mrz 14 Apr 14 Mai 14 Jun 14 Jul 14 Aug 14 Sep 14 Okt 14 Nov 14 Dez 14 Jan 15 Feb 15 Mrz 15 Apr 15 Mai 15 Jun 15 Jul 15 Aug 15 Sep 15 Okt 15 Nov 15 Dez 15 Jan 16 Feb 16 Mrz 16 Apr 16 Mai 16 Jun 16 Jul 16 Aug 16 Sep 16 Okt 16 Nov 16

SIGNIFICANT NUMBER OF ELECTRIFIED MODELS ARE ALREADY ON THE STREET.
BMW Group Investor Presentation, December 2016 Page 8
BATTERY
ELECTRIC
VEHICLES
PLUG-IN
HYBRIDS
BMW 225xeiPerformanceBMW i8 BMW 530Le*
BMW 740eiPerformance
BMW X1 xDrive25LeiPerformance*
BMW X5 xDrive40eiPerformance
BMW i3 60 Ah BMW i3 94 Ah
* Only available in China
BMW 5 SeriesiPerformance
BMW X3BEV
MINI BEV
MINI Cooper S E Countryman ALL4
BMWiNEXT
BMW i8 Roadster
2013 2014 2015 2016 2017 2018 2019 2020 2021
BMW 330eiPerformance
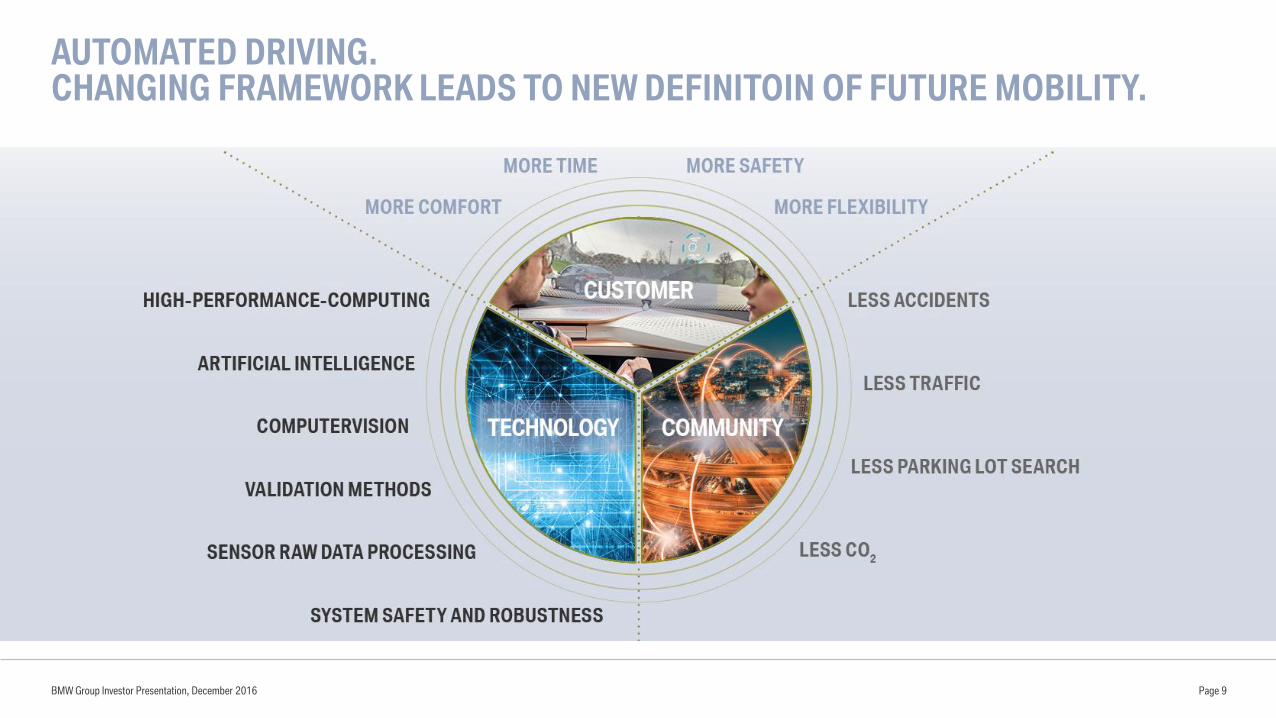
AUTOMATED DRIVING.CHANGING FRAMEWORK LEADS TO NEW DEFINITOIN OF FUTURE MOBILITY.
BMW Group Investor Presentation, December 2016 Page 9

THE NEXT STEPS ARE HIGHLY AND FULLY AUTONOMOUS DRIVING.
BMW Group Investor Presentation, December 2016
Take over request(“Eyes-off”)
3 – High-Automation 4 – Full-Automation
General awareness
No take over request(“Mind-off”)
5 – Autonomous
No driver
0 – Driver Only
No active
assistance system
1 – Assistance
Early
warning systems
such as cruise
control/ speed
assistant
(“Feet-off”)
2 – Semi-Automation
Traffic control
(e.g. congestion
assistant)
(“Hands-off”)
Awareness for
take over
Human MachineTransition of responsibility
TODAY
Page 10

MASTERING THE BASIC TECHNOLOGIES IS THE FIRST STEP FOR HIGHLY AUTOMATED DRIVING.
Intelligent
autonomous vehicle
Regulatory
requirements
Sensor systems Artificial Intelligence
Digital maps / HERE Digital reality model
BMW Group Investor Presentation, December 2016 Page 11
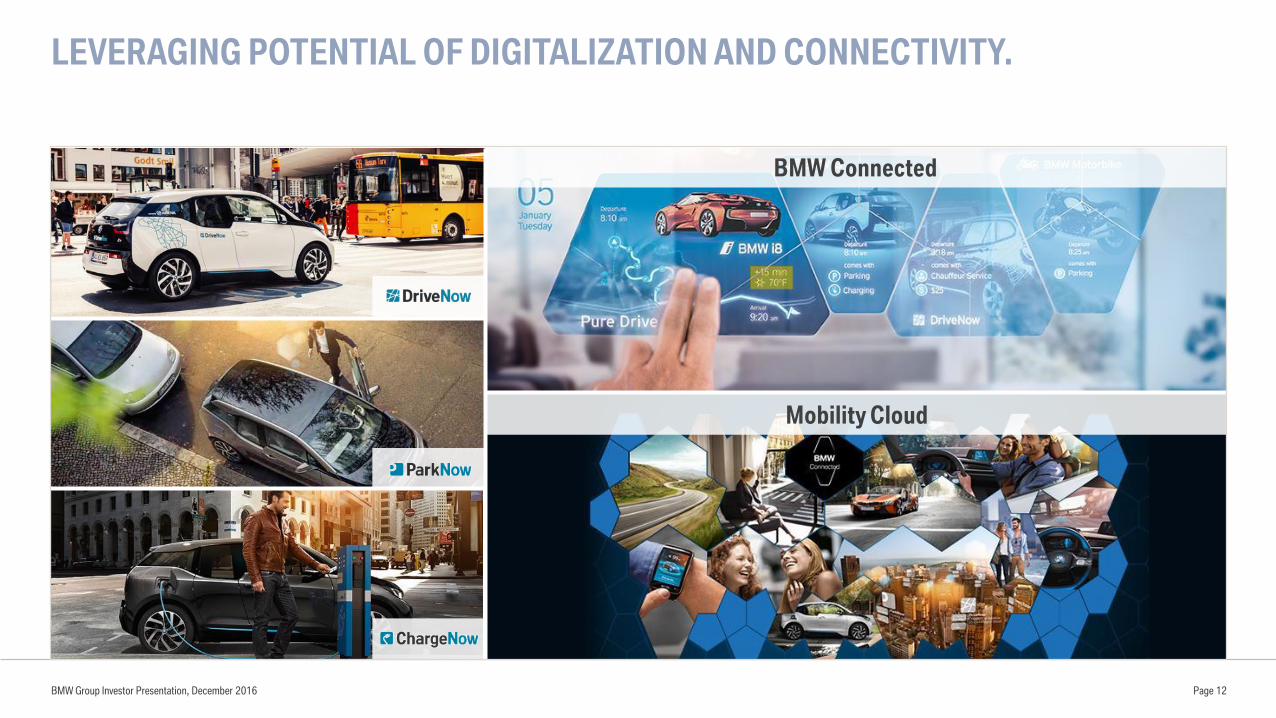
LEVERAGING POTENTIAL OF DIGITALIZATION AND CONNECTIVITY.
BMW Connected
Mobility Cloud
BMW Group Investor Presentation, December 2016 Page 12

BMW Group Investor Presentation, December 2016 Page 13
DRIVE NOW. PREMIUM, FREE FLOATING CAR SHARING SERVICE FROM BMW GROUP.
750,000 customers
in 11 cities
DriveNow Customers are BMW Group´s
youngest & most modern target group 5,000+ cars
in the fleets

CAR SHARING EXPERIENCE ON A NEW LEVEL. REACH NOW TO INTRODUCE UNIQUE FEATURES TO THE CUSTOMERS.
370 cars
Additional services available: Vehicle Delivery Service
Long period use of vehicles
Carsharing for closed user groups
Chauffeur Service – Car with driver
Renting out your own car via ReachNow
Launched in April
2016 in SeattleMore cities to come soon
BMW Group Investor Presentation, December 2016 Page 14
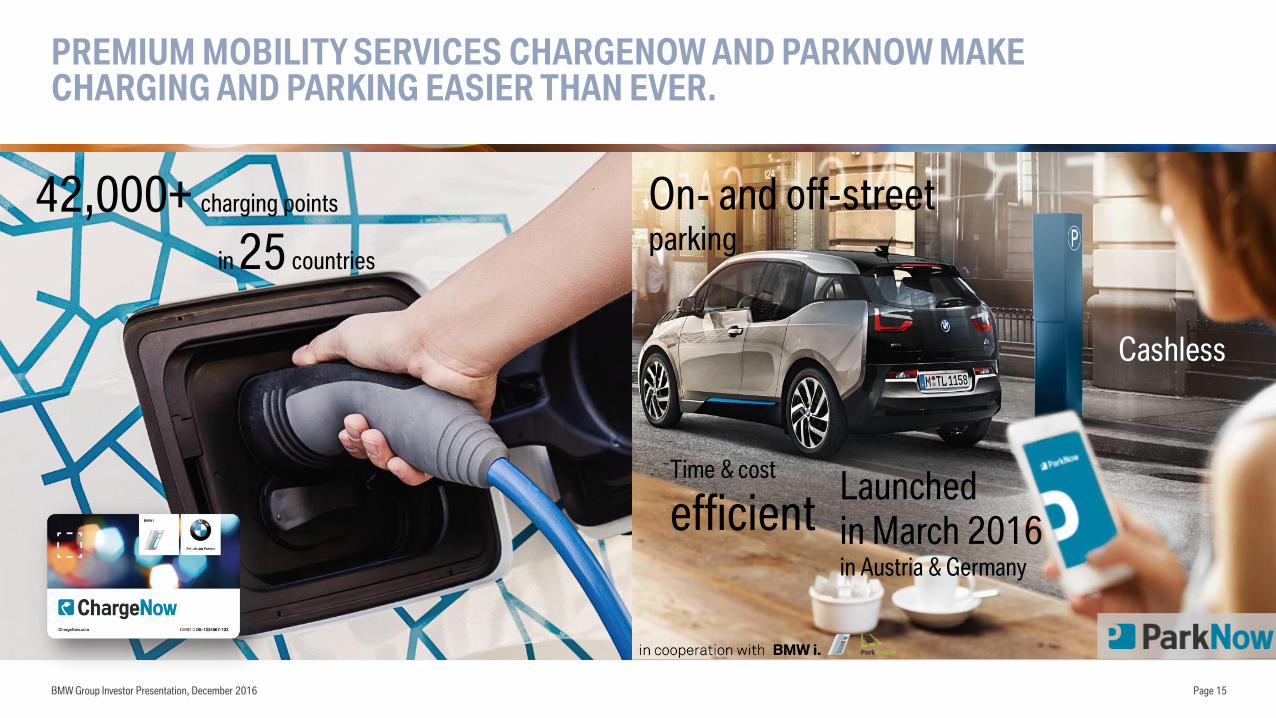
PREMIUM MOBILITY SERVICES CHARGENOW AND PARKNOW MAKE CHARGING AND PARKING EASIER THAN EVER.
BMW Group Investor Presentation, December 2016 Page 15
42,000+ charging points
in 25 countries
Time & cost
efficient
On- and off-street parking
Launched
in March 2016 in Austria & Germany
Cashless

FINANCIAL TARGETS 2020. SUSTAINABLE GROWTH AND SOLID PROFITABILITY DESPITE CHALLENGES.
BMW Group Investor Presentation, December 2016
BMW Group
EBT margin (from 2017)
Investment ratio*
Research and development ratio
Payout ratio
Automotive Segment
EBIT margin
Free Cashflow
Motorcycles Segment
Sales volume
EBIT margin (from 2017)
Financial Services Segment
Return on Equity
* Investments in property, plant and equipment and other intangible assets (without capitalized development costs).
Page 16
2015
10.0%
4.2%
5.6%
32.9%
9.2%
5.4 bn €
136,963 units
9.1%
20.2%
2020
>10%
<5.0%
5.0 - 5.5%
30 - 40%
8 -10%
>3 bn €
> 200,000 units
8 -10%
>18%
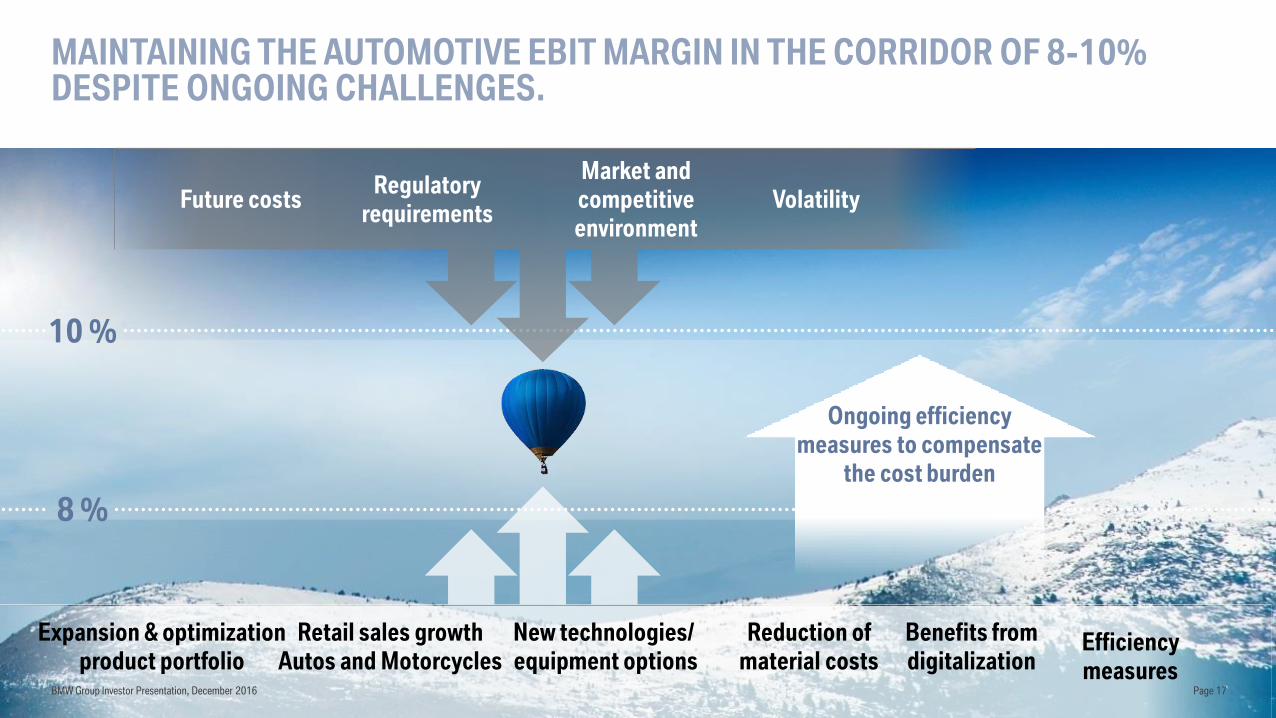
MAINTAINING THE AUTOMOTIVE EBIT MARGIN IN THE CORRIDOR OF 8-10% DESPITE ONGOING CHALLENGES.
8 %
10 %
Ongoing efficiency
measures to compensate
the cost burden
Future costs Volatility
Market and
competitive
environment
Regulatory
requirements
Expansion & optimization
product portfolio
Reduction of
material costs
New technologies/
equipment options
Retail sales growth
Autos and Motorcycles
Benefits from
digitalizationEfficiency
measuresBMW Group Investor Presentation, December 2016 Page 17
0
1.000
2.000
3.000
4.000
5.000
6.000
7.000
8.000
9.000
10.000
2015 2016 2017 2018 2019 2020
*BRIKT refers to Brazil, Russia, India, South Korea and Turkey Source: Global Insight 04/2016
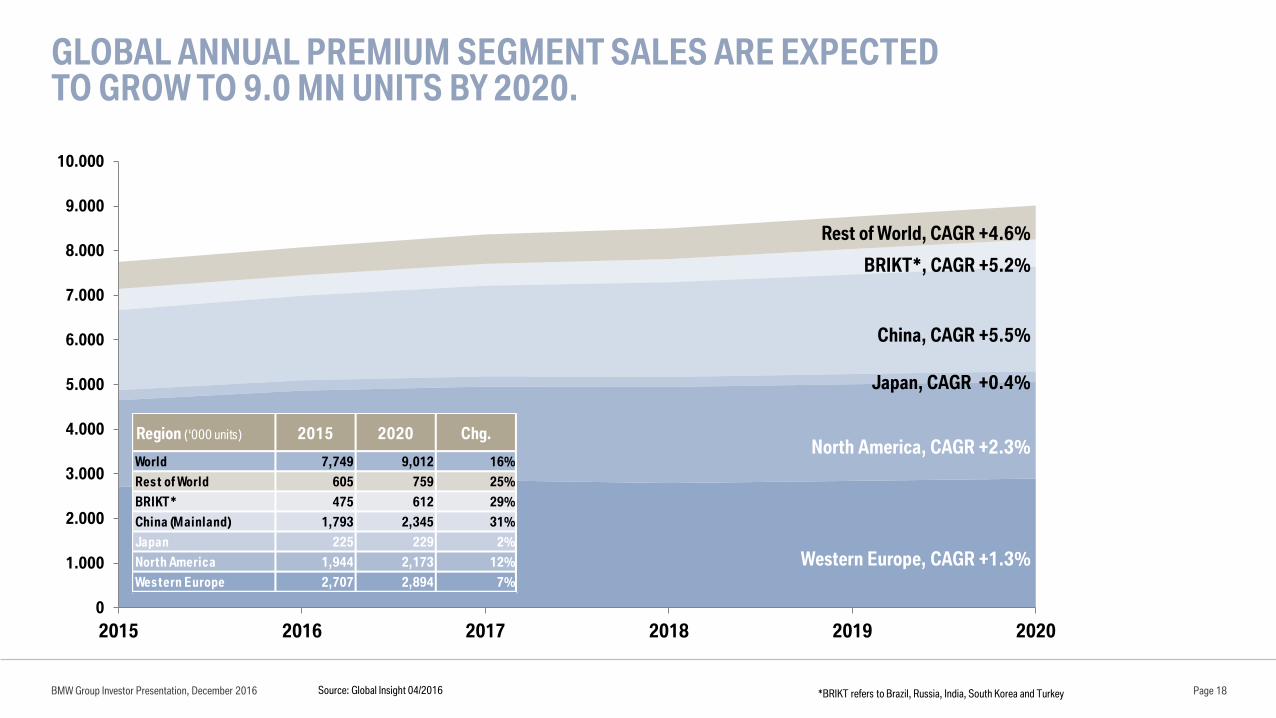
GLOBAL ANNUAL PREMIUM SEGMENT SALES ARE EXPECTED TO GROW TO 9.0 MN UNITS BY 2020.
BMW Group Investor Presentation, December 2016 Page 18
China, CAGR +5.5%
Japan, CAGR +0.4%
North America, CAGR +2.3%
Western Europe, CAGR +1.3%
Rest of World, CAGR +4.6%
BRIKT*, CAGR +5.2%
Region (‘000 units) 2015 2020 Chg.
World 7,749 9,012 16%
Res t of World 605 759 25%
BRIKT* 475 612 29%
China (Mainland) 1,793 2,345 31%
Japan 225 229 2%
North America 1,944 2,173 12%
Wes tern Europe 2,707 2,894 7%
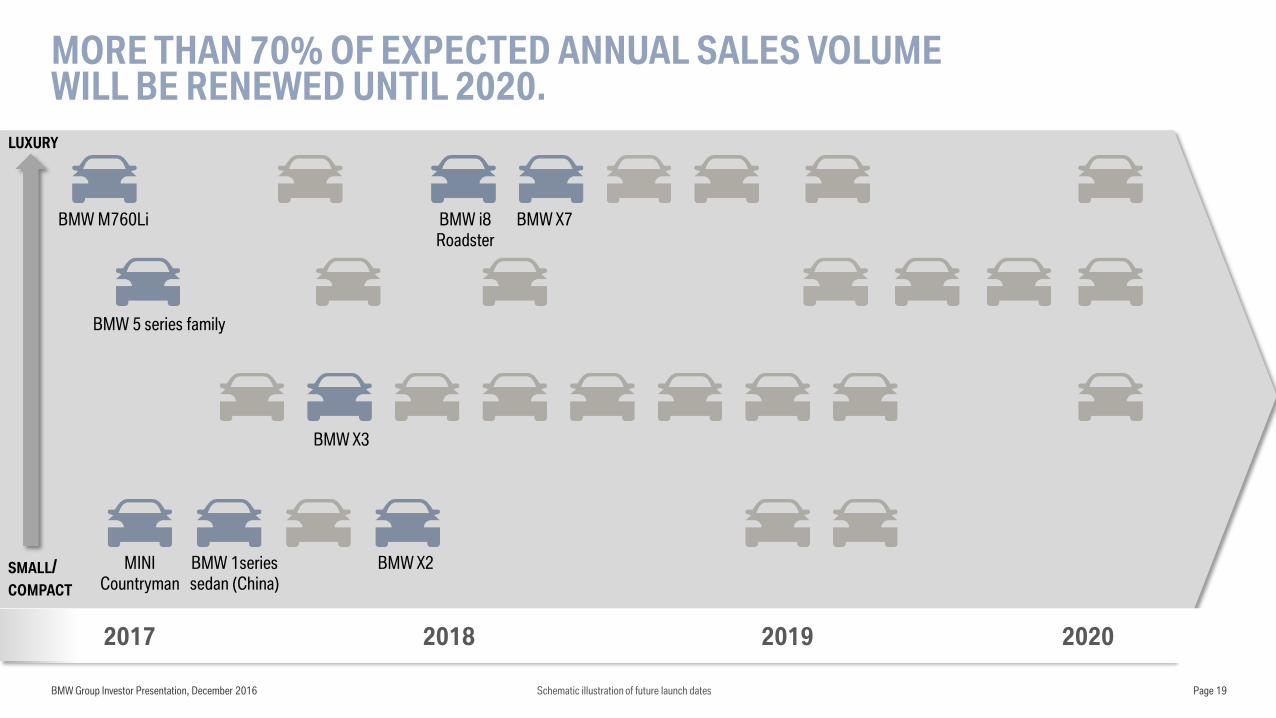
MORE THAN 70% OF EXPECTED ANNUAL SALES VOLUME WILL BE RENEWED UNTIL 2020.
BMW Group Investor Presentation, December 2016 Page 19
BMW 5 series family
MINI
Countryman
BMW X3
BMW M760Li
BMW X2BMW 1series
sedan (China)
BMW X7BMW i8
Roadster
LUXURY
SMALL/
COMPACT
2017 2018 2019 2020
Schematic illustration of future launch dates
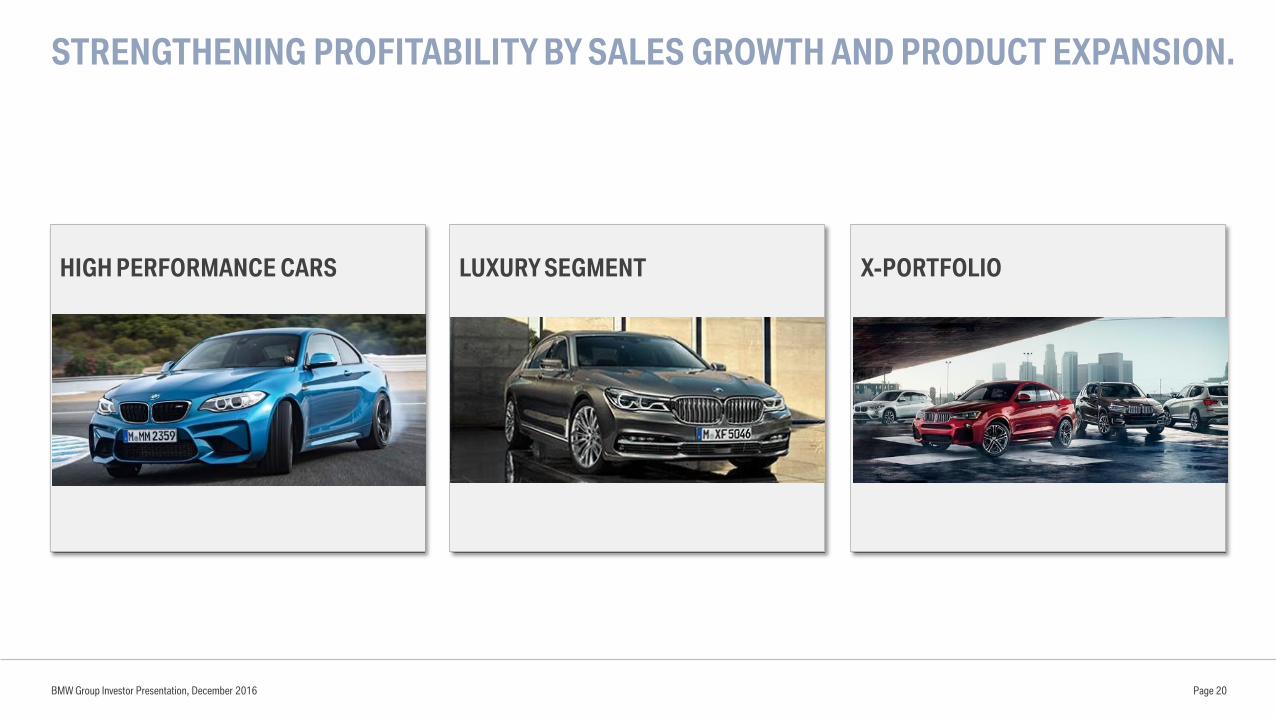
STRENGTHENING PROFITABILITY BY SALES GROWTH AND PRODUCT EXPANSION.
BMW Group Investor Presentation, December 2016 Page 20
HIGH PERFORMANCE CARS LUXURY SEGMENT X-PORTFOLIO
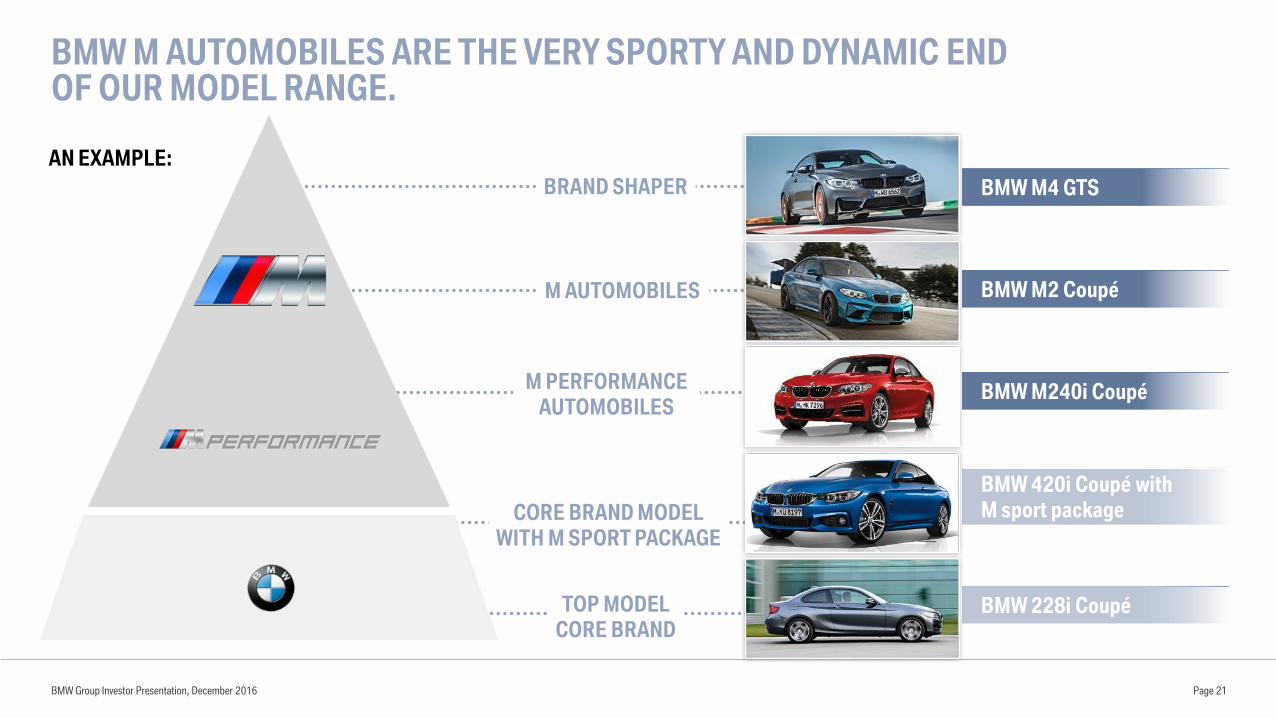
BMW M AUTOMOBILES ARE THE VERY SPORTY AND DYNAMIC END OF OUR MODEL RANGE.
BMW Group Investor Presentation, December 2016
BRAND SHAPER BMW M4 GTS
BMW M240i Coupé
BMW M2 Coupé
BMW 228i Coupé
AN EXAMPLE:
M AUTOMOBILES
M PERFORMANCE
AUTOMOBILES
TOP MODEL
CORE BRAND
Page 21
CORE BRAND MODEL
WITH M SPORT PACKAGE
BMW 420i Coupé with
M sport package

BMW Group Investor Presentation, December 2016
SIXTH GENERATION OF BMW 7 SERIES.THE NEW BENCHMARK IN THE LUXURY SEGMENT.
Page 22

BMW Group Investor Presentation, December 2016 Page 23
KEEPING THE LEAD.FURTHER EXPANSION OF THE X-PORTFOLIO PLANNED UNTIL 2020.
BMW X1
BMW X5
BMW X3
BMW X6
BMW X4
BMW X7
BMW X2*
*Concept Car

INTELLIGENT AND INNOVATIVE PRODUCTION.DIGITALIZATION CREATES NEW OPPORTUNITIES.
BMW Group Investor Presentation, December 2016
Laminate or Metal
Serial Production
and Rapid Prototyping
New Individualization
Internet-of-Things
Architecture
Data Management for Planning
and Control
Cyber Security
Autonomous Transport Systems
Global Supply Chain
Visibility and Control
Integrated Supplier Networks
Collaborative Robot Systems
Context-sensitive Worker
Support Systems
Reorganization of Work
46
810
1214
1618
0
2
4
6
8
10
12
14
16
125
130
135
1404
68
1012
1416
18
0
2
4
6
8
10
12
14
16
125
130
135
140
Data and Analytics Smart Logistics Innovative Automation Additive Manufacturing
Page 24

BMW GROUP SALES CONTINUE TO GROW THROUGH NOVEMBER 2016.
2,152,393 + 5.8%
1,824,490 + 5.6%
324,417 + 7.4%
3,486 + 5.5%
136,393 +5.4%
BMW Group Investor Presentation, December 2016 Page 25

Americas
412,873 units
Europe
992,580 units
+10.0%
Mainland China
472,705 units
Asia (w/o China)
& Rest of World
274,235 units
-7.7%
19% 46%
+11.2%
22% 13%
+5.9%
BMW GROUP AUTOMOTIVE: BALANCED SALES DISTRIBUTION AND SOLID GROWTH OF +5.8% YTD NOVEMBER 2016.
BMW Group Investor Presentation, December 2016 Rolls Royce is included in “Rest of World”, YTD October 2016 (figures may not add to 100% due to rounding) Page 26

BMW GROUP AUTOMOTIVE MAJOR MARKETS. DELIVERIES TO CUSTOMERS YTD NOVEMBER 2016.
BMW Group Investor Presentation, December 2016 Page 27
Deliveries of automobiles YTD 2016 YTD 2015 Change in %
Europe 992,580 902,223 10.0
thereof Germany 1) 281,508 264,569 6.4
Great Britain 228,698 207,079 10.4
France 76,288 70,051 8.9
Italy 76,306 64,925 17.5
Americas 412,873 447,445 -7.7
thereof USA 327,711 364,903 -10.2
Asia 680,540 621,671 9.5
thereof China Mainland 472,705 425,266 11.2
thereof BBA retail sales 290,031 258,936 12.0
Japan 67,096 61,005 10.0
Rest of the World (incl. RR) 2) 66,400 62,609 6.1
Total 2,152,393 2,033,948 5.8
1) Registrations 2) Rolls-Royce sales are included in “Rest of the World”
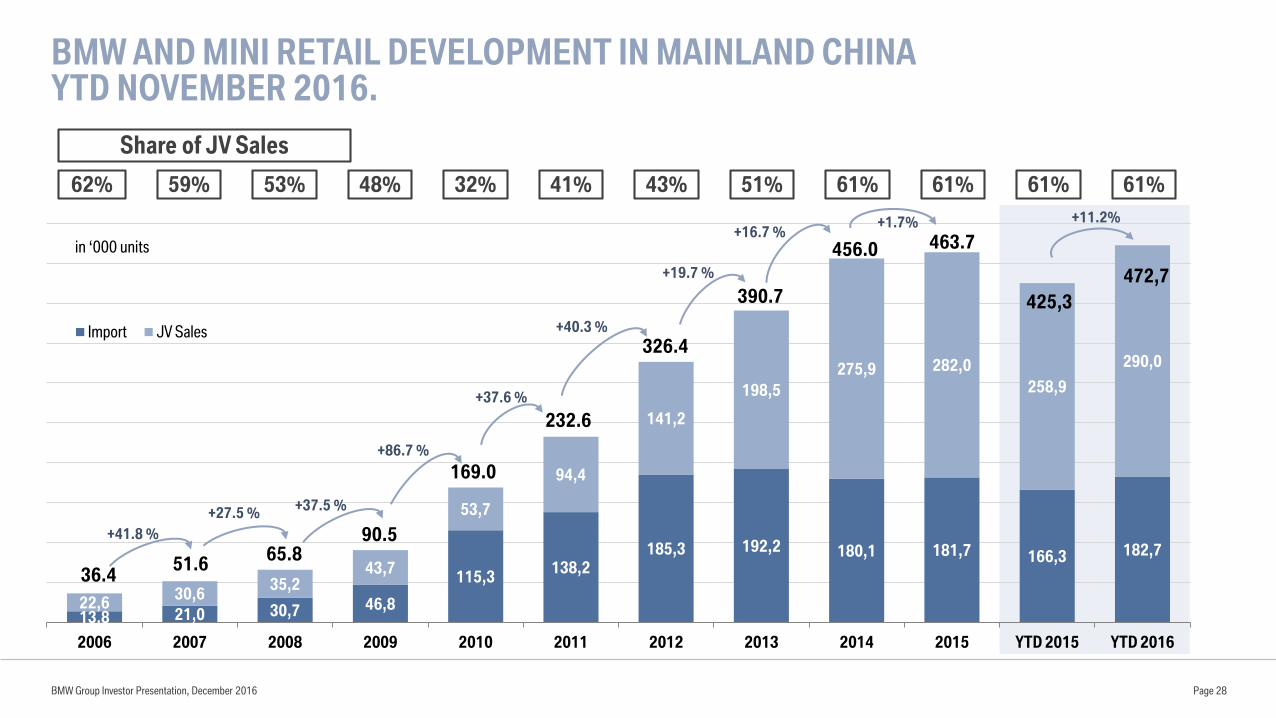
BMW AND MINI RETAIL DEVELOPMENT IN MAINLAND CHINAYTD NOVEMBER 2016.
BMW Group Investor Presentation, December 2016 Page 28
62% 59% 53% 48% 32% 61%41% 43%
Share of JV Sales
51% 61%
13,8 21,0 30,7 46,8
115,3138,2
185,3 192,2 180,1 181,7 166,3 182,7
22,630,6
35,243,7
53,7
94,4
141,2
198,5
275,9 282,0
258,9
290,0
2006 2007 2008 2009 2010 2011 2012 2013 2014 2015 YTD 2015 YTD 2016
Import JV Sales
36.451.6
65.890.5
169.0
232.6
326.4
in ‘000 units
390.7
456.0 463.7
+41.8 %
+27.5 %+37.5 %
+86.7 %
+37.6 %
+40.3 %
+19.7 %
+16.7 %+1.7%
472,7
61% 61%
425,3
+11.2%
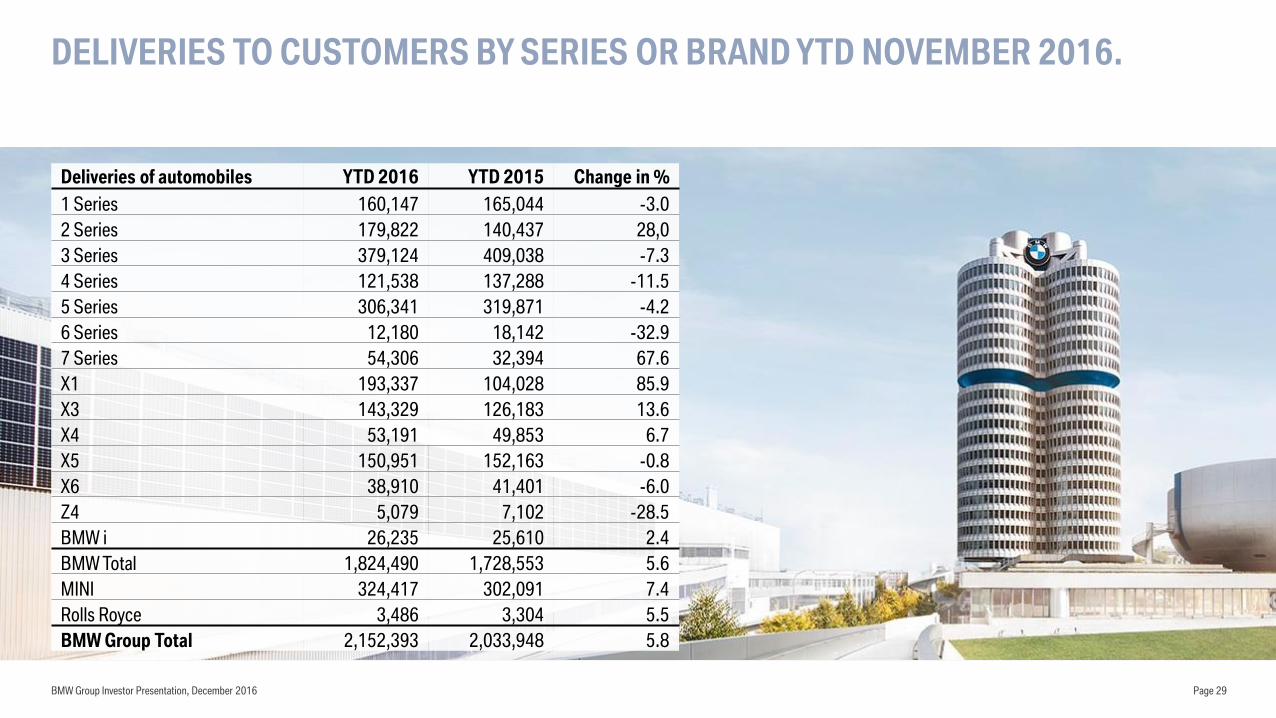
DELIVERIES TO CUSTOMERS BY SERIES OR BRAND YTD NOVEMBER 2016.
BMW Group Investor Presentation, December 2016 Page 29
Deliveries of automobiles YTD 2016 YTD 2015 Change in %
1 Series 160,147 165,044 -3.0
2 Series 179,822 140,437 28,0
3 Series 379,124 409,038 -7.3
4 Series 121,538 137,288 -11.5
5 Series 306,341 319,871 -4.2
6 Series 12,180 18,142 -32.9
7 Series 54,306 32,394 67.6
X1 193,337 104,028 85.9
X3 143,329 126,183 13.6
X4 53,191 49,853 6.7
X5 150,951 152,163 -0.8
X6 38,910 41,401 -6.0
Z4 5,079 7,102 -28.5
BMW i 26,235 25,610 2.4
BMW Total 1,824,490 1,728,553 5.6
MINI 324,417 302,091 7.4
Rolls Royce 3,486 3,304 5.5
BMW Group Total 2,152,393 2,033,948 5.8

BMW MOTORRAD.WIDER RANGE THAN EVER BEFORE.
BMW Group Investor Presentation, December 2016
ADVENTURE TOUR SPORT ROADSTER HERITAGE
URBAN
MOBILITY
Page 30
NEW SINCE 2014 NEW SINCE 2012

BMW GROUP FINANCIAL SERVICES AT A GLANCE.
Business Lines af of 09/2016Global Presence as of 09/2016
Global Operations in 57 Countries
€83.4 bn
Retail Finance
€17.0 bn
Dealer Finance
3.4 mn contracts
Insurance
€ 7.9 bn
Multi Make Financing
€ 9.6 bn
Banking
€ 11.3 bn
Fleet Business
BMW Group Investor Presentation, December 2016 Page 31
~ 4.6 Million Serviced Retail Contracts
EU Bank
EMEA
Americas
Asia, Pacific
28%
25%17%
30%

SF
19%
SIGNIFICANT CONTRIBUTION OF FINANCIAL SERVICES TO BMW GROUP PROFIT.
BMW Group Investor Presentation, December 2016 Page 32
122
439124
685743
-292
365
1.214
1.790
1.5611.619
1.723
1.975
1.517
1.641
2006 2007 2008 2009 2010 2011 2012 2013 2014 2015 9M-2015 9M-2016
1) FY-08 EBT includes a negative effect of EUR 1,057 million from additional credit and residual value risk provisions.2) FY-10 EBT includes a positive effect of EUR 122 million from better than expected off-lease business.3) FY-11 EBT includes a positive effect of EUR 439 million from adjustment of residual value and credit risk provisions and a better than expected off-lease business.
4) FY-12 EBT includes a positive effect of EUR 124 million from better than expected off-lease business.
2)
3)
4)
1)
Profit before Tax (PBT) Financial Services
[in mn €]

BMW GROUP FINANCIAL SERVICES. SOLID DEVELOPMENT OF CREDIT LOSS RATIO.
BMW Group Investor Presentation, December 2016
Credit loss ratio*
[in %]
Page 33* Definition Credit Loss Ratio : credit losses in relation to the average serviced portfolio. Credit losses: all write offs, meaning the lost receivable including accumulated interest and other costs less utilized collateral. Income related to the recovery process after write off is also taken into consideration.
0,41
0,46
0,59
0,84
0,67
0,49 0,480,46
0,50
0,370,35
0,30
2006 2007 2008 2009 2010 2011 2012 2013 2014 2015 9M-2015 9M-2016

THE BMW GROUP CONTINUED TO CHART A COURSE OF PROFITABLE GROWTH IN THE THIRD QUARTER 2016.
BMW Group Investor Presentation, December 2016 Page 34
BMW Group Q3-2016 Q3-2015 Change in %
Earnings before tax – Group (in m€) 2,575 2,263 +13.8
EBT margin (in %) – Group 11.0 10.1 +0.9 pp
Automotive Segment
Automotive sales (units) 583,499 545,062 +7.1
Earnings before interest and tax (EBIT) (in m€) 1,837 1,912 -3.9
EBIT margin (in %) 8.5 9.1 -0.6 pp
Net financial assets (m€) 16,715 14,772 +13.2
Motorcycles Segment
Sales (units) 35,290 33,993 +3.8
Earnings before interest and tax (EBIT) (in m€) 32 46 -30.4
EBIT margin (in %) 7.1 10.1 -3.0 pp
Financial Services
Earnings before tax (EBT) (in m€) 568 462 +22.9
Penetration rate (in %)* 49.0 46.1 +2.9 pp
Credit loss ratio (in %)* 0.30 0.35 -0.05 pp
*As of 30 September 2015/2016

BMW GROUP POSTS BEST-EVER FIGURES FOR THE FIRST NINE MONTHS OF 2016.
BMW Group Investor Presentation, December 2016 Page 35
BMW Group 9M-2016 9M-2015 Change in %
Earnings before tax – Group (in m€) 7,741 7,114 +8.8
EBT margin (in %) – Group 11.2 10.6 +0.6 pp
Automotive Segment
Automotive sales (units) 1,746,638 1,644,810 +6.2
Earnings before interest and tax (EBIT) (in m€) 5,778 5,525 +4.6
EBIT margin (in %) 9.1 9.0 +0.1 pp
Net financial assets (m€) 16,715 14,772 +13.2
Motorcycles Segment
Sales (units) 116,044 112,411 +3.2
Earnings before interest and tax (EBIT) (in m€) 224 273 -17.9
EBIT margin (in %) 13.6 16.6 -3.0 pp
Financial Services
Earnings before tax (EBT) (in m€) 1,641 1,517 +8.2
Penetration rate (in %) 49.0 46.1 +2.9 pp
Credit loss ratio (in %) 0.30 0.35 -0.05 pp

26TH CONSECUTIVE QUARTER TO ACHIEVE AUTOMOTIVE SEGMENT EBIT MARGIN WITHIN TARGET RANGE OF 8 TO 10% OR HIGHER.
BMW Group Investor Presentation, December 2016
EBIT margin development automotive segment
[in %]
Page 36
Target corridor:
8-10 %
9,6
8,1
10,2
11,9
14,4
11,9
9,2
11,6 11,6
9,6
10,5
9,99,6
9,0 9,19,5
11,7
9,4
8,2
9,5
8,4
9,19,6
9,4 9,5
8,5

SOLID FREE CASH FLOW DEVELOPMENT IN THE AUTOMOTIVE SEGMENT.
BMW Group Investor Presentation, December 2016 Page 37
* Definition: Free cash flow corresponds to the cash inflow from operating activities of the Automobiles segment less the cash outflow for investing activities of the Automobiles segment adjusted for net investment in marketable securities and term deposits. 2009 – 2015 as reported, 2007 & 2008 calculated according to above definition from reported figures. No cash flow reporting on segment level in 2006.** 2009, 2011, 2013 figures have been adjusted in accordance with IAS 8.
2.277
197
1.456
4.471
3.166
3.809
3.003
3.481
5.404
3.376 3.415
2006 2007 2008 2009** 2010 2011** 2012 2013** 2014 2015 9M-2015 9M-2016
Target:
> 3 billion
n.a.
Free Cash Flow (Automotive)*
[in m€]
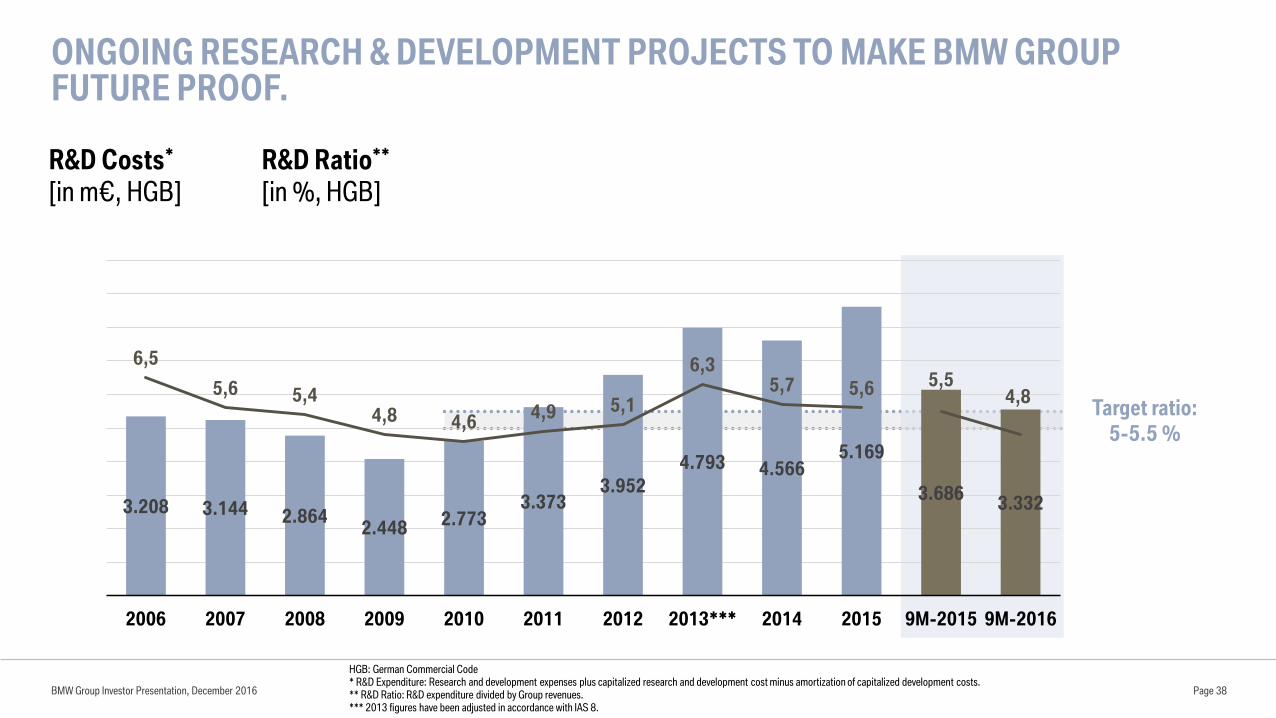
ONGOING RESEARCH & DEVELOPMENT PROJECTS TO MAKE BMW GROUP FUTURE PROOF.
BMW Group Investor Presentation, December 2016
R&D Costs*
[in m€, HGB]
R&D Ratio**
[in %, HGB]
Page 38
HGB: German Commercial Code* R&D Expenditure: Research and development expenses plus capitalized research and development cost minus amortization of capitalized development costs.** R&D Ratio: R&D expenditure divided by Group revenues.*** 2013 figures have been adjusted in accordance with IAS 8.
3.208 3.144 2.8642.448
2.7733.373
3.952
4.793 4.5665.169
3.6863.332
6,5
5,6 5,44,8 4,6
4,9 5,1
6,35,7 5,6 5,5
4,8
0
1
2
3
4
5
6
7
8
9
10
0
1.000
2.000
3.000
4.000
5.000
6.000
2006 2007 2008 2009 2010 2011 2012 2013*** 2014 2015 9M-2015 9M-2016
Target ratio:
5-5.5 %
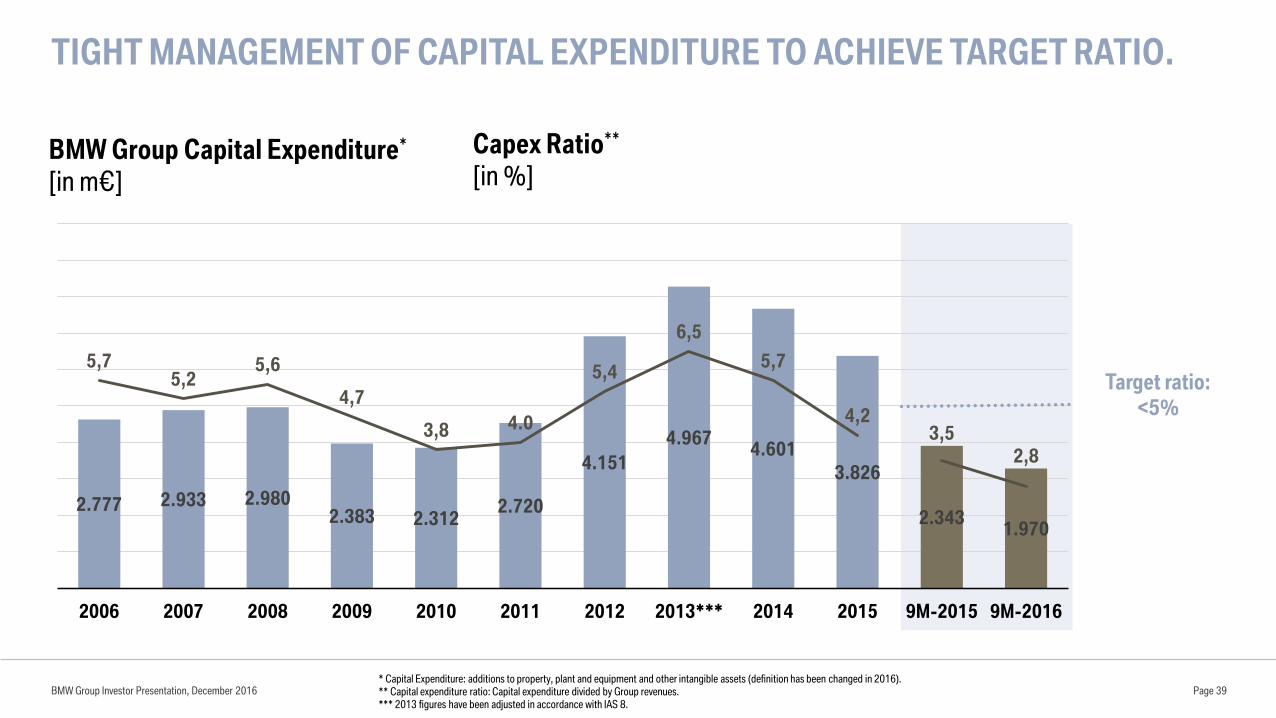
TIGHT MANAGEMENT OF CAPITAL EXPENDITURE TO ACHIEVE TARGET RATIO.
BMW Group Investor Presentation, December 2016
BMW Group Capital Expenditure*
[in m€]
Capex Ratio**
[in %]
* Capital Expenditure: additions to property, plant and equipment and other intangible assets (definition has been changed in 2016).** Capital expenditure ratio: Capital expenditure divided by Group revenues.*** 2013 figures have been adjusted in accordance with IAS 8.
Page 39
Target ratio:
<5%
2.777 2.933 2.9802.383 2.312
2.720
4.151
4.9674.601
3.826
2.3431.970
5,75,2
5,6
4,7
3,8 4.0
5,4
6,5
5,7
4,23,5
2,8
0
1
2
3
4
5
6
7
8
9
10
0
1.000
2.000
3.000
4.000
5.000
6.000
2006 2007 2008 2009 2010 2011 2012 2013*** 2014 2015 9M-2015 9M-2016

OUTLOOK FOR 2016.POSITIVE BUSINESS DEVELOPMENT EXPECTED DESPITE CHALLENGES.
BMW Group
Slight increase in EBT compared with previous year
Automotive Segment
Slight increase in deliveries and revenues compared with the previous year
EBIT margin in the target range of 8-10%
Financial Services Segment
Return on equity of at least 18%, on par with previous year
Motorcycles Segment
Solid increase in deliveries compared with the previous year
BMW Group Investor Presentation, December 2016 Page 40

BMW GROUP’S FINANCE STRATEGY COVERS THE ENTIRE AUTOMOTIVE VALUE CHAIN.
Page 41BMW Group Investor Presentation, December 2016
Research & Development Production Financial ServicesSales & Marketing
BMW GROUP CORPORATE FINANCE STRATEGY REFLECTS THE INDUSTRIAL NATURE OF THE BUSINESS
AND IS FOCUSED ON THE ENTIRE AUTOMOTIVE VALUE CHAIN.
Automotive value chain
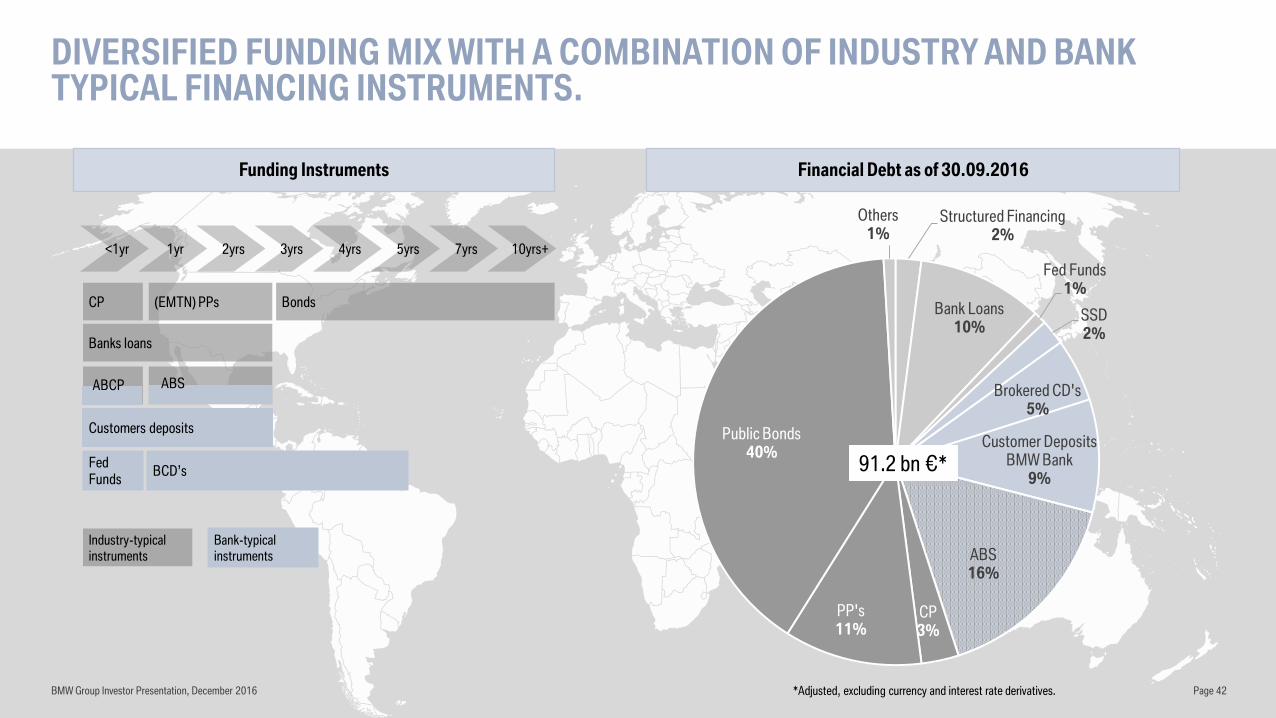
DIVERSIFIED FUNDING MIX WITH A COMBINATION OF INDUSTRY AND BANK TYPICAL FINANCING INSTRUMENTS.
BMW Group Investor Presentation, December 2016 Page 42
CP
<1yr 1yr 2yrs 3yrs 4yrs 5yrs 7yrs 10yrs+
(EMTN) PPs Bonds
Customers deposits
Banks loans
FedFunds
BCD’s
Bank-typical
instruments
Industry-typical
instruments
ABS ABCP
*Adjusted, excluding currency and interest rate derivatives.
Funding Instruments Financial Debt as of 30.09.2016
Structured Financing2%
Bank Loans10%
Fed Funds1%
SSD2%
Brokered CD's5%
Customer Deposits BMW Bank
9%
ABS16%
CP3%
PP's11%
Public Bonds40%
Others1%
91.2 bn €*
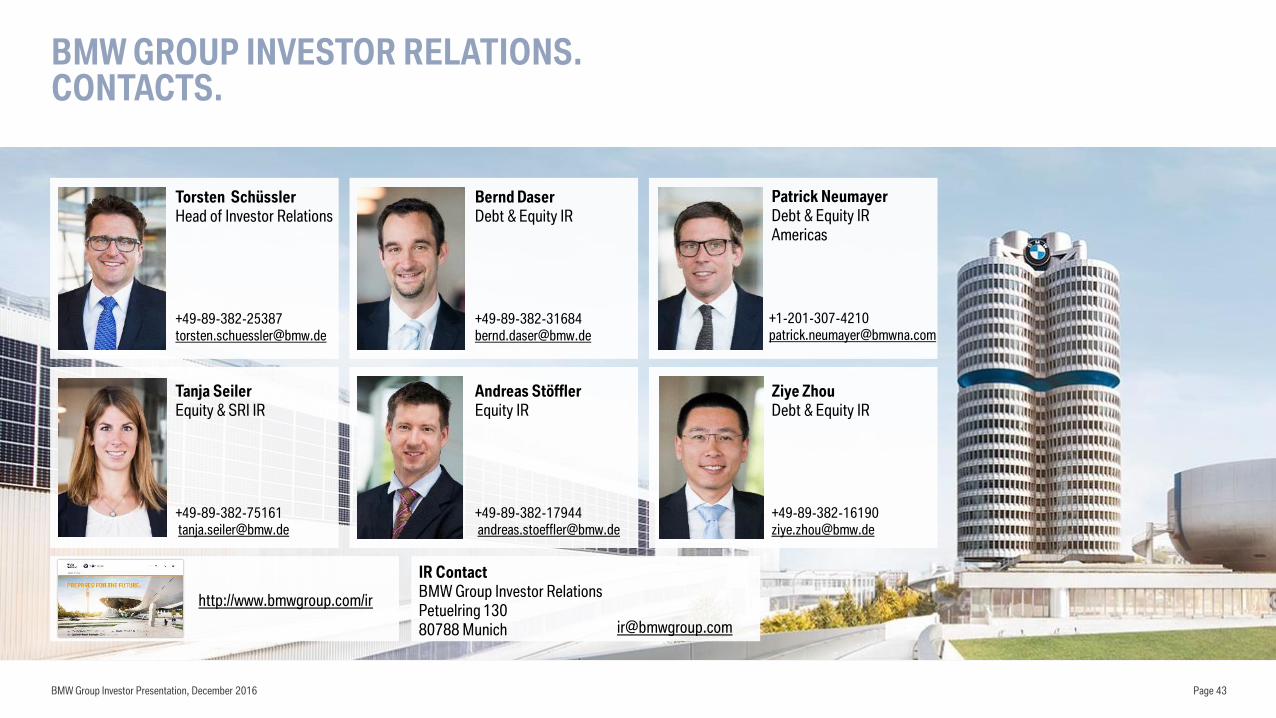
BMW GROUP INVESTOR RELATIONS. CONTACTS.
BMW Group Investor Presentation, December 2016
Torsten Schüssler
Head of Investor Relations
Andreas Stöffler
Equity IR
Bernd Daser
Debt & Equity IR
Ziye Zhou
Debt & Equity IR
Patrick Neumayer
Debt & Equity IR
Americas
Tanja Seiler
Equity & SRI IR
http://www.bmwgroup.com/ir
IR Contact
BMW Group Investor Relations
Petuelring 130
80788 Munich
Page 43
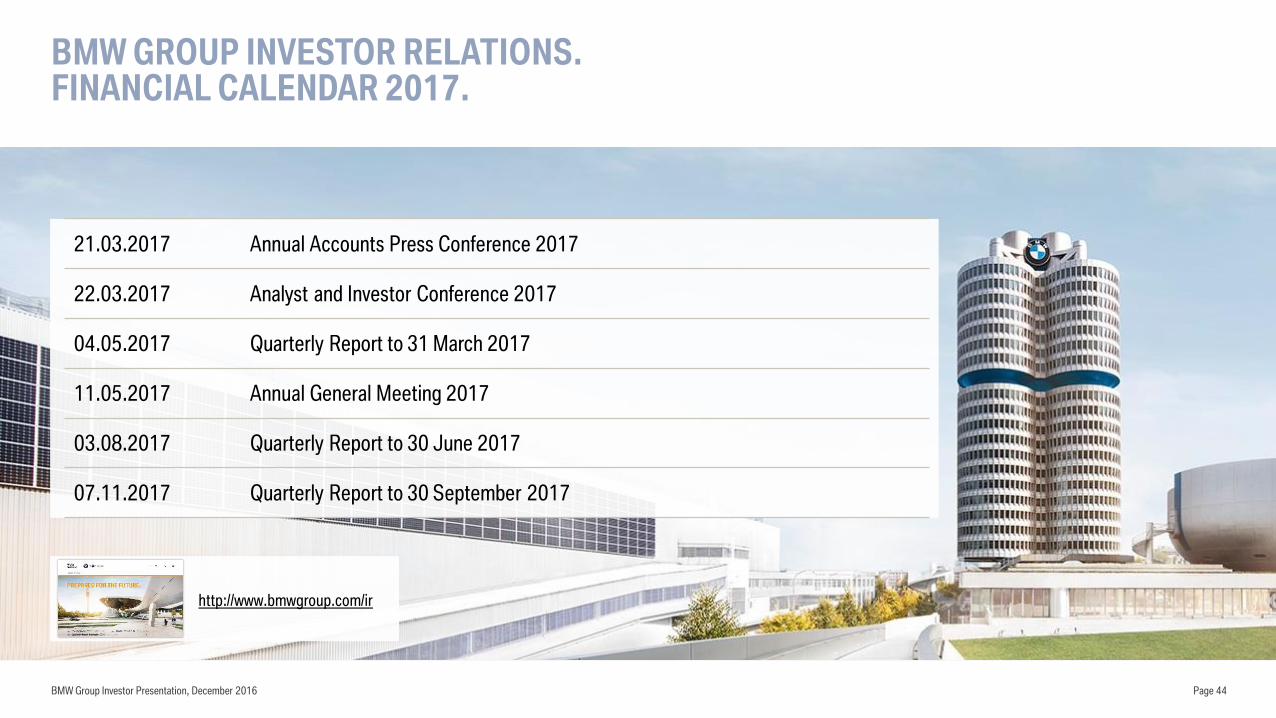
BMW GROUP INVESTOR RELATIONS.FINANCIAL CALENDAR 2017.
BMW Group Investor Presentation, December 2016
21.03.2017 Annual Accounts Press Conference 2017
22.03.2017 Analyst and Investor Conference 2017
04.05.2017 Quarterly Report to 31 March 2017
11.05.2017 Annual General Meeting 2017
03.08.2017 Quarterly Report to 30 June 2017
07.11.2017 Quarterly Report to 30 September 2017
http://www.bmwgroup.com/ir
Page 44
DISCLAIMER.
BMW Group Investor Presentation, December 2016 Page 45
This document contains forward-looking statements that reflect BMW Group’s current views about future events. The words
“anticipate,” “assume,” “believe,” “estimate,” “expect,” “intend,” “may,” ”can,” “could,” “plan,” “project,” “should” and
similar expressions are used to identify forward-looking statements.
These statements are subject to many risks and uncertainties or may be affected by factors outside BMW Group’s control,
including adverse developments in global economic conditions resulting in a decline in demand in BMW Group’s key
markets, including China, North America and Europe; a deterioration in credit and financial markets; a shift in consumer
preferences affecting demand for BMW Group’s products; changes in the prices of fuel or raw materials; disruption of
production due to shortages of materials, labor strikes or supplier insolvencies; the effective implementation of BMW
Group’s strategic goals and targets; changes in laws, regulations and government policies, particularly those relating to
vehicle emissions, fuel economy and safety; and other risks and uncertainties, including those described under the heading
“Report on Risks and Opportunities” in BMW Group’s most recent Annual Report.
If any of these risks and uncertainties materializes or if the assumptions underlying any of BMW Group’s forward-looking
statements prove to be incorrect, actual results may be materially different from those BMW Group expresses or implies by
such statements. BMW Group does not intend or assume any obligation to update these forward-looking statements.