investor presentation - anadolu grubu
TRANSCRIPT

March 2018
Investor Presentation


MARCH 2018INVESTOR PRESENTATION3
I. Strategical Overview
II. The Merger
IV. FY2017 Financial Highlights
V. Segmental Operational and Financial Summary
III. Investment Case
VI. Financial Summary
Contents

MARCH 2018
1950Establishment
50,000+employees
Operating in
9 different sectors in
19 countries with
59 production facilities in
the region.
Exports to more than
80 countries
A global group quoted on BIST with
7 companies,
generatinga turnover of
32.2 billion TL
as of 2017-end.
INVESTOR PRESENTATION4
Strong roots and extensive coverage...
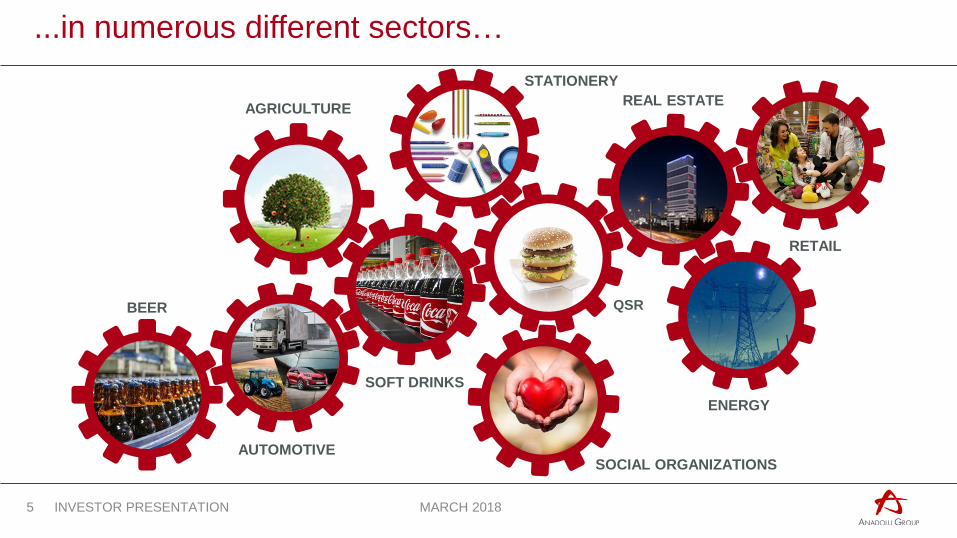
...in numerous different sectors…
MARCH 2018INVESTOR PRESENTATION5
ENERGY
REAL ESTATE
BEER
AUTOMOTIVE
RETAIL
STATIONERY
SOFT DRINKS
SOCIAL ORGANIZATIONS
AGRICULTURE
QSR

...backed by advanced competencies
MARCH 2018INVESTOR PRESENTATION6
Global player
with strong
local presence
Partnership
culture with
global brands
Expertise in
branded
consumer
products
Strong
ownership ties
coupled with
high corporate
governance
standards

MARCH 2018INVESTOR PRESENTATION7
I. Strategical Overview
II. The Merger
IV. FY2017 Financial Highlights
V. Segmental Operational and Financial Summary
III. Investment Case
VI. Financial Summary

AEH
ÖSYAŞ
Free
Float*
Özilhan
Family
Yazıcılar
Holding
Anadolu Group
companies
68% 32%
Kamil
Yazıcı
Family
Other
Yazıcı
Families
100.00%21.47%41.51%37.02%
AG Anadolu Grubu
Holding
(AGHOL)
Anadolu
Management
Company
Kamil Yazıcı Family Özilhan Family
Public
Shares**
Anadolu Group
Companies
50%
Pre-merger Post-merger
*Free float is presented based on non-family held public shares.
50%
48.5%
The Merger
51.5%
MARCH 2018
* *14.1% free float
8 INVESTOR PRESENTATİON

Pre-merger Post-merger
The Participation Rates & Method
MARCH 2018
Pre-merger
Consolidation
method
Stake held by
AGHOL, %
Current
Consolidation
method
Proforma*
Consolidation
method
Anadolu Efes Equity 43.05 Full Full
Migros Equity 50.00 Equity Full
Anadolu Isuzu Equity 55.40 Full Full
Adel Kalemcilik Full 56.89 Full Full
Çelik Motor Full 100.0 Full Full
Anadolu Restoran Full 100.0 Full Full
Anadolu Motor Full 100.0 Full Full
Efestur Full 100.0 Full Full
Aslancık HEPP Equity 33.33 Equity Equity
Anadolu Kafkasya** Full 89.19 Full Full
Real Estate
CompaniesFull 100.00 Full Full
*Proforma results include Migros as fully consolidated latest by June 2019.
**Anadolu Kafkasya holds 90% of our energy company GUE and 100% of other project company
9 INVESTOR PRESENTATİON

MARCH 2018INVESTOR PRESENTATION10
Comparative results
TL mn Consolidated Proforma Consolidated*
2016 2017 2016 2017
Net Sales 14,145 17,378 24,793 32,196
EBITDA 2,072 2,670 2,733 3,507
Total Assets 32,987 38,067 38,217 46,036
Net Debt 6,922 8,204 8,729 10,489
* Proforma results include Migros as fully consolidated
11
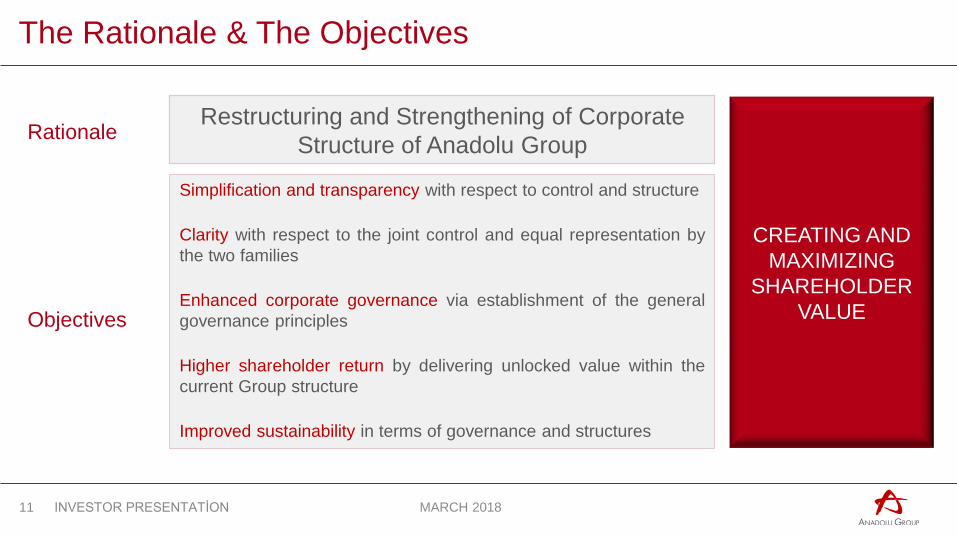
The Rationale & The Objectives
Restructuring and Strengthening of Corporate
Structure of Anadolu Group
Simplification and transparency with respect to control and structure
Clarity with respect to the joint control and equal representation by
the two families
Enhanced corporate governance via establishment of the general
governance principles
Higher shareholder return by delivering unlocked value within the
current Group structure
Improved sustainability in terms of governance and structures
CREATING AND
MAXIMIZING
SHAREHOLDER
VALUE
MARCH 2018INVESTOR PRESENTATİON
Rationale
Objectives

o The merger Yazıcılar Holding with ÖSYAŞ and AEH completed; the merged holding is named as AG Anadolu
Grubu Holding A.Ş. (AGHOL)
o Equal shareholding and equal representation by the founding Kamil Yazıcı and Özilhan Families is structured
in Anadolu Management Company.
o On the board of AGHOL, there are 4 board members quota for Kamil Yazıcı Family and 4 board members
quota for Özilhan Family and additional 4 independent board members as required by CMB legislations.
o Share classes are reduced from 4 to 2, designated currently as A (tradeable registered shares with 80% share
in paid-in-capital,) and B (non-tradeable bearer shares with 20% share in paid-in-capital); with B having the
previledge of appointing 6 members out of 12 on the board of AGHOL.
o Anadolu Management Company holds total of B-type shares and some portion of A-type shares. The portion
of A-type shares that does not belong to Anadolu Management Company are held by individual family
shareholders and free float.
12
Outline
INVESTOR PRESENTATİON MARCH 2018
The merger ensures alignment on:
o Kamil Yazıcı Family and Özilhan Family’s joint control and equal representation at the board of
every company in Anadolu Group, established through a family constitution (including a JV
agreement and internal procedures),
o Family influence only through representation at the board level,
o Strong professional/independent view via having the majority of the seats at the boards of the
subsidiaries from professionals/independents,
o Professional operational management for all key positions (Holding CEO, BU&Function Presidents
and all GMs),
o Limited quota for junior family members for employment in Group companies.
MARCH 2018INVESTOR PRESENTATİON13
The governance perspective

MARCH 2018INVESTOR PRESENTATION14
I. Strategical Overview
II. The Merger
IV. FY2017 Financial Highlights
V. Segmental Operational and Financial Summary
III. Investment Case
VI. Financial Summary

Better perception by financial markets through;
Clarification of control
Increased transparency at the holding
More meaningful consolidated results through the full consolidation of AEFES
More efficient management of funds at the holding level in line with the strategic targets of the
Group
Easier access to new funds and strategic partnerships through standing as a one and
sizeable holding company
Enhanced implemention of corporate governance principles at the holding level, as the
umbrella AGHOL then being a public company.
MARCH 2018INVESTOR PRESENTATİON15
Through the merger

Through the portfolio - I
MARCH 2018INVESTOR PRESENTATION16
Consumer play
Extensive range of consumer-products coverage
as proxy to growing private consumption and the
increase in the purchasing power of the mid-
income class; as such benefiting from a resilient
sector mix.
Well-governed portfolio play
Access to various number of sectors, ranging
from industrial to retail and services, which are
well managed and professionally run; as such,
a well-governed proxy to Turkey’s high growth
economy.
Corporate Governance Ratings
AEFES 9.58
CCOLA 9.45 MGROS 9.58
AGHOL 9.20

Through the portfolio - II
MARCH 2018INVESTOR PRESENTATION17
Predictable business outlook with
major spin-offs and acquisitions
completed
The Group completed the sale of
various non-core assets in the recent
years, with the concentration focus.
The acquisition of Migros was one of
the biggest transactions in the
history of the Group.
Acquisitons
Migros
Spin-offs
Alternatifbank
Ana Gıda
Polinas
Artı Anadolu
Atlas Varlık
Accumulated knowhow in
partnership with global
companies
The Group’s long-dated
experience in its operations
coupled with the knowhow
from the partner global
companies enhances
operational excellence.
Balanced geographical risk
Geographical diversity
ensures protection from
macroeconomic and political
imbalances in the operating
region.
Turkey
78%
International
22%
Breakdown of revenues, 2017
(Proforma)
Turkey
63%
International
37%
Breakdown of EBITDA, 2017
(Proforma)

What’s on the agenda?
MARCH 2018INVESTOR PRESENTATION18
Closely
monitoring
financial risk &
leverage
Focusing on
current
portfolio with
geographical
expansion
Concentrating
more on
profitability

MARCH 2018INVESTOR PRESENTATION19
I. Strategical Overview
II. The Merger
IV. FY2017 Financial Highlights
V. Segmental Operational and Financial Summary
III. Investment Case
VI. Financial Summary

Major Financial Indicators – FY2017
MARCH 2018
2016 2017
Net Sales (bn TL)
Consolidated results
Consolidated proforma results*
EBITDA (bn TL)
* Proforma results include Migros as consolidated
23%
2016 2017
29%
Net Income (bn TL)
2016 2017
2016 2017
Net Sales (bn TL) EBITDA (bn TL)
30%
2016 2017
28%
Net Income (bn TL)
Total Assets (bn TL)
2016 2017
15%
Total Assets (bn TL)
2016 2017
20%
2016 2017
20
14.217.4
2.12.7
-130.1
-376.0
33.0
38.1
24.832.2 2.7
3.5
-130.1
-376.0
38.246.0
INVESTOR PRESENTATION
Stellar proforma consolidated revenue
growth; proforma consolidated net sales
was recorded at TL32.2 billion, implying
a hefty 30% yearly growth.
Improvement in operational profitability of
international beer operations, mostly led by Russian
operations and soft drinks segment
Contribution from automotive segment and other
businesses that have turned their EBITDA to positive
Proforma consolidated assets exceeded
TL46 billion mainly due to Kipa acquisition
Asset growth of soft drinks segment at 28%;
contributed positively on the total asset
growth

MARCH 2018
Segmental Sales and EBITDA Contribution
Segmental Breakdown
Beer 25%
Soft Drinks49%
Auto.19%
Others1%
Retail 6%
Net Sales EBITDA
Beer31%
Soft Drinks52%
Auto.14%
Others0%
Retail3%
Soft drinks26%
Retail3%Auto.
10%
Others1% Beer
14%
Net Sales EBITDA
Migros48% Soft
drinks39%
Retail3%Auto.
10%
Others0%
Beer24%
Migros25%
Segmental Breakdown, proforma
21
24,793 1,0561,471
4,285 550 142 33
-134
32,196
2,733 158286
195 105 17 33
-20
3,507
Net Sales, proforma (mn TL)
EBITDA, proforma (mn TL)
2016 Beer Soft
DrinksMigros Auto. Retail Others Adj. 2017
INVESTOR PRESENTATION
2016 Beer Soft
DrinksMigros Auto. Retail Others Adj. 2017
Migros and Beer are
the leading segments of
2017 with annual top-
line growth of 39% and
31%
Soft drinks recorded
21%, automotive 20%,
and retail segment 16%
yearly revenue
increases.
Despite having relatively
low shares in terms of
sales, beer and soft
drinks segments’ shares
in EBITDA were higher.
EBITDA breakdown
remained ulmost
unchanged compared to
last year.

MARCH 2018
Consolidated and Segmental Indebtedness
2016 2017
Consolidated Net Debt (bn TL)
2016 2017
Consolidated Net Debt / EBITDA (x)
Holding-only net debt increased to TL1bn, due
to financing for the purchase of additional 10%
Migros shares and FX appreciation
Net debt /EBITDA decreased to 3.07x on the
back of stellar EBITDA growth
22
Breakdown of Net Cash
USD
70%
Breakdown of Net Debt
USD
54%
Euro
32%
TL
32%Others
1%
TL
17%
Euro
3%
Others
19%
3.34
3.07
6.9
8.2
As of 2017-end (TL mn) Total
Consolidated Debt
Cash and Cash
Equivalents
Net Debt Net Debt/EBITDA
Beer 2,519 1,606 913 1.1
Soft Drinks 5,991 3,892 2,099 1.5
Automotive 3,214 190 3,025 8.3
Retail 213 55 158 1.7
Others (incl. Holding)
Holding net debt
2,176
1,143
165
74
2,011
1,069
n.m.
n.m.
Consolidated 14,113 5,908 8,204 3.1
Migros 3,912 1,628 2,284 2.6
Proforma Consolidated 18,025 7,536 10,489 3.0
INVESTOR PRESENTATION

MARCH 2018INVESTOR PRESENTATION23
I. Strategical Overview
II. The Merger
IV. FY2017 Financial Highlights
V. Segmental Operational and Financial Summary
III. Investment Case
VI. Financial Summary

Beer Segment
A total beverage company serving more than
690 mn consumers in
16 countries
MARCH 2018
A world class brand portfolio, balanced between beer and soft drink operations
Operating in countries with significant growth potential indicated by low per capita consumption levels
Through an experienced and financially strong organization
Having world’s largest brewer ABI in beer and soft drinks giant TCCC in soft drinks arm as partners
INVESTOR PRESENTATION24
Ownership Structure
AB Inbev
24.0%
Public
(BIST)
32.95%
100.0% 50.3%
Public
(BIST)
26.7%
TURKEY
BEER OPERATIONS
INTERNATIONAL
BEER OPERATIONS
BEER OPERATIONS
TURKEY SOFT DRINKS OPERATIONS
INTERNATIONAL SOFT DRINKS
OPERATIONS
COCA-COLA İÇECEK2
(CCI)
• ••
•
•
• •The Coca-Cola
Company1
20.1%
•
•
(1) Through The Coca-Cola Export Corporation(2) 2.9% held by Özgörkey Holding
Anadolu
Group
43.05%
First Turkish signatory company of UGC CEO Water Mandate
Quoted in BIST Corporate Governance and Sustainability Indexes
Only Turkish beverage company in Vigeo Eiris EM 70 listing
• ••
•

Beer
MARCH 2018
14breweries
Annual
35.6 mhlbeer,
Leader in the Turkish market
Solidified market position in Russia
Strongly positioned in CIS countries
Leader in Kazakhstan, Moldova, Georgia
INVESTOR PRESENTATION25
15th
largestIn the WorldIn termsof salesvolume
Exports to more than
70countries
5Malt factories
1Hops processingfacility
in 6countries:TurkeyRussiaKazakhstanUkraineGeorgiaMoldova
228 ktons malt productioncapacity
5th
largestin Europe
1Preform Plant

Beer
MARCH 2018
Beer Sales Volume (FY2017)
21.1 mhl
Beer Segment Performance
Net Sales (mn TL) EBITDA (mn TL)
Net Income (mn TL)
31% 23%
Russia
55%
Full year beer sales volume exceeded 21 mhl, implying 6% yearly growth.
Revenue growth was significantly ahead of that of volume, top-line growth of 31% y-o-y.
Strong EBITDA growth year on year.
Beer segment bottom-line turned positive at TL61mn.
Solid FCF generation of TL500mn in 2017
Kazakhstan
10%
Others
8%
Turkey
27%
Turkey
27%
Int.
73%
Turkey Beer Operations
Int. Beer Operations
EfesTurkey
61%
Tuborg
39%
10%
Efes Russia
15%
Carlsberg
31% 47%
Heineken 14%
Inbev
11%
Others
29%
26
1,4391,588
1,9032,807
3,370
4,426
676834
-35
61
Market Shares*
Volume Breakdown by Country
Russia Market Shares*
Sales (mn TL)
EBI Sales (mn TL)
2016 2017
2016 2017 2016 2017
2016 2017
2016 2017
INVESTOR PRESENTATION
*Nielsen FY2017

Soft Drinks
MARCH 2018INVESTOR PRESENTATION27
A total of
25plants in
10countries:Turkey, Pakistan, Kazakhstan,Azerbaijan, Turkmenistan, Kyrgysztan, Iraq Jordan, Tajikistan, Syria
Annual productioncapacity
1.5 bn u/c
28 bnannual servings to
400 mnpeople
6th
largest bottlerIn Coca-Cola system
12M2017 revenues:
TL 8.5 bn
12M2017 EBITDA:
TL1.4 bn
2017 sales volume
1.24 bn u/c
Quoted in BIST Corporate Governance and Sustainability Indexes
The first & only Turkish companyto be quoted in the UNGCCompact 100 Index
Among Turkey’s climate change leaders within the scope of CDP’s Climate Change Report.
Strong market positions in Sparkling
TURKEY
63%#1
PAKISTAN
37%
KAZAKHSTAN
49%
AZERBAIJAN
75%
TURKMENISTAN
61%
KYRGYZSTAN
68%
IRAQ
JORDAN
#1
#1
#2
#1
#1
#2
#2

Soft Drinks
MARCH 2018
Soft Drinks Sales Volume (2017)
1.237 m/uc
Turkey
50%
Int.
50%
Sparkling
71%
Stills
6%
NRTD
9%
Water
14%
Soft Drinks Segment Performance
Net Sales (mn TL) EBITDA (mn TL)
Net Income (mn TL)
21%26%
Volume growth of sparkling category turned positive after 5 years.
Highest consolidated Net Revenue, EBIT & EBITDA growth of the past 5 years.
Consolidated EBITDA margin expansion of 0.7ppt to 16.2%
Net income was TL238 million in 2017, driven by higher operating profit and lower net financialexpenses
Domestic Soft Drink Operations
Sales (mn TL)
12%
EBITDA Margin (%)
Int. Soft Drink Operations
Sales (mn TL)
30%
EBITDA Margin (%)
28
3,601
4,022
2017 Volume Breakdown
14.317.6
18.8
18.93,450
4,500
7,0508,521
1,0931,379
-28
238
2016 2017 2016 2017
2016 2017 2016 20172016 2017
2016 2017 2016 2017
INVESTOR PRESENTATION

Migros
MARCH 2018INVESTOR PRESENTATION29
The pioneer of organized retail in Turkey
17.2%share in modern FMCG
7.1%share in total FMCG
A total of
1,897 stores
covering app.
1.4 mn m2
Active Loyalty Card holders
10.3 mn, reaching
7.7 mn households in
Turkey
Complementary operations in Kazakhstan
and Macedonia with 39 Ramstores.
Over 20 years retail experience abroad
Acquired Tesco-Kipa business in Turkey-
162 stores.
Best retailer of the Country Award for 14 years in a row
Quoted BIST Corporate Governance Index and the first & only retail company quoted in BIST Sustainability Index
12M2017 EBITDA:
TL 872 mn with EBITDA margin
5.7%
12M2017 revenues:
TL15.3 bn

Migros
MARCH 2018
Gain in traffic from all consumer segments
Migros is reaching out to more households than everbefore
193 new store openings in 2017
Consolidated sales more than doubled in 4 years
Net debt/EBITDA continues to improve despite additional financing for Kipa acquisition & hard currency appreciation
Net Sales (mn TL)
39%
Total FMCG Market Shares (%) Modern FMCG Market Shares (%)
EBITDA (mn TL)
29%
Net Income (mn TL)Number of Stores (%)
1,410
1,897 w/Kipa
1,605
5.7
7.1 w/Kipa
6.114.4
17.2 w/Kipa
14.8
Migros Performance
30
2016 2017
1,735
2016 2017
2016 20172015
11,059
15,344677
872
-300
513
2016 2017 2016 2017
2016 2017
INVESTOR PRESENTATION

Automotive
MARCH 2018
Distribution of Kia-branded vehicles and operational leasing activities
INVESTOR PRESENTATION31
All car rental & leasing solutions under one powerful umbrella brand
Garenta Day fleet size
5,400
12M2017 revenues:
TL 2.1 bn
2017-end market share in passenger cars:
1.51%
Garenta Pro fleet size
26,800
ÇELİK MOTOR
ikinciyeni.com:
the leading second-hand
automotive e-commerce
platform in Turkey sold over
18.000 cars in 2017. With app.
200k members, the platform
daily brings together more
than 100 cars with their new
owners.
Leasing revenues: 66%
Car and spare parts sales: 34% of top-line
Praticar.com:
after sales needs of
Çelik Motor’s fleet
mngnt. experience in the
short/long term rental to
vehicle owners
Bulur.com:
e-commerce portal
that combines users
who want to buy and
sell cars with
intelligent matching
algorithm.

Automotive
MARCH 2018
More than
170 kvehiclesproduced
in 34years
Export to more than
60countries
since 1994
The first Japanese automotive partnership in Turkey, with Isuzu and Itochu
INVESTOR PRESENTATION32
12M2017 revenues:
TL 963 mn
ANADOLU ISUZU
Patent Leader R&D in itssegment awarded by itsdesigns
Turkey’s one and only pick-up locally manufactured, recently refreshed with its new generation 1.9lt motor and new face- D-MAX
The record export of thelast 23 years in 2017
One and only IMM (Isuzu Manufacturing Management) Certificate,for bus segment, owner across Europe
6-16t trucks market leader
More than400,000gas and diesel engines manufactured
21,000 m2
Production, factory, office areas
Production capacity of20,000units in one shift
Production, import and distribution of wide-range of industrial engines
Tractor production under Landini brand
ANADOLU MOTOR

Automotive
MARCH 2018
Isuzu Net Sales (TL mn)
Çelik Motor Net Sales (TL mn)
Significant operational improvement; EBITDA increase of 40%
Negative bottom-line due to the nature of business; increasing fleet of Çelik Motor
Anadolu Motor Net Sales (TL mn) Automotive Segment Performance
Net Sales (mn TL) EBITDA (bn TL)
Net Income (mn TL)
20% 40%
Isuzu EBITDA (TL mn)
Çelik Motor EBITDA (TL mn)
19% 41%16%
42%76%
33
Anadolu Motor EBITDA (TL mn)
2016 2017
830
963
1,798
2,134
2016 2017 2016 2017
199
280
2016 20172016 2017
236
336
16
29
7
-0.3
2016 2017
2,821
3,372
260
365
-152
-161
2016 2017
2016 2017
2016 2017
INVESTOR PRESENTATION

Retail
MARCH 2018INVESTOR PRESENTATION34
Leaderof the Turkish
Stationery Sector
50Export Countries
4.500Product varieties in
Stationery and Toy
1995Partnership with Faber-Castell
NewestProduction Plant in Europe
36.000 m2
300 mn pcs/year
Unique Ability
to produce around 1000different products requiring
different production techniques
Environmental
60% of natural gas need
provided from waste wood dust
2011“LLC Faber-Castell Anadolu”
JV is established. Territory:
Russia, Kyrgyzstan, Belarus,
Kazakhstan
2015Introduction of World Class
Toy Brands in Turkey
12M2017 revenues:
TL 322 mn
ADEL KALEMCİLİK

Retail
MARCH 2018INVESTOR PRESENTATION35
Turkish suppliersprovide
98%of the
600items used inMcDonald’srestaurants
McDonald’s Child Charity has achieved
45Projects to
1.5 mnchildren
260restaurants
More than
6,000employees
Serving around
100 mncustomers in Turkeyannualy
49Franchisee
74Franchisee restaurants
12M2017 revenues:
TL 622 mn

Retail Segment
MARCH 2018
Retail Segment Performance
Net Sales (bn TL) EBITDA (bn TL)
Net Income (mn TL)
16%
22%
Adel Net Sales (TL mn)
Adel increased share of exports in sales
McDonald’s doubled its EBITDA growth due to successful execution efforts
Net profit of the segment at TL9 mn in 2017
100% TL denominated borrowings
McDonald’s Net Sales(TL mn)
18%
13%
McDonald’s EBITDA (TL mn)
111%
36
Adel EBITDA (TL mn)
9%
272
322
64
70 9
19
549
622
866
1,008
7491
-11
9
2016 2017 2016 2017
2016 2017 2016 2017
2016 2017 2016 2017
2016 2017
INVESTOR PRESENTATION
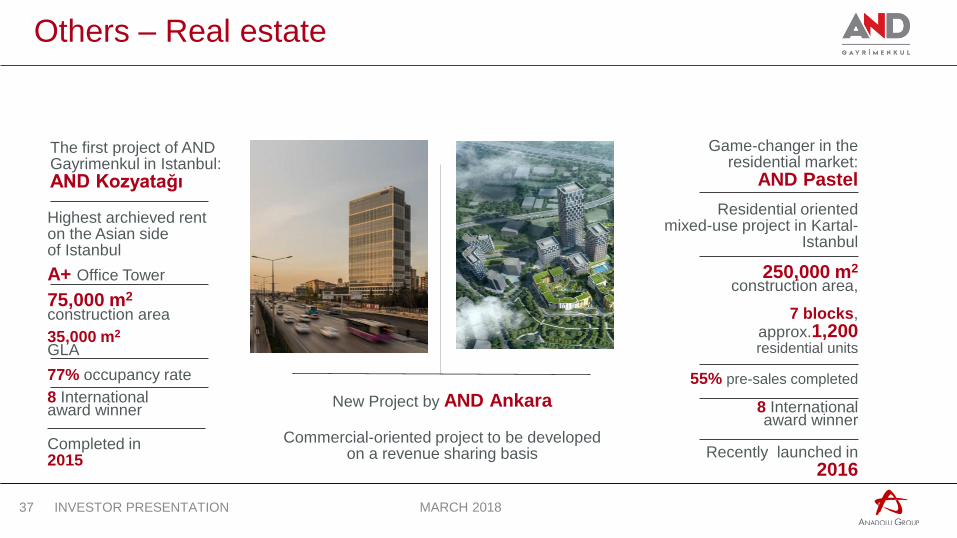
Others – Real estate
MARCH 2018INVESTOR PRESENTATION37
Game-changer in the residential market:
AND Pastel
Residential orientedmixed-use project in Kartal-
Istanbul
250,000 m2
construction area,
7 blocks,approx.1,200residential units
55% pre-sales completed
8 Internationalaward winner
Recently launched in 2016
The first project of ANDGayrimenkul in Istanbul:AND Kozyatağı
Highest archieved rent on the Asian side of Istanbul
A+ Office Tower
75,000 m2
construction area
35,000 m2
GLA
77% occupancy rate
8 Internationalaward winner
Completed in2015
New Project by AND Ankara
Commercial-oriented project to be developed on a revenue sharing basis

Others - Agriculture
MARCH 2018
7farms
25,000da land
1packinghouse
230,000tons fruit processed
in 3production plants
in 2017
3.5 mnFruit trees
The largest fruit grower and fruit juice producerin Turkey
Launched the first fruit brand of Turkey in Dec. 2015: DoalCreated a new natural sugar category with Doal Meyveden Şeker in 2017
INVESTOR PRESENTATION38
Joint Venturewith Cutrale and Özgörkey families
MARCH 2018
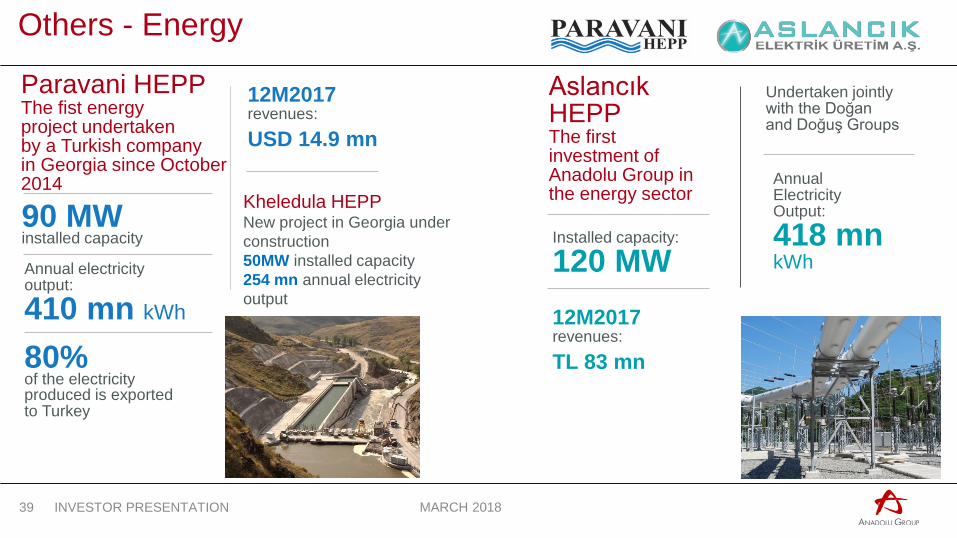
Others - Energy
90 MWinstalled capacity
Annual electricityoutput:
410 mn kWh
80% of the electricityproduced is exported to Turkey
Paravani HEPPThe fist energy project undertaken by a Turkish companyin Georgia since October 2014
INVESTOR PRESENTATION39
Installed capacity:
120 MW
Aslancık HEPPThe first investment of Anadolu Group in the energy sector
Undertaken jointly with the Doğan and Doğuş Groups
Annual ElectricityOutput:
418 mn kWh
12M2017 revenues:
USD 14.9 mn
12M2017 revenues:
TL 83 mn
Kheledula HEPPNew project in Georgia under
construction
50MW installed capacity
254 mn annual electricity
output

MARCH 2018
Others
Energy and real estate companies are
under consolidated under the other
segment.
Net sales revenues rose by 16% y-o-y,
due to increase in the rental revenues of
the real estate companies.
Delivery of the residential units will
commence on June 2018 and December
2018.
Gross profit margin expanded by 9.5%,
which is attributable to the stellar
performance of the real estate revenues.
40 INVESTOR PRESENTATION
Other Segment Performance
Net Sales (mn TL) EBITDA (bn TL)
Net Income (mn TL)
16%206
239
-39 2
-200
-52
2016 2017
2016 2017
2016 2017

MARCH 2018
Social Organizations
512,000 +free of charge health services provided
Celebrating its
38th
year in 2017
50educational institutions, hospitals built
Projects mainly focusing on education and health
27,000 Scholarships
INVESTOR PRESENTATION41
Strategic partnership with Johns Hopkins Medicine International
Bone Marrow Transplant CenterTransplanted bone marrow to more than1,700 patients
Anadolu Medical Center is in the
third place of the Top 500 corporations in Turkey in the healthcare category for the services it exported in 2016
1Koraç Cup1996
11TurkishCups and 10PresidentialCups
13Turkish League Championships
First placein 3 EuroleagueDevotion Marketing Awards
Book and Materials
Support for 37,000 + disadvantaged students
22,000 + hours Mentoring Support
Social Entrepreneurship
Seminars for 50,000 + teachers

MARCH 2018INVESTOR PRESENTATION42
I. Strategical Overview
II. The Merger
IV. FY2017 Financial Highlights
V. Segmental Operational and Financial Summary
III. Investment Case
VI. Financial Summary

MARCH 2018INVESTOR PRESENTATION43
* Proforma results include Migros as fully consolidated
Segmental Financial Summary
TL, million Beer Soft Drinks Otomotive Retail Other Consolidated MigrosMigros Proforma
Consolidated
Net SALES 4.426 8.521 3.372 1.008 239 17.378 15.344 32.196
y-o-y 31% 21% 20% 16% 16% 23% 39% 30%
Gross Profit 2.143 2.901 560 218 116 5.801 4.082 9.836
y-o-y 25% 21% 32% 18% 44% 24% 38% 30%
Operating Profit 362 874 263 57 138 1.679 303 1.767
y-o-y 24% 37% 61% 43% n.m. 87% a.d. 30%
EBITDA 834 1.379 365 91 2 2.670 872 3.507
y-o-y 23% 26% 40% 22% n.m. 29% 29% 28%
PBT 102 421 -236 17 -107 157 603 409
y-o-y 691% 495% 21% 846% -51% n.m. n.m. n.m.
Net Income 61 238 -161 9 -52 -130 513 -130
y-o-y n.m. n.m. 6% n.m. n.m. -65% n.m. -65%
Net Debt 913 2.099 3.025 158 2.011 8.204 2.284 10.489
y-o-y a.d. -8% 32% 8% 90% 19% 26% 20%
Gross Margin 48,4% 34,0% 16,6% 21,6% 48,7% 33,4% 26,6% 30,5%
EBITDA Margin 18,8% 16,2% 10,8% 9,0% 0,7% 15,4% 5,7% 10,9%
Net Margin 1,4% 3,3% -4,6% 0,8% -21,7% 0,6% 3,3% 0,9%
The star that links Anatolia to the world and the world to Anatolia
Thank you...
MARCH 2018INVESTOR PRESENTATION44
Disclaimer StatementAnadolu Grubu Holding has prepared this document for the sole purpose of providing information which may include forward looking projections and
statements about the Company. All opinions and estimates contained in this document constitute Company’s judgement as of the date of this document and
are subject to change without notice. The company does not accept any liability whatsoever for any direct or consequential loss arising from any use of this
document or contents. This document cannot be copied, disclosed or distributed to any person other than the person to whom the document and/or
information delivered or sent by Anadolu Grubu Holding.