investor presentation - jefferies · 4 catamaran – redefining the pharmacy benefit catamaran is a...
TRANSCRIPT

Investor Presentation
June 2014

2
Safe Harbor Certain statements included herein, including guidance and those that express management's objectives and the strategies to achieve those objectives, as well as information with respect to the Company's beliefs, plans, expectations, anticipations, estimates and intentions, constitute “forward-looking statements” within the meaning of applicable securities laws. Forward-looking statements are necessarily based upon a number of estimates and assumptions that, while considered reasonable by management at this time, are inherently subject to significant business, economic and competitive uncertainties and contingencies. We caution that such forward-looking statements involve known and unknown risks, uncertainties and other risks that may cause our actual financial results, performance, or achievements to be materially different from our estimated future results, performance or achievements expressed or implied by those forward-looking statements. Numerous factors could cause actual results to differ materially from those in the forward-looking statements, including without limitation, our ability to achieve increased market acceptance for our product offerings and penetrate new markets; our ability to compete successfully; our dependence on, and ability to retain, key customers; customer demands for enhanced services levels or loss or unfavorable modification with our customers; the risks and challenges associated with our PBM partnering agreement with Cigna Corporation due to the size of the client and the complexity and term of the agreement; consolidation in the healthcare industry; our ability to identify and complete acquisitions, manage our growth, integrate acquisitions and achieve expected synergies from acquisitions; changes in industry pricing benchmarks and continuing market and economic challenges; our ability to maintain our relationships with pharmacy providers, pharmaceutical manufacturers, third-party rebate administrators and suppliers; compliance with existing laws, regulations and industry initiatives and future change in laws or regulations in the healthcare industry; our ability to maintain our relationships with suppliers; the outcome of any legal or tax proceeding that has been or may be instituted against us; the existence of undetected errors or similar problems in our software products; potential liability for the use of incorrect or incomplete data; interruption of our operations due to outside sources and breach of our security by third parties; our dependence on the expertise of our senior management and other personnel; maintaining our intellectual property rights and litigation involving intellectual property rights; our ability to obtain, use or successfully integrate third-party licensed technology; our ability to accurately forecast our financial results; our level of indebtedness and the covenants and restrictions in the agreements governing our outstanding indebtedness; our access to sufficient capital to fund our future requirements; and potential write-offs of goodwill or other intangible assets.
When relying on forward-looking information to make decisions, investors and others should carefully consider the foregoing factors and other uncertainties and potential events. In making the forward-looking statements contained herein, the Company does not assume any future significant acquisitions, dispositions or one-time items. It does assume, however, the renewal of certain customer contracts. Every year, the Company has major customer contracts that come up for renewal. In addition, the Company also assumes new customer contracts. In this regard, the Company is pursuing large opportunities that present a very long and complex sales cycle which substantially affects its forecasting abilities. The Company has assumed certain timing for the realization of these opportunities which it believes is reasonable but which may not be achieved. Furthermore, the pursuit of these larger opportunities does not ensure a linear progression of revenue and earnings since they may involve significant up-front costs followed by renewals and cancellations of existing contracts. The Company has assumed certain revenues which may not be realized. The Company has also assumed that the material factors referred to in the previous paragraph will not cause such forward-looking information to differ materially from actual results or events. There can be no assurance that such assumptions will reflect the actual outcome of such items or factors. Accordingly, investors are cautioned not to put undue reliance on forward-looking statements. The foregoing list of factors is not exhaustive and is subject to change and there can be no assurance that such assumptions will reflect the actual outcome of such items or factors. Other factors that should be considered are discussed from time to time in Catamaran's filings with the U.S. Securities and Exchange Commission, including the risks and uncertainties discussed under the captions “Risk Factors” and “Management's Discussion and Analysis of Financial Condition and Results of Operations” in our Annual Report on Form 10-K and subsequent Form 10-Qs, which are available at www.sec.gov. Investors are cautioned not to put undue reliance on forward-looking statements. All subsequent written and oral forward-looking statements attributable to Catamaran or persons acting on our behalf are expressly qualified in their entirety by this notice. We disclaim any intent or obligation to update publicly these forward-looking statements, whether as a result of new information, future events or otherwise.
THE FORWARD-LOOKING INFORMATION CONTAINED IN THIS RELEASE REPRESENTS THE COMPANY’S CURRENT EXPECTATIONS AND, ACCORDINGLY, IS SUBJECT TO CHANGE. HOWEVER, THE COMPANY EXPRESSLY DISCLAIMS ANY INTENTION OR OBLIGATION TO UPDATE OR REVISE ANY FORWARD-LOOKING INFORMATION, WHETHER AS A RESULT OF NEW INFORMATION, FUTURE EVENTS OR OTHERWISE, EXCEPT AS REQUIRED BY APPLICABLE LAW.
All figures are in US dollars unless otherwise stated.

3
Catamaran at a Glance
Headquarters Exchange Symbols Employees
Share Price (NASDAQ: June 2, 2014)
Shares Outstanding
Market Cap (NASDAQ)
Chicago NASDAQ: CTRX
TSX: CCT 4,000
US$43.59 ~$9.0B 207.1MM (f/d)

4
Catamaran – Redefining the Pharmacy Benefit
Catamaran is a scaled alternative to the traditional PBM model
● Best-in-class technology platform providing unequalled flexibility
● Unsurpassed, high-touch service model
● Aggressive management of pharmacy costs through skill and scale
● Delivering superior, client-centric solutions to healthcare payers

5
Increased Complexity Requires Flexible Tools & Services
RxExchange
Mobile
RxPortal
RxAuth
RxMax
RxExpress
RxBuilder
Medication
Therapy Mgmt.
RxProvider Portal
Enhanced COB
RxBuilder
RxTrack
RxInterAct
Retail Network
Clinical Services
Specialty Pharmacy
Customized Plan Design
RxClaim
Source: Catamaran
6
1.0
1.5
2.0
2.5
3.0
3.5
4.0
4.5
5.0
$-
$50.0
$100.0
$150.0
$200.0
$250.0
$300.0
$350.0
2007 2008 2009 2010 2011 2012 2013
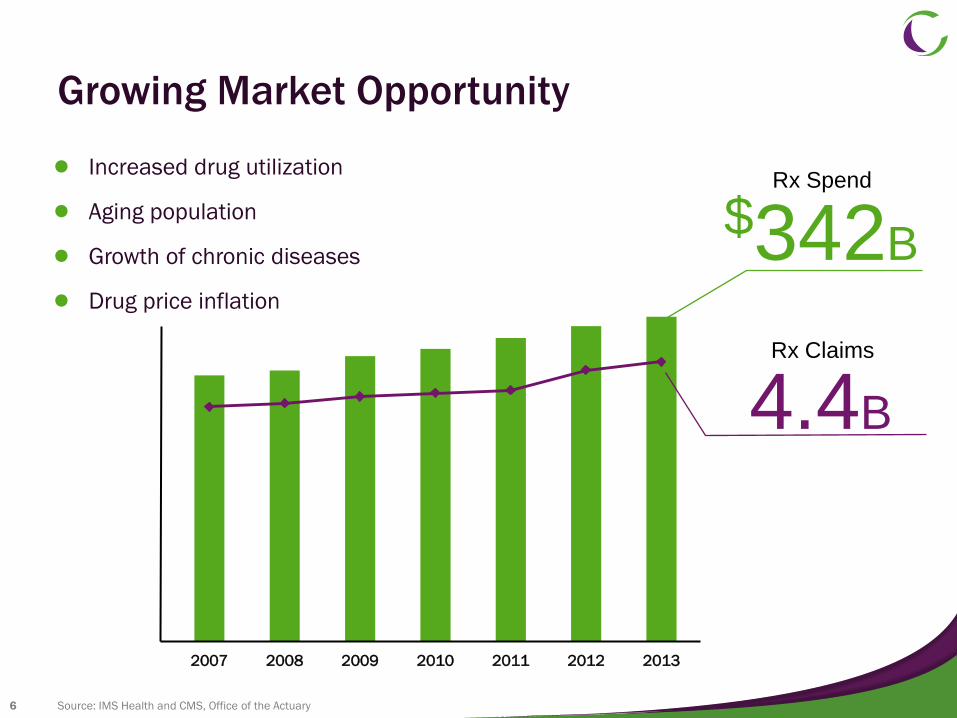
Growing Market Opportunity
● Increased drug utilization
● Aging population
● Growth of chronic diseases
● Drug price inflation
Source: IMS Health and CMS, Office of the Actuary
4.4B
Rx Claims
$342B
Rx Spend

7
Trends in the Industry
Integrated Insight
Shift from Cost to Care
Rise of Mass
Individualization
- More effective clinical intervention and
patient support
- Real-time collaboration across the
continuum
- More effective prescriptive analytics and
individualized drugs
- Use of real-time biometric and environmental
data
- Highly customized therapies and patient support
- Holistic view of the drug therapy and spend
- Data and connectivity enable coordination
of care
- PBM is central to maximizing value and
positive outcomes

Catamaran Manages Clients’ Drug Trend
● Catamaran leverages every touch point to minimize cost and
maximizing outcomes
● Catamaran utilizes data and analytics to drive critical connections
and innovative interventions
Source: Catamaran Trend Reports 2011, 2012, 2013, 2014
Catamaran Drug Trend
2.7%
3.5%
2.6% 2.4%
2010 2011 2012 2013

Catamaran Drug Trend Insights
Generic utilization controls
drug trend and aligns
incentives with clients
Source: Catamaran Trend Report 2014
10x Difference
in Average Cost
Hepatitis C patients were being
“warehoused” in 2013 waiting
for emerging technologies
Hepatitis C Class
42.5% Utilization
decreases in 2013
of Hepatitis C
therapy utilizers
are using Sovaldi either alone or
in combination with another agent
*Data from Q1 2014 utilization in Catamaran PBM’s book of
business
70% *
$307 Brand $30 Generic
Average Cost of a Prescription
10
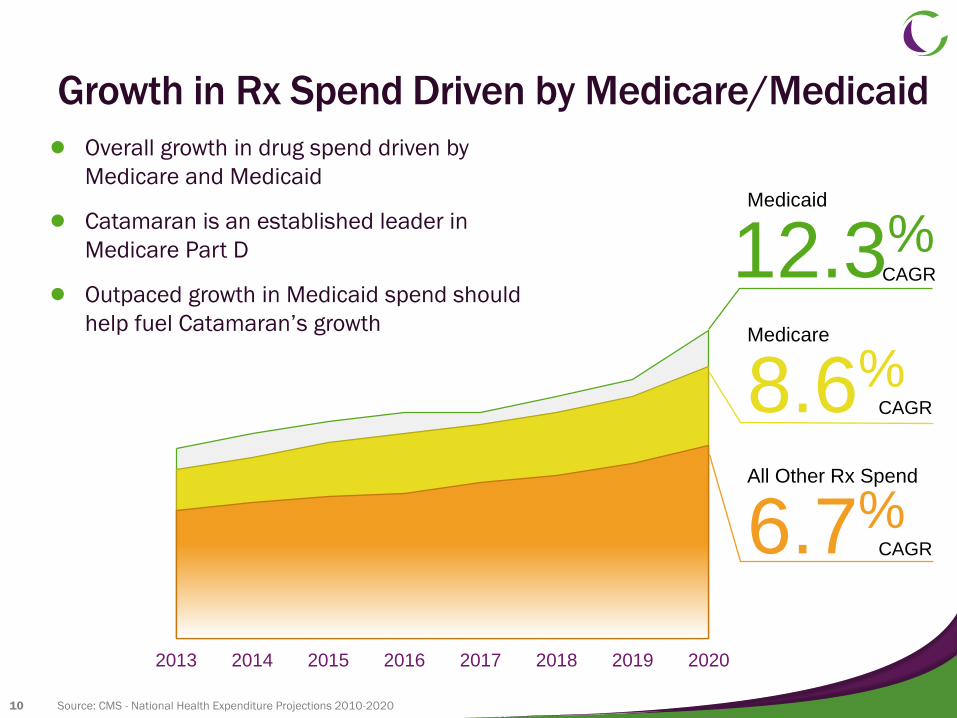
Growth in Rx Spend Driven by Medicare/Medicaid
● Overall growth in drug spend driven by
Medicare and Medicaid
● Catamaran is an established leader in
Medicare Part D
● Outpaced growth in Medicaid spend should
help fuel Catamaran’s growth
Source: CMS - National Health Expenditure Projections 2010-2020
12.3% CAGR
8.6% CAGR
6.7% CAGR
2013 2014 2015 2016 2017 2018 2019 2020
12.3% Medicaid
CAGR
8.6% Medicare
CAGR
6.7% All Other Rx Spend
CAGR
11
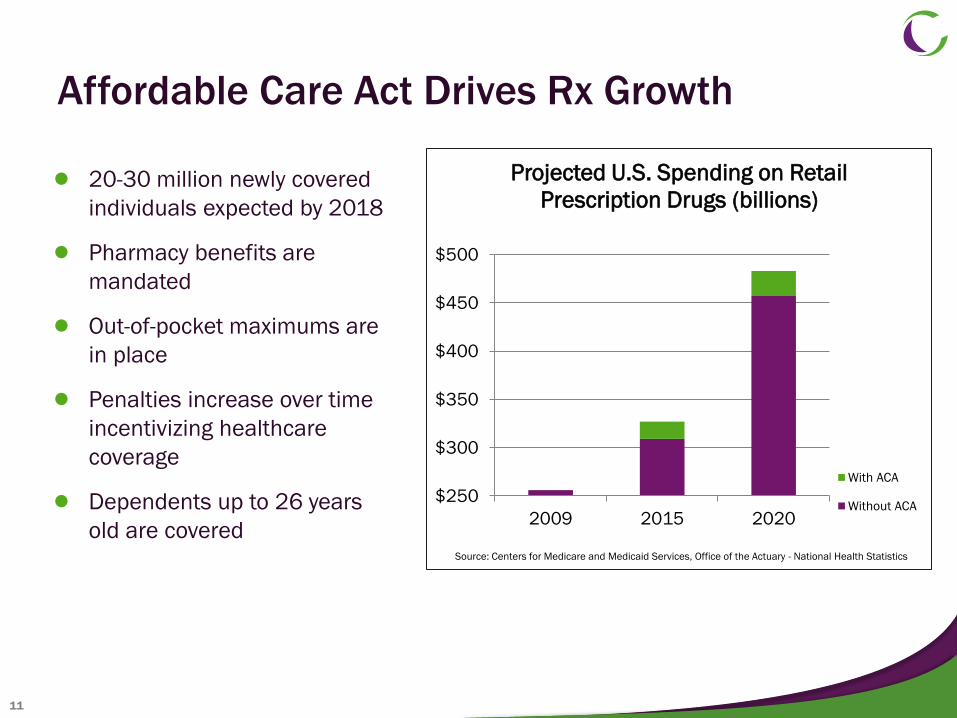
Affordable Care Act Drives Rx Growth
$250
$300
$350
$400
$450
$500
2009 2015 2020
Projected U.S. Spending on Retail
Prescription Drugs (billions)
With ACA
Without ACA
Source: Centers for Medicare and Medicaid Services, Office of the Actuary - National Health Statistics
● 20-30 million newly covered
individuals expected by 2018
● Pharmacy benefits are
mandated
● Out-of-pocket maximums are
in place
● Penalties increase over time
incentivizing healthcare
coverage
● Dependents up to 26 years
old are covered

12
Affordable Care Act - Coverage Channels
Newly Insured 26M people by 2017
Exchange
1 Traditional PBMs
2 3
Fee-for-Service Medicaid
Managed Medicaid Health
Plan
Health
Plan
Source: Congressional Budget Office (CBO) and Joint Committee on Taxation (JCT)
Health
Plan CO-OP
Managed Medicaid
Exchange
Health
Plan
Health
Plan
Health
Plan CO-OP
Managed Medicaid
Exchange
Health
Plan
Health
Plan
Health
Plan CO-OP
Fee-for-Service Medicaid

13
Catamaran Is Well Positioned for Success in
2014 and Beyond
Source: Catamaran
Health
Plans
Employers
Other
Catamaran’s Client Breakdown Based on Revenue

14
Catamaran PBM Market Share Growth Potential
Market share based on PBM script volume
Source: IMS | Catamaran
Mail-centric PBM
Retailer-owned PBM
Channel-agnostic PBM
34%
22%
9%
35%
Catamaran
Other PBMs

15
Ideally Positioned in a Changing World
● Catamaran is a credible alternative in the industry taking market share
from competitors
● Possess a core competency of sourcing and integrating accretive
acquisitions
● Track record of financial growth unmatched in the industry

Catamaran Financials

17
Catamaran Business Model
Revenue Drivers:
● Aging population drives drug
spend increase
● New sales wins and ACA lives
● Conversion of HCIT clients to
full-service PBM
● Acquisitions
Profit Drivers:
● Generic launches
● Growth in specialty pharmacy
● Skill and scale in purchasing
power
● Synergies realized from
acquisitions

18
($ millions) As at: Dec 31, 2013 Mar 31, 2014
Cash & Equivalents $387.2 $684.7
Financial Results
1 See Summary Non-GAAP Financial Measures slide for reconciliations of Non-GAAP measures
* The guidance provided herein reflects the most recent earnings’ press release and does not imply a reiteration or update of guidance.
(millions, except EPS) Fiscal 2013 Q1 2013 Q1 2014
Fiscal 2014
Guidance*
Revenue $14,780.1 $3,219.7 $4,914.5 $20,000 – 21,000
EBITDA1 $651.1 $143.5 $170.9 $770 – 810
GAAP EPS (f/d) $1.27 $0.25 $0.31 $1.38 – 1.50
ADJ EPS1 (f/d) $2.00 $0.42 $0.50 $2.10 – 2.22

19
Catamaran Growth Strategies
Grow organically by providing flexible solutions to payers to control drug trend and overall healthcare spend
Pull-through of PBM services to clients
Continue to deliver outsized growth in BriovaRx, Catamaran’s specialty pharmacy operation
Empower health plan clients to be successful winning ACA lives
Strategic business combinations and acquisitions
1)
2)
3)
4)
5) 2008 2009 2010 2011 2012 2013
Catamaran Revenue

Thank You
21
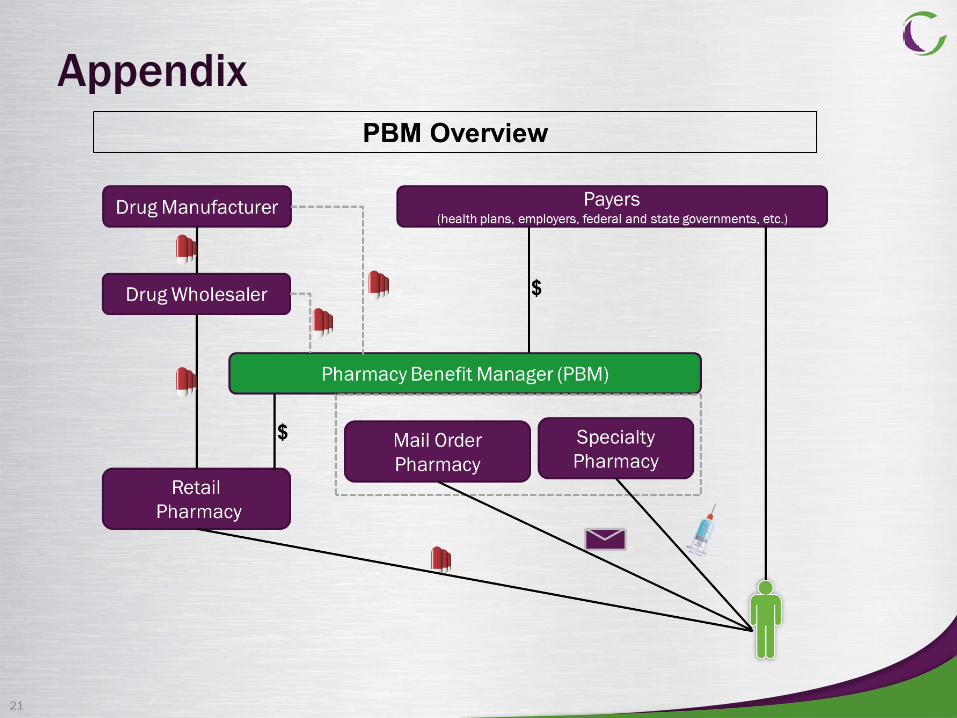
Appendix

22
Catamaran Financial Definitions
EBITDA
Net income attributable to the Company
+/- Income tax expense
+/- Interest and other expense, net
+ Depreciation of property and equipment
+ Amortization of intangible assets
+/- Adjustments related to non-controlling interest
= EBITDA
Adjusted EPS
Net income attributable to the
Company
+ Amortization of intangible
assets (net of tax)
= Non-GAAP net income
attributable to the Company
÷ Weighted avg. diluted shares
= Adjusted EPS (diluted)

23
1Non-GAAP Reconciliations Reconciliations of EBITDA to net income are shown below
EBITDA Reconciliation (in thousands)
Three Months Ended Year Ended
March 31, December 31,
2014 2013 2013
Net Income Attributable to the Company
(GAAP) $63,445 $51,408 $262,170
Add:
Depreciation of Property & Equipment 13,359 8,103 42,232
Amortization of Intangible Assets 54,986 50,056 203,192
Interest and Other Expense, Net 11,336 11,039 41,626
Income Tax Expense 28,108 23,028 103,403
Adjustments related to non-controlling
interest (384) (92) (1,527)
EBITDA $170,850 $143,542 $651,096

24
1Non-GAAP Reconciliations
Adjusted EPS Reconciliation (in thousands, except per share data)
Three Months Ended March 31, Year Ended December 31,
2014 2013 2013
Operational
Results
Per Diluted
Share
Operational
Results
Per Diluted
Share
Operational
Results
Per Diluted
Share
Net Income Attributable to the
Company (GAAP) $63,445 $0.31 $51,408 $0.25 $ 262,170 $ 1.27
Amortization of Intangible Assets 54,986 0.26 50,056 0.24 203,192 0.98
Tax Effect of Reconciling Item (14,681) (0.07) (14,466) (0.07)
(52,220) (0.25)
Non-GAAP Net Income Attributable
to the Company $103,750 $0.50 $86,998 $0.42 $ 413,142 $ 2.00
Reconciliations of GAAP EPS (fully-diluted) to adjusted EPS (fully-diluted) are shown below

25
1Summary Non-GAAP Financial Measures
Non-GAAP Financial Measures
● Catamaran reports its financial results in accordance with generally accepted accounting principles in the United States (“GAAP”). Catamaran’s
management also evaluates and makes operating decisions using various other measures. Such measures are adjusted earnings per share
and EBITDA, which are non-GAAP financial measures. Catamaran’s management believes that these measures provide useful supplemental
information regarding the performance of Catamaran’s business operations.
● Adjusted EPS is a non-GAAP measure which takes earnings per share and adds back the impact of amortization of intangible assets, net of
tax. Amortization of intangible assets arises from the acquisition of intangible assets in connection with the Company’s acquisitions. Catamaran
excludes amortization of intangible assets from adjusted EPS because it believes (i) the amount of such expenses in any specific period may not
directly correlate to the underlying performance of Catamaran business operations and (ii) such expenses can vary significantly between periods
as a result of new acquisitions and full amortization of previously acquired intangible assets. Investors should note that the use of these
intangible assets will contribute to revenue in the future period presented and periods beyond that and should also note that such expense will
recur in future periods.
● EBITDA is a non-GAAP measure that management believes is a useful supplemental measure of operating performance prior to interest and
other expense, net, income taxes, depreciation, and amortization. Management believes it is useful to exclude depreciation, amortization and
interest and other expense, net, as these are essentially fixed amounts that cannot be influenced by management in the short term.
● Management believes that adjusted EPS and EBITDA provide useful supplemental information to management and investors regarding the
performance of the Company’s business operations and facilitate comparisons to its historical operating results. Management also uses this
information internally for forecasting and budgeting as it believes that the measures are indicative of the Company’s core operating
results. Note however, that both items are performance measures only, and do not provide any measure of the Company’s cash flow or
liquidity. Non-GAAP financial measures should not be considered as a substitute for measures of financial performance in accordance with
GAAP, and investors and potential investors are encouraged to review the reconciliation of adjusted EPS and EBITDA in our filings with the SEC.
● Adjusted EPS and EBITDA do not have standardized meanings prescribed by GAAP. The Company's method of calculating adjusted EPS and
EBITDA may differ from the methods used by other companies and, accordingly, it may not be comparable to similarly titled measures used by
other companies. Reconciliations of adjusted EPS and EBITDA to net income is available in our filings with the SEC.