investor meetings july 8, 2016 - s2.q4cdn.com · this presentation is made as of the date hereof...
TRANSCRIPT

Among lowest acquisition cost ever #2 in renewable sales in the Great Lakes area
Cross Winds Energy Park Jackson Generating Station
Fourth largest in the world
Ludington Pumped Storage
Investor Meetings
July 8, 2016

This presentation is made as of the date hereof and contains “forward-looking statements” as defined in Rule 3b-6 of the
Securities Exchange Act of 1934, Rule 175 of the Securities Act of 1933, and relevant legal decisions. The forward-looking
statements are subject to risks and uncertainties. All forward-looking statements should be considered in the context of the risk
and other factors detailed from time to time in CMS Energy’s and Consumers Energy’s Securities and Exchange Commission
filings. Forward-looking statements should be read in conjunction with “FORWARD-LOOKING STATEMENTS AND
INFORMATION” and “RISK FACTORS” sections of CMS Energy’s and Consumers Energy’s Form 10-K for the year ended
December 31, 2015 and as updated in subsequent 10-Qs. CMS Energy’s and Consumers Energy’s “FORWARD-LOOKING
STATEMENTS AND INFORMATION” and “RISK FACTORS” sections are incorporated herein by reference and discuss
important factors that could cause CMS Energy’s and Consumers Energy’s results to differ materially from those anticipated in
such statements. CMS Energy and Consumers Energy undertake no obligation to update any of the information presented
herein to reflect facts, events or circumstances after the date hereof.
The presentation also includes non-GAAP measures when describing CMS Energy’s results of operations and financial
performance. A reconciliation of each of these measures to the most directly comparable GAAP measure is included in the
appendix and posted on our website at www.cmsenergy.com.
CMS Energy provides historical financial results on both a reported (GAAP) and adjusted (non-GAAP) basis and provides
forward-looking guidance on an adjusted basis. Management views adjusted earnings as a key measure of the company’s
present operating financial performance, unaffected by discontinued operations, asset sales, impairments, regulatory items from
prior years, or other items. These items have the potential to impact, favorably or unfavorably, the company's reported earnings
in future periods.
Investors and others should note that CMS Energy routinely posts important information on its website and considers the
Investor Relations section, www.cmsenergy.com/investor-relations, a channel of distribution.
1

. . . . serving customers for 130 years. 2
Consumers Energy . . . .
#4 largest combination utility (electric
and gas) in the country
#403 Fortune 500 company
#2 Investor in Michigan
Overview
Our Service Territory
• Electric Utility
1.8 million electric customers
8,900 MW of capacity
• Gas Utility
1.7 million gas customers
309 bcf gas storage (#1 in the U.S.)
Lake Winds Energy Park
Cross Winds Energy Park
Jackson
Generating
Station
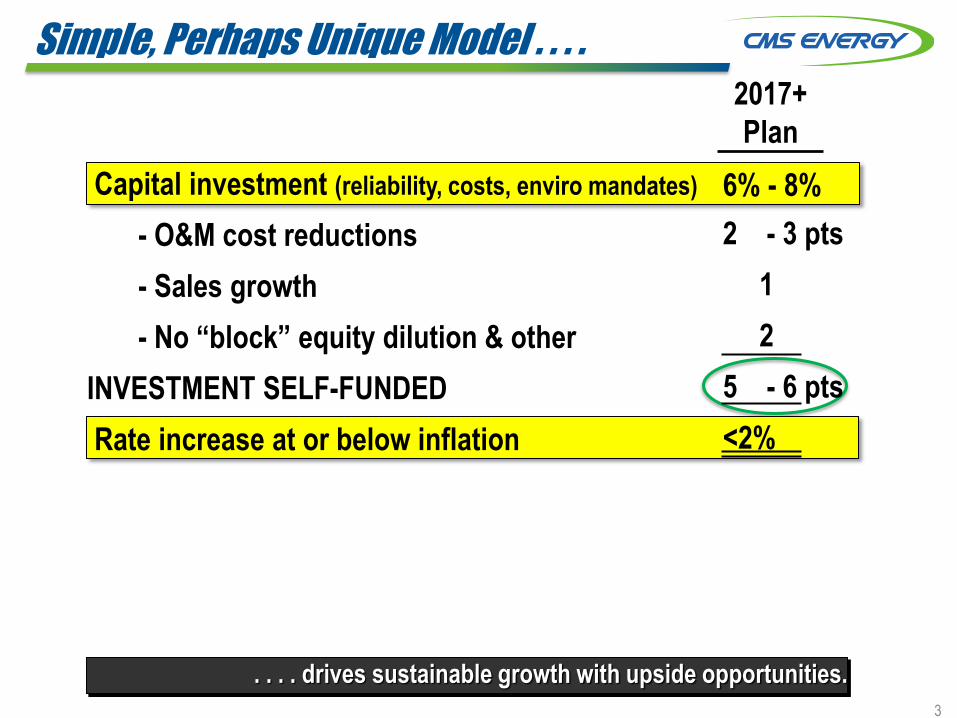
Simple, Perhaps Unique Model . . . .
Capital investment (reliability, costs, enviro mandates)
- O&M cost reductions
- Sales growth
- No “block” equity dilution & other
INVESTMENT SELF-FUNDED
Rate increase at or below inflation
2017+
Plan
6% - 8%
. . . . drives sustainable growth with upside opportunities.
3
2 - 3 pts
1
2
5 - 6 pts
<2%

Capex $17 Billion Over 10 Years . . . .
4
. . . . without raising base rates above inflation.
2016-2025
Electric
Infrastructure &
Maintenance
Gas
Infrastructure &
Maintenance
New
Generation
Environmental
Electric
Distribution &
Reliability
2016-2025
Improving
Service
How this
adds value!
Customer Investor AND
Reducing
Cost
Cleaner
Energy
Enhancing
Productivity

. . . . adds substantial customer value.
Customer Benefit Drivers
Electric reliability; digital
customer experience
Smart meters; proactive gas
infrastructure replacement
Gas compression upgrades; field
service technology tools
Gas plant expansion & more
renewables
Capex $17 Billion Over 10 Years . . . .
2016-2025
Improving
Service
Customer
Reducing
Cost
Cleaner
Energy
Enhancing
Productivity
5

O&M Cost Performance . . . .
Actual Cost Reduction
Consumers
- - - - - Source: SNL, Form 1, Electric Non-fuel O&M
Peer Average ~5%
(2015 over 2006)
New Cost Savings
•Attrition $ - 35 $ - 35
•Productivity (Coal Gas) - 35 - 15
• “Pole Top” Hardening - 20 - 10
•Smart Meters - 5 - 20
•Eliminate Waste (UAs)
& Work Management
- 15 - 10
•Mortality Tables &
Discount Rates
+50 0
•Service Upgrades +20 + 30
Net savings $ - 40 $ - 60
Percent savings - 4% - 6%
2014
& 2015 2016
& 2017 (mils) (mils)
. . . . driven by good “business decisions.”
-2.7%
3% a year!
6

O&M Cost Performance . . . .
. . . . opportunities to improve even more.
(Electric Distribution Cost Per Customer)
2014 2015
1st Quartile
3rd Quartile
2nd Quartile
4th Quartile
Consumers
($97)
Where We Can Improve More How We Will Do It
Build the job as
designed
Accurately schedule
the job
“Field services” project
- - - - - Source: SNL, Form 1, Electric Non-fuel O&M, 2014 DCO normalized for Polar Vortex
$30 mil to go until 1st Quartile
Consumers
($100)
7

The Consumers Energy Way . . . .
. . . . a culture of continuous improvement.
Operational Performance
Safety
Price competitiveness
Environmental stewardship
Customer satisfaction
Value Creation
Short-term: eliminate waste to fund
value
Long-term: topline growth
New offerings
M&A
Business and customer
attraction and growth
6% - 8% Growth
CUSTOMER
FOCUS
ENABLED
EMPLOYEES
CONTINUOUS
IMPROVEMENT
STANDARDIZED
PROCESSES
BUSINESS
RESULTS
Extraordinary Outcomes Vision & Strategy Disciplined System for How
Quality: We get it right the first time Cost: We see and eliminate waste
Delivery: We get it done on time
8
_ _ _ _ _
a Capital Investment
a

9
Operating Cash Flow Growth . . . .
(0.8)
(0.3)
0.2
0.7
1.2
1.7
2.2
2.7
2014 2015 2016 2017 2018 2019 2020
Amount
(bils)
$
Investment
Cash flow before dividend _ _ _ _ _
a Non-GAAP
NOLs & Credits $0.7 $0.7 $0.8 $0.8 $0.7 $0.4 $0.1
. . . . up about $100 million a year; no “block” equity due to tax benefits.
$2.4
Interest, working capital and taxes
$1.8
$2.7
$1.6
$2.0 $2.2
Gross operating cash flowa up $0.1 billion per year $2.5
Up $0.8 Billion
$1.9

Regulatory Track Record . . . .
. . . . continues to be constructive. 10
Electric Rate Cases
Gas Rate Cases
10.3%
Year Step Amount
(mils)
Capex ROE Step Amount
(mils)
Capex
2012 Settled $16 188% Order $118 110%
2013 Stay-out Settled 89 127
2014 Stay-out Stay-out
2015 Settled 45 200 Order 126 137
2016 Settled 40 158 Filed 225 72
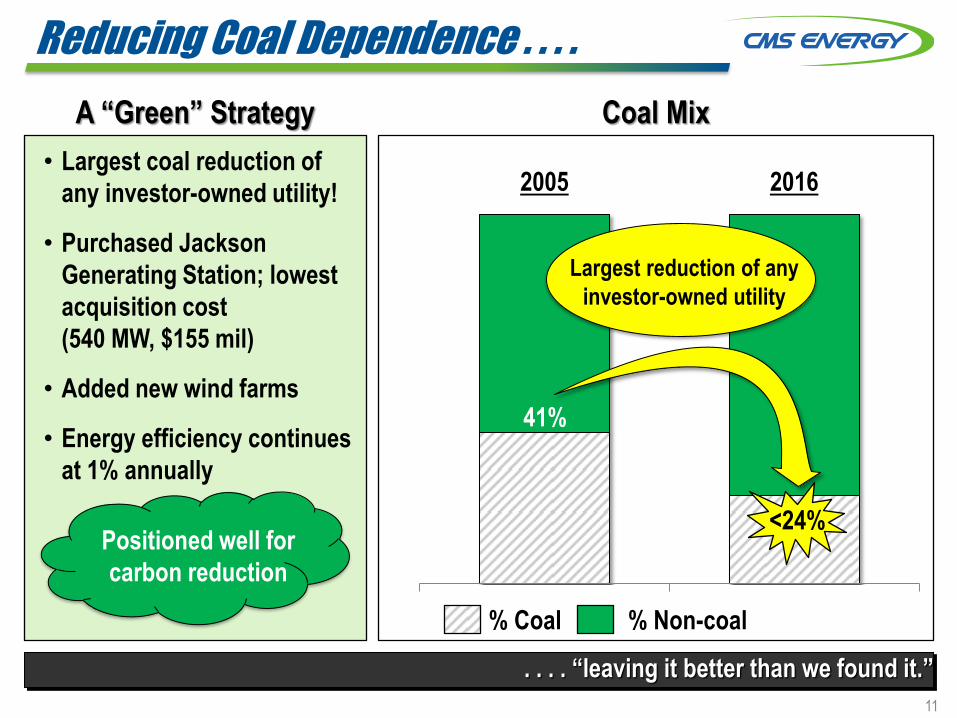
• Largest coal reduction of
any investor-owned utility!
• Purchased Jackson
Generating Station; lowest
acquisition cost
(540 MW, $155 mil)
• Added new wind farms
• Energy efficiency continues
at 1% annually
Reducing Coal Dependence . . . .
. . . . “leaving it better than we found it.”
A “Green” Strategy Coal Mix
2005 2016
<24%
% Coal % Non-coal
11
Positioned well for
carbon reduction
41%
Largest reduction of any
investor-owned utility

“DIG” (750 MW) & Peakers (200 MW) . . . .
. . . . adding value. 12
0
10
20
30
40
50
60
70
80
2015 2016 2017
Pre-Tax Income (mils)
$12
$20
$35
Outage
pull-ahead
New
contracts
Future
Opportunities
Capacity ($/kw-mth) ≈ $1.00 ≈ $2.00 ≈ $3.00 $4.50 $7.50
Available:
• Energy • Capacity
0% 0% 25% 25%
0 10 25
$
+$20
+$40
Contracts
(layering in over time)
$75
$55
50% - 90%

Consistent Growth Through . . . .
13
2003 2004 2005 2006 2007 2008 2009 2010 2011 2012 2013 2014 2015 2016 2017
Recession
Governor (R) Governor (D)
Commission (D) Commission (R)
Recession
7% CAGR
Polar
vortex
Cold
Feb.
Mild
summer
Warm
winter
Hot
summer
Hot
summer Cold
winter
Cold
winter
Summer-
“less” Mild
summer Mild
summer
Commission (D)
Hurt
Help
EPS
_ _ _ _ _
a Adjusted EPS (non-GAAP)
a
Warm
winter
Hot
summer
Dividend
Weather
. . . . recessions, adverse weather, and policy leadership.
Whipple Joos Russell Poppe
Cold Feb.
Warm Dec.
Warm
Winter
Appendix

15
CMS Capital Expenditures
2016-2020 2021-2025 2016-2025
2016 2017 2018 2019 2020 Subtotal Subtotal Total
(mils) (mils) (mils) (mils) (mils) (mils) (mils) (mils)
New Generation (includes Renewables) 87$ 72$ 59$ 43$ 31$ 292$ 1,378$ 1,670$
Environmental 122 143 121 178 133 697 2 699
Electric Reliability & Distribution 443 416 351 417 370 1,997 1,414 3,411
Electric Maintenance 442 433 477 472 454 2,278 2,714 4,992
Total Electric 1,094$ 1,064$ 1,008$ 1,110$ 988$ 5,264$ 5,508$ 10,772$
Gas Infrastructure 237$ 353$ 397$ 398$ 377$ 1,762$ 1,132$ 2,894$
Gas Maintenance 331 322 307 304 299 1,563 1,771 3,334
Total Gas 568$ 675$ 704$ 702$ 676$ 3,325$ 2,903$ 6,228$
Total Electric & Gas 1,662$ 1,739$ 1,712$ 1,812$ 1,664$ 8,589$ 8,411$ 17,000$

Generation Strategy: New Supply Sources . . . .
0
5
10
15
20
25
Coal Nuclear
. . . . combined cycle gas is the most attractive new source of supply.
Levelized cost
of new build
(¢/kWh)
Gas price= $3.00 $4.50 $6.00 W/ tax
credit
W/o tax
credit
W/ emission
controls
Today
$3.00 per
watt
5¢ 6¢
7¢ 6¢ 9¢
10¢
12¢
22¢
8¢ Back
-up
11¢ Back
-up
6¢
Wind Combined Cycle Gas Plant Residential Solar
15¢
Future
$2.00 per
watt?
Consumers Energy Sources
5¢
7¢ 5.5¢
New Build
Zee
lan
d
Cro
ss W
ind
s
6¢
Big
5
Pal
isad
es
16

Coal 41%
Gas 31%
Pumped Storage
11%
Renewables 3%
Oil 6% Nuclear
8%
Capacity Diversity . . . .
Coal <24%
Gas 34%
Pumped Storage
11%
Renewables 10%
Purchases 3%
Oil 10%
Nuclear 8%
. . . . evolving to cleaner generation and becoming more cost competitive. 17
Coal reduced
by over 40%!
2nd best in U.S.
2005
2016
• More Renewables
• Expanded Pumped
Storage
• Clean Energy
Resources
Future Capacity Mix

18
Clean Power Plan . . . .
. . . . recently stayed by the U.S. Supreme Court.
10
11
12
13
14
15
16
17
18
19
20
2015 2016 2017 2018 2019 2020 2021 2022 2023 2024 2025 2026 2027 2028 2029 2030
Retire
950 MW
coal
Tons CO2
(mils)
0
Consumers Energy 2012 Emissions
State of Michigan Target
(Consumers Energy’s share)
Positioned well for compliance

19
Electric Customer Prices . . . .
-25
-15
-5
5
15
2013 2014 2015 2016
Residential Bills Industrial Rates
(13)% (18)%
National Avg
20%
Rates Rates &
Fuel
-30
-20
-10
0
10
20
30
2013 2014 2015 2016
26%
Midwest Avg
%
5%
Rates &
Fuel
Flat
(7)%
Plus
. . . . affordable for residential and improving for industrial customers.
Plus
(22)%
Policy could
eliminate gap
Rates &
Act 169
Rates &
Act 169
Residential bills well below U.S. average
Worse Worse
Better Better

20
Economic Development Growth . . . .
Auto 71
Food 20
Manufacturing 53
Metal 28
Petroleum 19
Plastics 18
Others 49
Industries MW
Total Up ~258
. . . . includes 4% of additional sales growth.
Examples of New Business
Electric Gas Combination
MSU FRIB
Durolast Roofing
GM Assembly
General Motors Flint & Grand Rapids
• Assembly and
Components Plants
• 350 jobs created
• $1.4 billion investment
Announcement
Enbridge
MACI
Dart
Brembo Denso
WKW
Post
Magna-Cosma
Dicastal
Continental Dairy
Arauco
Switch
• Largest data center in
eastern U.S.
• 1,000 jobs created
• $5 billion investment
Announcement
Betz
Knauf
21
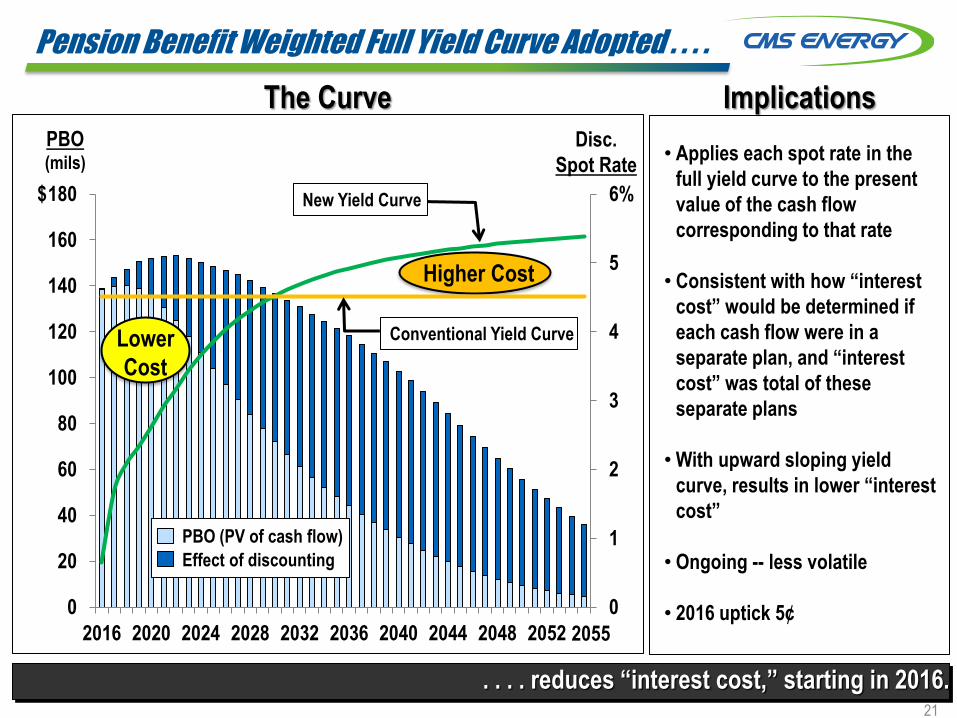
Pension Benefit Weighted Full Yield Curve Adopted . . . .
. . . . reduces “interest cost,” starting in 2016.
Implications
• Applies each spot rate in the
full yield curve to the present
value of the cash flow
corresponding to that rate
• Consistent with how “interest
cost” would be determined if
each cash flow were in a
separate plan, and “interest
cost” was total of these
separate plans
• With upward sloping yield
curve, results in lower “interest
cost”
• Ongoing -- less volatile
• 2016 uptick 5¢
The Curve
0%
1%
2%
3%
4%
5%
6%
0
20
40
60
80
100
120
140
160
180
2016 2020 2024 2028 2032 2036 2040 2044 2048 2052
PBO (mils)
Disc.
Spot Rate
New Yield Curve
2055
Conventional Yield Curve
$
PBO (PV of cash flow)
Effect of discounting
Higher Cost
Lower
Cost

22
Bonus Depreciation . . . .
. . . . helpful at CMS.
Summary Improved Plan
10-Year
Capex No “Block” Equity
Bonus Depreciation
• 6 years already
• New 5 years!
– $600 mil shelter
Capital Investment
• Add $1.5 billion
– Electric reliability
– Gas infrastructure
– Clean energy
NOLs
• Extended point of use
• Avoids “block” equity
NEW
10 Years
$15.5 bil
$17 bil
PRIOR
7 Years
5 Years

23
Credit Ratings . . . .
. . . . show continuous improvement.
•Consistent
Performance
•Less Risk
•Customer Focus
•Constructive
Regulation
•Good Energy
Policy
Reflects
Present
Prior
2002
Consumers Secured
CMS Unsecured
Scale
S&P /
Fitch Moody’s
S&P
(Dec. ‘15)
Moody’s
(Mar. ‘16)
Fitch
(Mar. ‘16)
A+ A1
A A2
A- A3
BBB+ Baa1
BBB Baa2
BBB- Baa3
BB+ Ba1
BBB Baa2
BBB- Baa3
BB+ Ba1
BB Ba2
BB- Ba3
B+ B1
B B2
B- B3
Outlook Stable Positive Stable

24
. . . . “Autos” only 5% of gross margin.
Electric Customer Base Diversified . . . .
1. Hemlock Semiconductor
2. General Motors
3. Nexteer Automotive Corporation
4. Gerdau
5. Denso International
6. Meijer
7. State of Michigan
8. Spectrum Health
9. AT&T
10. Packaging Corp. of America
Percentage of electric gross margin is 2.8%
Top Ten Customers
$2.3 Billion
2015 Electric Gross Margin
Other
4%
Industrial
9%
Commercial
32% Residential
50%
(2015 Ranked by Deliveries)
Auto
5%

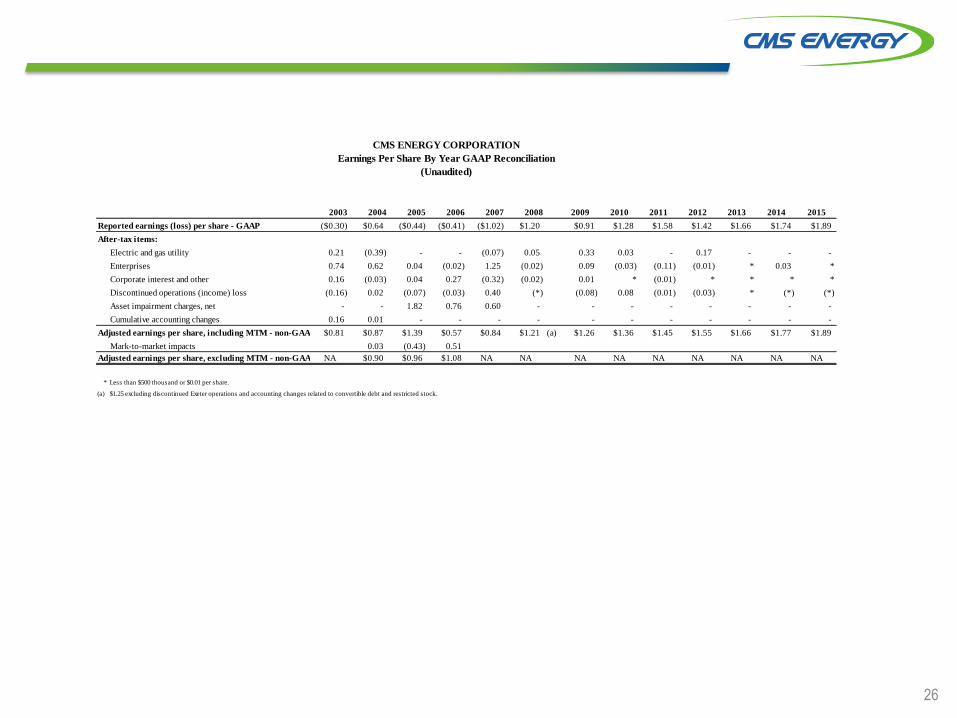
GAAP Reconciliation
26
2003 2004 2005 2006 2007 2008 2009 2010 2011 2012 2013 2014 2015
Reported earnings (loss) per share - GAAP ($0.30) $0.64 ($0.44) ($0.41) ($1.02) $1.20 $0.91 $1.28 $1.58 $1.42 $1.66 $1.74 $1.89
After-tax items:
Electric and gas utility 0.21 (0.39) - - (0.07) 0.05 0.33 0.03 - 0.17 - - -
Enterprises 0.74 0.62 0.04 (0.02) 1.25 (0.02) 0.09 (0.03) (0.11) (0.01) * 0.03 *
Corporate interest and other 0.16 (0.03) 0.04 0.27 (0.32) (0.02) 0.01 * (0.01) * * * *
Discontinued operations (income) loss (0.16) 0.02 (0.07) (0.03) 0.40 (*) (0.08) 0.08 (0.01) (0.03) * (*) (*)
Asset impairment charges, net - - 1.82 0.76 0.60 - - - - - - - -
Cumulative accounting changes 0.16 0.01 - - - - - - - - - - -
Adjusted earnings per share, including MTM - non-GAAP $0.81 $0.87 $1.39 $0.57 $0.84 $1.21 (a) $1.26 $1.36 $1.45 $1.55 $1.66 $1.77 $1.89
Mark-to-market impacts 0.03 (0.43) 0.51
Adjusted earnings per share, excluding MTM - non-GAAP NA $0.90 $0.96 $1.08 NA NA NA NA NA NA NA NA NA
* Less than $500 thousand or $0.01 per share.
(a) $1.25 excluding discontinued Exeter operations and accounting changes related to convertible debt and restricted stock.
CMS ENERGY CORPORATION
Earnings Per Share By Year GAAP Reconciliation
(Unaudited)

27
2014 2015 2016 2017 2018 2019 2020
Consumers Operating Income + Depreciation & Amortization 1,813$ 1,866$ 2,030$ 2,161$ 2,336$ 2,481$ 2,613$
Enterprises Project Cash Flows 20 20 35 58 58 63 70
Gross Operating Cash Flow 1,833$ 1,886$ 2,065$ 2,219$ 2,394$ 2,544$ 2,683$
(386) (246) (515) (569) (644) (694) (733)
Net cash provided by operating activities 1,447$ 1,640$ 1,550$ 1,650$ 1,750$ 1,850$ 1,950$
CMS Energy
Reconciliation of Gross Operating Cash Flow to GAAP Operating Activities
(unaudited)(mils)
Other operating activities including taxes, interest payments and
working capital

INVESTOR INFORMATION
CMS Energy Corporation Phil McAndrews (517) 788-1464
Investor Relations Department Travis Uphaus (517) 768-3114
One Energy Plaza, Jackson, MI 49201 www.cmsenergy.com
CU
ST
OM
ERS
IN
VES
TO
RS
Electric Customer Prices . . . .
-25
-15
-5
5
15
2013 2014 2015 2016
Residential Bills Industrial Rates
(13)% (18)%
National Avg
20%
RatesRates &
Fuel
-30
-20
-10
0
10
20
30
2013 2014 2015 2016
26%
Midwest Avg
%
5%
Rates &
Fuel
Flat
(7)%
Plus
. . . . affordable for residential and improving for industrial customers.
Plus
(22)%
Policy could
eliminate gap
Rates &
Act 169
Rates &
Act 169
Residential bills well below U.S. average
WorseWorse
Better Better
AN
D
Managing Work Every Year . . . .
$1.30
$1.40
$1.50
$1.60
$1.70
$1.80
$1.90
$2.00
$2.10
2012 2013 2014Adjusted
EPS
-13¢
+17¢
Hot
Summer
+18¢
Polar Vortex
Cold
Winter
Cost
Savings
Mild
Winter
+1¢
2011
Hot
Summer
Storms
2015
. . . . maximizes benefits for customers AND investors.
+13¢ +7¢
Reinvestment
Reinvestment
Reinvestment
Cold
Winter
Reinvestment
Mild
Summer
-13¢
RECORD
WARM
OffsetsIce Storm
ICE
STORM
+7%
+7%
+7%
+7%
+7%
-9¢
2013 – 2015
Customer Reinvestment =
$238 million
July 2016
• 13 year track record
(EPS and dividend growth)
• Capex -- $17 billion, 100% organic
(increased by $1.5 billion)
• Self-funded -- No block equity
dilution! (7 years -- up from 5!)
• World-class cost performance
• Conservative sales planning
(under promise/over deliver)
• $3+ billion capex opportunities
(w/o Law update!)
OUTPERFORMED FOR A DECADE:
NEXT DECADE EVEN BRIGHTER
OUR MODEL; OUR PLAN
The Consumers Energy Way
• Quality: we get it right the first time
• Cost: we see and eliminate waste
• Delivery: we get it done on time
. . . . a culture of continuous improvement.

Adjusted EPS
Gross OCF
Dividend
CapEx
CMS
O&M Cost
Electric Sales
(Ind. /Total )
Energy Policy • Energy efficiency standards
• File and implement
• 10% renewables by 2015
• 10% ROA cap
2008 Law
2003 2010 2011 2012 2013 2014 2015 2016 2017 2018 2019 2020
2010 - 2013 2014 2016 2016 - 2020
+1% sales = $20 mil OCF = 5¢ EPS
Self-funded (No block equity dilution)
+ $0.8 $1.9 $2.7
Base Rate Increase
2016 - 2025
$17 B
Down 7%
5%
1%
8.7%
2.8% 3% 1%
$1.1 $0.9
~$0.9
< 2%
Conservative
• Fewer outages, reduce minutes
• Smart meters, reduced costs
• Improve work management, first time quality
• Reduce coal, improve environmental quality
• More renewables, reduce carbon
Gas Infrastructure
Electric Reliability
Environmental
New Generation
Electric Maintenance
2006 2014 2018
(bils)
(bils)
Percent of Mkt Cap
Peers
• IRP Process
• Fair Prices
- Eliminate ROA subsidy
($150 million or 4% customer savings)
Customer Benefits
Peers up 42%
Actual Plan Model
Int’l Sale
$1.0
1% 4%
7% /year
+ $1.0
This placemat contains “forward-looking statements”; please refer to our SEC filings for information regarding the risks and uncertainties that could cause our results to differ materially. It also contains non-GAAP measures. Reconciliations to most directly comparable GAAP measures are found on our website at www.cmsenergy.com
a
a
a Adjusted Non-GAAP as of April 28, 2016 As of January 2016
b
b
20¢ 36¢ 50¢
66¢ 84¢ 96¢ $1.02 $1.08 $0.81 $0.90 $0.96
$1.08
$0.84
$1.21 $1.26 $1.36 $1.45 $1.55 $1.66
2003 2004 2005 2006 2007 2008 2009 2010 2011 2012 2013 2014 2015 2016 Future
Update Features
$1.77 $1.89
$1.16
b
Down 10%
The Results
2 - 3 pts
1
2
5 - 6 pts
< 2 %
2017+ Plan
6% - 8% Capital investment
- O&M cost reductions
- Sales growth
- No “block” equity
dilution & other
INVESTMENT
(SELF-FUNDED)
Rate increase
2009 2010 2011 2012 2013 2014 2015 2016 Future
CMS Avg = 7%
a
• Attrition $ - 35 $ - 35
• Productivity (Coal Gas) - 35 - 15
• “Pole Top” Hardening - 20 - 10
• Smart Meters - 5 - 20 • Work Management - 15 - 10
• Discount Rates Plus +50 0
• Service Upgrades +20 + 30
Net Savings $ - 40 $ - 60
Percent Savings - 4% - 6%
New Cost Savings (mils) 2014 & 15 2016 & 17
Cost Reduction (2015 over 2006)
Peer Avg ~5%
Consumers
-2.7%!
-3%/ yr - - - - - Source: SNL, Form 1, Electric Non-fuel O&M
(1.0)(0.5)0.00.51.01.52.02.53.0
2014 2015 2016 2017 2018 2019 2020
Operating Cash Flow
Investment
$1.6
NOLs & Credits $0.8 $0.8 $0.7 $0.4 $0.1
$1.8 $2.0 $2.2 $2.4 $2.5 $2.7
a
Amount (bils)
Cash Flow Before Dividend
$1.9
Base Rates = 1.7%
OCF
Up
$0.1 bil +
per
year!
$
0
Update
not in plan
Investor Customer
2016 - 2025
$17 B Value Improving Service
Reducing Cost
Enhancing Productivity
Cleaner Energy
18%
16
• Clean Power
• Gas Infrastructure
• Grid Modernization
• PPA Replacement
Upside
Up $0.8!