investor day 2012 - issuer directedg1.precisionir.com/.../na013184/pembinadec12investorday.pdf ·...
TRANSCRIPT

INVESTOR DAY 2012
TSX: PPL
NYSE: PBA December 4, 2012

FORWARD-LOOKING STATEMENTS & INFORMATION
This presentation is for information purposes only and is not intended to, and should not be construed to constitute, an offer to sell or the
solicitation of an offer to buy, securities of Pembina Pipeline Corporation. This presentation and its contents should not be construed, under
any circumstances, as investment, tax or legal advice. Any person accepting delivery of this presentation acknowledges the need to conduct
their own thorough investigation into Pembina and its activities before considering any investment in its securities.
In the interest of providing investors with information regarding Pembina, including management's assessment of Pembina's future plans and
operations, certain statements and information contained in this presentation constitute forward-looking statements or information within the
meaning of the "safe harbour" provisions of applicable securities legislation. Such forward-looking information and statements relate to
business strategy and plans, financial performance, the stability and sustainability of cash dividends, expansion and diversification
opportunities and other expectations, beliefs, goals, objectives, assumptions or statements about future events or performances. Undue
reliance should not be placed on these forward-looking statements and information as both known and unknown risks and uncertainties may
cause actual performance and financial results to differ materially from the results expressed or implied.
Forward-looking statements and information are based on Pembina Pipeline Corporation's expectations, estimates, projections and
assumptions in light of its experience and its perception of historical trends as well as current market conditions and perceived business
opportunities. These statements are not guarantees of future performance and are subject to a number of known and unknown risks and
uncertainties including but not limited to: the impact of competitive entities and pricing; reliance on key alliances and agreements; the strength
and operations of the oil and natural gas industry and related commodity prices; regulatory environment; fluctuations in operating results; the
availability and cost of labour and other materials; the ability to finance projects on advantageous terms; and tax laws and tax treatment.
Additional information on these factors as well as other factors that could impact Pembina's operational and financial results are contained in
Pembina's Annual Information Form and Management's Discussion and Analysis, and described in our public filings available in Canada at
www.sedar.com and in the United States at www.sec.gov. Readers are cautioned that this list of risk factors should not be construed as
exhaustive.
The forward-looking statements contained in this document speak only as of the date of this document. Except as expressly required by
applicable securities laws, Pembina and its subsidiaries assume no obligation to update forward-looking statements and information should
circumstances or management's expectations, estimates, projections or assumptions change. The forward-looking statements contained in
this document are expressly qualified by this cautionary statement.
In this presentation, we refer to certain financial measures such as total enterprise value and operating margin that are not determined in
accordance with International Financial Reporting Standards ("Canadian GAAP"). For more information about these non-GAAP measures, see
note 1 in the Appendix to this presentation. All financial information is expressed in Canadian dollars unless otherwise specified.
2

AGENDA
3
Introduction Scott Burrows
Midstream – NGL Bob Lock
Overview & Value Proposition Bob Michaleski
Midstream – Crude Oil Bob Jones
Strategy & Focus Mick Dilger
Dedicated to Pipeline & Facility Integrity Allan Charlesworth
Commodity Update Murray Buchanan
Dedicated to Stakeholders Bob Michaleski
Oil Sands & Heavy Oil Michael Hantzsch
Stable Financial Platform Peter Robertson
Gas Services Stuart Taylor
Conclusion Mick Dilger
Conventional Pipelines Paul Murphy
Lunch
Break
One-on-One Meetings

OVERVIEW & VALUE PROPOSITION
Bob Michaleski

PEMBINA ATTENDEES
5
Bob Michaleski
Chief Executive Officer
Paul Murphy
Vice President, Conventional Pipelines
Stuart Taylor
Vice President, Gas Services
Bob Jones
Vice President, Midstream
Scott Burrows Senior Manager, Corporate Development
& Planning
Mick Dilger
President & Chief Operating Officer
Peter Robertson Vice President, Finance & Chief Financial
Officer
Bob Lock
Vice President, Natural Gas Liquids
Allan Charlesworth Vice President, Integrity & Technical
Services
Michael Hantzsch
Vice President, Oil Sands & Heavy Oil
Murray Buchanan
Vice President, Strategy & New Ventures

CORPORATE PROFILE
6
Common Shares Outstanding (1) 292.3 million
Current Common Share Trading Price (1) $27.79
52-Week Trading Range $24.86 - $31.15
Market Capitalization (1) $8.1 billion
Total Enterprise Value (1) $10.8 billion
Annualized Dividend $1.62/share
Effective Yield (1) 5.8%
Corporate Credit Rating BBB
(1) As at November 27, 2012.
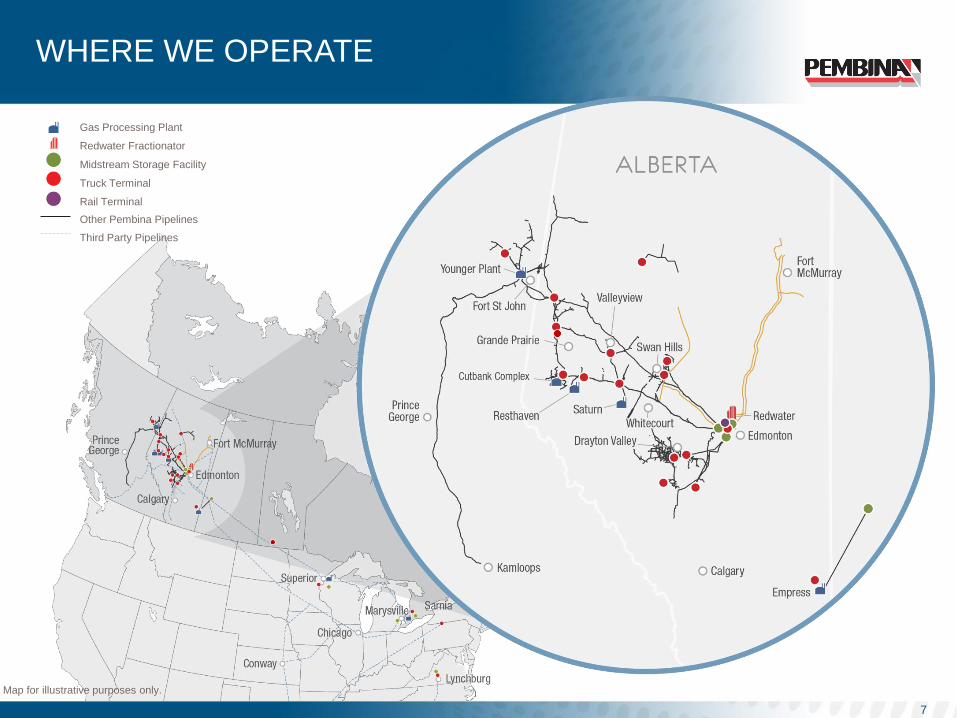
WHERE WE OPERATE
7
Map for illustrative purposes only.
Gas Processing Plant
Redwater Fractionator
Midstream Storage Facility
Truck Terminal
Rail Terminal
Other Pembina Pipelines
Third Party Pipelines

OBJECTIVE & STRATEGY
Objective:
To provide highly competitive and reliable
returns to investors through monthly
dividends while enhancing the long-term
value of its shares. Pembina's strategy is to:
Preserve value by providing safe, cost-
effective, reliable services
Diversify our asset base along the
hydrocarbon value chain to provide
integrated service offerings which enhance
profitability and customer service
Implement growth by pursuing projects or
assets that are expected to generate cash
flow per share accretion and capture long-
life, economic hydrocarbon reserves
Maintain a strong balance sheet with
prudent financial management to all
business decisions
8

9
VALUE PROPOSITION
Efficient and well-managed assets
One of Canada's largest and most diversified energy infrastructure companies
Industry Leader
Growing demand for NGL and crude oil midstream services
Resurgence of conventional plays
Strong Demand for our Services
Large integrated asset footprint with growth potential Substantial portfolio of diversified growth opportunities Assets ideally located for increased development
Well Positioned for Growth
Track record of solid performance Strong balance sheet Stable, low-risk asset base dominated by fee-for-service revenue
Solid Business Platform

10
STRONG MARKET PERFORMANCE
490
%
total
return(1)
17.8
% average
compound
annual return(1)
4 % CAGR
in dividends
per share(1)
$2.3
billion in
dividends paid
since inception
(1) 2002 – Q3 2012.

-
$100
$200
$300
$400
$500
-
$0.50
$1.00
$1.50
$2.00
2003 2004 2005 2006 2007 2008 2009 2010 2011
Op
era
tin
g M
arg
in (
$M
M)
Cas
h F
low
($ p
er
sh
are
)
CFPS Operating Margin
STRONG FINANCIAL PERFORMANCE
11
9
% CAGR in CFPS 2003 – 2011
13
% CAGR in operating margin 2003 – 2011

FOUR GROWTH PLATFORMS
12
Conventional Pipelines
Oil Sands & Heavy Oil
Gas Services
Midstream
Growth across the hydrocarbon value chain

DELIVERING ON OUR PROMISES
13
See "Forward-Looking Statements & Information.”
-
$500
$1,000
$1,500
$2,000
$2,500
$3,000
$3,500
Investor Day 2010
Capital Budget Presentation
2012
2011 2012F 2013 Budget 2014F+
Cap
ital E
xp
en
dit
ure
s (
$M
M)
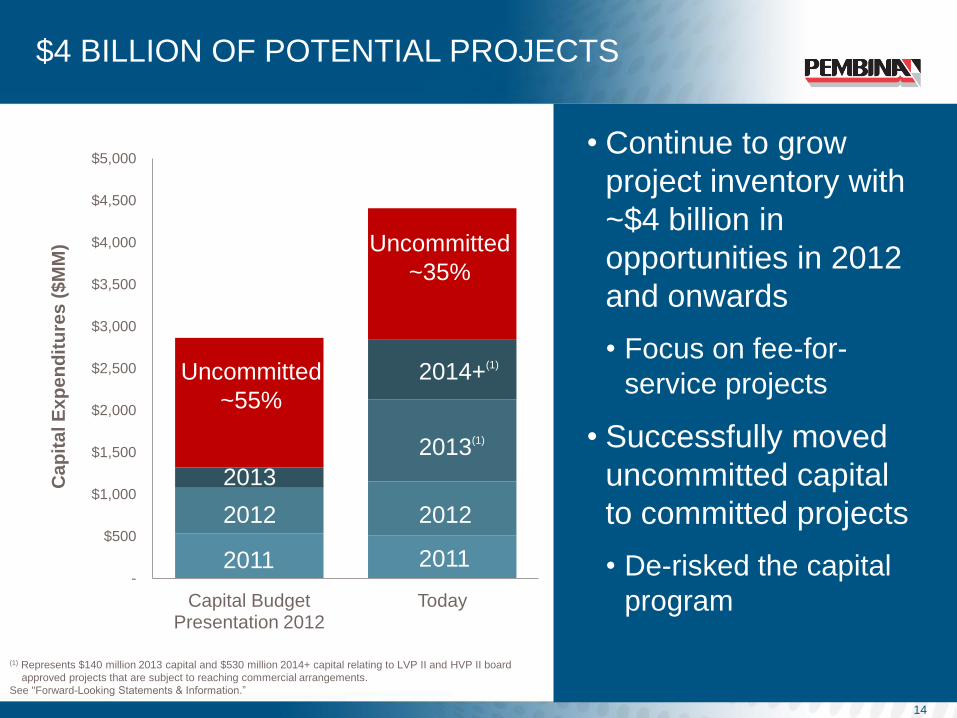
$4 BILLION OF POTENTIAL PROJECTS
• Continue to grow
project inventory with
~$4 billion in
opportunities in 2012
and onwards
• Focus on fee-for-
service projects
• Successfully moved
uncommitted capital
to committed projects
• De-risked the capital
program
14
-
$500
$1,000
$1,500
$2,000
$2,500
$3,000
$3,500
$4,000
$4,500
$5,000
Capital Budget Presentation 2012
Today
Ca
pit
al E
xp
en
dit
ure
s (
$M
M)
Uncommitted
~55%
Uncommitted
~35%
2011
2012
2013
2011
2012
2013(1)
2014+(1)
(1) Represents $140 million 2013 capital and $530 million 2014+ capital relating to LVP II and HVP II board
approved projects that are subject to reaching commercial arrangements.
See "Forward-Looking Statements & Information.”

GROWTH TRAJECTORY
• Anticipate growth
across all four
business units
largely underpinned
by customer
agreements
• Diverse asset base
and critical mass in
all businesses
allows for asset
optimization and
greater resource
capture
15
(1) A portion of which is subject to reaching commercial arrangements.
See "Forward-Looking Statements & Information.”
-
$200
$400
$600
2013 2014 2015 2016 Uncommitted 2013 - 2017
HVP/LVP Expansion Other CBU Growth
Saturn/Resthaven Nipisi/Mitsue Expansion
FST Strategy Nexus Terminal
Cavern and Other Uncommitted opportunities
Op
era
tin
g M
arg
in (
$M
M)
(1)

80%
11%
9%
Cost-of-Service & Fee-for-Service
Product Margin
Frac Spread
2016F(1,2)
SECURING OPERATING MARGIN
16
By 2016
of operating income
will be fee-for-service
or cost-of-service
Fee-for-service focused capital program
80%
(1) Represents committed capital. (2) Price deck based on the forward curve as at October 9, 2012.
See "Forward-Looking Statements & Information.”
Growing our fee-for-service and
cost-of-service business by 80% by 2016

STRATEGY & FOCUS
Mick Dilger

HIGHLY INTEGRATED BUSINESS
18
Gas/NGL
Conventional
Consumption Distribution Downstream
Upgrading
Mining/In-situ Field
Upgrading
Feeder
Pipelines Refining Collection,
Storage,
Distribution,
Marketing
Consumption Production Feeder
Pipelines
Field
Handling &
Treatment
Refining Distribution Collection,
Storage &
Distribution
Hub
Collection,
Storage,
Distribution,
Marketing
Oil Sands &
Heavy Oil
New Services
Traditional
NGL Focus
Mid
stre
am
& M
ark
etin
g C
ross C
om
mo
dity
Arb
itrag
e
Production Feeder
Pipelines Main-Line
Extraction
Collection,
Storage,
Marketing
Fractionation Logistics
& Distribution
Consumption Field
Handling &
Processing
New Services

MAJOR GEOLOGICAL PLAYS (WCSB)
19
Map for illustrative purposes only.
Gas Processing Plant
Redwater Fractionator
Midstream Storage Facility
Truck Terminal
Rail Terminal
Other Pembina Pipelines
Third Party Pipelines

MAJOR GEOLOGICAL PLAYS NATURAL GAS
20
Pembina operates within some of the most economical
natural gas resources plays in Canada
Source: Scotiabank.
Note: Red indicates fields that Pembina participates in.
-
$1.00
$2.00
$3.00
$4.00
$5.00
$6.00
Bre
ak
eve
n (
$/m
cf)

MAJOR GEOLOGICAL PLAYS CRUDE OIL
21
Fields that Pembina participates in:
-
$10
$20
$30
$40
$50
$60
$70
$80
$90
Bre
ak
eve
n (
$/b
bl)
Source: Scotiabank.
Note: Red indicates fields that Pembina participates in.
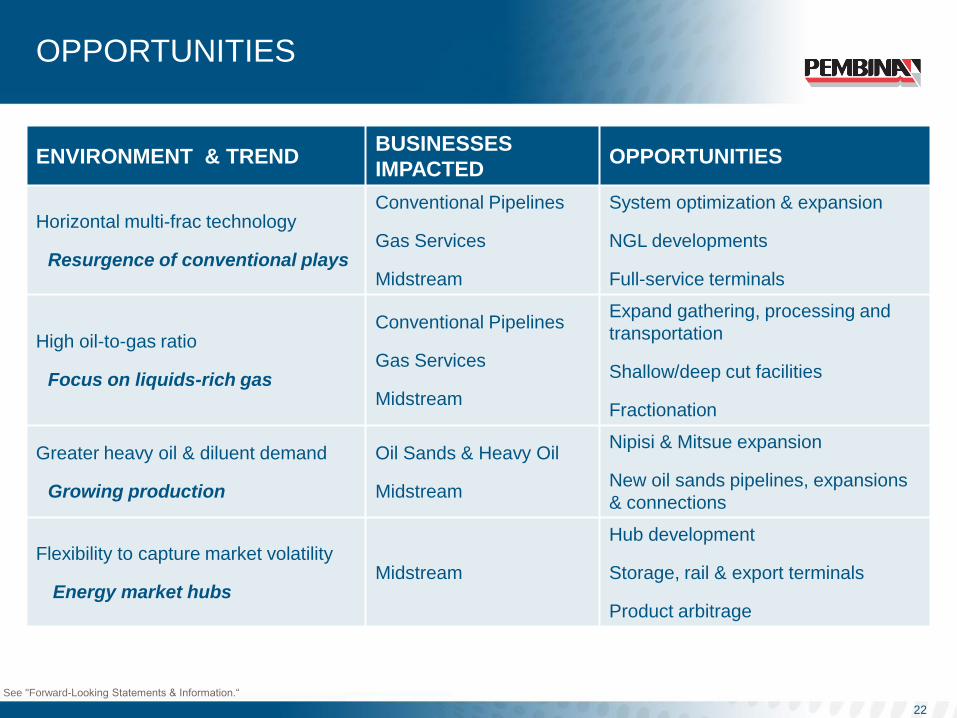
OPPORTUNITIES
22
ENVIRONMENT & TREND BUSINESSES
IMPACTED OPPORTUNITIES
Horizontal multi-frac technology
Resurgence of conventional plays
Conventional Pipelines
Gas Services
Midstream
System optimization & expansion
NGL developments
Full-service terminals
High oil-to-gas ratio
Focus on liquids-rich gas
Conventional Pipelines
Gas Services
Midstream
Expand gathering, processing and
transportation
Shallow/deep cut facilities
Fractionation
Greater heavy oil & diluent demand
Growing production
Oil Sands & Heavy Oil
Midstream
Nipisi & Mitsue expansion
New oil sands pipelines, expansions
& connections
Flexibility to capture market volatility
Energy market hubs Midstream
Hub development
Storage, rail & export terminals
Product arbitrage
See "Forward-Looking Statements & Information.“

COMMODITY UPDATE
Murray Buchanan
23

CRUDE OIL
Crude oil continues to be relatively strong
-
$20
$40
$60
$80
$100
$120
$140
$160
2002 2003 2004 2005 2006 2007 2008 2009 2010 2011 2012
$U
S / B
BL
WTI Brent
Source: Bloomberg.

NATURAL GAS
25
Natural gas prices have started to rebound
-
$2.00
$4.00
$6.00
$8.00
$10.00
$12.00
$14.00
$16.00
$18.00
2002 2003 2004 2005 2006 2007 2008 2009 2010 2011 2012
$U
S / M
MB
TU
Henry Hub AECO
Source: Bloomberg.

ALBERTA ETHANE SUPPLY/DEMAND
• Ethane production
mainly sold under
longer-term contract
• Demand expected to
increase in Alberta
• Petchems have
indicated plans to
expand facilities
provided sufficient
ethane supply
• Current facilities could
be debottlenecked
increasing capacity by
60,000 bpd
26
-
50
100
150
200
250
300
350
2005 2007 2009 2011 2013 2015 2017 2019 2021 2023 2025
Alberta/BC Supply Vantage Imports
Potential Cracking Capacity
Current Derivative Capacity
mb
pd
Ethane sold on a gas cost plus basis
See "Forward-Looking Statements & Information.” Source: IHS.

WTI, BRENT & MONT BELVIEU
PROPANE PRICES
27
Source: OPIS & forward strip.
Propane fundamentals have led to a divergence from historical crude relationship
-
$20
$40
$60
$80
$100
$120
$140
$160
2005 2006 2007 2008 2009 2010 2011 2012
$U
S / B
BL
WTI Mt. Belvieu Propane Differential

US PROPANE INVENTORIES
28
Source: EIA.
Inventories at levels similar to 2005, 2006 & 2009
65
66.8 67.4
69.9
71.8
61.6 59.0
69.6
64.2
60.3
73.7
50
55
60
65
70
75
2002 2003 2004 2005 2006 2007 2008 2009 2010 2011 2012
MM
bb
ls (
En
d o
f O
cto
ber)

US PROPANE SUPPLY COMPARISON
29
Source: EIA (Historical), 2012 based on 8 months actual.
Increasing gas plant supply partially offset by lower imports
2006 Actual 2012 Forecast
40%
17%
43%
51%
8%
41% Refineries
Refineries Gas Plants Gas Plants
Imports Imports
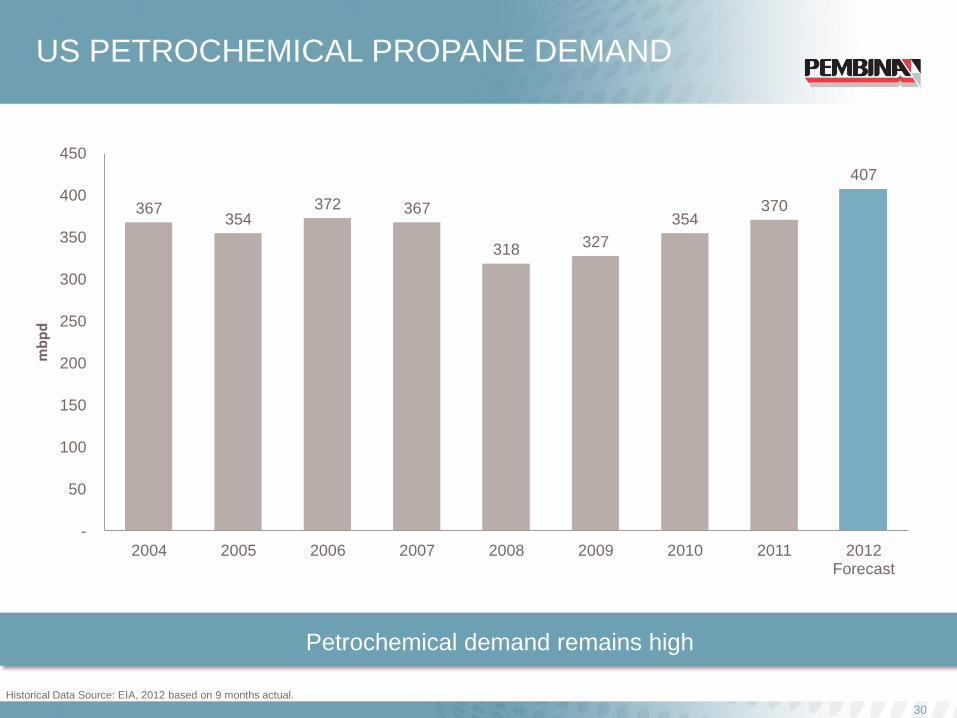
US PETROCHEMICAL PROPANE DEMAND
30
Historical Data Source: EIA, 2012 based on 9 months actual.
Petrochemical demand remains high
367 354
372 367
318 327
354 370
407
-
50
100
150
200
250
300
350
400
450
2004 2005 2006 2007 2008 2009 2010 2011 2012 Forecast
mb
pd

INTERNATIONAL SPOT PROPANE PRICES
31
Data Source: IHS.
Strong arbitrage supporting exports
$U
S/U
SG
$0.50
$0.75
$1.00
$1.25
$1.50
$1.75
$2.00
$2.25
Jan-12 Feb-12 Mar-12 Apr-12 May-12 Jun-12 Jul-12 Aug-12 Sep-12 Oct-12
Japan NW Europe Mont Belvieu
Spre
ad s
ignific
antly
exceeds tra
nspo
rtation
costs
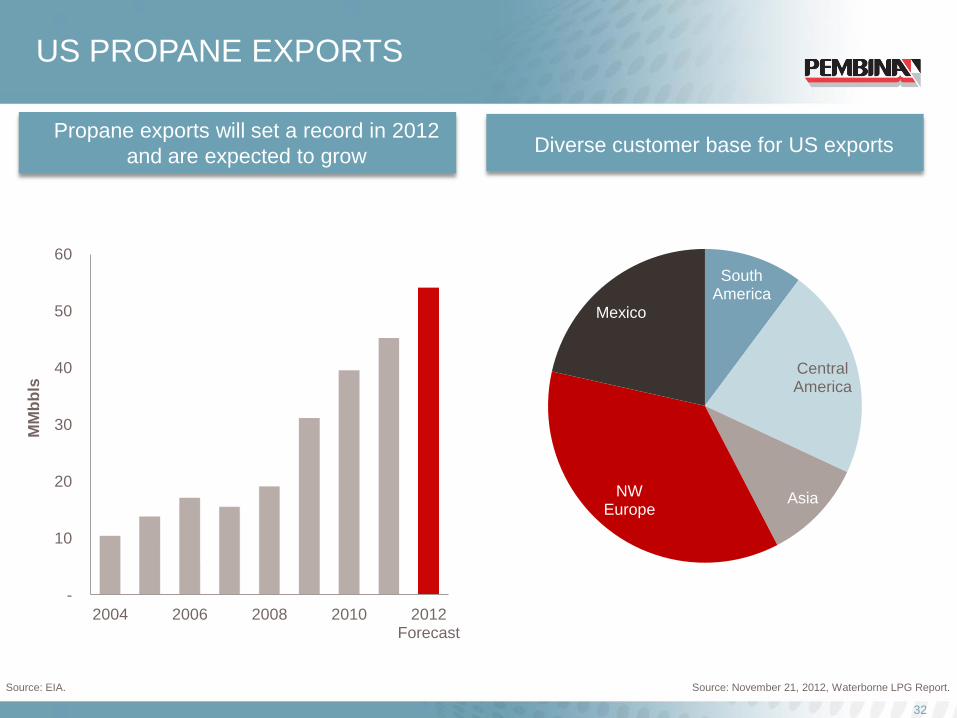
US PROPANE EXPORTS
32
MM
bb
ls
Source: EIA.
Propane exports will set a record in 2012
and are expected to grow
-
10
20
30
40
50
60
2004 2006 2008 2010 2012 Forecast
Source: November 21, 2012, Waterborne LPG Report.
Diverse customer base for US exports
South America
Central America
Asia NW Europe
Mexico

US GULF COAST LPG EXPORT CAPACITY
33
Source: Waterborne LPG Report, Company reports.
Significant export capacity is being built
MM
bb
ls p
er
Mo
nth
-
2
4
6
8
10
12
14
16
June 2012 January 2013 September 2013 December 2014
Current Capacity Enterprise Products Expansion Targa Resources Expansion - Phase 1 Targa Resources Expansion - Phase 2 Occidental Announced Terminal

WESTERN CANADIAN FIELD BUTANE
INVENTORY LEVELS
34
Source: NEB.
-
0.5
1.0
1.5
2.0
2.5
3.0
3.5
4.0
4.5
5.0
5.5
Apr. May Jun. Jul. Aug. Sept. Oct. Nov. Dec. Jan. Feb. Mar. Apr.
MM
bb
ls
2010/2011 2011/12 2012/13 5 YR AVERAGE
5 Year Inventory Range
Western butane inventories at low end of 5-year range
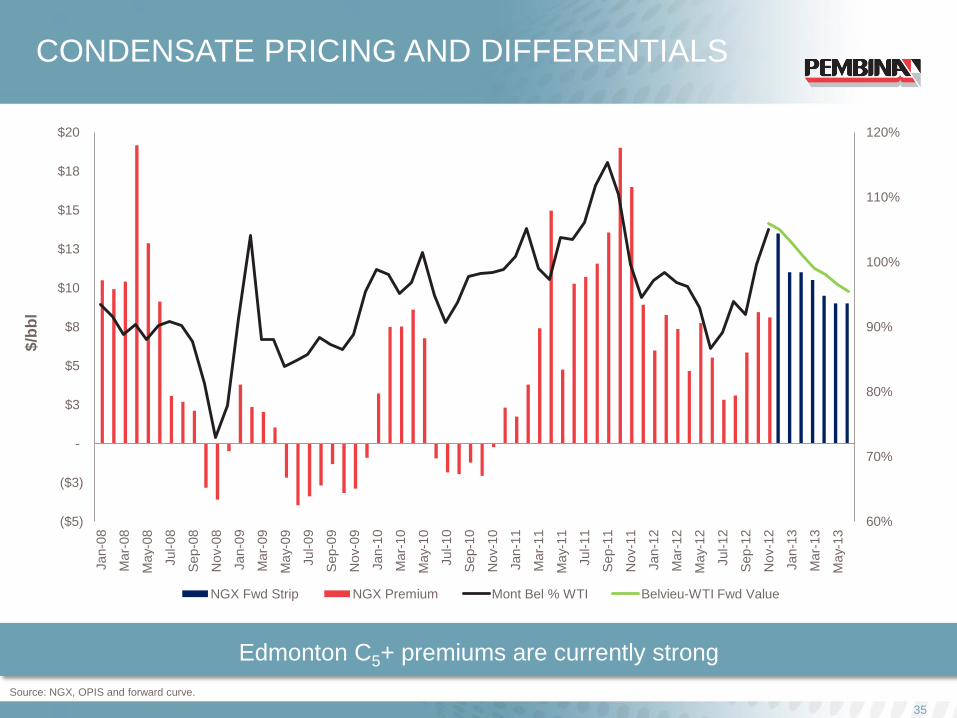
CONDENSATE PRICING AND DIFFERENTIALS
35
Edmonton C5+ premiums are currently strong
Source: NGX, OPIS and forward curve.
$/b
bl
60%
70%
80%
90%
100%
110%
120%
($5)
($3)
-
$3
$5
$8
$10
$13
$15
$18
$20
Jan-0
8
Mar-
08
May-0
8
Jul-08
Sep-0
8
Nov-0
8
Jan-0
9
Mar-
09
May-0
9
Jul-09
Sep-0
9
Nov-0
9
Jan-1
0
Mar-
10
May-1
0
Jul-10
Sep-1
0
Nov-1
0
Jan-1
1
Mar-
11
May-1
1
Jul-11
Sep-1
1
Nov-1
1
Jan-1
2
Mar-
12
May-1
2
Jul-12
Sep-1
2
Nov-1
2
Jan-1
3
Mar-
13
May-1
3
NGX Fwd Strip NGX Premium Mont Bel % WTI Belvieu-WTI Fwd Value

COMMODITY UPDATE – KEY TAKEAWAYS
• US propane export
capacity will more
than double in the
next year
• Current outlook for
butane in western
Canada is positive for
the near-term
• Demand for
condensate in
western Canada will
continue to grow with
increasing heavy oil
production
36

OIL SANDS & HEAVY OIL
Michael Hantzsch
37
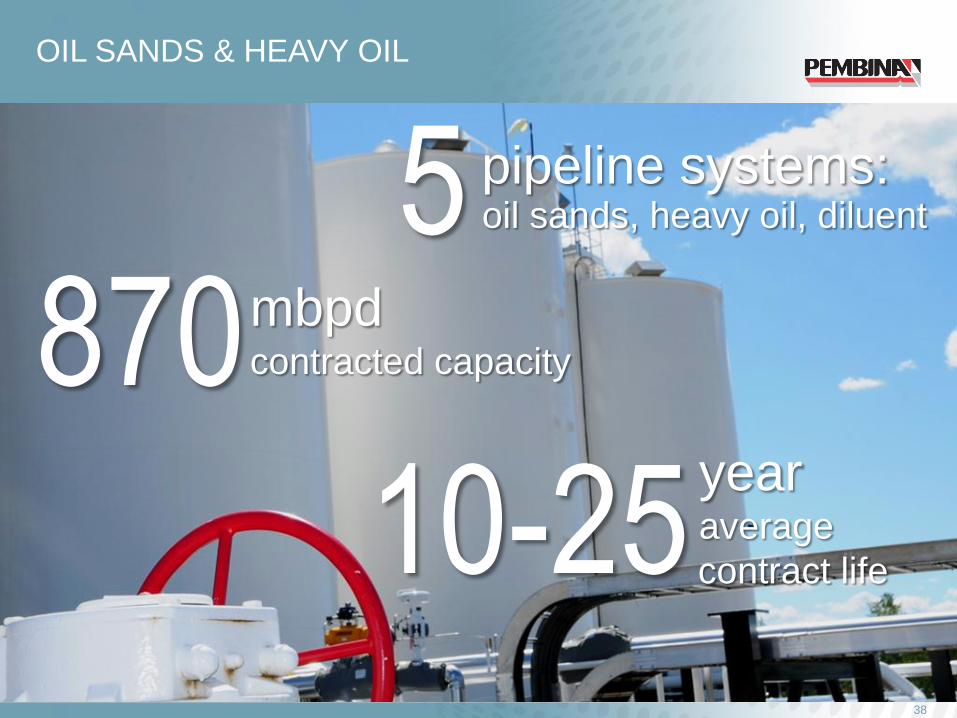
38
OIL SANDS & HEAVY OIL
pipeline systems: oil sands, heavy oil, diluent 5
870 mbpd contracted capacity
10-25 year average
contract life

INDUSTRY LEADER
• Operational excellence
• 99% reliable
• Diverse connectivity to various industry hubs for crude oil and condensate
• Superior relationship with key stakeholders (aboriginal communities and producers)
• Proven track record of reliable and safe transportation services
39
Edmonton
Scotford Refinery
Cheecham Terminal
Fort McMurray
Syncrude
CNRL Horizon
Seal / Pelican Heavy Oil
Syncrude Pipeline
Horizon Pipeline
Cheecham Lateral
Nipisi Pipeline
Mitsue Pipeline
Peace Pipeline
Map for illustrative purposes only, using third-party info.

SOLID BUSINESS PLATFORM
• Contracts are long-life and provide flow through of operating expenses
• Embedded expansion opportunities on existing contracts
• Recent construction experience and assets in key locations support
future growth
40
PIPELINE SYSTEM SYNCRUDE HORIZON CHEECHAM NIPISI & MITSUE
Contracted
Capacity (bpd) 389,000 250,000(1) 136,000 127,000(2)
Contract Type Cost-of-Service Fixed Return Fixed Return Fixed Return
Initial Term 25+ years 25+ years 25+ years 10+ years
Shippers Syncrude Partnership:
Canadian Oil Sands 36.74%
Imperial Oil 25%
Suncor 12%
Sinopec 9.03%
Nexen 7.23%
Murphy 5%
Mocal 5%
CNRL Conoco
Total
Nexen
CNOOC
CNRL
Cenovus
PMLP
(1) Denotes ultimate capacity. (2) By mid-2013.

-
100
200
300
400
500
600
700
800
900
2001 2002 2003 2004 2005 2006 2007 2008 2009 2010 2011 2012F 2013F
Nipisi & Mitsue Expansion
STRONG DEMAND FOR OUR SERVICES
41
See "Forward-Looking Statements & Information."
Nipisi & Mitsue
Syncrude
Syncrude expansion
Cheecham
Horizon
mb
pd
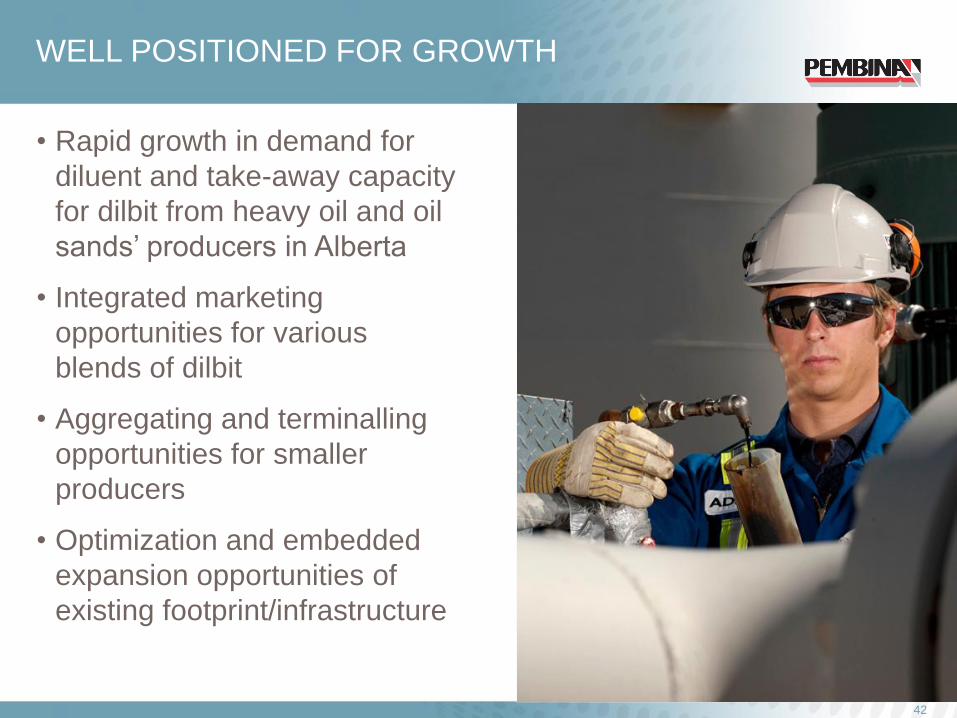
WELL POSITIONED FOR GROWTH
• Rapid growth in demand for
diluent and take-away capacity
for dilbit from heavy oil and oil
sands’ producers in Alberta
• Integrated marketing
opportunities for various
blends of dilbit
• Aggregating and terminalling
opportunities for smaller
producers
• Optimization and embedded
expansion opportunities of
existing footprint/infrastructure
42

WELL POSITIONED FOR GROWTH
DILUENT SUPPLY
43
Access to various sources of diluent supply to meet oil sands demand
Connected Condensate
Supply
Pembina’s
Access
Pembina conventional system
Redwater fractionator
Southern Lights pipeline
Rail import
Proposed Cochin pipeline
reversal (mid-2014)
Storage potential
Connected Butane Supply Pembina’s
Access
Redwater fractionator
Truck rack
Fort Saskatchewan pipeline

2013 CAPITAL PROJECTS
44
Capital Project 2013 Capital ($MM)
Nipisi & Mitsue pump stations and connectivity $25
Business development and other $20
Total $45
• Additional pump station for the Nipisi pipeline will increase system
capacity from 93,000 bpd to 105,000 bpd by the end of the second
quarter of 2013
• Additional pump station for the Mitsue pipeline will to increase system
capacity from 18,000 bpd to 22,000 bpd by the end of the third quarter
of 2013
• Adding additional terminal connection
Cap
ital E
xp
en
dit
ure
s (
$M
M)
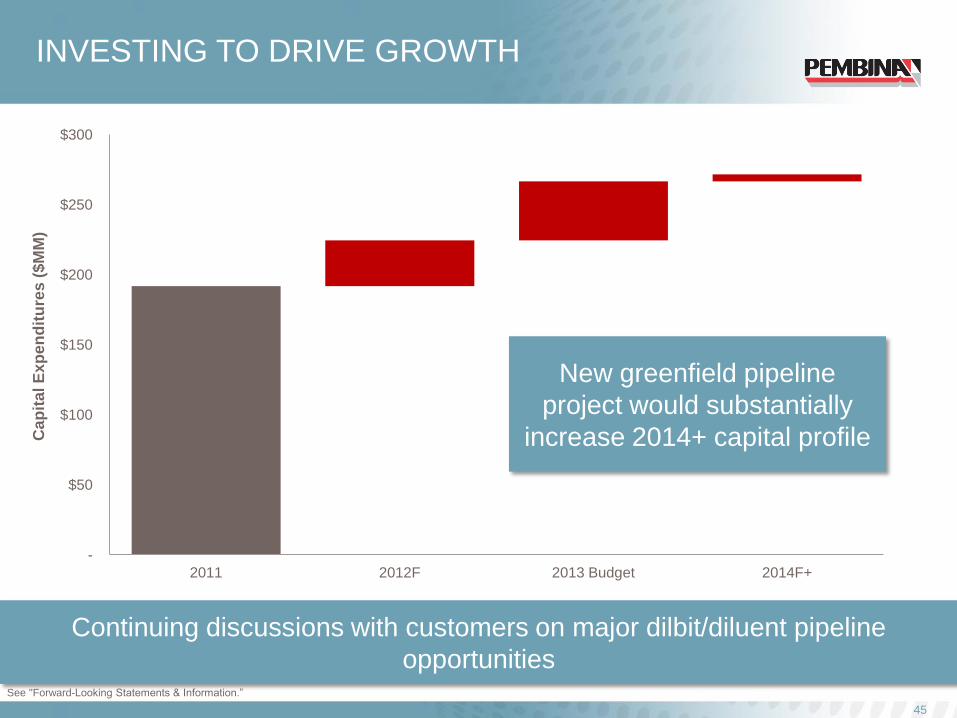
INVESTING TO DRIVE GROWTH
45
Continuing discussions with customers on major dilbit/diluent pipeline
opportunities See "Forward-Looking Statements & Information.”
-
$50
$100
$150
$200
$250
$300
2011 2012F 2013 Budget 2014F+
New greenfield pipeline
project would substantially
increase 2014+ capital profile

FUTURE OPPORTUNITIES
Nipisi expansion:
• Phase 2 – 150,000 bpd
• Full – 200,000 bpd
Mitsue expansion:
• Phase 2 – 30,000 bpd
• Full – 45,000 bpd
Horizon expansions
embedded
Support growing in-situ
operators
Working on new greenfield
pipeline project
46

GAS SERVICES
Stuart Taylor
47

48
GAS SERVICES
903 MMcf/d of net
processing capacity
by 2014
350
kilometres of
gas gathering
pipeline
368 MMcf/d net capacity at
Cutbank Complex(1)
(1) The Cutbank Complex has gross capacity of 425 MMcf/d.
See "Forward-Looking Statements & Information."

INDUSTRY LEADER
• Operational excellence
• Shallow cut 98% reliable
• High plant utilization: >85%
• Regional wells contain total
NGL of 75 -100 bbls/MMcf
• Q3 2012 processing
volume: 275 MMcf/d
• Cutbank Complex: 425
MMcf/d of sweet gas,
shallow cut processing
capacity (368 MMcf/d net to
Pembina)
• 205 MMcf/d deep cut
processing capacity at
Musreau 49
Cutbank Gas Plant
Musreau Gas Plant
Kakwa Gas Plant
Resthaven Gas Project
Younger
Taylor
Cutbank Complex
Resthaven
Saturn
Redwater
Edmonton
Fort McMurray
Fox Creek Pump Station
Saturn Gas Plant
Empress
Calgary
Gas Processing Plant
Redwater Fractionator
Pembina Pipelines
Pembina Gas Services Pipelines
Proposed Gas Services Pipelines
Map for illustrative purposes only.
ALBERTA Peace Pipeline
Peace Pipeline

SOLID BUSINESS PLATFORM
• Strategically positioned
infrastructure in active and
emerging NGL rich plays
• Provide gas gathering,
compression and shallow/deep
cut processing services
• 100% fee-for-service revenue (no
direct commodity exposure)
• Underpinned by long-term contracts
• Expansion projects are 100%
contracted, minimum 75% take-or-
pay
• Aggregate supply for Pembina’s
integrated assets to provide
comprehensive services for
producers

STRONG DEMAND FOR OUR SERVICES
51
-
100
200
300
Q3 2009
Q4 2009
Q1 2010
Q2 2010
Q3 2010
Q4 2010
Q1 2011
Q2 2011
Q3 2011
Q4 2011
Q1 2012
Q2 2012
Q3 2012
Cutbank Complex: gas processing volume
(MM
cf/
d)
See "Forward-Looking Statements & Information.”

STRONG DEMAND FOR OUR SERVICES
Shallow cut:
• Separation and recovery of an NGL mixture of
higher density hydrocarbons from raw natural
gas streams
• Achieved by cooling gas under pressure to
condense the liquids, then separating out the
NGL in a distillation column
• Shallow cut process temperatures can be as
low as -40°C
52
Recoveries Ethane (C2) Propane (C3) Butane (C4) Condensate (C5+)
Shallow Cut (C5+) ~0% ~0% Less than 2% 92+%
Shallow Cut (C3+) Less than 2% 25-35% 45-55% 95+%
Deep Cut (C2+) Up to 80% 95+% 99+% 99+%
More NGL = more value for customers
Deep cut (enhanced extraction):
• Separation and recovery of a higher amount of
NGL present in the raw natural gas streams
• Captured by cooling the natural gas stream
sufficiently to change the phase of the
components from a gas to a liquid, then
separating those two streams using distillation
• Deep cut process temperatures can be as low
as -100°C

STRONG DEMAND FOR OUR SERVICES
Why? NGL extraction yields a higher
value to producers than
otherwise realized from selling
products as gas
53
Goal
Providing producers the
opportunity to realize the highest
value for their products on a
fee-for-service basis
Provide customers with
integrated services downstream
of our processing plants
See "Forward-Looking Statements & Information.”

318
205
200
130
-
5,000
10,000
15,000
20,000
25,000
30,000
35,000
40,000
45,000
-
100
200
300
400
500
600
700
800
900
1,000
Cutbank Musreau Shallow Expansion
Saturn Resthaven Total Processing Capacity
Total Liquids Extraction Capacity (bpd)
50
STRONG DEMAND FOR OUR SERVICES
54
40,000 bpd of NGL Conventional Pipelines Fractionation Market
MM
cf/
d
Under Construction 2013/14
bp
d
See "Forward-Looking Statements & Information.”
In-Service
903 MMcf/d
Contracted Growth

WELL POSITIONED FOR GROWTH
Map for illustrative purposes only.
• Assets strategically placed to support growth in Duvernay, Montney, Cardium and Deep Basin
• Multiple geological zones with material liquids content enhancing producer economics
• New developments require significant increase in gas processing infrastructure
• Significant land purchases and drilling activity in last two years in liquids rich areas serviced by Pembina’s gas plants
• Close proximity to and integrated with existing Pembina infrastructure
CALGARY
EDMONTON
FORT
MCMURRAY
Fort Saskatchewan
Ethylene Storage
Montney
Cardium
Duvernay
Deep Basin
Musreau
Kakwa Resthaven
Saturn
Cutbank
Source: Accumap; Map displays all gas
wells drilled and land purchases made since
January 2010.
55

2013 CAPITAL PROJECTS
56
• Two deep cut facilities with 400 MMcf/d (330 MMcf/d net to Pembina)
liquids extraction capacity
• Additional compression at the Cutbank Complex to increase throughput
See "Forward-Looking Statements & Information.”
Capital Project 2012 Capital
($MM)
2013 Capital ($MM)
2014+ Capital ($MM)
Saturn $75 $90
Resthaven $45 $95 $20
Cutbank Complex Upgrades,
Other $50 $30
Total $170 $215 $20

CONSTRUCTION MILESTONES:
SATURN & RESTHAVEN
57
Saturn
To Date
Next
Steps
• Ordered 96% of long-lead equipment
• Obtained ERCB and regulatory approval
• Completed stakeholder consultation
• Plant site construction 30% complete
• ~60 % of costs secured
• Complete gas plant construction by Q4 2013
• Commission pipelines by Q4 2013
• In-service: Q4 2013
Resthaven
To Date
Next
Steps
• Ordered 80% of long-lead equipment
• Obtained ERCB and regulatory approval
• Completed stakeholder consultation
• Plant site construction 5% complete
• ~55 % of costs secured
• Complete gas plant construction by Q1 2014
• Commission pipeline by Q1 2014
• In-service: Q1 2014
See "Forward-Looking Statements & Information.”

INVESTING TO DRIVE GROWTH
-
$100
$200
$300
$400
$500
$600
2011 2012F 2013 Budget 2014F+
Cap
ital E
xp
en
dit
ure
s (
$M
M)
58
Pembina is investing to support producer requirements
See "Forward-Looking Statements & Information.”

FUTURE OPPORTUNITIES
• High utilization of Pembina’s
existing facilities is driving
possible expansions
• Requests for nominations
outstanding for:
• Additional 200 MMcf/d
shallow cut expansion at
Musreau
• Additional 200 MMcf/d deep
cut expansion at Saturn (a
twin of the initial facility)
• Gas plants to support
producer development and
growth of the Duvernay
59
See "Forward-Looking Statements & Information.”
CONVENTIONAL PIPELINES
Paul Murphy
60

61
CONVENTIONAL PIPELINES
7,850
kilometres
of pipeline
50
% of Alberta's conventional
crude oil production transported
on Pembina's systems
30
% of NGL produced in
western Canada
transported on Pembina's
systems and growing
696
mbpd current
throughput
capacity(1)
(1) Includes Drayton Valley expansion completed in 2012.

INDUSTRY LEADER
62
Northern System
Swan Hills System
Bonnie Glen System (50% Operated)
Brazeau NGL System
NEBC/Western System
Peace System
Drayton Valley System
Liquids Gathering System (LGS)
Map for illustrative purposes only.
• Operational excellence
• 99% reliable
• Proximal to prolific geology
• Q3 2012 throughput: 444
mbpd
• Q4 2012 to-date
throughput: 464 mbpd(1)
• Connected to refineries and
export pipelines
• Over 300 receipt points
adding diversity to
producers and product type
Kamloops
Calgary
Caroline
Edmonton Drayton
Valley
Whitecourt
Grande Prairie
Fort St John
Swan Hills
Valleyview
Fort McMurray
Taylor
Dunvegan
Fort Saskatchewan
(1) Q4 to date ending Nov 27, 2012.
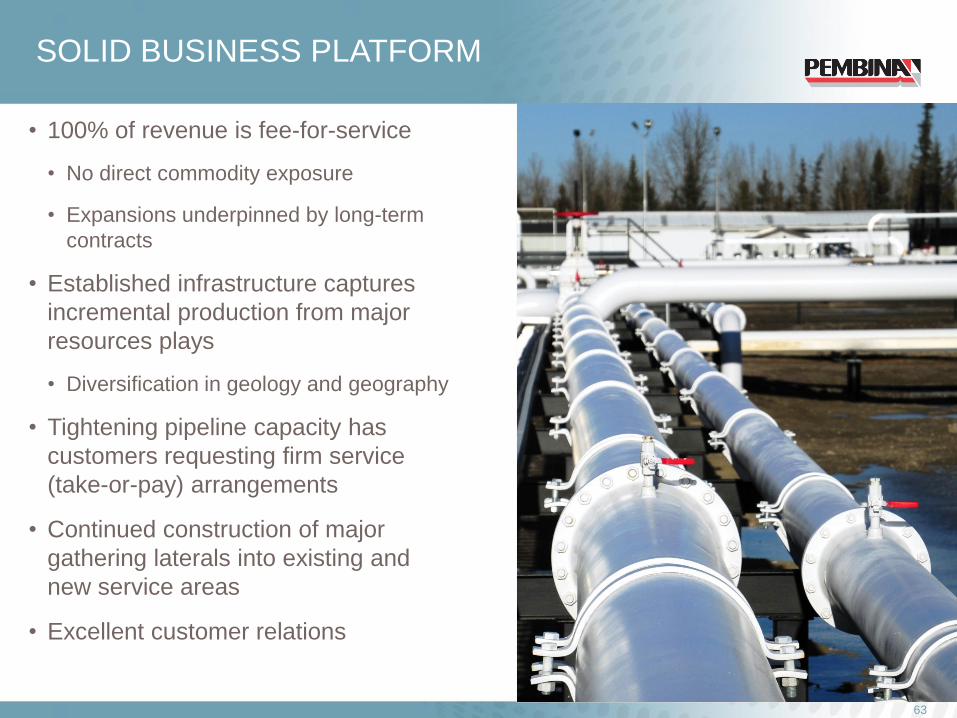
SOLID BUSINESS PLATFORM
• 100% of revenue is fee-for-service
• No direct commodity exposure
• Expansions underpinned by long-term
contracts
• Established infrastructure captures
incremental production from major
resources plays
• Diversification in geology and geography
• Tightening pipeline capacity has
customers requesting firm service
(take-or-pay) arrangements
• Continued construction of major
gathering laterals into existing and
new service areas
• Excellent customer relations
63
-
100
200
300
400
500
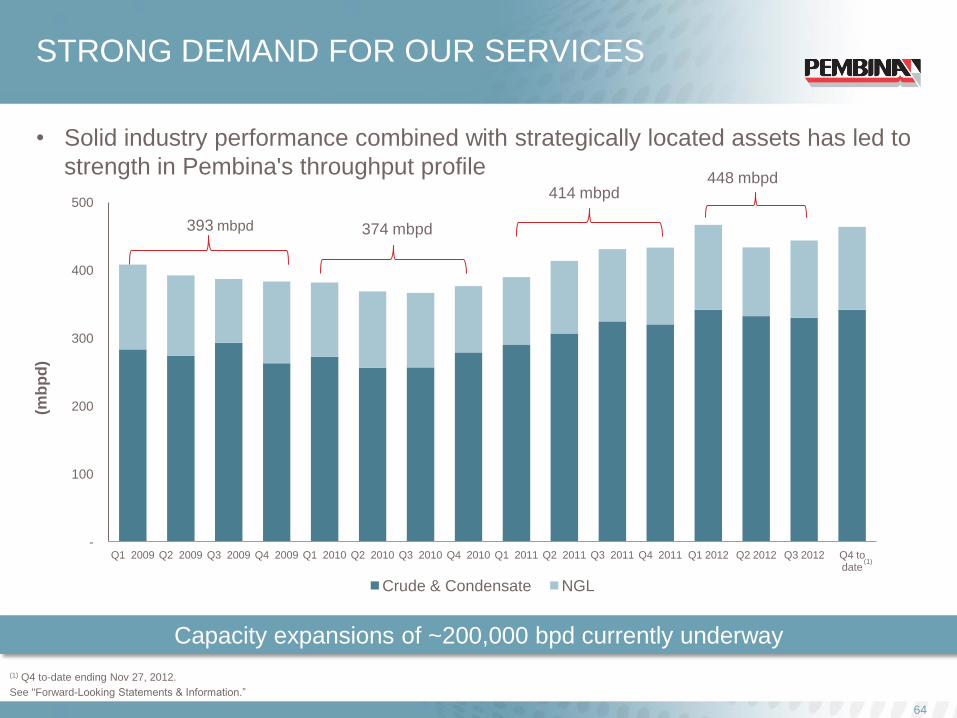
Q1 2009 Q2 2009 Q3 2009 Q4 2009 Q1 2010 Q2 2010 Q3 2010 Q4 2010 Q1 2011 Q2 2011 Q3 2011 Q4 2011 Q1 2012 Q2 2012 Q3 2012 Q4 to date
Crude & Condensate NGL
374 mbpd
STRONG DEMAND FOR OUR SERVICES
64
• Solid industry performance combined with strategically located assets has led to
strength in Pembina's throughput profile 414 mbpd
448 mbpd
(mb
pd
)
393 mbpd
Capacity expansions of ~200,000 bpd currently underway
(1) Q4 to-date ending Nov 27, 2012.
See "Forward-Looking Statements & Information.”
(1)
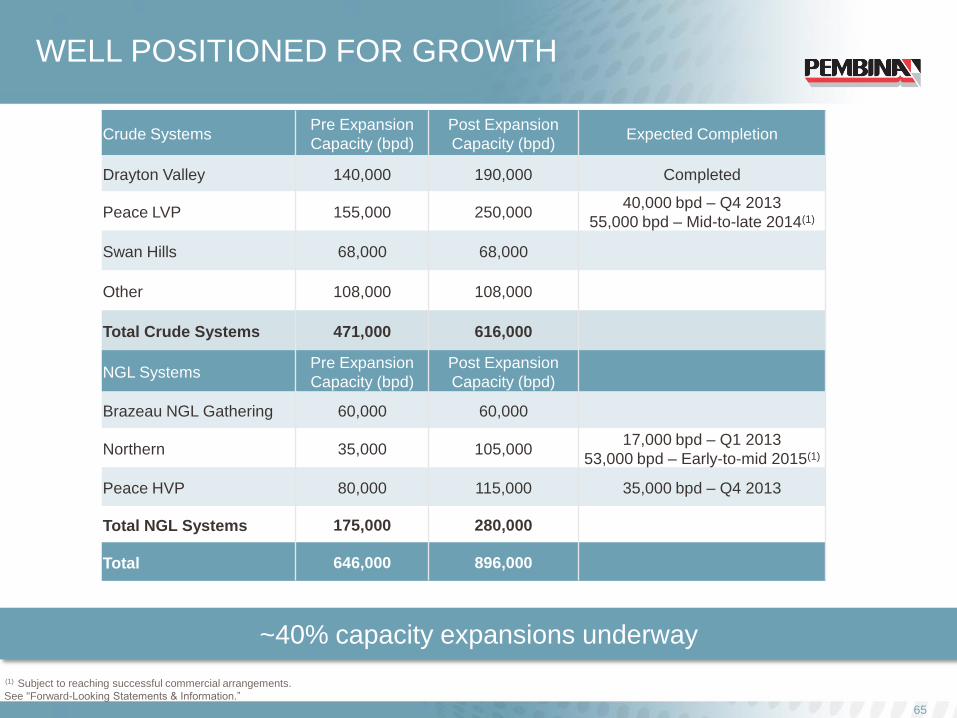
WELL POSITIONED FOR GROWTH
65
Crude Systems Pre Expansion
Capacity (bpd)
Post Expansion
Capacity (bpd) Expected Completion
Drayton Valley 140,000 190,000 Completed
Peace LVP 155,000 250,000 40,000 bpd – Q4 2013
55,000 bpd – Mid-to-late 2014(1)
Swan Hills 68,000 68,000
Other 108,000 108,000
Total Crude Systems 471,000 616,000
NGL Systems Pre Expansion
Capacity (bpd)
Post Expansion
Capacity (bpd)
Brazeau NGL Gathering 60,000 60,000
Northern 35,000 105,000 17,000 bpd – Q1 2013
53,000 bpd – Early-to-mid 2015(1)
Peace HVP 80,000 115,000 35,000 bpd – Q4 2013
Total NGL Systems 175,000 280,000
Total 646,000 896,000
(1) Subject to reaching successful commercial arrangements.
~40% capacity expansions underway
See "Forward-Looking Statements & Information.”

2013 CAPITAL PROJECTS
66
See "Forward-Looking Statements & Information.”
(1) Subject to reaching successful commercial arrangements.
Capital Projects 2012 Capital
($MM)
2013 Capital ($MM)
2014+ Capital ($MM)
Peace Crude & Condensate
Expansion Phase 1 $5 $20
Peace Crude & Condensate
Expansion Phase 2(1) $70 $145
NGL System Expansion Phase 1 $45 $50
NGL System Expansion Phase 2(1) $70 $260
Saturn and Resthaven Liquids
Pipelines $45 $55
Other Tie-Ins and Upgrades $110 $90 $125
Total $205 $355 $530

Whitecourt Ps
Valleyview Ps
Glenevis Ps
Mayerthorpe Whitecourt
Grande
Praire
Dawson Creek
Fox Creek Ps
Tony Creek Ps
Kakwa Ps
Lator Ps
Bald Mtn. Ps
La Glace Ps
Wapiti Ps
Gordondale Ps
Gilwood ps
Dunvegan
Belloy
Upgrade
Valleyview
Pump Station
New 50 mbbl C5+
Storage
New Smoky River
Pump Station
New LVP Pump Station
Pump Station Upgrades
New HVP Pump Station
HVP Storage
LVP Storage
New Pipeline
Gordondale to Valleyview:
2 upgrades & 2 new pump stations
Fox Creek to Edmonton:
3 upgrades & 3 new pump stations
Proposed New Operation:
1. Redirect LGS to Northern
System at Spirit River
2. Use LGS (south leg) for LVP
Gordondale to LaGlace
CURRENT EXPANSIONS: LVP PHASE 1 & 2
67
BC AB
LVP Phase 1 expansion to 195 mbpd;
Phase 2 expansion to 250 mbpd
Upgrade LaGlace
Pump Station

• Crude oil and condensate volumes on the Peace Pipeline system are
expected to increase. To support this growing production, Pembina plans
to increase capacity in two phases:
• Phase 1 LVP expansion: expand crude oil and condensate capacity by
an additional 40,000 bpd to reach 195,000 bpd by the end of 2013
• Phase 2(1) expansion: add an additional 55,000 bpd of capacity; can be
brought into service in mid to late-2014
• Once complete, the proposed expansions will increase capacity by 91
percent to 250,000 bpd
• Limited new pipeline build means low environmental risk
68
MAJOR EXPANSION – LVP
(1) Phase 2 subject to commercial arrangements.

WHITECOURT PS
VALLEYVIEW
PS
GLENEVIS PS
Mayerthorpe
Edson
Whitecourt
VALLEYVIEW Grande
Prairie
Dawson
Creek
Taylor
Ft. St. John
FOX CREEK
PS TONY
CREEK PS
KAKWA PS
LATOR
PS
BALD MTN. PS
LA GLACE PS
WAPITI PS
GORDONDALE PS
GILWOOD PS
BC AB
Dunvegan
Belloy
2 HVP pump station
upgrades & 3 new HVP
pump stations
Additional HVP storage at Spirit River &
HVP pipeline from Doe to Spirit River
New 24” HVP pipeline
Namao to Fort
Saskachewan/Redwater
Re- direct Swan Hills
crude to Peace
North HVP to 16”
pipeline
New HVP Pump Stations
Upgrade Existing HVP Pump Stations
Peace HVP Phase 1 Expansion
New LVP Pump Stations
New LVP Storage
New HVP Storage
Upgrade Wapiti pump station
reverse excess volumes from
Peace to Northern system
Install wc breakout
tanks for LVP
CURRENT EXPANSIONS: HVP PHASE 1 & 2
HVP Phase 1 expansion to 167 mbpd;
Phase 2 expansion to 220 mbpd

• Producer activity focused on NGL development continues to be strong in
the Deep Basin Cretaceous, Montney and Duvernay resource plays
served by the Peace and Northern Systems ("NGL System")
• Phase 1 NGL expansion: expand capacity on Pembina’s NGL Systems
by an additional 52,000 bpd to reach 167,000 bpd by the end of 2013
• Phase 2(1) expansion: add an additional 53,000 bpd of capacity; can be
brought into service in early to mid-2015
• Once complete, the proposed expansions will increase capacity by 61
percent to 220,000 bpd
• Limited new pipeline build means low environmental risk
70
MAJOR EXPANSION – HVP
(1) Phase 2 subject to commercial arrangements.

INVESTING TO DRIVE GROWTH
71
Resurging conventional plays continue to provide growth platform
-
$200
$400
$600
$800
$1,000
$1,200
$1,400
2011 2012F 2013 Budget 2014+ Est.
Ca
pit
al E
xp
en
dit
ure
s (
$M
M)
See "Forward-Looking Statements & Information.”
(1) Phase 2 subject to commercial arrangements.
(1) (1)

Kamloops
Calgary
Caroline
Edmonton
Grande Prairie
Fort St John
Swan Hills
Valleyview
Fort McMurray
Taylor
Dunvegan
Fort Saskatchewan
FUTURE OPPORTUNITY: DUVERNAY
72
Northern System
Swan Hills System
Bonnie Glen System (50% Operated)
Brazeau NGL System
NEBC/Western System
Peace System
Drayton Valley System
Liquids Gathering System (LGS)
Map for illustrative purposes only.
ALBERTA
• Well-positioned to capture
Duvernay growth
• Estimated reserves of 477 Tcf of
gas and 19 billion barrels of oil
• Since 2009 ~$4.5 billion has
been raised in land sales
-
$500
$1,000
$1,500
$2,000
$2,500
Kaybob Willesden Green Edson
To
tal L
an
d S
ale
P
roceed
s -
D
uv
ern
ay (
$M
M)
Source: TD Securities, geoScout.
-
20
40
60
80
100
120
Kaybob Willesden Green Edson
To
tal W
ell L
icen
ses -
D
uv
ern
ay

FUTURE OPPORTUNITIES
• Capacity expansions
can be implemented
incrementally and
efficiently as service
area production
grows
• Growth in alternate
delivery locations
• New service areas
• Exploit underutilized
assets
73

10 seconds each, =

MIDSTREAM – NGL
Bob Lock
75

76
NGL MIDSTREAM: REDWATER WEST
73
mbpd fractionation
capacity
6.8 MMbbls net specification
product storage 80
mbpd
condensate rail
terminal
355
MMcf/d net extraction
capacity(1)
(1) The Younger extraction facility has gross capacity of 750 MMcf/d.
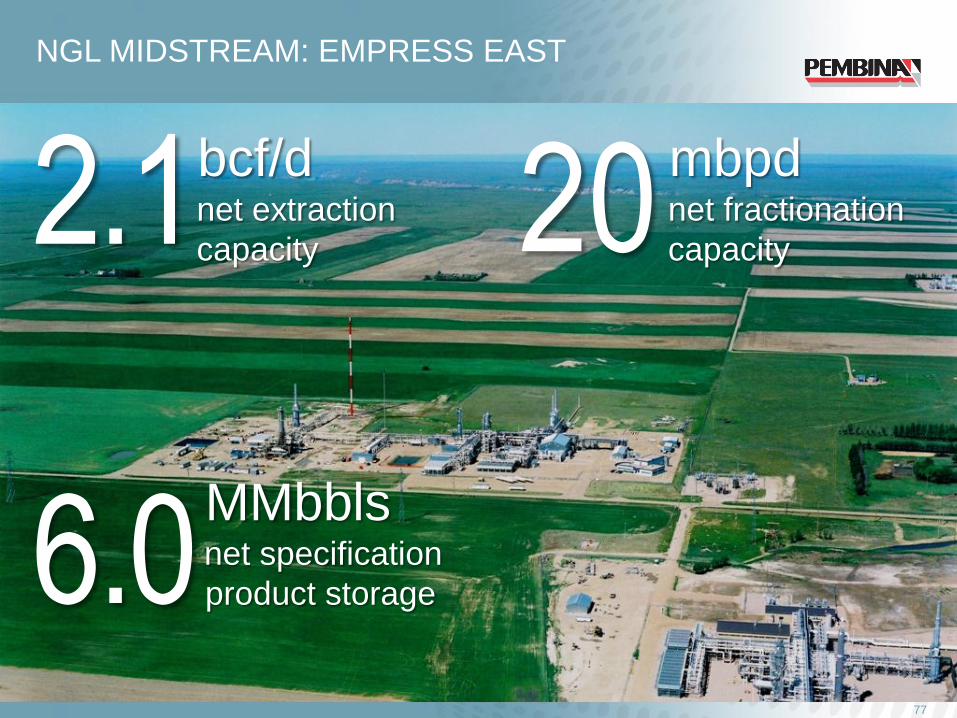
77
NGL MIDSTREAM: EMPRESS EAST
2.1
bcf/d
net extraction
capacity 20
mbpd
net fractionation
capacity
6.0 MMbbls net specification
product storage
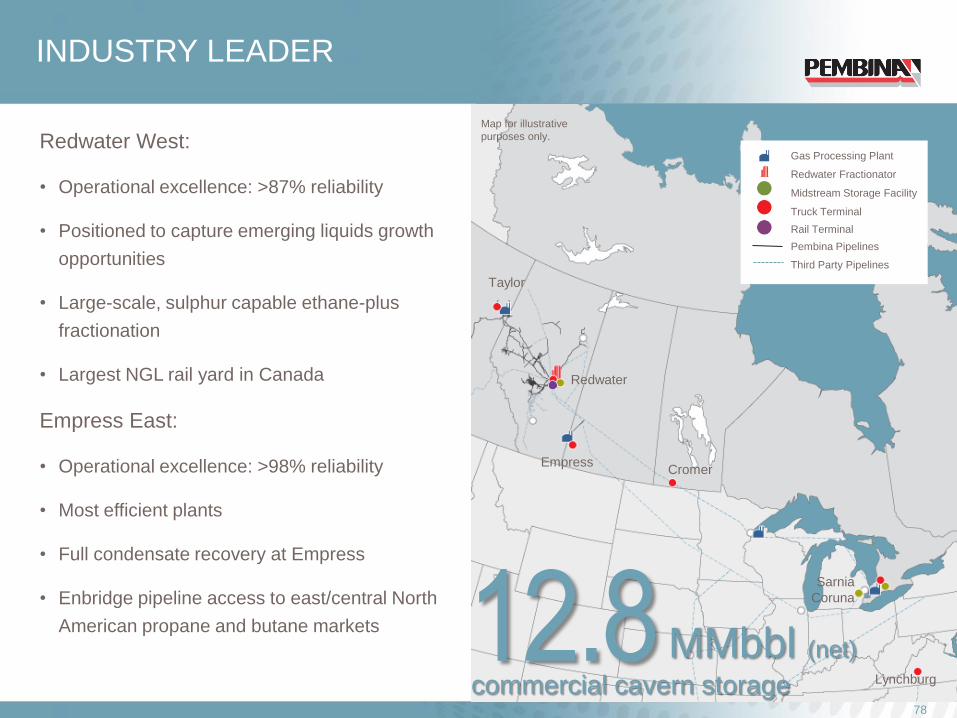
INDUSTRY LEADER
Redwater West:
• Operational excellence: >87% reliability
• Positioned to capture emerging liquids growth
opportunities
• Large-scale, sulphur capable ethane-plus
fractionation
• Largest NGL rail yard in Canada
Empress East:
• Operational excellence: >98% reliability
• Most efficient plants
• Full condensate recovery at Empress
• Enbridge pipeline access to east/central North
American propane and butane markets
78
Empress Cromer
Sarnia
Coruna
Lynchburg
12.8 MMbbl (net) commercial cavern storage
Redwater
Taylor
Gas Processing Plant
Redwater Fractionator
Midstream Storage Facility
Truck Terminal
Rail Terminal
Pembina Pipelines
Third Party Pipelines
Map for illustrative
purposes only.

INDUSTRY LEADER
• Large, competitive
Alberta NGL supply
footprint
• Integrated facilities and
operations across the
continent
• Large scale, versatile
NGL rail fleet and
storage facilities
• Established and
effective marketing
team
79
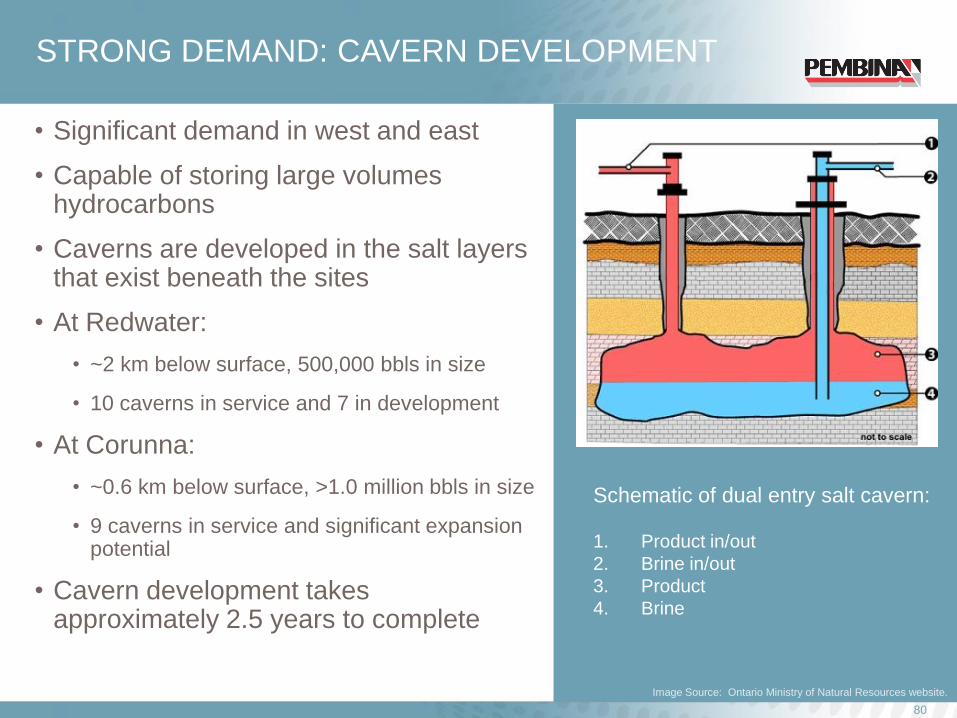
STRONG DEMAND: CAVERN DEVELOPMENT
• Significant demand in west and east
• Capable of storing large volumes hydrocarbons
• Caverns are developed in the salt layers that exist beneath the sites
• At Redwater:
• ~2 km below surface, 500,000 bbls in size
• 10 caverns in service and 7 in development
• At Corunna:
• ~0.6 km below surface, >1.0 million bbls in size
• 9 caverns in service and significant expansion potential
• Cavern development takes approximately 2.5 years to complete
80
Image Source: Ontario Ministry of Natural Resources website.
Schematic of dual entry salt cavern:
1. Product in/out
2. Brine in/out
3. Product
4. Brine

2013 CAPITAL PROJECTS
81
See "Forward-Looking Statements & Information."
(1) Subject to reaching commercial arrangements. (2) Includes 9 months of capital.
Capital Project 2012 Capital(2)
($MM)
2013 Capital ($MM)
2014+ Capital ($MM)
Redwater West:
Cavern & Storage Development $100 $90 $40
Terminalling & Connectivity $35 $45
Other $45 $30
Empress East:
Cavern & Storage Development $10 $15 $5
Terminalling & Connectivity $10
Other $10 $20
Total $165 $200 $90
Redwater Fractionator II(1) $15 $410

WELL POSITIONED FOR GROWTH
FORT SASKATCHEWAN FRACTIONATION FULL
Development of RFS II:
• Current WCSB C2+ supply
exceeds existing Alberta C2+
fractionation capacity
• Near-term forecast for
incremental WCSB C2+
production is strong
• Advancing plans to double the
size of Redwater
• Incremental 73,000 bpd of C2+
fractionation capacity and full
NGL service offering
• Anticipated on-stream Q4 2015
82
See "Forward-Looking Statements & Information.”

INVESTING TO DRIVE GROWTH
83
Liquids-rich gas development driving demand for downstream infrastructure
Note: Chart includes capital spent by Provident Energy Ltd.
-
$100
$200
$300
$400
$500
$600
$700
2011 2012F 2013 Budget 2014F+
Cap
ital E
xp
en
dit
ure
s (
$M
M)
See "Forward-Looking Statements & Information.”
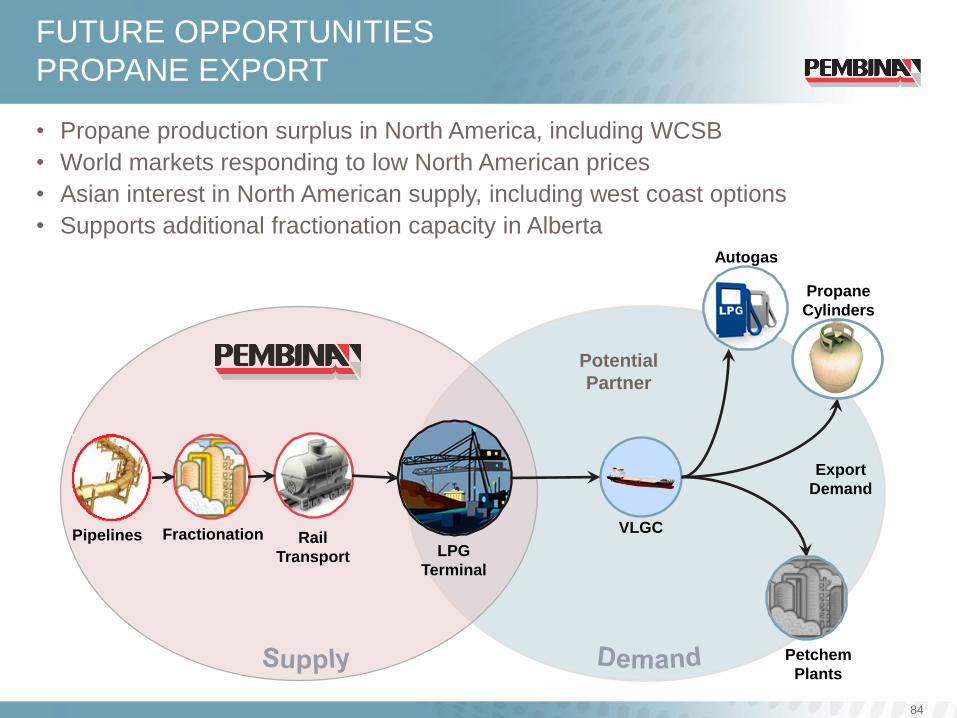
84
v
LPG
Terminal
Fractionation Rail
Transport
VLGC
Export
Demand
Petchem
Plants
Autogas
Propane
Cylinders
Pipelines
Potential
Partner
FUTURE OPPORTUNITIES
PROPANE EXPORT
• Propane production surplus in North America, including WCSB
• World markets responding to low North American prices
• Asian interest in North American supply, including west coast options
• Supports additional fractionation capacity in Alberta

MIDSTREAM – CRUDE OIL
Bob Jones
85

86
MIDSTREAM – CRUDE OIL
21
inbound
pipeline
connections
21
truck terminals
located across
pipeline network 3 hub locations in the
Edmonton / Fort
Saskatchewan area form
PNT
13
outbound
pipeline
connections
1,150
mbpd of volume
transported through
connected pipelines

INDUSTRY LEADER
• Develop and provide terminal, hub & storage services to support the energy industry
• 630,000 barrels of above ground crude oil and condensate storage capacity
• Potential to expand up to 3,000,000 barrels
87
Gas Processing Plant
Redwater Fractionator
Midstream Storage Facility
Truck Terminal
Rail Terminal
Midstream Operations
Other Pembina Pipelines
Third Party Pipelines
PRINCE GEORGE
TAYLOR
KAMLOOPS CALGARY
EDMONTON
FORT
MCMURRAY
VANCOUVER
PEMBINA
NEXUS
TERMINAL
Map for illustrative purposes only.
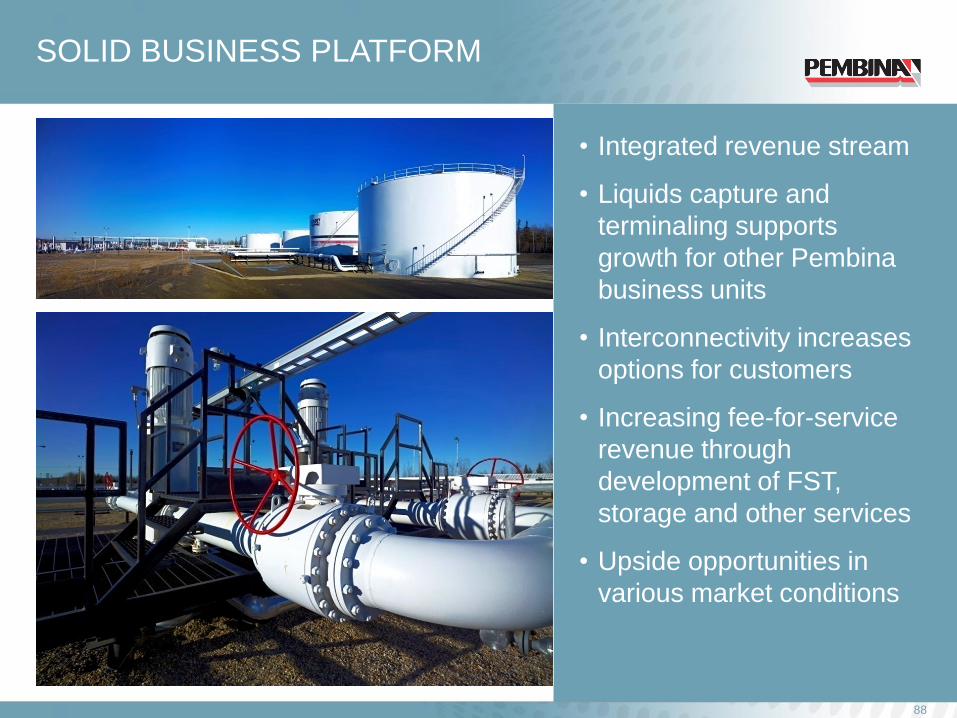
SOLID BUSINESS PLATFORM
• Integrated revenue stream
• Liquids capture and
terminaling supports
growth for other Pembina
business units
• Interconnectivity increases
options for customers
• Increasing fee-for-service
revenue through
development of FST,
storage and other services
• Upside opportunities in
various market conditions
88

STRONG DEMAND FOR OUR SERVICES
Customer support for truck terminals:
• Bringing ~60,000 bpd on to Pembina's
conventional pipelines(1)
Increasing connectivity at PNT:
• 5 diluent streams
• Fully connected – increased access of
Pembina's pipelines to terminal
• Growth platform – dilbit
• Restored export capability for terminal
to Enbridge; working on TMPL –
Kinder Morgan
89
(1) 2012 YTD Average.

2013 CAPITAL PROJECTS
90
• Converting two existing truck terminals to FSTs and constructing three
new greenfield locations
• Develop 300,000 bbls of above ground storage at ENT
• Crude oil rail on-loading potential of 40,000 bpd
• Pipeline development connecting ENT to Redwater
See "Forward-Looking Statements & Information.”
Capital Project 2012 Capital ($MM)
2013 Capital ($MM)
2014+ Capital ($MM)
PNT terminal and
interconnection growth $10 $75 $20
Full-service truck
terminals $25 $40 $40
Other $20 $15
Total $55 $130 $60

WELL POSITIONED FOR GROWTH
91
Namao Hub
Peace Pipeline
Northern Pipeline
Swan Hills Pipeline
Nipisi Pipeline
Brazeau Pipeline
Cloverbar Hub
Pembina Redwater
Fractionator
ENT
Parcel A
Bonnie Glen Pipeline
Drayton Valley Pipeline
Imperial Refinery
TMLP Kinder Morgan
Export Pipeline
Suncor Refinery
Enbridge Export Pipeline
Other Fracs/Storage:
Dow, Keyera, Plains
Shell Scotford Refinery
Horizon Pipeline
Syncrude Pipeline
Enbridge
Southern Lights Pipeline
Pembina Nexus Terminal
Edmonton Area
Pembina Pipelines
Pipelines by others
Future Pembina Pipelines
Plains Rainbow Pipeline
CN & CP Rail Opportunities
Truck and Rail
Opportunities
Edmonton Pipeline Alley

WELL POSITIONED FOR GROWTH: FST
92
MONTNEY
DEEP BASIN
SWAN HILLS
CARDIUM
SLAVE POINT
SEAL
PELICAN LAKE
Map for illustrative purposes only.
PRINCE GEORGE
TAYLOR
KAMLOOPS CALGARY
EDMONTON
FORT MCMURRAY
Fort Saskatchewan Ethylene
Storage
DUVERNAY
Pembina Pipelines
Existing terminals
FST Prospects
2012/2013 FST Developments
Five FST locations to be developed in 2013 See "Forward-Looking Statements & Information.”

-
$50
$100
$150
$200
$250
$300
$350
$400
2011 2012F 2013 Budget 2014F+
Cap
ital E
xp
en
dit
ure
s (
$M
M)
INVESTING TO DRIVE GROWTH
93
Significant growth opportunities in terminal and hub services
See "Forward-Looking Statements & Information.”

FUTURE OPPORTUNITIES
PNT expansion
• Terminal integration complete
• Redwater and PNT connected
• Redwater and Heartland
connected
• Proprietary rail fleet for crude oil
and condensate service
Redwater oil development
• CN connection
• Salt cavern storage
Heartland development
• Surface and salt cavern storage
• East-west connector to oil sand
and diluent pipelines
PNT development
• High capacity export line to
Enbridge
• Surface storage development
• CP/CN rail connection
Hardisty development
• Terminalling and storage
94
See "Forward-Looking Statements & Information.”
DEDICATED TO PIPELINE & FACILITY INTEGRITY
Allan Charlesworth

96
INTEGRITY MANAGEMENT PROGRAM
• In-Line Inspection
• Metal loss
• Crack detection
• Geometry
• Internal Corrosion Program
• Monitor product quality at pipeline inlet
• Chemical inhibition
• Cathodic Protection
• Controlling external (soil side) corrosion
• Facility Integrity
• Governs operation, inspection, monitoring and
mitigation (if required) for all pressure vessels
and tanks
• Geotechnical Program
• Water crossing depth-of-cover
• Slope stability
• Geospatial Information System (GIS)
• Captures, stores, analyzes, manages and
presents pipeline integrity data

INTEGRITY EXPENDITURES
97
An
nu
al
Ex
pe
nd
itu
res
($
MM
)
See "Forward-Looking Statements & Information.”
-
50
100
150
200
250
300
350
400
450
500
-
$10
$20
$30
$40
$50
$60
$70
$80
2005 2006 2007 2008 2009 2010 2011 2012F 2013F
In-Line Inspection Repairs Geotechnical Cathodic Protection Conventional Throughput
mb
pd
Integrity, 32%
Power, 24%
Other, 44%
2013 Operating Expenses

IN-LINE INSPECTIONS (ILI)
• Pembina has over 450 ILI
capable pipeline segments
• Pembina completes an average
of 50 – 60 inspections/year
• Inspections typically result in
300 – 500 digs annually
• Main tool technologies
• Magnetic flux leakage (MFL)
• Geometry (deformations)
• Combo tools (MFL and
geometry)
• Ultrasonic crack detection
98
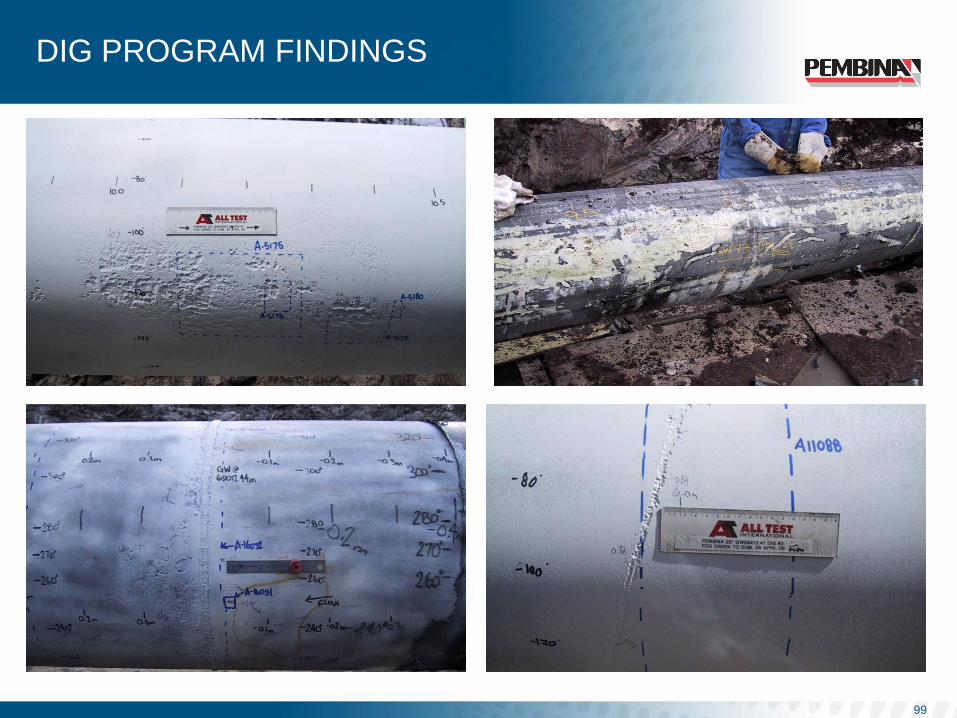
99
DIG PROGRAM FINDINGS

ULTRASONIC CRACK DETECTION TOOL
100
Transmitter
Battery Packs
Sensor Carrier Electronic &
Data Recorder Packs
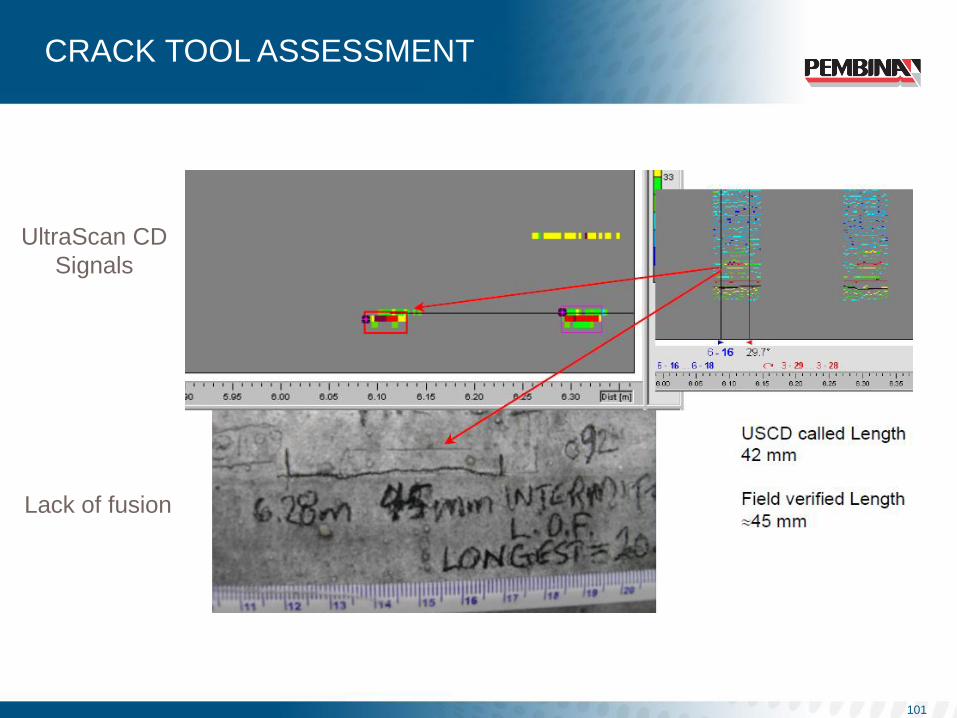
CRACK TOOL ASSESSMENT
101
UltraScan CD
Signals
Lack of fusion

REPAIR METHODS
102
B-Sleeve
Compressive Sleeve (Petrosleeve)

SUMMARY
• Program has transitioned from primarily metal loss threat evaluation to
include geohazards, crack and geometry threats
• Exploring new technologies to enhance detection and analysis of threats
• Development of Pembina’s GIS has provided for a more comprehensive
analysis of threats and mitigation options
• 2013 Focus
• Completion of integrity programs for expansion projects
• Continue to leverage the GIS system to advance risk assessment and will include Class
location studies and outflow analysis
• Complete the integration of Provident assets into Pembina’s integrity management
programs
103

DEDICATED TO STAKEHOLDERS
Bob Michaleski

INVESTING IN OUR COMMUNITIES
• Being a good neighbour where
we live, work and play helps
Pembina build relationships and
maintain our social license to
operate
• Committed to the communities in
which we operate by giving back
• Our decisions are based on the
unique characteristics of each
community
Preserve & protect the environment
Advance education
Foster wellness & build community
105
Pembina supports
organizations that:

INVESTING IN OUR COMMUNITIES
United Way
2012 Campaign raised $1 million
including employee contributions and
Company match for the United Way of
Calgary & Area
106
Employee Matching Gift Program
We encourage our employees to give
back to their communities by matching
their donations
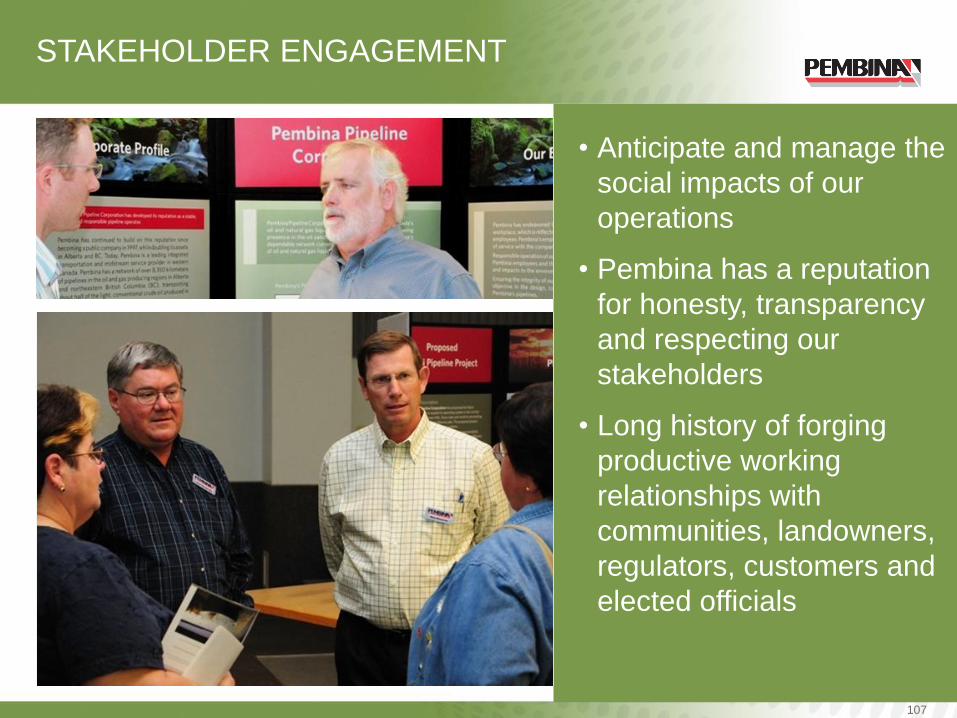
STAKEHOLDER ENGAGEMENT
• Anticipate and manage the
social impacts of our
operations
• Pembina has a reputation
for honesty, transparency
and respecting our
stakeholders
• Long history of forging
productive working
relationships with
communities, landowners,
regulators, customers and
elected officials
107

• 800 employees
• 12 field offices
• Average of 8.3
years of service
Reputation for
attracting and
retaining
employees
EMPLOYER OF CHOICE
108

SAFETY
Our Safety, Environment & Security management system is cornerstone of
Pembina’s success and is deeply embedded in our corporate culture:
Working towards zero accidents, injuries and environmental incidents
• All accidents, injuries and incidents are preventable
• Loss management policies, programs and procedures (which include our emergency
response plans) and an incident reporting and tracking system
Arming ourselves with the knowledge to improve
• Tracking health, safety and environmental statistics is just as important as measuring
operating and financial performance
Driving our way to zero
• Any Pembina employee expected to drive on company-time is required to participate in
Collision Avoidance training every three years
109

STABLE FINANCIAL PLATFORM
Peter Robertson
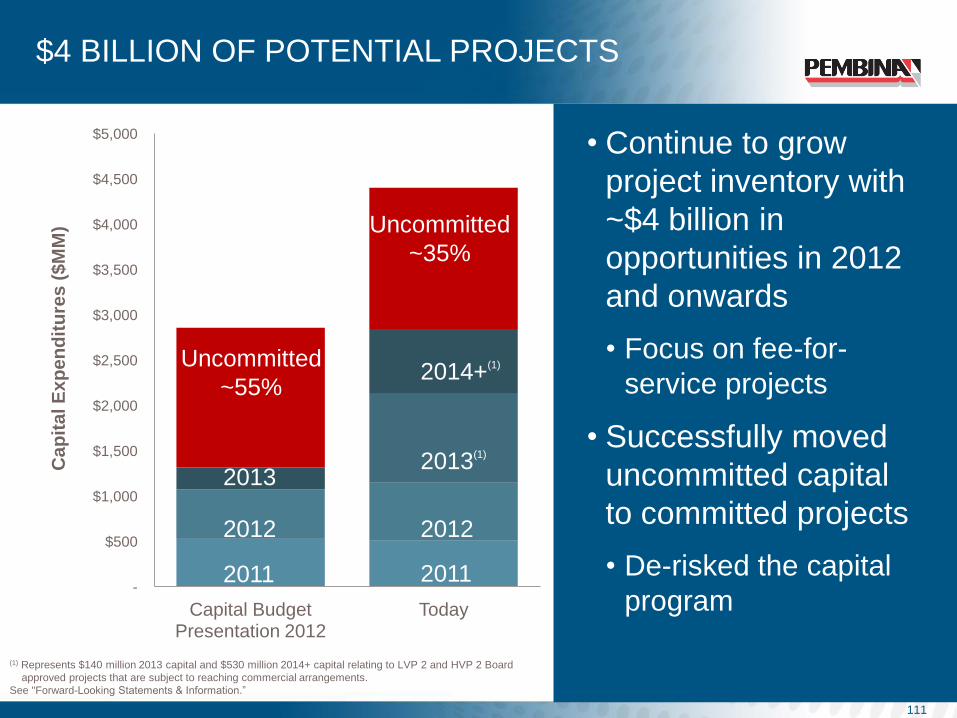
$4 BILLION OF POTENTIAL PROJECTS
111
2011
2012
2013
2011
2012
2013
2014+
-
$500
$1,000
$1,500
$2,000
$2,500
$3,000
$3,500
$4,000
$4,500
$5,000
Capital Budget Presentation 2012
Today
Ca
pit
al E
xp
en
dit
ure
s (
$M
M)
Uncommitted
~55%
Uncommitted
~35%
2011
2012
2013
2011
2012
2013(1)
2014+(1)
(1) Represents $140 million 2013 capital and $530 million 2014+ capital relating to LVP 2 and HVP 2 Board
approved projects that are subject to reaching commercial arrangements.
See "Forward-Looking Statements & Information.”
• Continue to grow
project inventory with
~$4 billion in
opportunities in 2012
and onwards
• Focus on fee-for-
service projects
• Successfully moved
uncommitted capital
to committed projects
• De-risked the capital
program
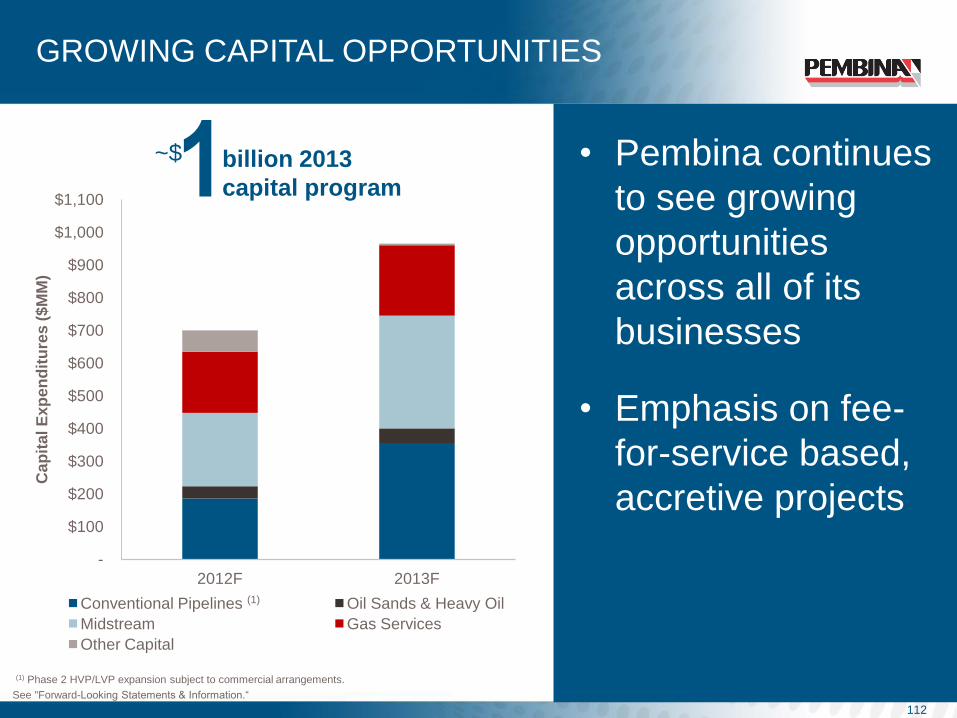
GROWING CAPITAL OPPORTUNITIES
• Pembina continues
to see growing
opportunities
across all of its
businesses
• Emphasis on fee-
for-service based,
accretive projects
112
See "Forward-Looking Statements & Information.“
1
billion 2013
capital program
~$
-
$100
$200
$300
$400
$500
$600
$700
$800
$900
$1,000
$1,100
2012F 2013F
Cap
ital E
xp
en
dit
ure
s (
$M
M)
Conventional Pipelines Oil Sands & Heavy Oil
Midstream Gas Services
Other Capital
(1) Phase 2 HVP/LVP expansion subject to commercial arrangements.
(1)

POTENTIAL SOURCES & USES 2013-2016
Sufficient
liquidity and
access to capital
to prudently
finance growth
113
5.5 billion
(2013-2016)
Cash Flow
Debt Financing
DRIP
Public Equity
Dividends
Capital Expenditures
-
$1,000
$2,000
$3,000
$4,000
$5,000
$6,000
Potential Sources Potential Uses
$M
M
See "Forward-Looking Statements & Information.“
~$

LIQUIDITY & ACCESS TO CAPITAL
• Access capital at attractive rates
• Sufficient funding for near-term projects
• DRIP(1) currently raising ~$22 million
per month
• $1.5 billion credit facility
• Current undrawn capacity of ~$1 billion
• Excellent relationships with capital
providers
• Prudent and flexible capital
structure
• Senior debt to total capital ~30%(2)
• Dedicated to our BBB credit ratings
Well-
positioned
to execute our
business plan
114
(1) DRIP is the Premium Dividend™ and Dividend Reinvestment Plan. (2) YE 2012 estimate.
Committed to
maintaining our
investment grade
rating

• Fixed rate debt
• Commodity and power hedging
• Credit risk management
Committed to
mitigating risk
PRUDENT FINANCIAL MANAGEMENT
115

LONG-TERM DEBT MATURITY & STRUCTURE
116
86%
14%
Fixed Rate (average rate of 4.90%)
Variable Rate (average rate of 2.85%) (1)
(1) As of September 30, 2012.
$250 $266
$450 $450
$173 $173
$300
2012 2013 2014 2015 2016 2017 2018 2019 2020 2021 2022
Notes Convertible Debentures
COMMODITY AND POWER HEDGING
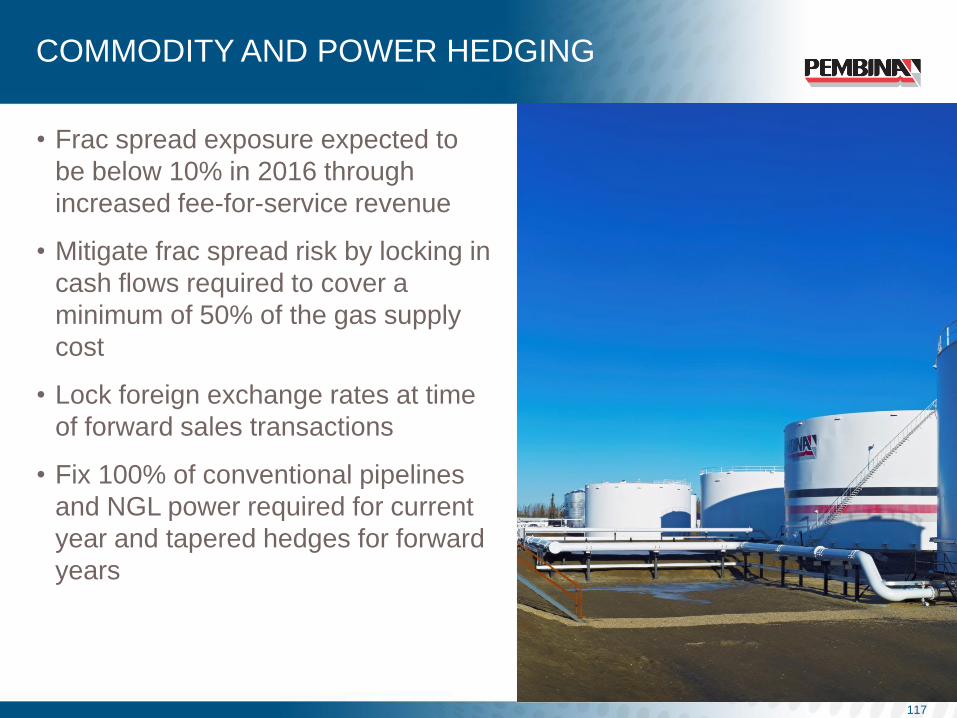
• Frac spread exposure expected to
be below 10% in 2016 through
increased fee-for-service revenue
• Mitigate frac spread risk by locking in
cash flows required to cover a
minimum of 50% of the gas supply
cost
• Lock foreign exchange rates at time
of forward sales transactions
• Fix 100% of conventional pipelines
and NGL power required for current
year and tapered hedges for forward
years
117
118
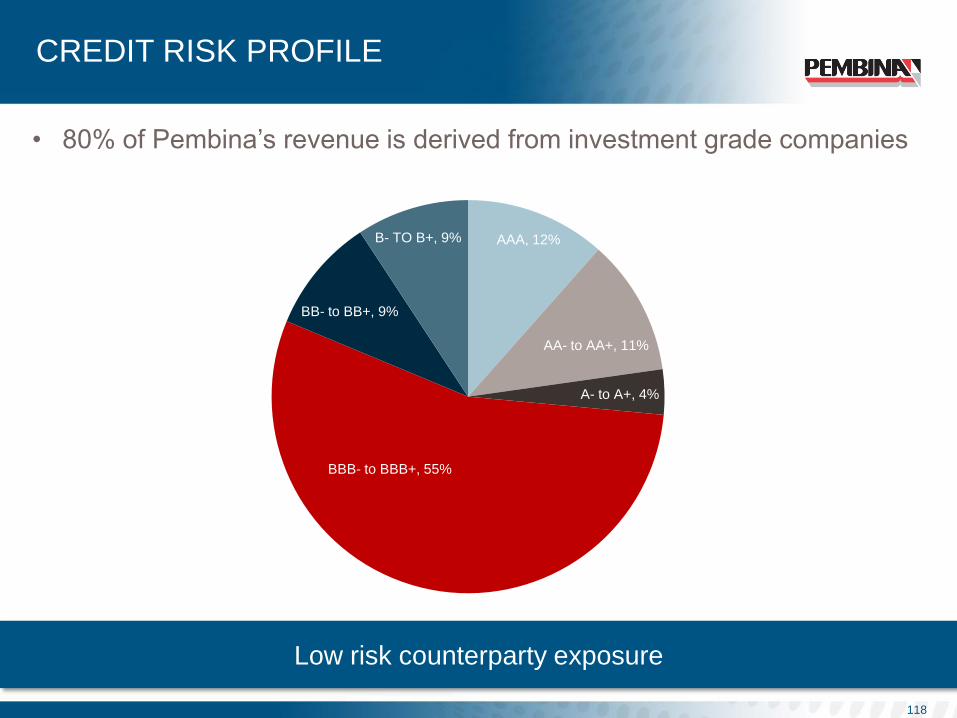
CREDIT RISK PROFILE
Low risk counterparty exposure
• 80% of Pembina’s revenue is derived from investment grade companies
AAA, 12%
AA- to AA+, 11%
A- to A+, 4%
BBB- to BBB+, 55%
BB- to BB+, 9%
B- TO B+, 9%

TAXATION
• Pembina expects to
be moderately cash
taxable in 2013
• Average annual CCA
deduction is 15% of
pool
119
Data as of September 30, 2012.
See "Forward-Looking Statements & Information.”
Estimated CCA pools
& non-capital losses 2012
CCA Pools Non-Capital
Losses
$2.4 billion $160 million

SUMMARY
Mick Dilger

2012 CORPORATE SUCCESSES
• Closed acquisition of Provident
Energy Ltd. on April 2, 2012 and
began trading on the NYSE
• Integration nearing completion with
only systems integration remaining
• Increased credit facility to $1.5
billion
• Increased dividend by 3.9% to
$0.135/month
• $450 million senior unsecured
medium-term notes issued at 3.77%
per annum on October 22, 2012
121

Saturn Gas Services /
Conventional Pipelines
• Received required regulatory approvals in Q3 2012
• Awarded construction contracts for pipelines
• Majority of major equipment for both facilities ordered
• Major equipment received at each site Resthaven
Gas Services /
Conventional Pipelines
NGL Expansion Conventional Pipelines
• Reached contractual threshold to proceed
• Received regulatory approval
• Began construction on two of the three pump stations in Q3 2012
Truck Terminals Midstream • Construction started in Q4 2012 on Judy Creek FST
Crude Expansion Conventional Pipelines • Added 50 mbpd capacity on the Drayton Valley system
Musreau
Expansion Gas Services • Deep cut and shallow cut in service Q3 2012
Storage & Other Midstream
• Commissioned 8,000 bpd expansion of Redwater fractionator on time
and under budget
• Brought fee-for-service cavern on stream at Redwater in Q3 2012
• Corunna brine pond expansion
2012 PROJECT ACCOMPLISHMENTS
122
Executing on capital commitments
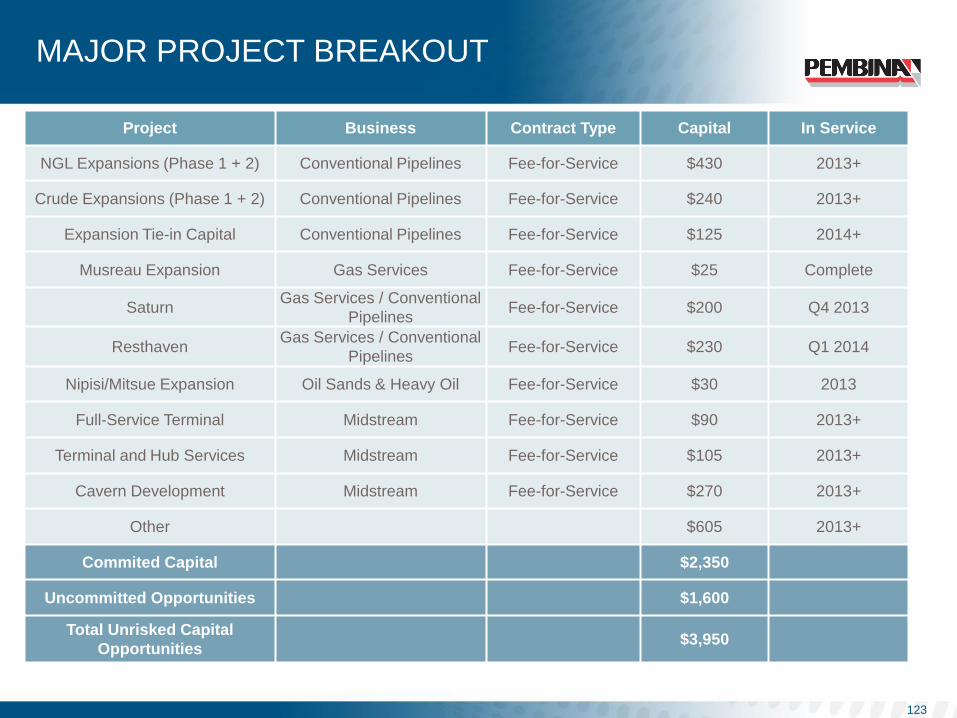
MAJOR PROJECT BREAKOUT
123
Project Business Contract Type Capital In Service
NGL Expansions (Phase 1 + 2) Conventional Pipelines Fee-for-Service $430 2013+
Crude Expansions (Phase 1 + 2) Conventional Pipelines Fee-for-Service $240 2013+
Expansion Tie-in Capital Conventional Pipelines Fee-for-Service $125 2014+
Musreau Expansion Gas Services Fee-for-Service $25 Complete
Saturn Gas Services / Conventional
Pipelines Fee-for-Service $200 Q4 2013
Resthaven Gas Services / Conventional
Pipelines Fee-for-Service $230 Q1 2014
Nipisi/Mitsue Expansion Oil Sands & Heavy Oil Fee-for-Service $30 2013
Full-Service Terminal Midstream Fee-for-Service $90 2013+
Terminal and Hub Services Midstream Fee-for-Service $105 2013+
Cavern Development Midstream Fee-for-Service $270 2013+
Other $605 2013+
Commited Capital $2,350
Uncommitted Opportunities $1,600
Total Unrisked Capital
Opportunities $3,950
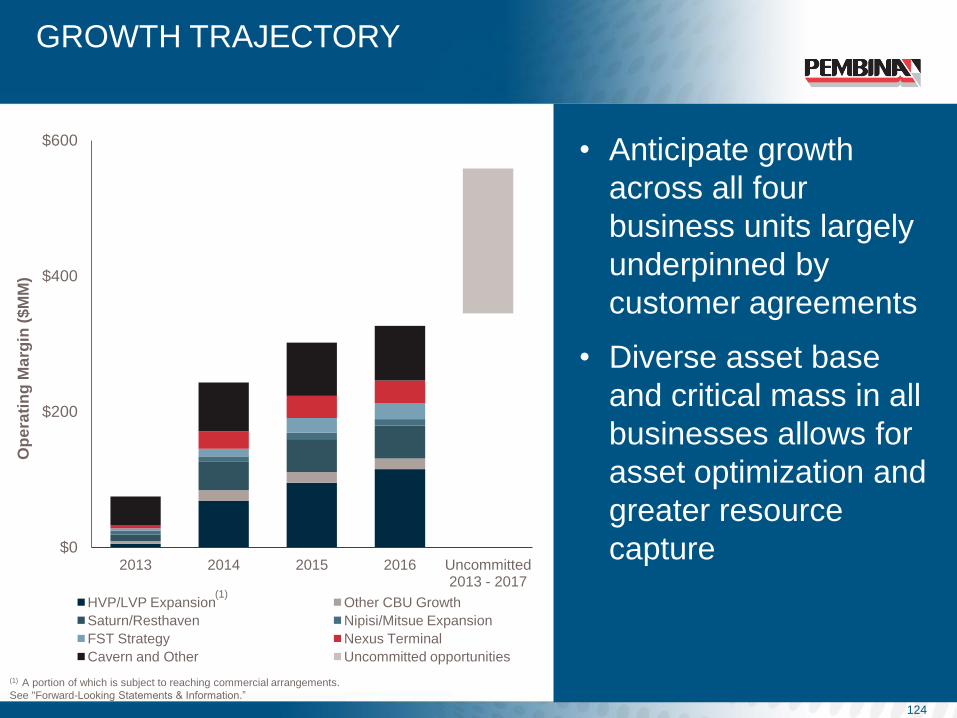
GROWTH TRAJECTORY
• Anticipate growth
across all four
business units largely
underpinned by
customer agreements
• Diverse asset base
and critical mass in all
businesses allows for
asset optimization and
greater resource
capture
124
$0
$200
$400
$600
2013 2014 2015 2016 Uncommitted 2013 - 2017
HVP/LVP Expansion Other CBU Growth
Saturn/Resthaven Nipisi/Mitsue Expansion
FST Strategy Nexus Terminal
Cavern and Other Uncommitted opportunities
Op
era
tin
g M
arg
in (
$M
M)
(1)
(1) A portion of which is subject to reaching commercial arrangements.
See "Forward-Looking Statements & Information.”

SUMMARY
• Proven track record and management team
• Solid historical financial and operational performance under experienced leaders
• Demonstrated ability to execute on business plan and generate returns for shareholders
• Strategically located and well-established infrastructure
• Extensive asset footprint and high barriers to entry near long-life resource plays
• Highly contracted and stable cash flow
• Fee-for-service focused capital program
• Strong growth portfolio
• ~$4 billion of unrisked projects
• Strong balance sheet
• Investment-grade credit rating with proven access to debt/equity markets and financial flexibility
• History of stable and growing dividends
125

GOING THE DISTANCE
BOB MICHALESKI Chief Executive Officer
MICK DILGER President & Chief Operating Officer
PETER ROBERTSON Vice President, Finance & Chief Financial Officer
SCOTT BURROWS Senior Manager, Corporate Development &
Planning
Pembina Pipeline Corporation
www.pembina.com
Suite 3800, 525 – 8th Avenue S.W.
Calgary, AB T2P 1G1
Phone 403-231-3156
Fax 403-237-0254
Toll Free 1-855-880-7404
Email [email protected]
Trustee, Registrar & Transfer Agent
Computershare Trust Company of Canada
Suite 600, 530 – 8th Avenue S.W.
Calgary, Alberta T2P 3S8
1-800-564-6253
126
BOB MICHALESKI Chief Executive Officer
MICK DILGER President & Chief Operating Officer
PETER ROBERTSON Vice President, Finance & Chief Financial Officer
SCOTT BURROWS Senior Manager, Corporate Development & Planning
Pembina Pipeline Corporation
www.pembina.com
Suite 3800, 525 – 8th Avenue S.W.
Calgary, AB T2P 1G1
Phone 403-231-3156
Fax 403-237-0254
Toll Free 1-855-880-7404
Email [email protected]
Trustee, Registrar & Transfer Agent
Computershare Trust Company of Canada
Suite 600, 530 – 8th Avenue S.W.
Calgary, Alberta T2P 3S8
1-800-564-6253

APPENDIX
This presentation uses the terms "total enterprise value" (Pembina's market capitalization
plus long-term debt and convertible debentures) and "operating margin" (revenue less
operating expenses and product purchases), which are not recognized under Canadian
generally accepted accounting principles (GAAP). Management believes these non-GAAP
measures provide an indication of the results generated by Pembina's business activities and
the value those businesses generate. Investors should be cautioned that these non-GAAP
measures should not be construed as an alternative to net earnings, cash flow from operating
activities or other measures of financial performance determined in accordance with GAAP as
an indicator of Pembina's performance. Furthermore, these measures may not be
comparable to similar measures presented by others.
127