analysts presentation, 16 august 2012 - issuer...
TRANSCRIPT
© SBM Offshore 2012. All rights reserved. www.sbmoffshore.com
Analysts Presentation, 16 August 2012
© SBM Offshore 2012. All rights reserved. www.sbmoffshore.com
Disclaimer
Some of the statements contained in this presentation that are not historical facts are statements of future expectations and other forward-looking statements based on management’s current views and assumptions and involve known and unknown risks and uncertainties that could cause actual results, performance, or events to differ materially from those in such statements. Such forward-looking statements are subject to various risks and uncertainties, which may cause actual results and performance of the Company’s business to differ materially and adversely from the forward-looking statements.
Should one or more of these risks or
uncertainties materialize, or should
underlying assumptions prove incorrect,
actual results may vary materially from
those described in this presentation as
anticipated, believed, or expected. SBM
Offshore NV does not intend, and does not
assume any obligation, to update any
industry information or forward-looking
statements set forth in this presentation to
reflect subsequent events or
circumstances.
2
© SBM Offshore 2012. All rights reserved. www.sbmoffshore.com
H1 2012 Review
© SBM Offshore 2012. All rights reserved. www.sbmoffshore.com
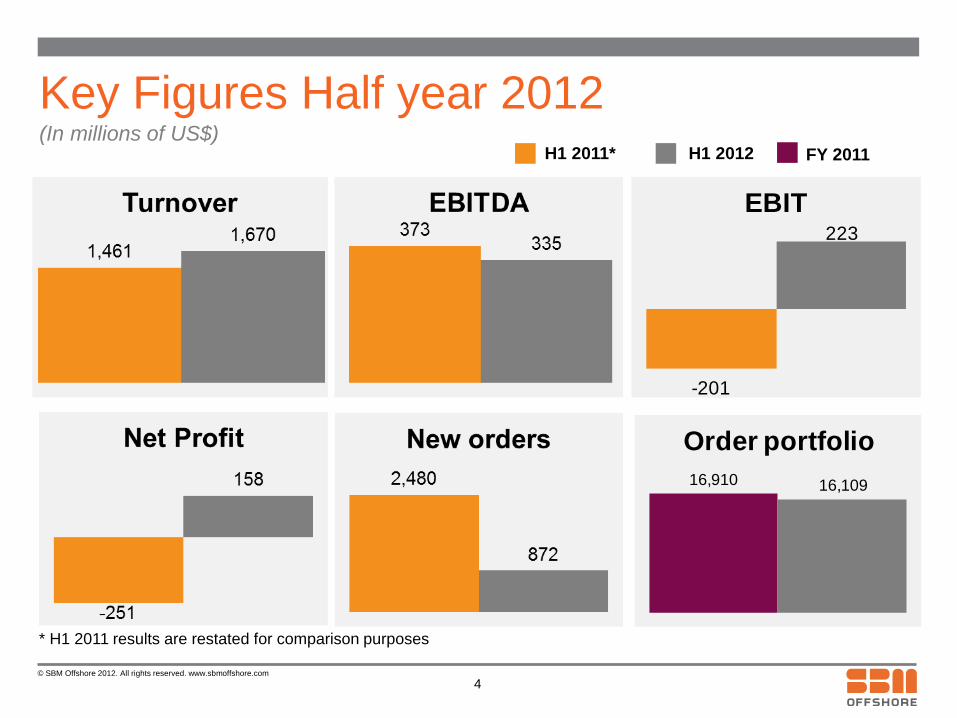
Key Figures Half year 2012 (In millions of US$)
H1 2011* H1 2012
4
* H1 2011 results are restated for comparison purposes
FY 2011
-201
223
EBIT
16,910 16,109
Order portfolio
© SBM Offshore 2012. All rights reserved. www.sbmoffshore.com
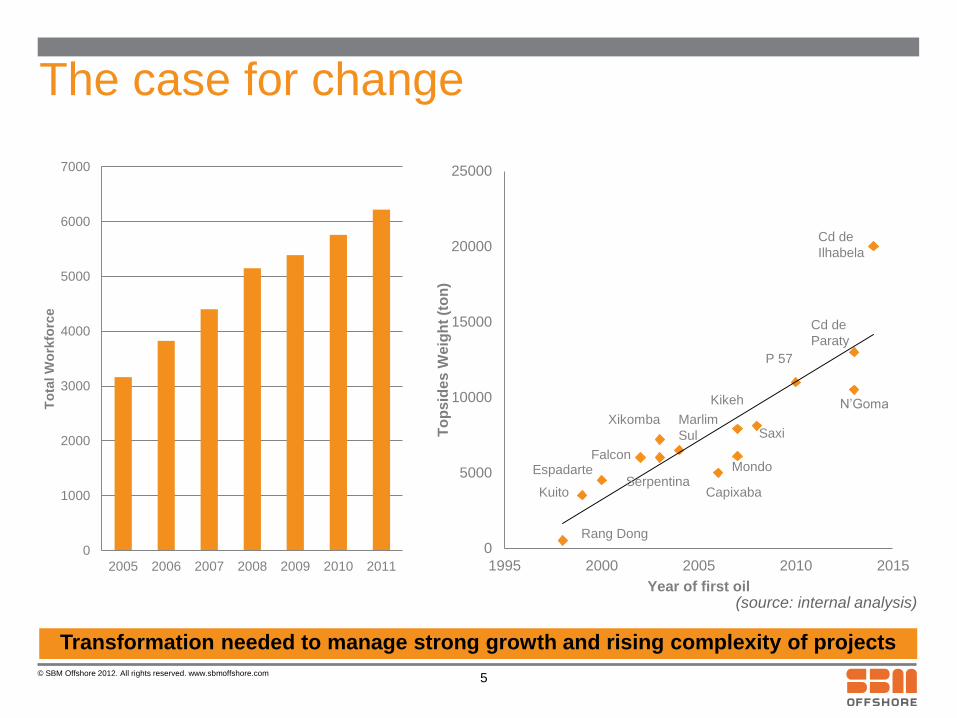
The case for change
Transformation needed to manage strong growth and rising complexity of projects
(source: internal analysis)
0
5000
10000
15000
20000
25000
1995 2000 2005 2010 2015
To
ps
ide
s W
eig
ht
(to
n)
Year of first oil
Kuito
Espadarte
Xikomba
Falcon
Marlim
Sul
Serpentina
Cd de
Paraty
Capixaba
P 57
Mondo
Saxi
N’Goma
Cd de
Ilhabela
Rang Dong
Kikeh
0
1000
2000
3000
4000
5000
6000
7000
2005 2006 2007 2008 2009 2010 2011
To
tal W
ork
forc
e
5
© SBM Offshore 2012. All rights reserved. www.sbmoffshore.com
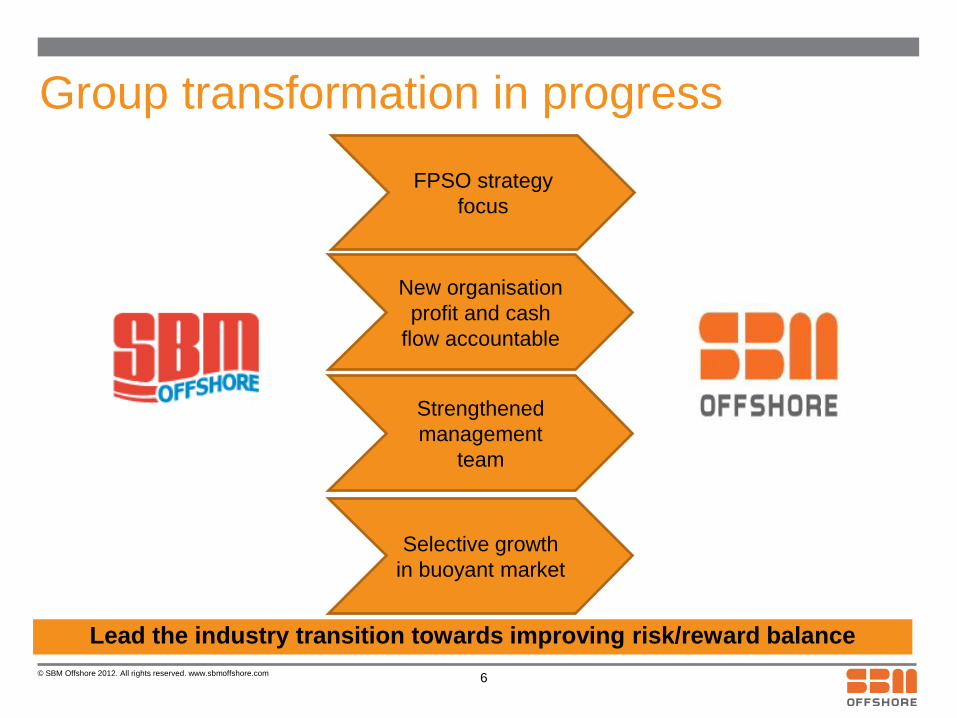
Group transformation in progress
6
New organisation
profit and cash
flow accountable
Strengthened
management
team
Selective growth
in buoyant market
FPSO strategy
focus
Lead the industry transition towards improving risk/reward balance
© SBM Offshore 2012. All rights reserved. www.sbmoffshore.com
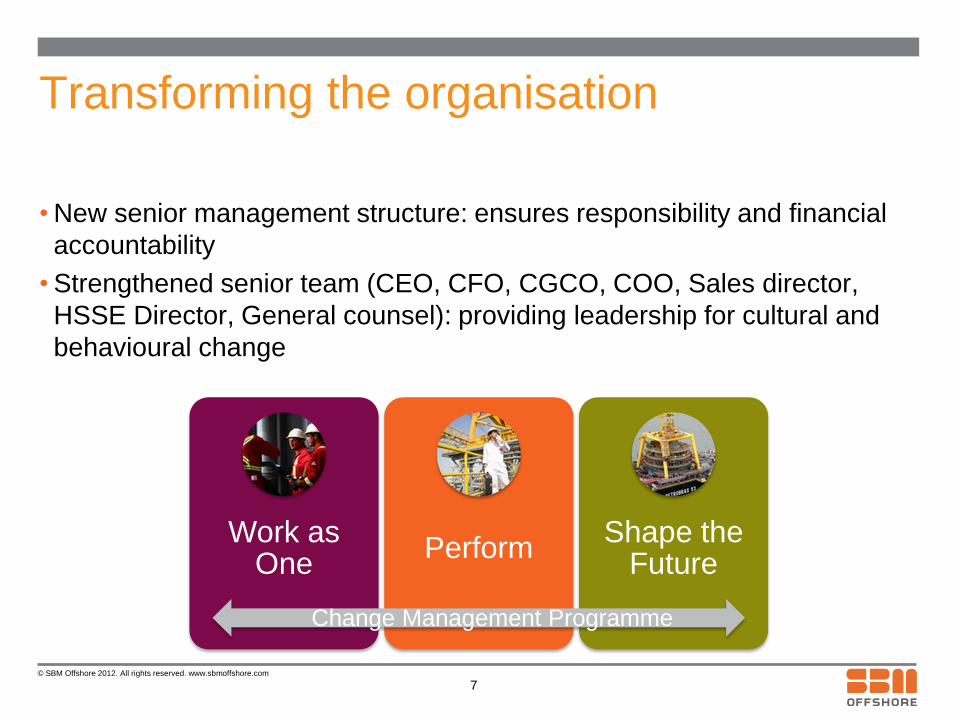
Transforming the organisation
• New senior management structure: ensures responsibility and financial
accountability
• Strengthened senior team (CEO, CFO, CGCO, COO, Sales director,
HSSE Director, General counsel): providing leadership for cultural and
behavioural change
7
Work as One
Perform Shape the
Future
Change Management Programme
© SBM Offshore 2012. All rights reserved. www.sbmoffshore.com
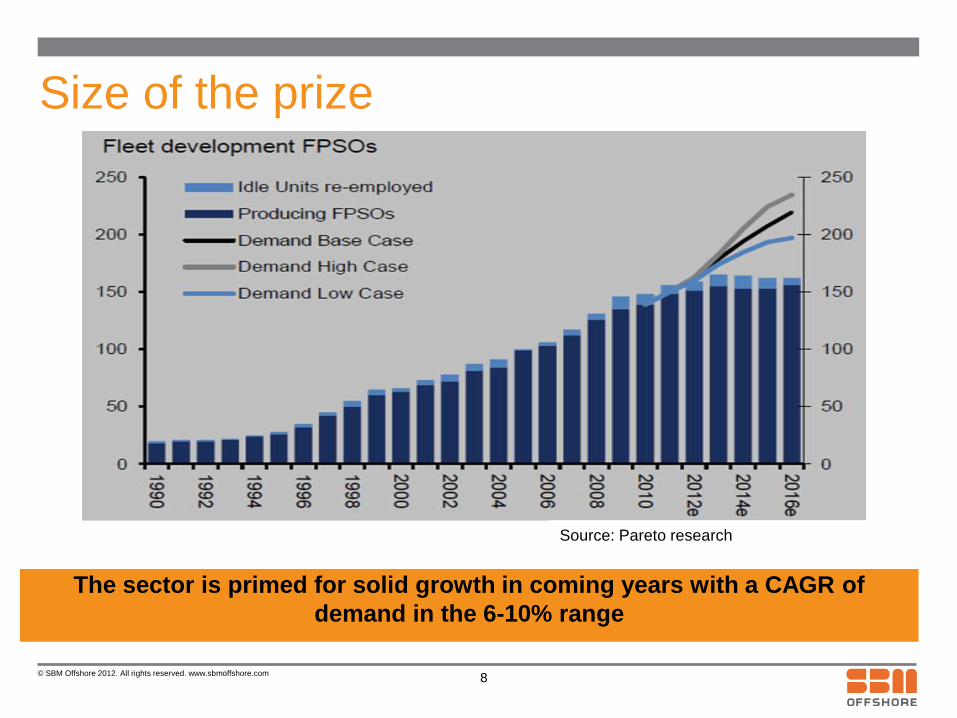
Size of the prize
The sector is primed for solid growth in coming years with a CAGR of
demand in the 6-10% range
8
Source: Pareto research
© SBM Offshore 2012. All rights reserved. www.sbmoffshore.com
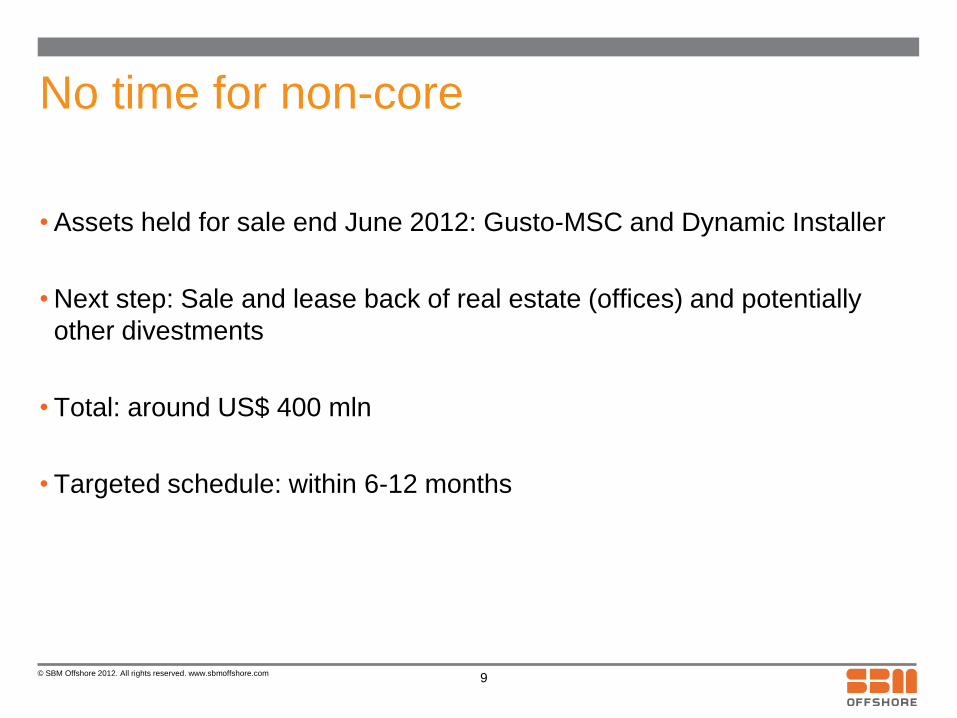
No time for non-core
• Assets held for sale end June 2012: Gusto-MSC and Dynamic Installer
• Next step: Sale and lease back of real estate (offices) and potentially
other divestments
• Total: around US$ 400 mln
• Targeted schedule: within 6-12 months
9
© SBM Offshore 2012. All rights reserved. www.sbmoffshore.com
10
FPSO
FPSO
FPSO About our Strategy: The Company has refocused its product line on core FPSO products and associated services. By focusing on core products with historically good margins whilst improving execution standards and project risk profiles, the Company believes it will return to delivering superior financial returns.
© SBM Offshore 2012. All rights reserved. www.sbmoffshore.com
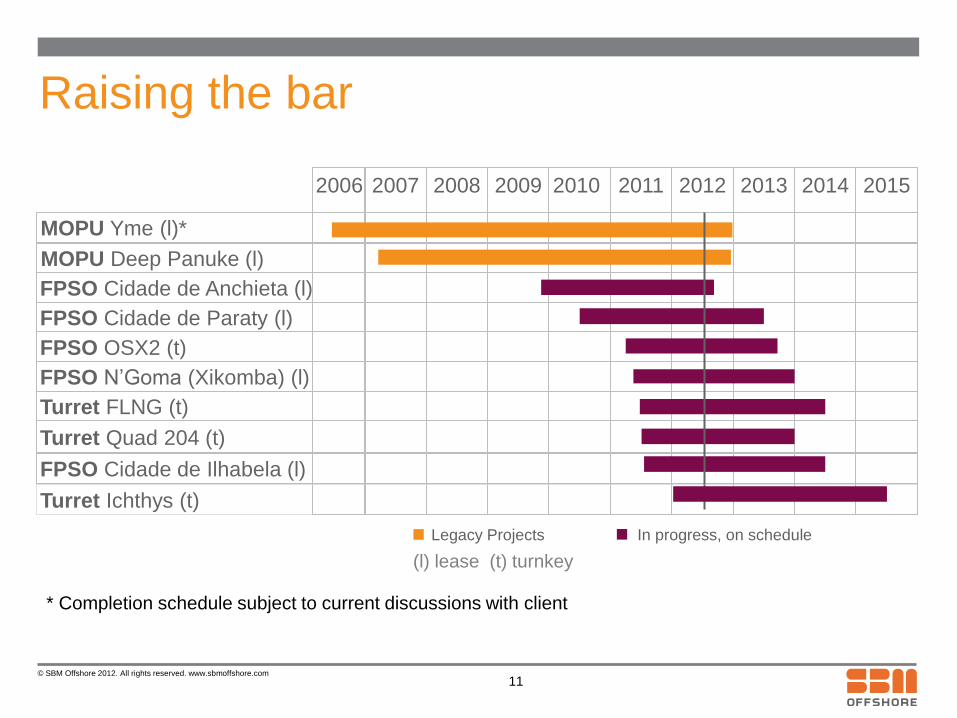
Raising the bar
Legacy Projects In progress, on schedule
2006 2007 2008 2009 2010 2011 2012 2013 2014
MOPU Yme (l)*
MOPU Deep Panuke (l)
FPSO Cidade de Anchieta (l)
FPSO Cidade de Paraty (l)
FPSO OSX2 (t)
Turret FLNG (t)
FPSO N’Goma (Xikomba) (l)
Turret Quad 204 (t)
FPSO Cidade de Ilhabela (l)
2015
Turret Ichthys (t)
(l) lease (t) turnkey
11
* Completion schedule subject to current discussions with client
© SBM Offshore 2012. All rights reserved. www.sbmoffshore.com
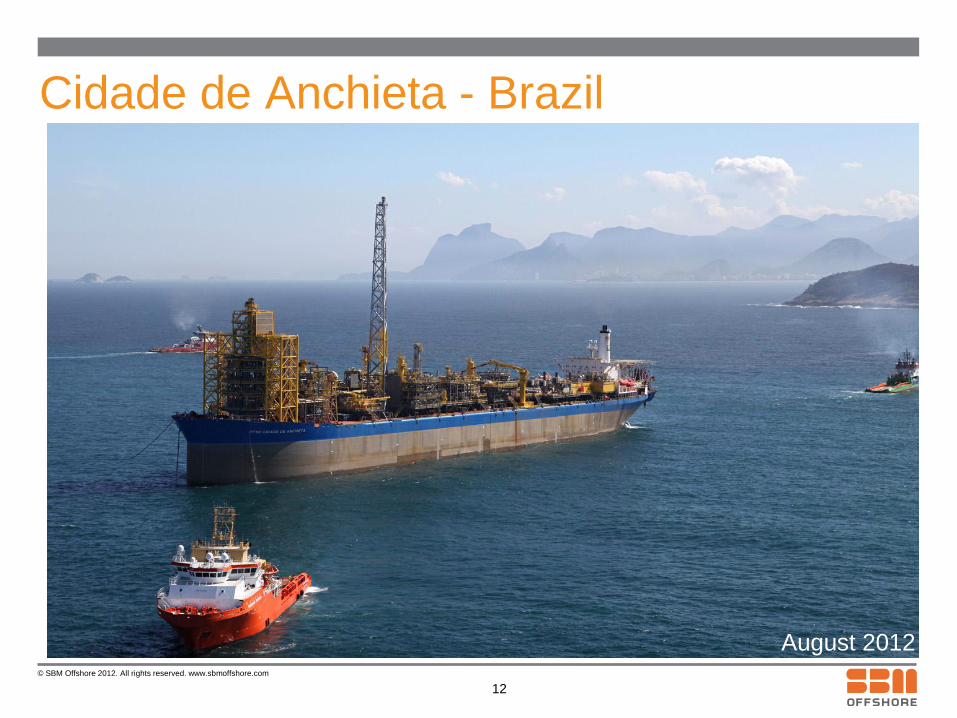
Cidade de Anchieta - Brazil
12
August 2012

© SBM Offshore 2012. All rights reserved. www.sbmoffshore.com
Cidade de Paraty - Brazil
13
July 2012
© SBM Offshore 2012. All rights reserved. www.sbmoffshore.com
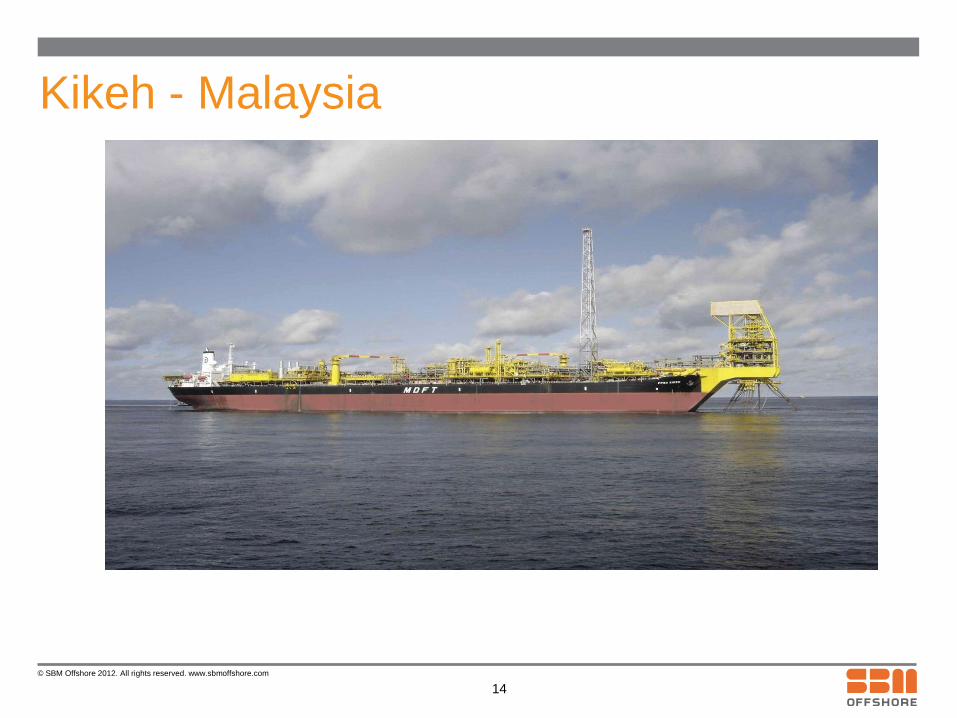
Kikeh - Malaysia
14
July 2012
© SBM Offshore 2012. All rights reserved. www.sbmoffshore.com
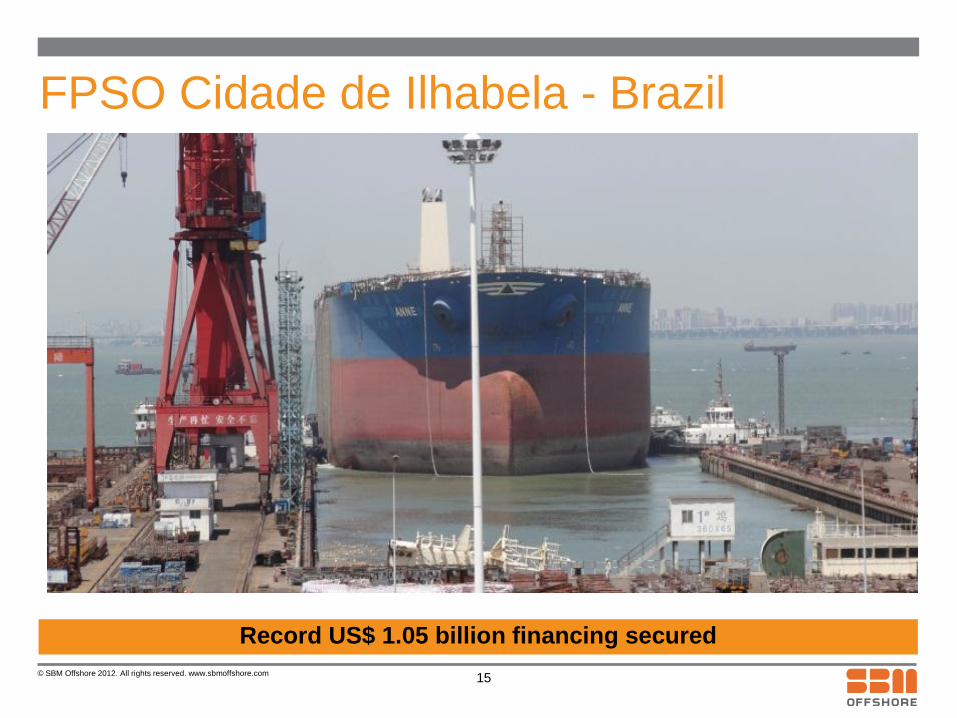
FPSO Cidade de Ilhabela - Brazil
15
Record US$ 1.05 billion financing secured
Q2 2012
© SBM Offshore 2012. All rights reserved. www.sbmoffshore.com
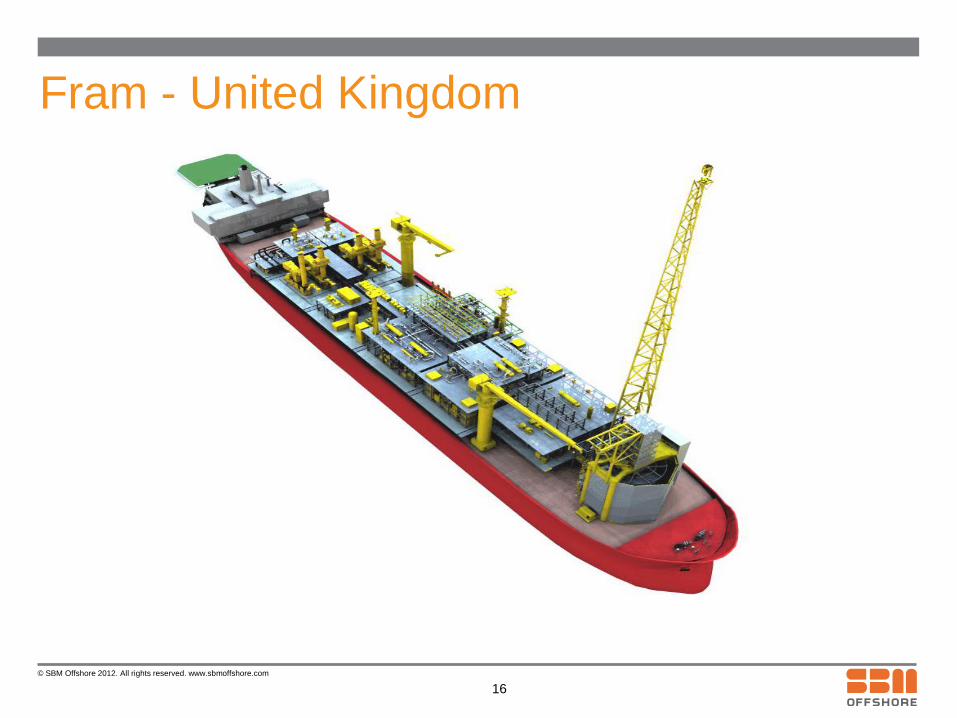
Fram - United Kingdom
16
July 2012
© SBM Offshore 2012. All rights reserved. www.sbmoffshore.com
H1 2012 Financials
© SBM Offshore 2012. All rights reserved. www.sbmoffshore.com
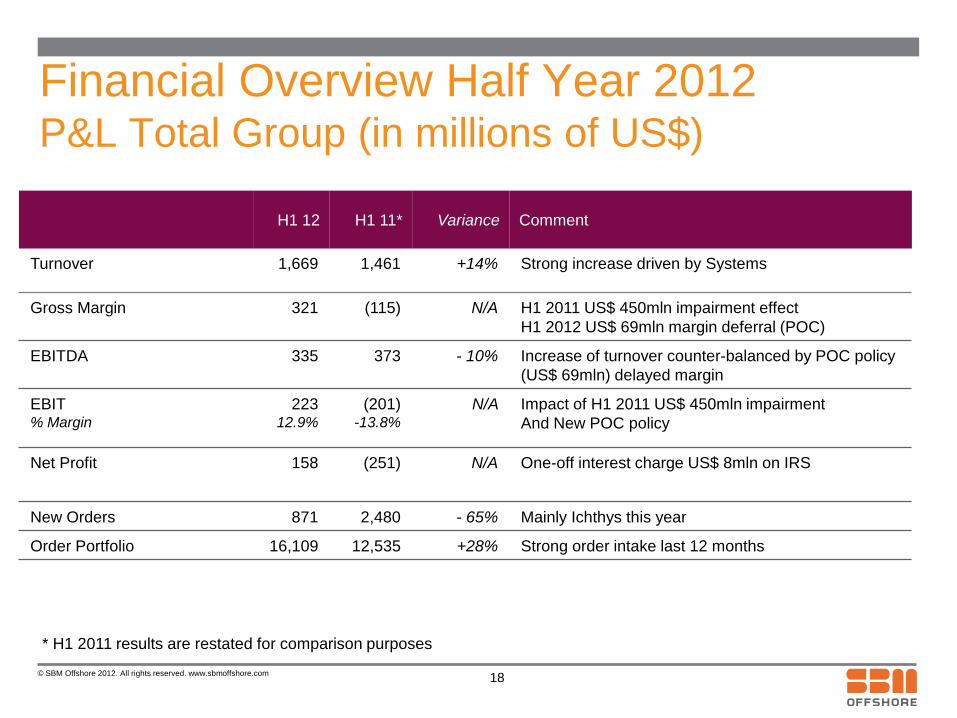
Financial Overview Half Year 2012 P&L Total Group (in millions of US$)
H1 12 H1 11* Variance Comment
Turnover 1,669 1,461 +14% Strong increase driven by Systems
Gross Margin 321 (115) N/A H1 2011 US$ 450mln impairment effect
H1 2012 US$ 69mln margin deferral (POC)
EBITDA 335 373 - 10% Increase of turnover counter-balanced by POC policy
(US$ 69mln) delayed margin
EBIT % Margin
223 12.9%
(201) -13.8%
N/A
Impact of H1 2011 US$ 450mln impairment
And New POC policy
Net Profit 158 (251) N/A
One-off interest charge US$ 8mln on IRS
New Orders 871 2,480 - 65% Mainly Ichthys this year
Order Portfolio 16,109 12,535 +28% Strong order intake last 12 months
18
* H1 2011 results are restated for comparison purposes
© SBM Offshore 2012. All rights reserved. www.sbmoffshore.com
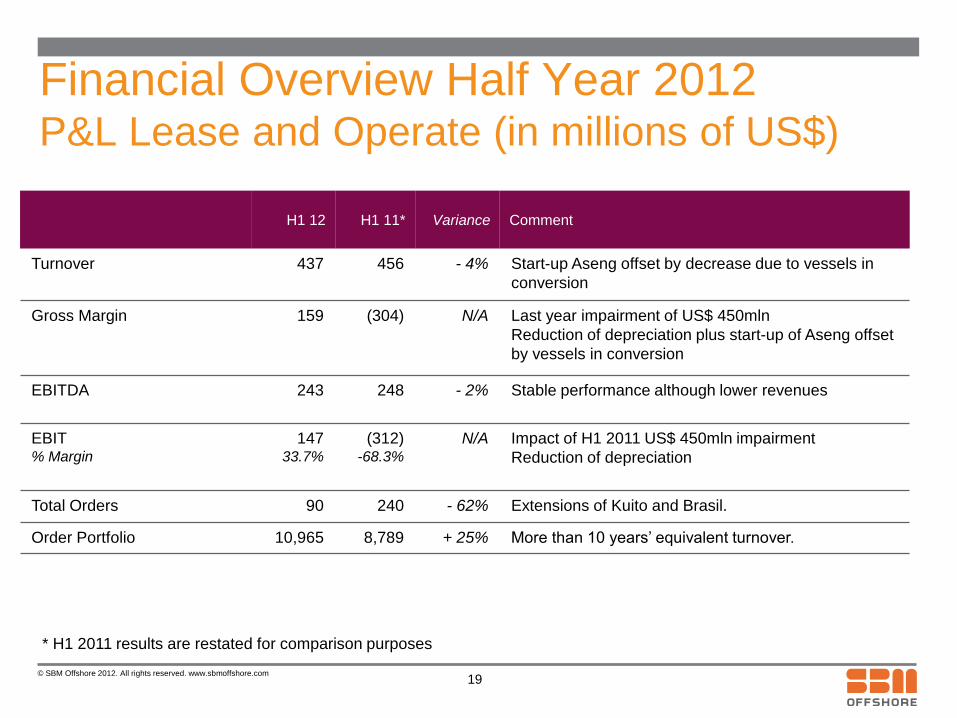
Financial Overview Half Year 2012 P&L Lease and Operate (in millions of US$)
H1 12 H1 11* Variance Comment
Turnover 437 456 - 4% Start-up Aseng offset by decrease due to vessels in
conversion
Gross Margin 159
(304) N/A
Last year impairment of US$ 450mln
Reduction of depreciation plus start-up of Aseng offset
by vessels in conversion
EBITDA 243 248 - 2% Stable performance although lower revenues
EBIT % Margin
147 33.7%
(312) -68.3%
N/A
Impact of H1 2011 US$ 450mln impairment
Reduction of depreciation
Total Orders 90 240 - 62% Extensions of Kuito and Brasil.
Order Portfolio 10,965 8,789 + 25% More than 10 years’ equivalent turnover.
19
* H1 2011 results are restated for comparison purposes
© SBM Offshore 2012. All rights reserved. www.sbmoffshore.com
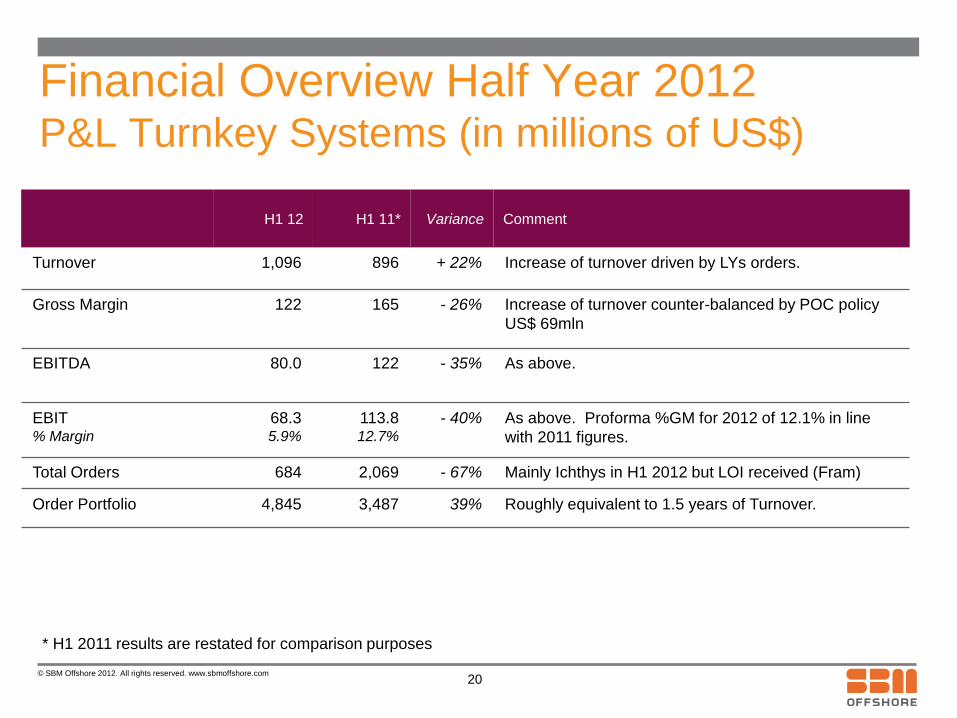
Financial Overview Half Year 2012 P&L Turnkey Systems (in millions of US$)
H1 12 H1 11* Variance Comment
Turnover 1,096 896 + 22% Increase of turnover driven by LYs orders.
Gross Margin 122 165 - 26% Increase of turnover counter-balanced by POC policy
US$ 69mln
EBITDA
80.0 122 - 35% As above.
EBIT % Margin
68.3 5.9%
113.8 12.7%
- 40% As above. Proforma %GM for 2012 of 12.1% in line
with 2011 figures.
Total Orders 684 2,069 - 67% Mainly Ichthys in H1 2012 but LOI received (Fram)
Order Portfolio 4,845 3,487 39% Roughly equivalent to 1.5 years of Turnover.
* H1 2011 results are restated for comparison purposes
20
© SBM Offshore 2012. All rights reserved. www.sbmoffshore.com
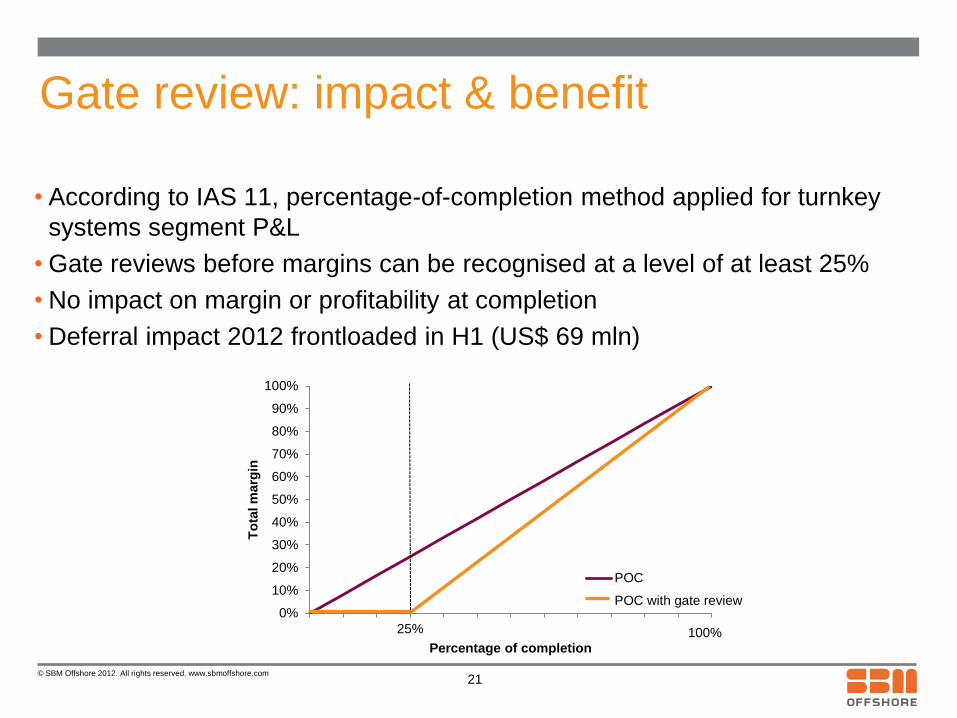
Gate review: impact & benefit
• According to IAS 11, percentage-of-completion method applied for turnkey
systems segment P&L
• Gate reviews before margins can be recognised at a level of at least 25%
• No impact on margin or profitability at completion
• Deferral impact 2012 frontloaded in H1 (US$ 69 mln)
21
0%
10%
20%
30%
40%
50%
60%
70%
80%
90%
100%
25%
To
tal m
arg
in
Percentage of completion
POC
POC with gate review
100%
© SBM Offshore 2012. All rights reserved. www.sbmoffshore.com
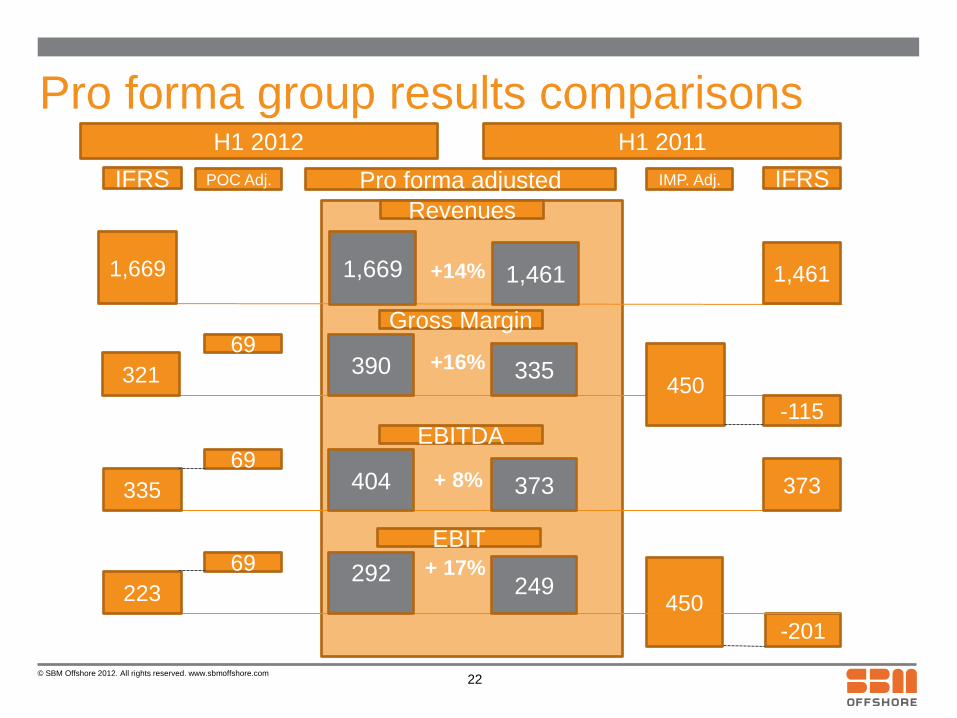
H1 2012 H1 2011
Pro forma adjusted IFRS POC Adj. IFRS
450
-201
321
69 390 335
450 -115
335
69 404 373 373
223
69 292
249
Gross Margin
EBITDA
EBIT
Pro forma group results comparisons
22
1,669 1,669 1,461
Revenues
1,461
IMP. Adj.
+14%
+16%
+ 8%
+ 17%
© SBM Offshore 2012. All rights reserved. www.sbmoffshore.com
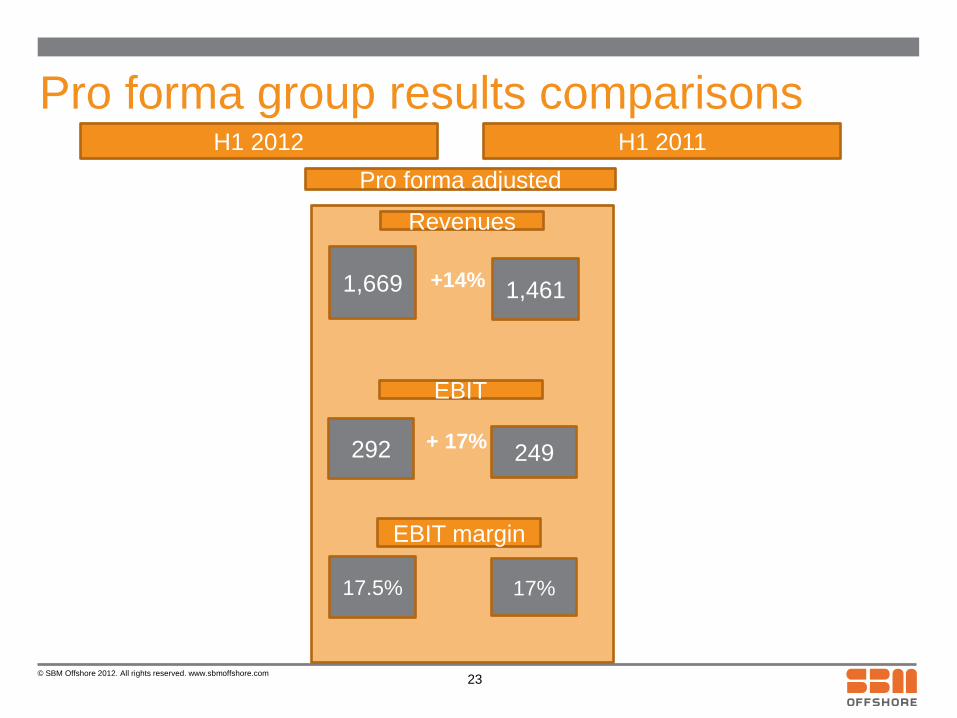
H1 2012 H1 2011
Pro forma adjusted
292 249
17.5% 17%
EBIT
EBIT margin
Pro forma group results comparisons
23
1,669
1,461
Revenues
+14%
+ 17%
© SBM Offshore 2012. All rights reserved. www.sbmoffshore.com
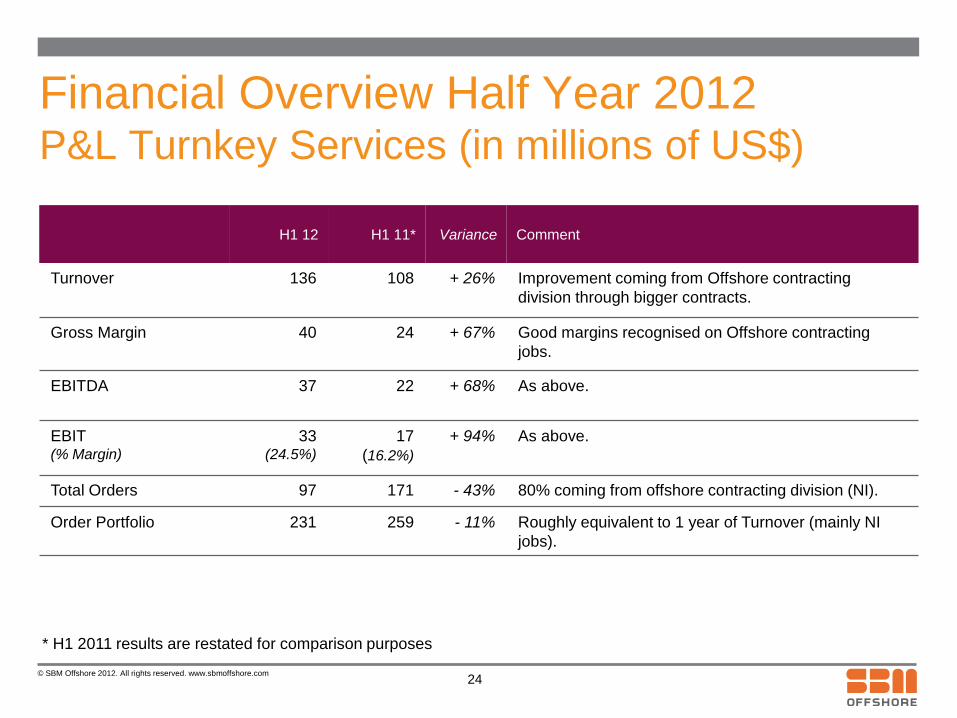
Financial Overview Half Year 2012 P&L Turnkey Services (in millions of US$)
H1 12 H1 11* Variance Comment
Turnover 136 108 + 26% Improvement coming from Offshore contracting
division through bigger contracts.
Gross Margin 40 24 + 67% Good margins recognised on Offshore contracting
jobs.
EBITDA 37 22 + 68% As above.
EBIT (% Margin)
33 (24.5%)
17
(16.2%)
+ 94% As above.
Total Orders 97 171 - 43% 80% coming from offshore contracting division (NI).
Order Portfolio 231 259 - 11% Roughly equivalent to 1 year of Turnover (mainly NI
jobs).
* H1 2011 results are restated for comparison purposes
24
© SBM Offshore 2012. All rights reserved. www.sbmoffshore.com
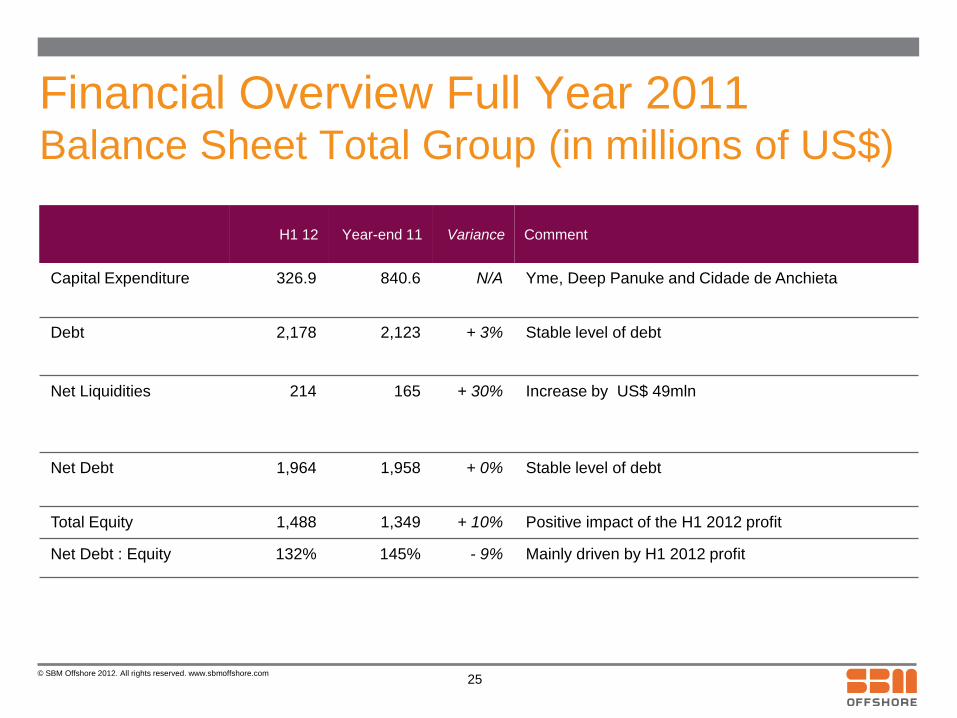
Financial Overview Full Year 2011 Balance Sheet Total Group (in millions of US$)
H1 12 Year-end 11 Variance Comment
Capital Expenditure 326.9 840.6 N/A Yme, Deep Panuke and Cidade de Anchieta
Debt 2,178 2,123 + 3% Stable level of debt
Net Liquidities 214 165 + 30% Increase by US$ 49mln
Net Debt 1,964 1,958 + 0% Stable level of debt
Total Equity 1,488 1,349 + 10% Positive impact of the H1 2012 profit
Net Debt : Equity 132% 145% - 9% Mainly driven by H1 2012 profit
25
© SBM Offshore 2012. All rights reserved. www.sbmoffshore.com
Financing capacity
• Record project financing > $1 billion on Ilhabela (July 2012)
• Refinancing Normand Installer US$80 mln
• Solvency 31.5% (year-end 2011: 30.0%)
• Net debt / Adjusted EBITDA 2.2 times (year-end 2011: 2.23 times)
• Average cost of debt H1 2012 5.2% (H1 2011: 5.2%)
• Cash US$ 214 mln
• Available undrawn facilities US$1,035 mln
• Target divestment proceeds non-core assets of some US$400 mln
© SBM Offshore 2012. All rights reserved. www.sbmoffshore.com
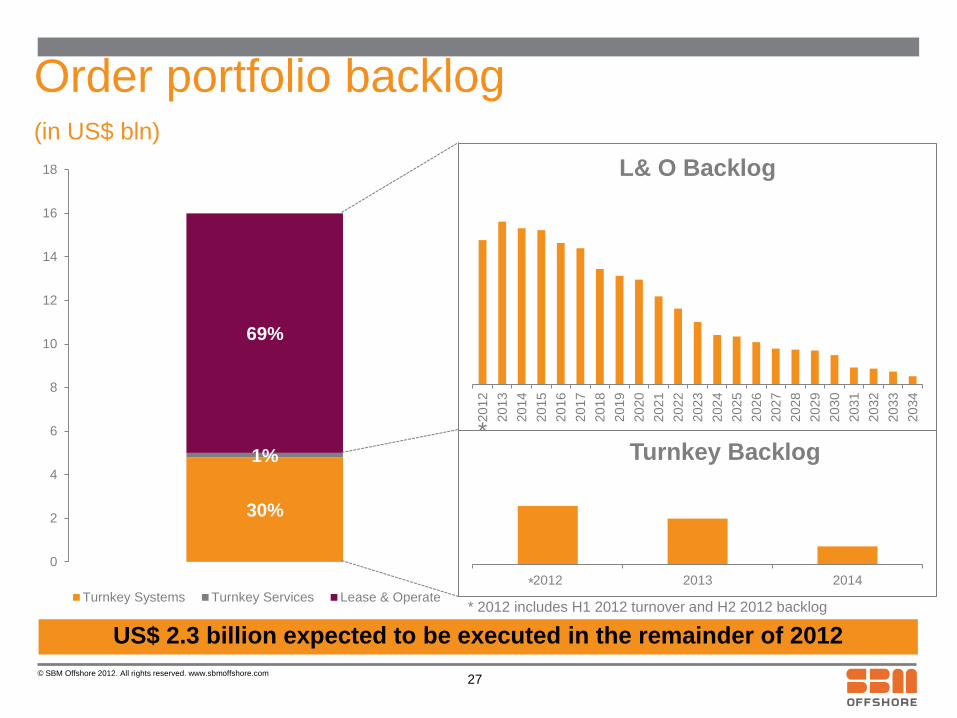
Order portfolio backlog (in US$ bln)
27
30%
1%
69%
0
2
4
6
8
10
12
14
16
18
Turnkey Systems Turnkey Services Lease & Operate
20
12
20
13
20
14
20
15
20
16
20
17
20
18
20
19
20
20
20
21
20
22
20
23
20
24
20
25
20
26
20
27
20
28
20
29
20
30
20
31
20
32
20
33
20
34
L& O Backlog
2012 2013 2014
Turnkey Backlog
*
US$ 2.3 billion expected to be executed in the remainder of 2012
*
* 2012 includes H1 2012 turnover and H2 2012 backlog

© SBM Offshore 2012. All rights reserved. www.sbmoffshore.com
Outlook
© SBM Offshore 2012. All rights reserved. www.sbmoffshore.com
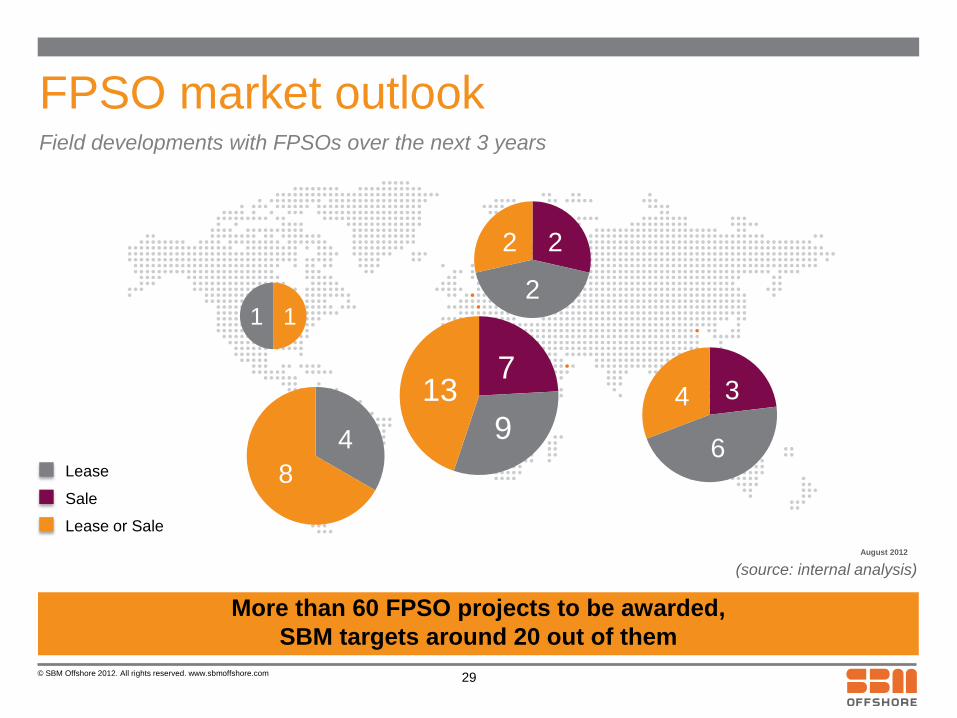
FPSO market outlook Field developments with FPSOs over the next 3 years
More than 60 FPSO projects to be awarded,
SBM targets around 20 out of them
August 2012
29
(source: internal analysis)
Lease
Sale
Lease or Sale
7
9
13 3
6
4
1 1
4
8
2
2
2
© SBM Offshore 2012. All rights reserved. www.sbmoffshore.com
Financial Outlook 2012
• Turnover in the region of US$ 4 billion
• Turnkey Systems EBIT margin close to 10% range, reflecting new gross
margin recognition principles
• Turnkey Services EBIT margin in the 15%-20% range
• Lease and Operate EBIT margin in-line with 2011 underlying level
• Net financing costs (in P&L) close to twice the level of 2011 due to
operating fleet growth
30

© SBM Offshore 2012. All rights reserved. www.sbmoffshore.com
Q&A Session
© SBM Offshore 2012. All rights reserved. www.sbmoffshore.com
Notes