investor day 2008: 2008-2010 strategic plan presentation
TRANSCRIPT

8/6/2019 Investor Day 2008: 2008-2010 Strategic Plan Presentation
http://slidepdf.com/reader/full/investor-day-2008-2008-2010-strategic-plan-presentation 1/13
1
Piaggio Group 2008-2010
Mr. Michele Pallottini
Finance General Manager Piaggio Group

8/6/2019 Investor Day 2008: 2008-2010 Strategic Plan Presentation
http://slidepdf.com/reader/full/investor-day-2008-2008-2010-strategic-plan-presentation 2/13
8/6/2019 Investor Day 2008: 2008-2010 Strategic Plan Presentation
http://slidepdf.com/reader/full/investor-day-2008-2008-2010-strategic-plan-presentation 3/13
3
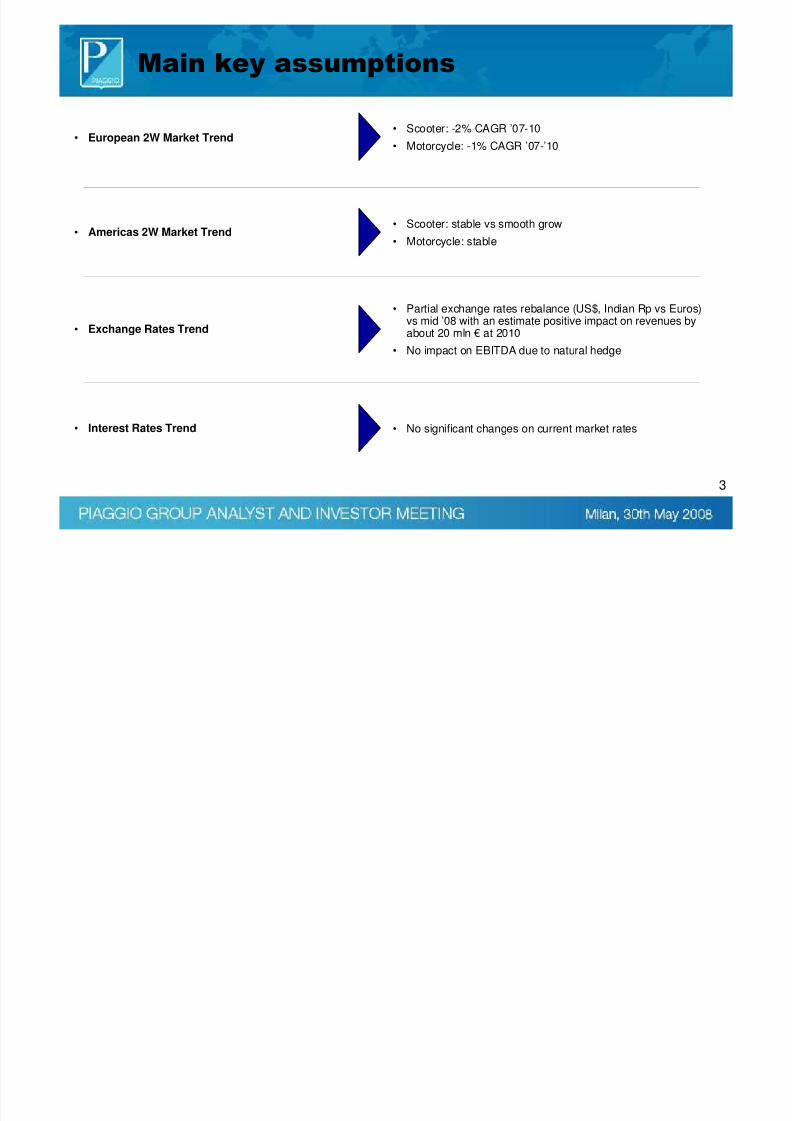
Main key assumptions
• European 2W Market Trend• Scooter: -2% CAGR ’07-10
• Motorcycle: -1% CAGR ’07-’10
• Exchange Rates Trend
• Partial exchange rates rebalance (US$, Indian Rp vs Euros)vs mid ’08 with an estimate positive impact on revenues byabout 20 mln € at 2010
• No impact on EBITDA due to natural hedge
• Americas 2W Market Trend• Scooter: stable vs smooth grow
• Motorcycle: stable
• Interest Rates Trend • No significant changes on current market rates

8/6/2019 Investor Day 2008: 2008-2010 Strategic Plan Presentation
http://slidepdf.com/reader/full/investor-day-2008-2008-2010-strategic-plan-presentation 4/13
4
~ 1.710~ 1.800
~ 1.950
1.3731.452
1.6071.692
2004 2005 2006 2007 2008E 2009E 2010E
Key Financial Indicators EvolutionKey Financial Indicators EvolutionKey Financial Indicators EvolutionKey Financial Indicators Evolution
8,3% Ebitda Margin 12,7% 12,7% 13,4% ~ 13,2% ~ 13,2% ~ 13,5%
Debt on Ebitda
521.5
2,2 1,6 1,2 ~ 1,5 ~ 1,3 ~ 1,0
Revenues
411.4
318.0
269.8
~ 340 ~ 310
~ 270
Net FinancialPosition

8/6/2019 Investor Day 2008: 2008-2010 Strategic Plan Presentation
http://slidepdf.com/reader/full/investor-day-2008-2008-2010-strategic-plan-presentation 5/13
5
Scooter2007
Scooter
VC Europe
Moto
~ 770
VCEurope
Moto
(34,8%) (4,9%)(5,8%)
~ 2,8%~ 2,8%
~ 1,6%~ 1,6%
~ 1,2%~ 1,2%
~ 5,8%~ 5,8%
CAGR ‘07-’10
Scooter
VC Europe
Moto
Total
’07-’10 Growth: ~ 61,5
708,5Total
VC India
VC India
(54,5%) ~ 6,8%~ 6,8% VC India
2010 E
(…%) contribution ontotal ‘07-’10 growth
Volumes: Breakdown by BusinessVolumes: Breakdown by BusinessVolumes: Breakdown by BusinessVolumes: Breakdown by Business.000 sell-in units
453,1 ~ 474,5
81,6~ 84,6
19,5~ 23
154,4~ 188
33,621,4 3,0 3,5
8/6/2019 Investor Day 2008: 2008-2010 Strategic Plan Presentation
http://slidepdf.com/reader/full/investor-day-2008-2008-2010-strategic-plan-presentation 6/13
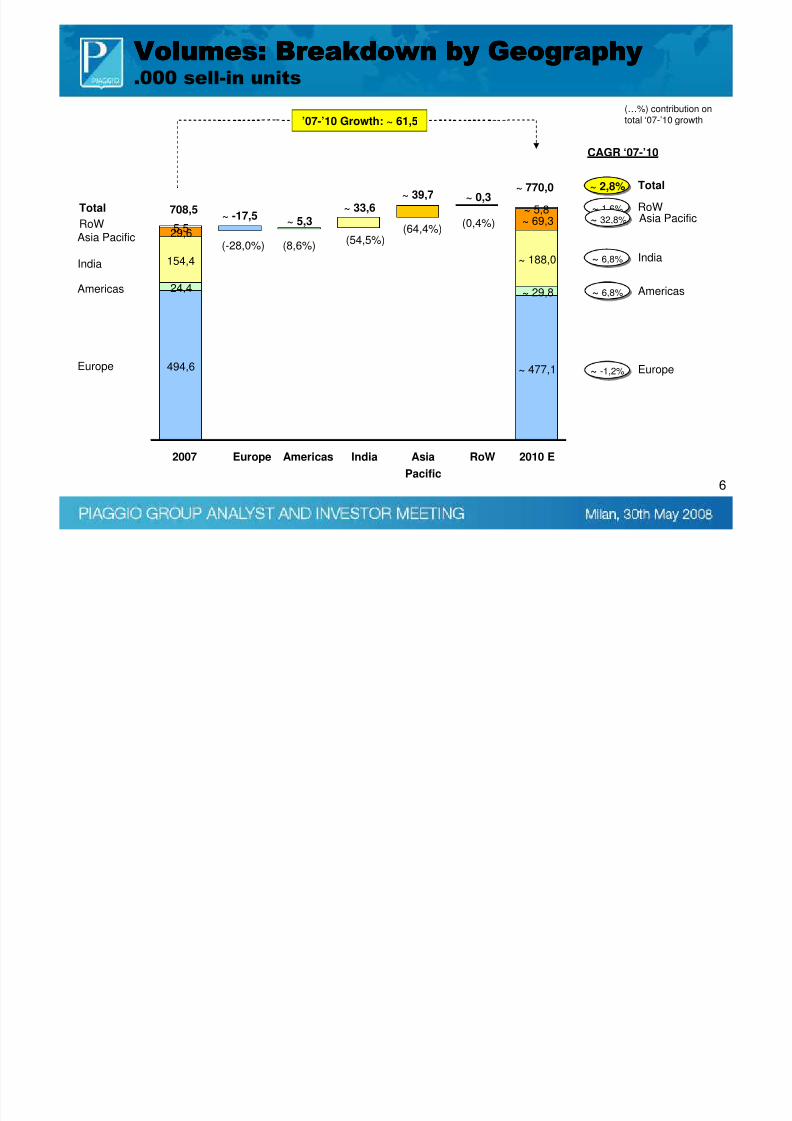
6
2007
Europe
India
~ 770,0
(-28,0%)
~ 2,8%~ 2,8%
~ -1,2%~ -1,2%
~ 6,8%~ 6,8%
~ 1,6%~ 1,6%
CAGR ‘07-’10
Total
(…%) contribution ontotal ‘07-’10 growth’07-’10 Growth: ~ 61,5
708,5Total
Americas ~ 6,8%~ 6,8%
(8,6%)(54,5%)
(64,4%)
Europe
Americas
India
RoW
Europe RoWIndiaAmericas 2010 E
Asia Pacific
~ 32,8%~ 32,8% Asia Pacific(0,4%)
Asia
Pacific
Volumes: Breakdown by GeographyVolumes: Breakdown by GeographyVolumes: Breakdown by GeographyVolumes: Breakdown by Geography.000 sell-in units
RoW
494,6
24,4
154,4 ~ 188,0
29,6~ 69,3
~ 477,1
~ 0,3~ 39,7~ 33,6
~ 5,3~ -17,5
~ 29,8
~ 5,8
5,5

8/6/2019 Investor Day 2008: 2008-2010 Strategic Plan Presentation
http://slidepdf.com/reader/full/investor-day-2008-2008-2010-strategic-plan-presentation 7/13
7
Scooter2007
Scooter
Others*
Moto
VCEurope
Moto
(24,6%)(20,4%)
(10,7%)
(…%) contribution ontotal ‘07-’10 growth
~ 4,9%~ 4,9%
~ 3,5%~ 3,5%
~ 6,1%~ 6,1%
~ 7,2%~ 7,2%
Total
CAGR ‘07-’10
Scooter
VC Europe
Moto
Total
1.692,1
~ 1.950,0
VC Europe
Other
(-1,6%) ~ -0,6%~ -0,6% Other
’07-’10 Growth: ~ 258,0
VC India
VC India
(34,2%)
~ 11,7%~ 11,7% VC India
2010 E
Revenues: Breakdown by BusinessRevenues: Breakdown by BusinessRevenues: Breakdown by BusinessRevenues: Breakdown by BusinessMln euro
854,1
~ 947,9
274,1
~ 326,3119,8
~ 147,3223,9
~ 312,3220,2
~ 216,2
~ 4,1~ 88,4
~ 27,5~ 52,5~ 93,8
* Spare Parts and Acessories, engines, etc.

8/6/2019 Investor Day 2008: 2008-2010 Strategic Plan Presentation
http://slidepdf.com/reader/full/investor-day-2008-2008-2010-strategic-plan-presentation 8/13
8
Europe2007 IndiaAmericas
(25,2%)(8,2%) (35,1%)
(…%) contribution ontotal ‘07-’10 growth
~ 4,9%~ 4,9%
~ 1,6%~ 1,6%
~ 8,4%~ 8,4%
~ 11,4%~ 11,4%
Total
CAGR ‘07-’10
Europe
India
Americas
Total
1.692,1
~ 1.950,0
RoW
(29,5%)
~ 10,1%~ 10,1% RoW
Europe
RoW
India
Americas
’07-’10 Growth: ~ 258,0
2010 E
~ 35,2%~ 35,2% Asia Pacific(1,9%)
Asia
Pacific
Revenues: Breakdown by GeographyMln euro
1.309,8
~ 4,9
77,5~ 98,8
238,0
~ 328,852,0
~ 1.374,3
~ 64,4~ 21,3 ~ 90,8
~ 76,5
~ 128,5~ 19,7
14,8
Asia Pacific
8/6/2019 Investor Day 2008: 2008-2010 Strategic Plan Presentation
http://slidepdf.com/reader/full/investor-day-2008-2008-2010-strategic-plan-presentation 9/13
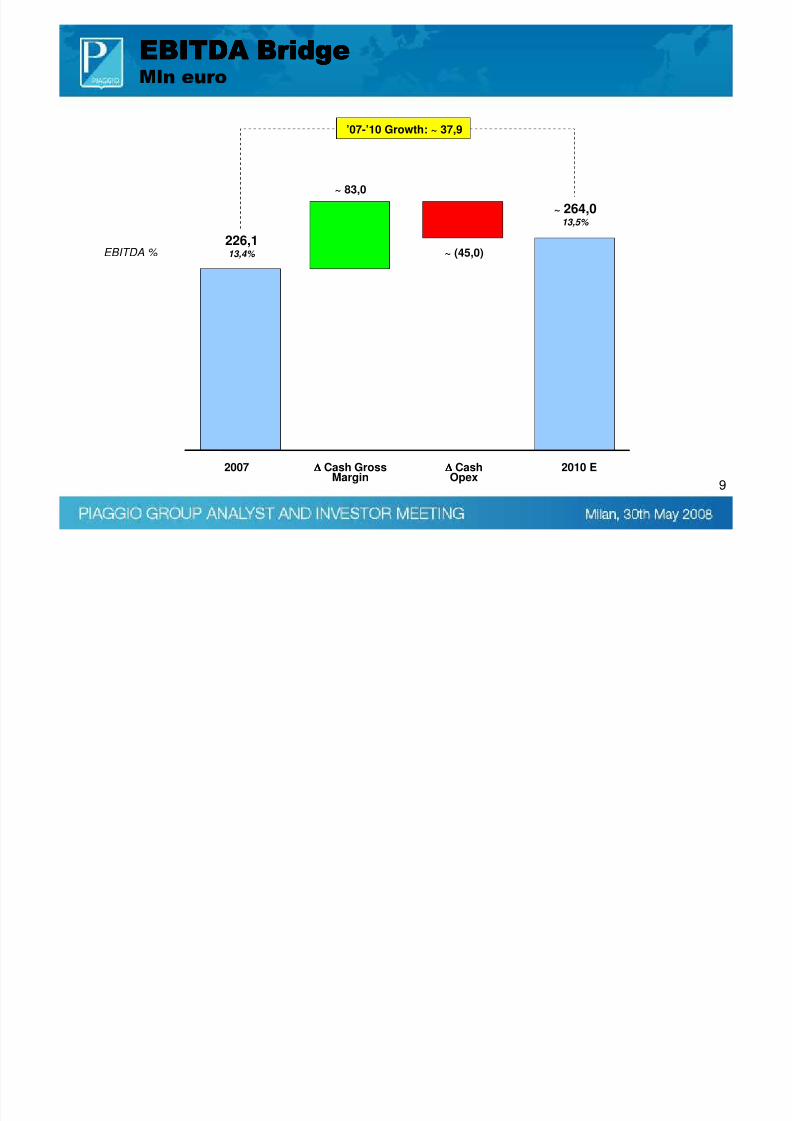
9
∆∆∆∆ Cash GrossMargin
2007 2010 E
226,113,4%
~ 264,013,5%
∆∆∆∆ CashOpex
’07-’10 Growth: ~ 37,9
EBITDA %
EBITDA BridgeEBITDA BridgeEBITDA BridgeEBITDA BridgeMln euro
~ 83,0
~ (45,0)

8/6/2019 Investor Day 2008: 2008-2010 Strategic Plan Presentation
http://slidepdf.com/reader/full/investor-day-2008-2008-2010-strategic-plan-presentation 10/13
10
∆∆∆∆ EBITDA2007 2010 E
136,68,1%
~ 146,07,5%
∆∆∆∆ D&A
’07-’10 Growth: ~ 9,4
EBIT %
EBIT BridgeEBIT BridgeEBIT BridgeEBIT BridgeMln euro
~ 37,9
~ (28,5)
8/6/2019 Investor Day 2008: 2008-2010 Strategic Plan Presentation
http://slidepdf.com/reader/full/investor-day-2008-2008-2010-strategic-plan-presentation 11/13
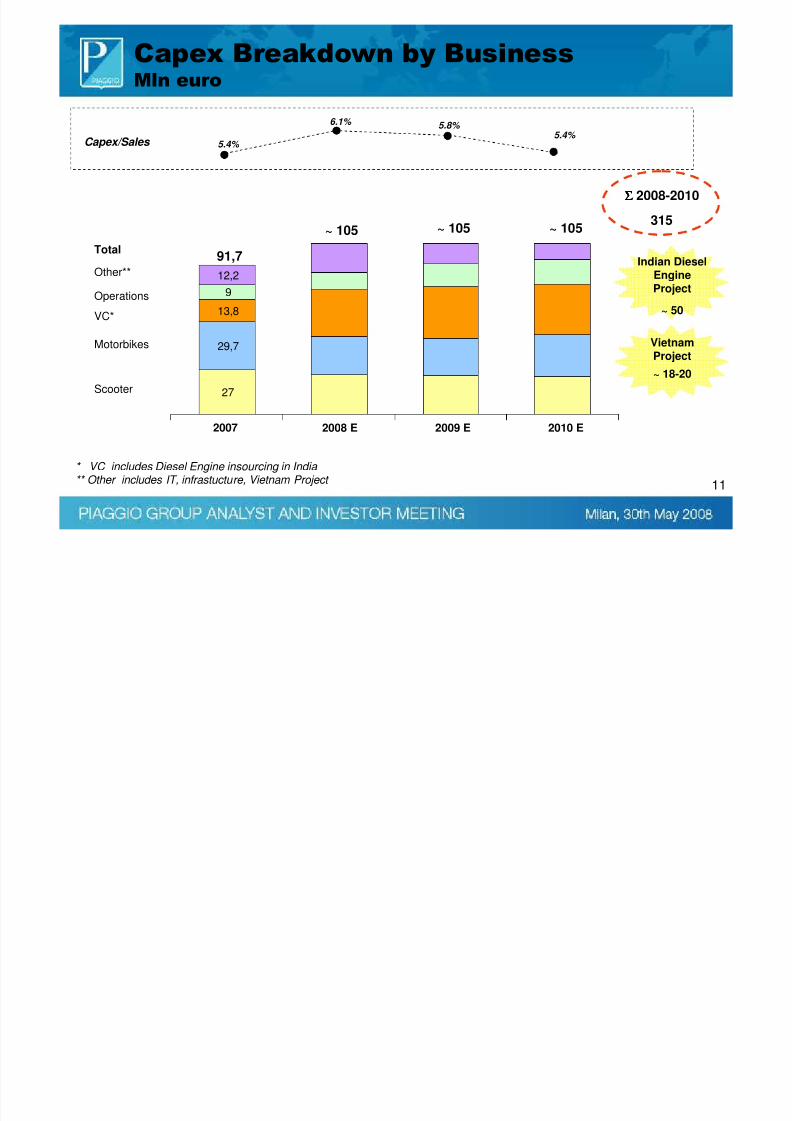
11
27
29,7
13,89
12,2
2007 2008 E 2010 E
Scooter
Operations
2009 E
5.4%
6.1%
5.4% Capex/Sales
5.8%
Other**
Total
Motorbikes
VC*
91,7
~ 105 ~ 105 ~ 105
ΣΣΣΣ 2008-2010
315
* VC includes Diesel Engine insourcing in India ** Other includes IT, infrastucture, Vietnam Project
Capex Breakdown by BusinessMln euro
Indian DieselEngineProject
~ 50
VietnamProject
~ 18-20

8/6/2019 Investor Day 2008: 2008-2010 Strategic Plan Presentation
http://slidepdf.com/reader/full/investor-day-2008-2008-2010-strategic-plan-presentation 12/13
12
2007 2008 E 2010 E2009 E
Working Capital evolutionMln euro
0.0%
1.0%
1.9% 1.3%
WC/Sales
~ 38,0
~ 24,0
~ 17,0
-0,4
8/6/2019 Investor Day 2008: 2008-2010 Strategic Plan Presentation
http://slidepdf.com/reader/full/investor-day-2008-2008-2010-strategic-plan-presentation 13/13
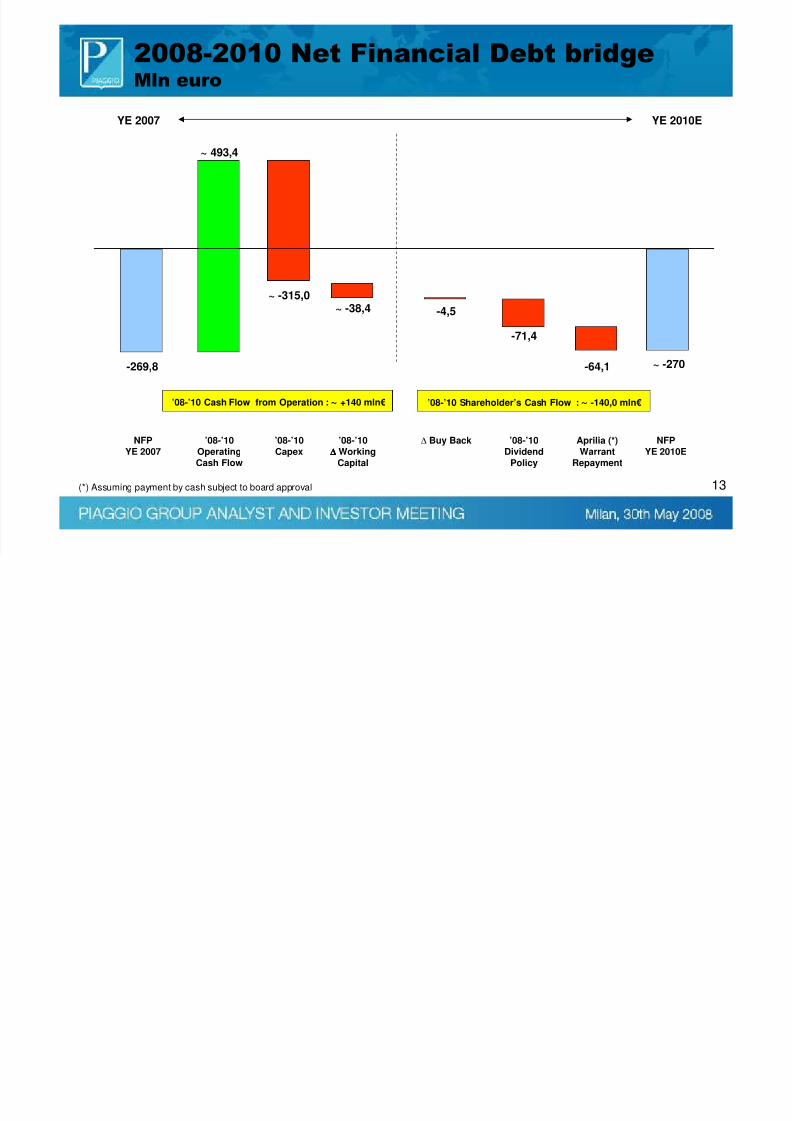
13
NFPYE 2007
’08-’10OperatingCash Flow
’08-’10Capex
’08-’10∆∆∆∆ Working
Capital
∆ Buy Back ’08-’10Dividend
Policy
Aprilia (*)Warrant
Repayment
NFPYE 2010E
’08-’10 Cash Flow from Operation : ~ +140 mln€
YE 2007 YE 2010E
’08-’10 Shareholder’s Cash Flow : ~ -140,0 mln€
2008-2010 Net Financial Debt bridgeMln euro
(*) Assuming payment by cash subject to board approval
~ -270
-4,5
-269,8 -64,1
~ 493,4
~ -315,0~ -38,4
-71,4