investor day 2014: strategic progress - home –...
TRANSCRIPT
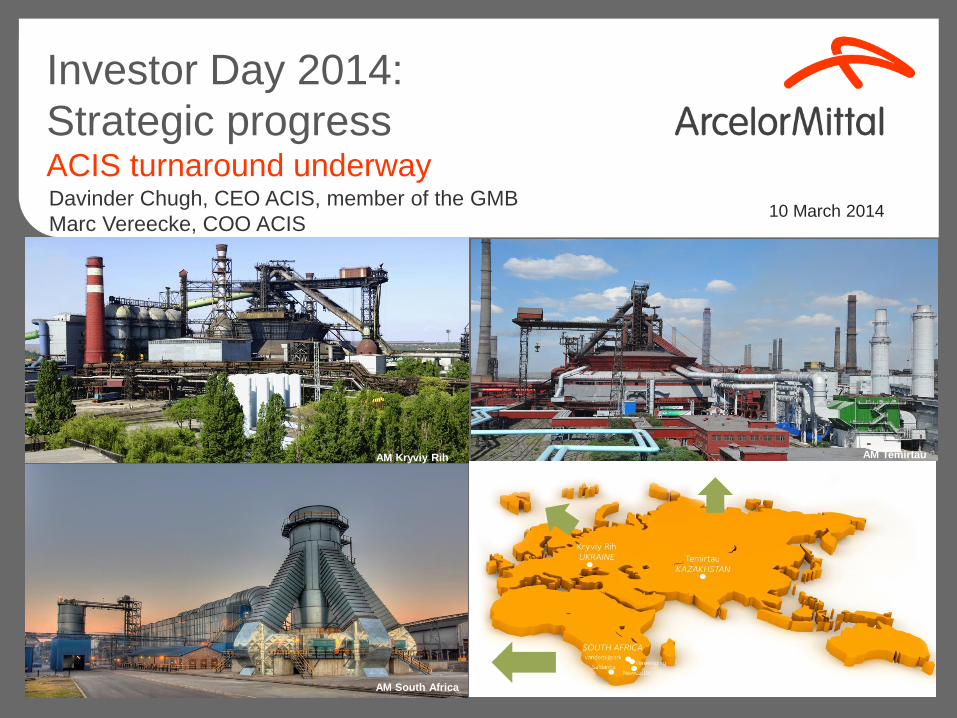
Investor Day 2014:
Strategic progressACIS turnaround underway
10 March 2014 Davinder Chugh, CEO ACIS, member of the GMB
Marc Vereecke, COO ACIS
AM Temirtau
AM South Africa
AM Kryviy Rih
DisclaimerForward-Looking Statements
This document may contain forward-looking information and statements about
ArcelorMittal and its subsidiaries. These statements include financial projections and estimates
and their underlying assumptions, statements regarding plans, objectives and expectations with
respect to future operations, products and services, and statements regarding future performance.
Forward-looking statements may be identified by the words “believe,” “expect,” “anticipate,”
“target” or similar expressions. Although ArcelorMittal’s management believes that the
expectations reflected in such forward-looking statements are reasonable, investors and holders
of ArcelorMittal’s securities are cautioned that forward-looking information and statements are
subject to numerous risks and uncertainties, many of which are difficult to predict and generally
beyond the control of ArcelorMittal, that could cause actual results and developments to differ
materially and adversely from those expressed in, or implied or projected by, the forward-looking
information and statements. These risks and uncertainties include those discussed or identified in
the filings with the Luxembourg Stock Market Authority for the Financial Markets (Commission de
Surveillance du Secteur Financier) and the United States Securities and Exchange Commission
(the “SEC”) made or to be made by ArcelorMittal, including ArcelorMittal’s Annual Report on Form
20-F for the year ended December 31, 2013 filed with the SEC. ArcelorMittal undertakes no
obligation to publicly update its forward-looking statements, whether as a result of new
information, future events, or otherwise.
Non-GAAP Financial Measures
This presentation may contain supplemental financial measures that are or may be non-
GAAP financial measures. Definitions of such supplemental financial measures and a discussion
of the most directly comparable IFRS financial measures can be found on ArcelorMittal's
website at http://www.arcelormittal.com/corp/investors/presentations/
1
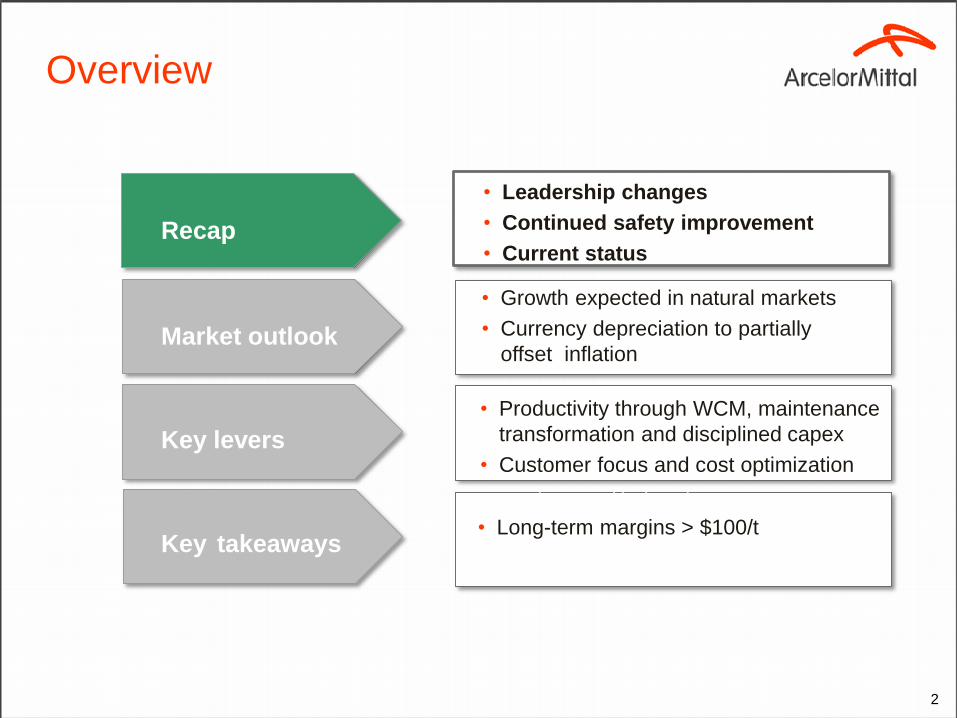
Overview
2
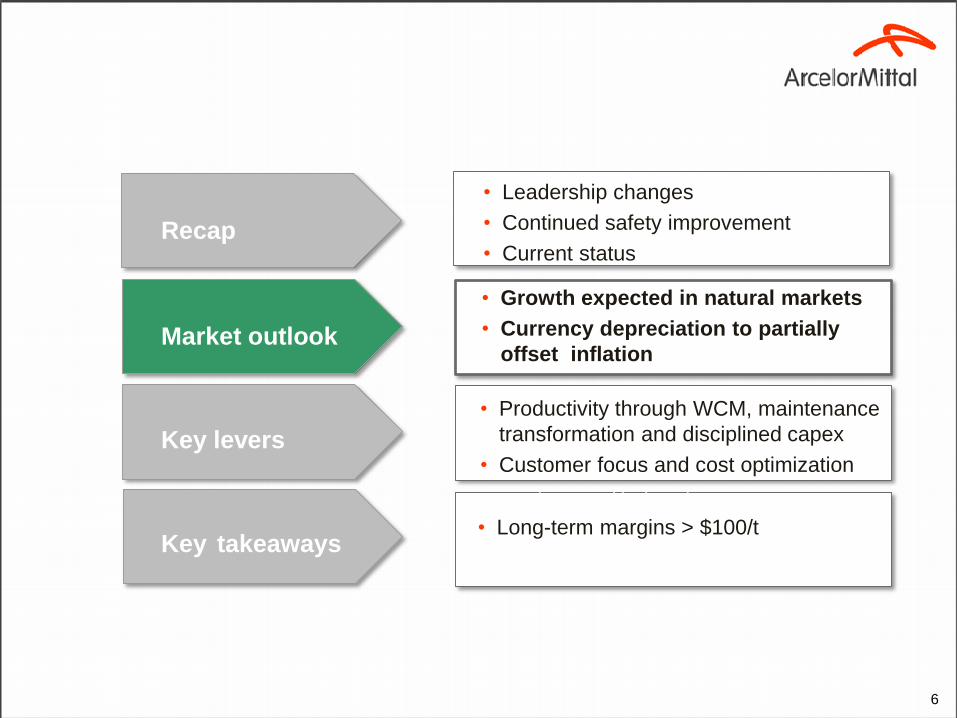
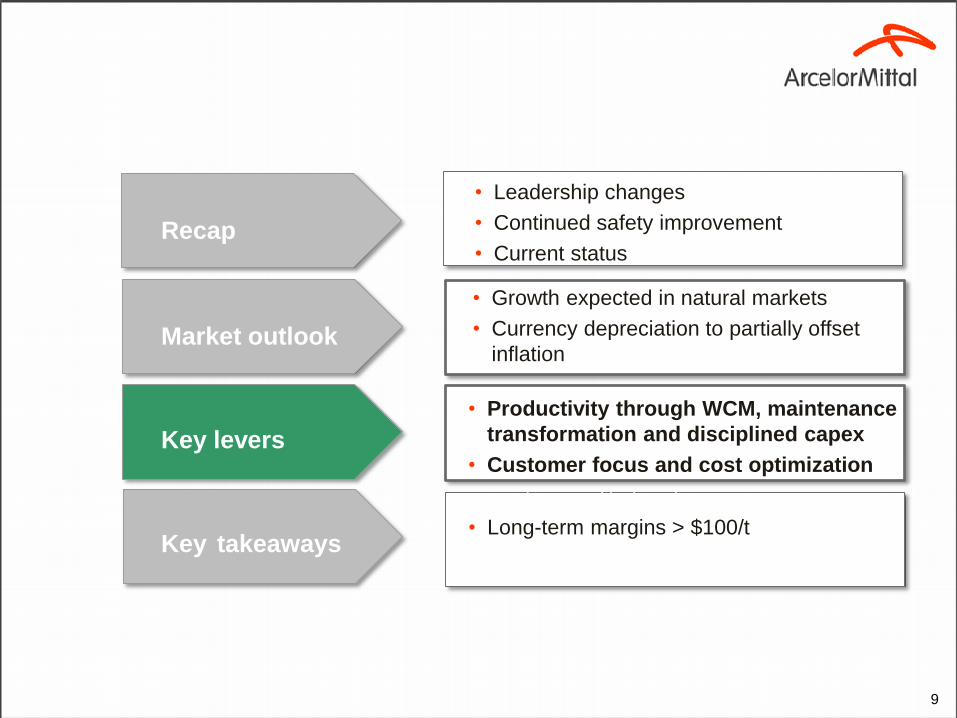
Recap
Market outlook
Key takeaways
• Leadership changes
• Continued safety improvement
• Current status
• Growth expected in natural markets
• Currency depreciation to partially
offset inflations
Key levers
• Productivity through WCM, maintenance
transformation and disciplined capex
• Customer focus and cost optimization
growth opportunities intensity
• Long-term margins > $100/t
opportunities intensity0
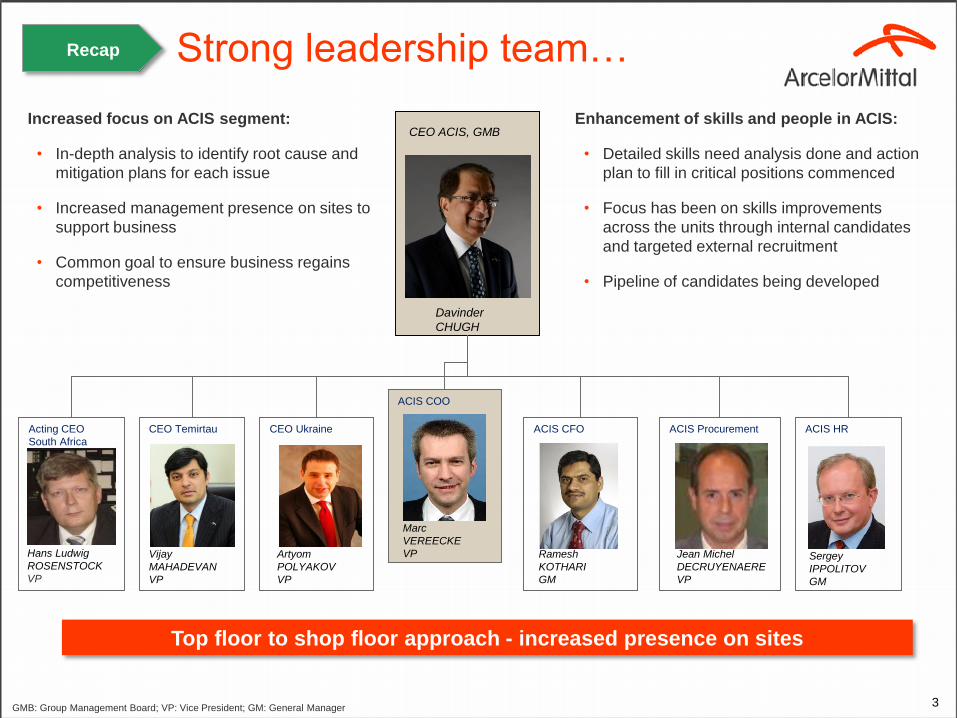
3GMB: Group Management Board; VP: Vice President; GM: General Manager
Strong leadership team…
Top floor to shop floor approach - increased presence on sites
CEO Temirtau ACIS HRACIS CFOActing CEO
South Africa
CEO ACIS, GMB
Davinder
CHUGH
ACIS ProcurementCEO Ukraine
Hans Ludwig
ROSENSTOCK
VP
Vijay
MAHADEVAN
VP
Artyom
POLYAKOV
VP
Ramesh
KOTHARI
GM
Jean Michel
DECRUYENAERE
VP
ACIS COO
Marc
VEREECKE
VP
Enhancement of skills and people in ACIS:
• Detailed skills need analysis done and action
plan to fill in critical positions commenced
• Focus has been on skills improvements
across the units through internal candidates
and targeted external recruitment
• Pipeline of candidates being developed
Increased focus on ACIS segment:
• In-depth analysis to identify root cause and
mitigation plans for each issue
• Increased management presence on sites to
support business
• Common goal to ensure business regains
competitiveness
Sergey
IPPOLITOV
GM
Recap
4
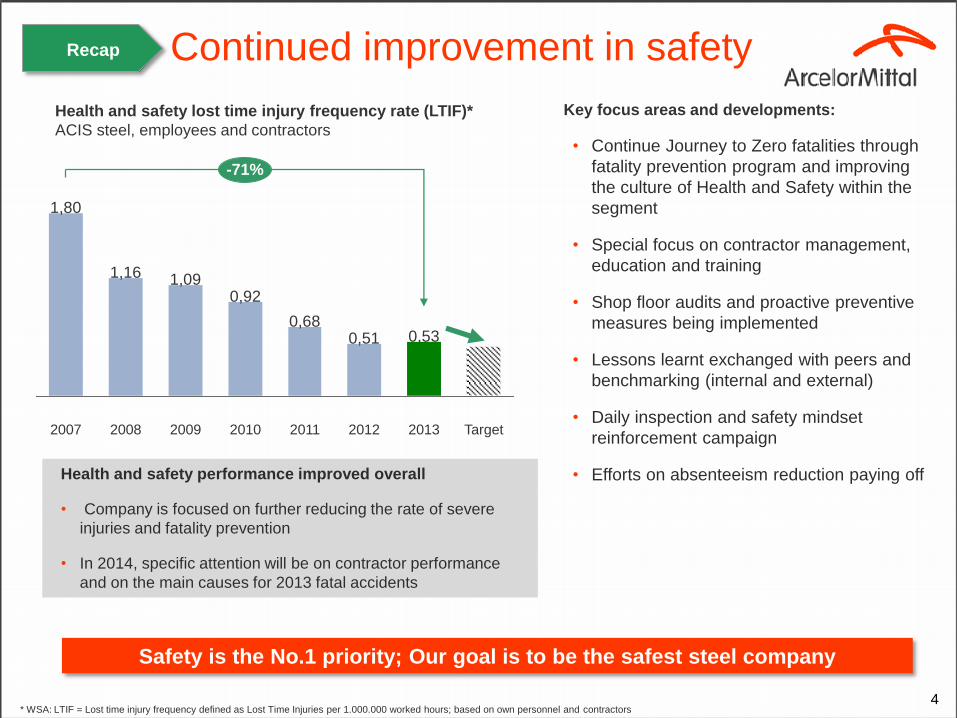
Health and safety performance improved overall
• Company is focused on further reducing the rate of severe
injuries and fatality prevention
• In 2014, specific attention will be on contractor performance
and on the main causes for 2013 fatal accidents
Health and safety lost time injury frequency rate (LTIF)*
ACIS steel, employees and contractors
Key focus areas and developments:
• Continue Journey to Zero fatalities through
fatality prevention program and improving
the culture of Health and Safety within the
segment
• Special focus on contractor management,
education and training
• Shop floor audits and proactive preventive
measures being implemented
• Lessons learnt exchanged with peers and
benchmarking (internal and external)
• Daily inspection and safety mindset
reinforcement campaign
• Efforts on absenteeism reduction paying off
Safety is the No.1 priority; Our goal is to be the safest steel company
* WSA: LTIF = Lost time injury frequency defined as Lost Time Injuries per 1.000.000 worked hours; based on own personnel and contractors
Continued improvement in safety
0,51
2011
0,68
2010
0,92
2009
1,09
2008
1,16
2007
1,80
2013 Target
-71%
2012
0,53
Recap
5
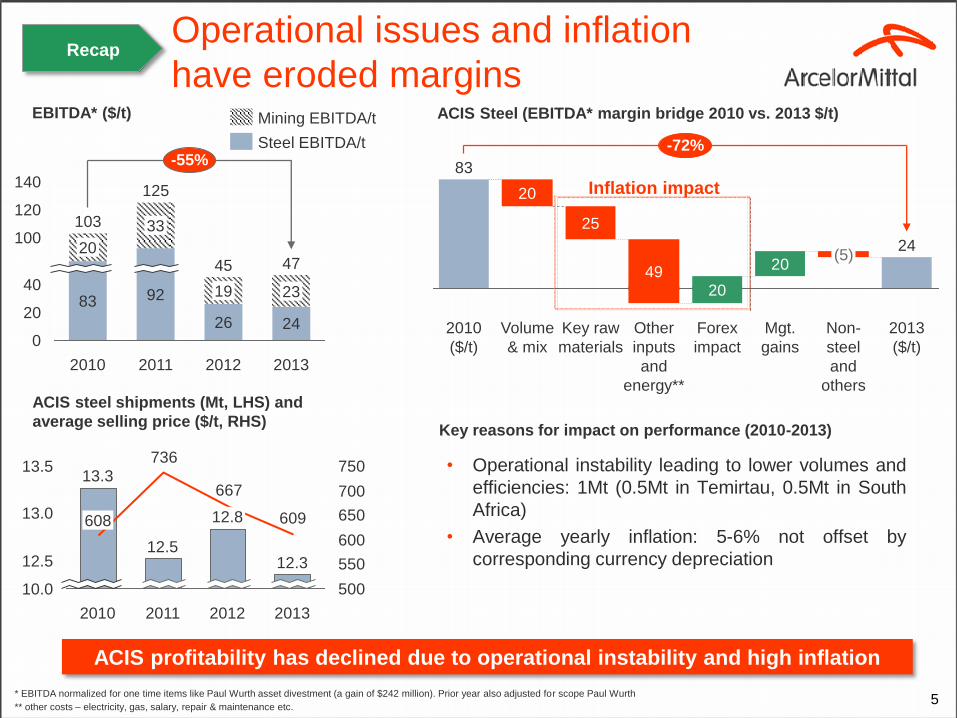
EBITDA* ($/t)
* EBITDA normalized for one time items like Paul Wurth asset divestment (a gain of $242 million). Prior year also adjusted for scope Paul Wurth
** other costs – electricity, gas, salary, repair & maintenance etc.
ACIS profitability has declined due to operational instability and high inflation
Operational issues and inflation
have eroded marginsACIS Steel (EBITDA* margin bridge 2010 vs. 2013 $/t)
25
Volume
& mix
20
2010
($/t)
83
-72%
2013
($/t)
24
Non-
steel
and
others
(5)
Mgt.
gains
20
Forex
impact
20
Other
inputs
and
energy**
49
Key raw
materials
Inflation impact
• Operational instability leading to lower volumes and
efficiencies: 1Mt (0.5Mt in Temirtau, 0.5Mt in South
Africa)
• Average yearly inflation: 5-6% not offset by
corresponding currency depreciation
26 24
140
120
100
40
20
0
-55%
2013
47
23
2012
45
19
2011
125
92
33
2010
103
83
20
Key reasons for impact on performance (2010-2013)
Steel EBITDA/t
Mining EBITDA/t
609
667
736
500
550
600
650
700
75013.5
13.0
12.5
10.0
2013
12.3
2012
12.8
2011
12.5
2010
13.3
608
ACIS steel shipments (Mt, LHS) and
average selling price ($/t, RHS)
Recap
6
Recap
Market outlook
Key takeaways
• Leadership changes
• Continued safety improvement
• Current status
• Growth expected in natural markets
• Currency depreciation to partially
offset inflations
Key levers
• Productivity through WCM, maintenance
transformation and disciplined capex
• Customer focus and cost optimization
growth opportunities intensity
• Long-term margins > $100/t
opportunities intensity0
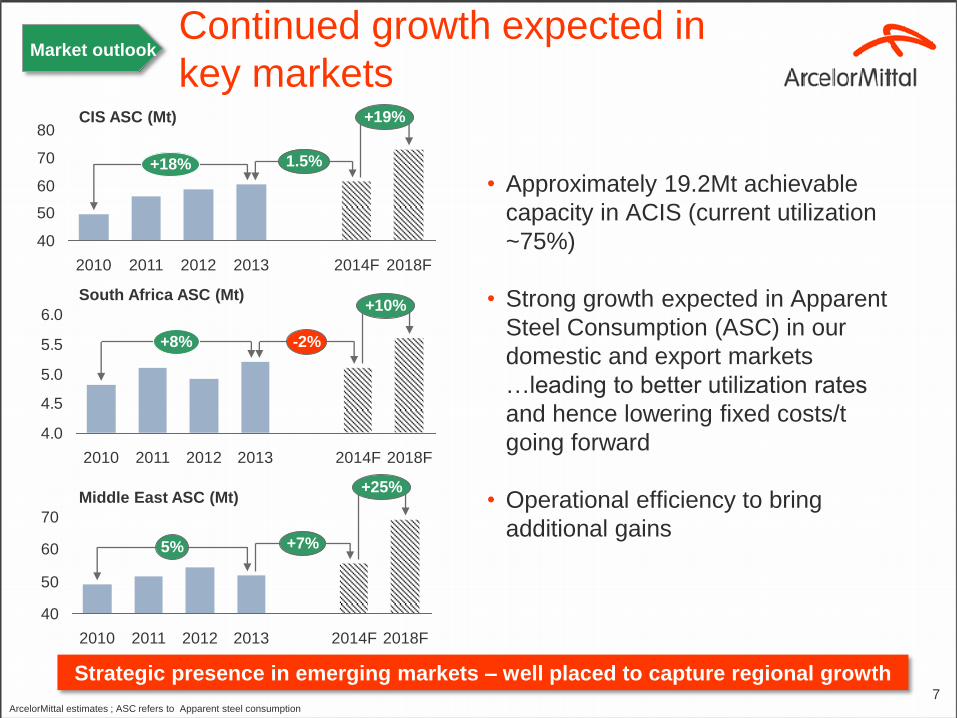
7
Continued growth expected in
key markets
Strategic presence in emerging markets – well placed to capture regional growth
CIS ASC (Mt)
40
50
60
70
80
20112010
+19%
+18% 1.5%
2018F2014F20132012
Middle East ASC (Mt)
40
50
60
70
2010
+25%
+7%5%
2018F2014F201320122011
South Africa ASC (Mt)
4.0
4.5
5.0
5.5
6.0+10%
+8%
2010
-2%
2018F2014F201320122011
• Approximately 19.2Mt achievable
capacity in ACIS (current utilization
~75%)
• Strong growth expected in Apparent
Steel Consumption (ASC) in our
domestic and export markets
…leading to better utilization rates
and hence lowering fixed costs/t
going forward
• Operational efficiency to bring
additional gains
ArcelorMittal estimates ; ASC refers to Apparent steel consumption
Market outlook
8
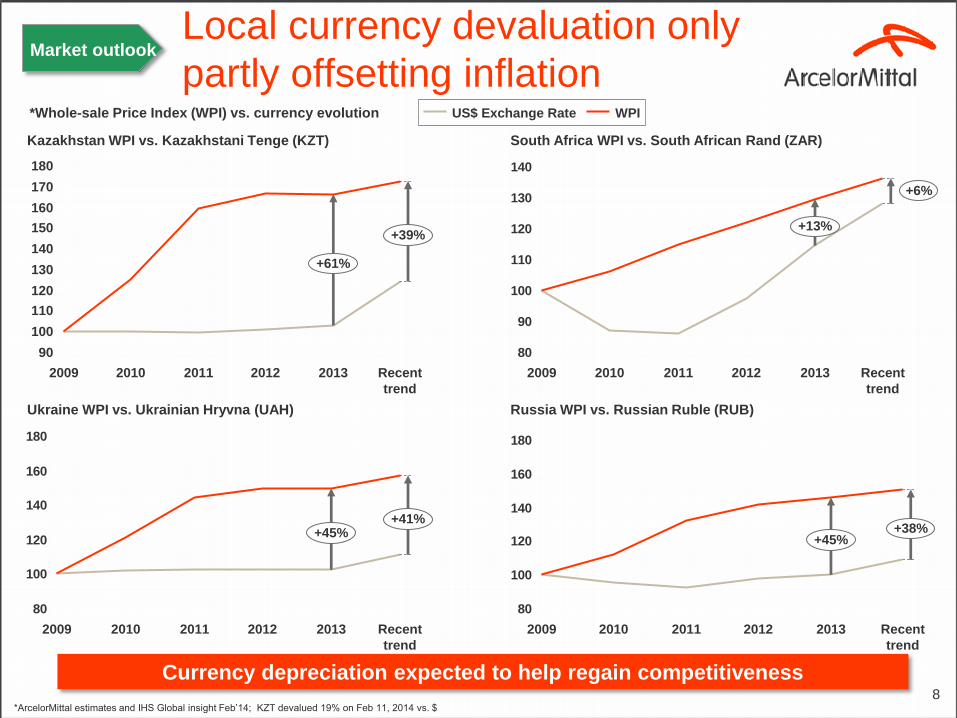
Local currency devaluation only
partly offsetting inflation
Currency depreciation expected to help regain competitiveness
Kazakhstan WPI vs. Kazakhstani Tenge (KZT)
Ukraine WPI vs. Ukrainian Hryvna (UAH)
South Africa WPI vs. South African Rand (ZAR)
*Whole-sale Price Index (WPI) vs. currency evolution
*ArcelorMittal estimates and IHS Global insight Feb’14; KZT devalued 19% on Feb 11, 2014 vs. $
80
100
120
140
160
180
+41%+45%
Recent
trend
20132012201120102009
110
100
90
180
170
160
150
140
130
120
+39%
+61%
Recent
trend
20132012201120102009
80
90
100
110
120
130
140
+6%
+13%
Recent
trend
20132012201120102009
WPIUS$ Exchange Rate
80
100
120
140
160
180
20102009
+38%+45%
Recent
trend
201320122011
Russia WPI vs. Russian Ruble (RUB)
Market outlook
9
Recap
Market outlook
Key takeaways
• Leadership changes
• Continued safety improvement
• Current status
• Growth expected in natural markets
• Currency depreciation to partially offset
inflations
Key levers
• Productivity through WCM, maintenance
transformation and disciplined capex
• Customer focus and cost optimization
growth opportunities intensity
• Long-term margins > $100/t
opportunities intensity0
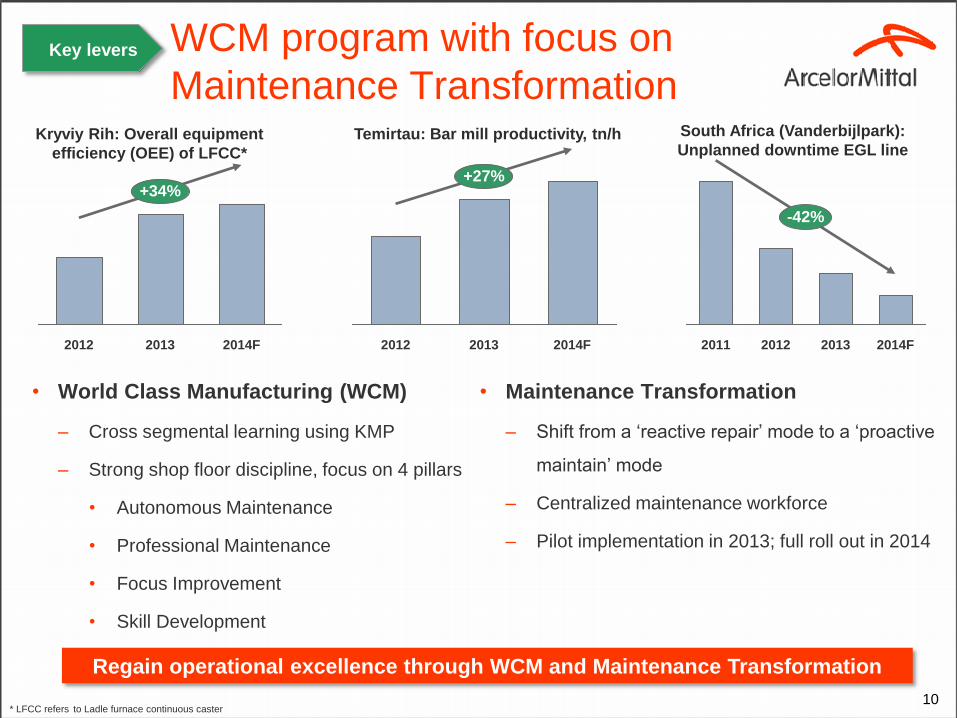
• World Class Manufacturing (WCM)
– Cross segmental learning using KMP
– Strong shop floor discipline, focus on 4 pillars
• Autonomous Maintenance
• Professional Maintenance
• Focus Improvement
• Skill Development
WCM program with focus on
Maintenance TransformationTemirtau: Bar mill productivity, tn/h
Regain operational excellence through WCM and Maintenance Transformation
10
+27%
2014F20132012
South Africa (Vanderbijlpark):
Unplanned downtime EGL line
2012
-42%
20132011 2014F
Kryviy Rih: Overall equipment
efficiency (OEE) of LFCC*
• Maintenance Transformation
– Shift from a ‘reactive repair’ mode to a ‘proactive
maintain’ mode
– Centralized maintenance workforce
– Pilot implementation in 2013; full roll out in 2014
+34%
2014F20132012
* LFCC refers to Ladle furnace continuous caster
Key levers

Higher investment to ensure assets run full, stable and improve reliability
395433
613
515
2010 2011
489
Long
term*
> 550
>39%-120
2012 2013
Capex ($million)Major projects ongoing and planned
• Learning from fire incident in Vanderbijlpark
(“Vdp”): Risk identification mapping and mitigation
plans ongoing
• 3 major blast furnace relines in 2014/15
– Temirtau, Kryviy Rih and Newcastle
• Higher self sufficiency in energy supply
– PCI unit in Ukraine
– Power plant revamping in Temirtau
• Upgrade coke oven battery in Ukraine
• 2013 Capex $395m, average 2010–
2013 at ~$489m
• 2014 Capex > $550m; includes major
reline projects
Capex allocated to improve asset
availability and reliability
11
• Fewer breakdowns and unplanned downtime will
result in improvement in stability
• Modernization of our plants improving productivity
• Readiness to ramp up production to capture
growth
*Long term: 3-5 years
Key levers
12
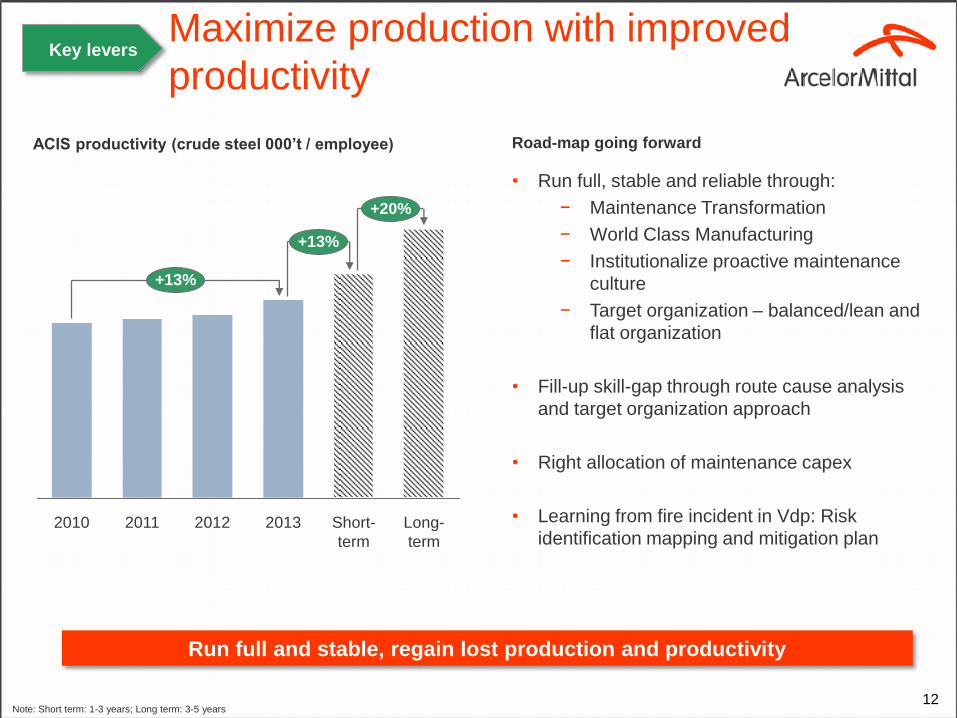
Maximize production with improved
productivity
ACIS productivity (crude steel 000’t / employee)
Note: Short term: 1-3 years; Long term: 3-5 years
Run full and stable, regain lost production and productivity
• Run full, stable and reliable through:
− Maintenance Transformation
− World Class Manufacturing
− Institutionalize proactive maintenance
culture
− Target organization – balanced/lean and
flat organization
• Fill-up skill-gap through route cause analysis
and target organization approach
• Right allocation of maintenance capex
• Learning from fire incident in Vdp: Risk
identification mapping and mitigation plan
Road-map going forward
+20%
2011 2012
+13%
Long-
term
+13%
Short-
term
20132010
Key levers
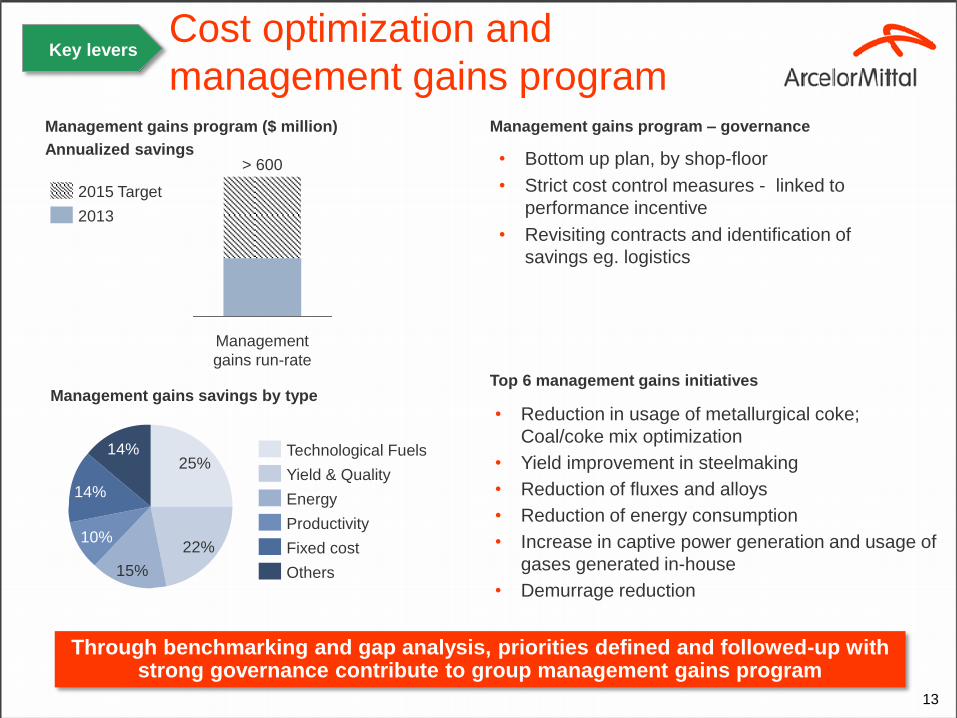
Through benchmarking and gap analysis, priorities defined and followed-up with strong governance contribute to group management gains program
13
Management gains program ($ million)
Annualized savings• Bottom up plan, by shop-floor
• Strict cost control measures - linked to
performance incentive
• Revisiting contracts and identification of
savings eg. logistics
Cost optimization and
management gains programManagement gains program – governance
• Reduction in usage of metallurgical coke;
Coal/coke mix optimization
• Yield improvement in steelmaking
• Reduction of fluxes and alloys
• Reduction of energy consumption
• Increase in captive power generation and usage of
gases generated in-house
• Demurrage reduction
Top 6 management gains initiatives
Management
gains run-rate
> 600
2013
2015 Target
15%
22%
25%14%
14%
10%Productivity
Energy
Yield & Quality
Technological Fuels
Fixed cost
Others
Management gains savings by type
Key levers
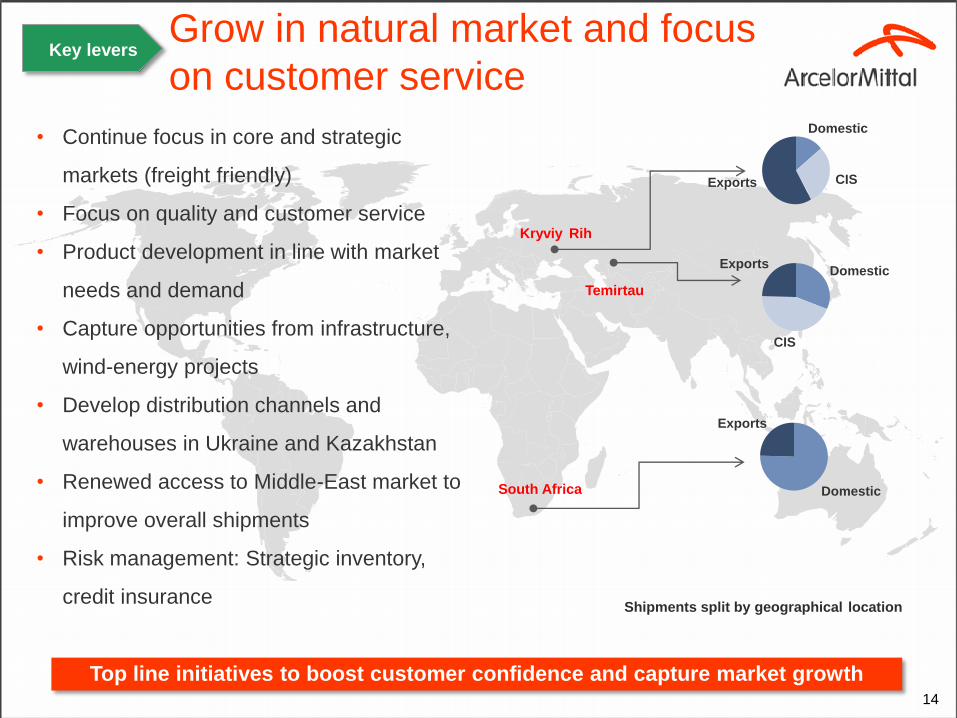
Top line initiatives to boost customer confidence and capture market growth 14
• Continue focus in core and strategic
markets (freight friendly)
• Focus on quality and customer service
• Product development in line with market
needs and demand
• Capture opportunities from infrastructure,
wind-energy projects
• Develop distribution channels and
warehouses in Ukraine and Kazakhstan
• Renewed access to Middle-East market to
improve overall shipments
• Risk management: Strategic inventory,
credit insurance
Grow in natural market and focus
on customer service
Exports CIS
Domestic
Shipments split by geographical location
Exports
CIS
Domestic
Exports
DomesticSouth Africa
Key levers
Temirtau
Kryviy Rih
Better spend management to contribute to bottom line15
Focus on spend management
• Robust vendor selection procedures and better spend management and accountability
• Electronic tendering
• Increase local content to benefit from currency devaluation
• Maximize use of global contracts
• Mid to long term planning of needs
• Strengthen contract management and Maintenance Repair & Operational items
procurement
• Enhanced TCO approach
• Deploy IT tools to expedite processes
Key levers
16
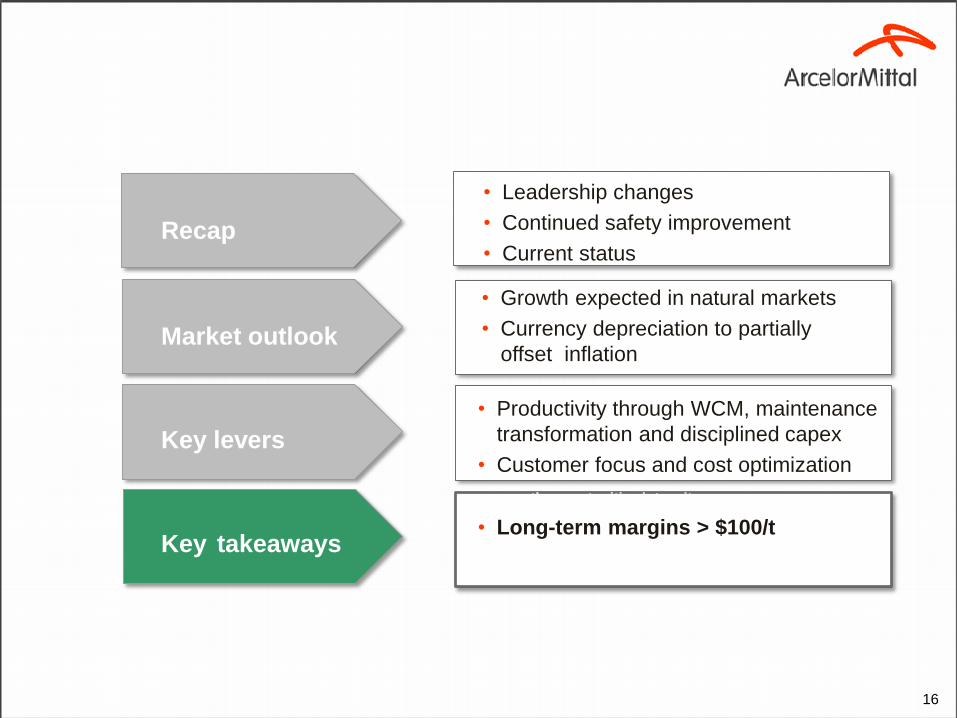
Recap
Market outlook
Key takeaways
• Leadership changes
• Continued safety improvement
• Current status
• Growth expected in natural markets
• Currency depreciation to partially
offset inflations
Key levers
• Productivity through WCM, maintenance
transformation and disciplined capex
• Customer focus and cost optimization
growth opportunities intensity
• Long-term margins > $100/t
opportunities intensity0
17
248
753
241
3,413
2,582
61
Q1'11 EBITDA Volume & Mix Selling Price / Cost Non Steel EBITDA* Others** Q2'11 EBITDA
Operational stability supported by currency devaluation and management actions
to bring back profitability to > $100/t
• Skills and resources augmentation: Promote action on identified skill deficit and
roadmap to fill the gap; strong and experienced management team being placed in
units and segment
• Volume improvement: 2mt through operational reliability (investing in our assets,
Maintenance Transformation program and WCM) and regaining customer confidence
in domestic and core markets
• Currency devaluation improves competitiveness: long due currency adjustment to
offset the last couple of years inflation, ca. 10% (net of inflation). Each 1% could give
us ca. $15m annual impact (net of inflation)
• Management gains: Initiatives on energy savings, PCI, operational stability, better
efficiency to deliver ca. $350m annualized incremental EBITDA
• Long term agreements: Our long term supply agreement with Kumba expected to
improve profitability
• Renewed access to Middle-East market to improve overall shipments
ConclusionKey takeaways

Q&A

Contacts
Daniel Fairclough – Global Head Investor Relations
+44 207 543 1105
Hetal Patel – UK/European Investor Relations
+44 207 543 1128
Valérie Mella – European and Retail Investor Relations
+44 207 543 1156
Maureen Baker – Fixed Income/Debt Investor Relations
+33 1 71 92 10 26
Thomas A McCue – US Investor Relations
+312-899-3927
Lisa Fortuna – US Investor Relations
+312-899-3985