investment simulation this outline is a guideline and/or suggestion. please don’t limit yourself...
TRANSCRIPT
Investment Simulation
This outline is a guideline and/or suggestion. Please don’t limit yourself to working inside the box!
Reference the appropriate information/support in the appendix and provide notes on the slides so it is easy for me to understand the point of each slide and the location of any supporting detail.
Make sure to provide appropriate references (footnotes) for any material and analysis you used in the process of preparing your strategy.
The goal is to demonstrate expertise and skill in designing , implementing, and executing your strategy.
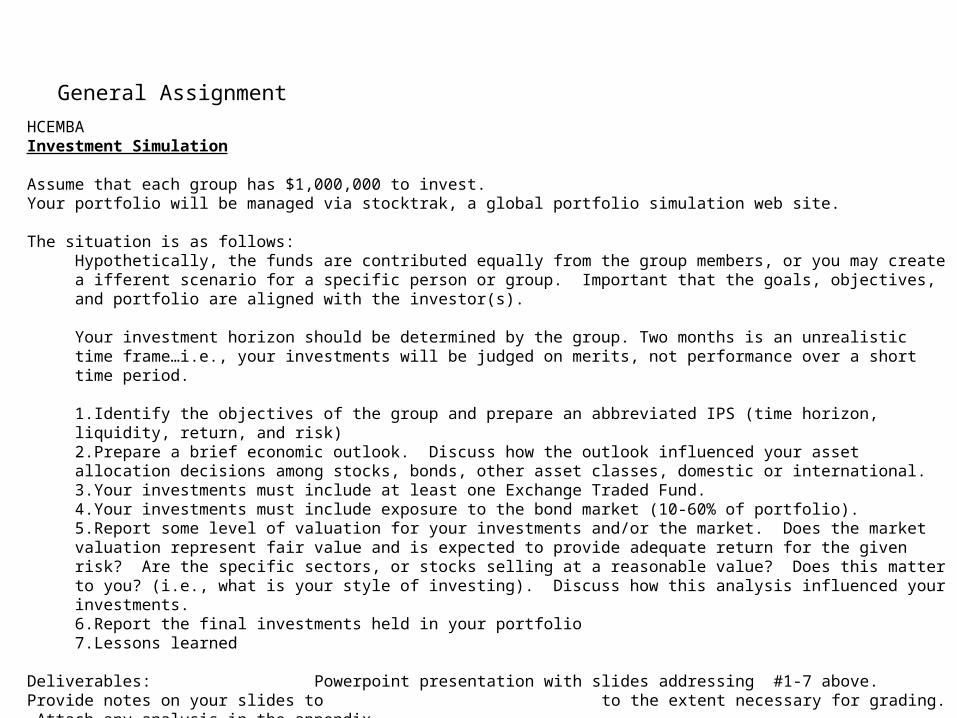
General Assignment
HCEMBAInvestment Simulation Assume that each group has $1,000,000 to invest.Your portfolio will be managed via stocktrak, a global portfolio simulation web site. The situation is as follows:
Hypothetically, the funds are contributed equally from the group members, or you may create a ifferent scenario for a specific person or group. Important that the goals, objectives, and portfolio are aligned with the investor(s).
Your investment horizon should be determined by the group. Two months is an unrealistic time frame…i.e., your investments will be judged on merits, not performance over a short time period.
1.Identify the objectives of the group and prepare an abbreviated IPS (time horizon, liquidity, return, and risk)2.Prepare a brief economic outlook. Discuss how the outlook influenced your asset allocation decisions among stocks, bonds, other asset classes, domestic or international.3.Your investments must include at least one Exchange Traded Fund.4.Your investments must include exposure to the bond market (10-60% of portfolio).5.Report some level of valuation for your investments and/or the market. Does the market valuation represent fair value and is expected to provide adequate return for the given risk? Are the specific sectors, or stocks selling at a reasonable value? Does this matter to you? (i.e., what is your style of investing). Discuss how this analysis influenced your investments.6.Report the final investments held in your portfolio7.Lessons learned
Deliverables: Powerpoint presentation with slides addressing #1-7 above. Provide notes on your slides to
to the extent necessary for grading. Attach any analysis in the appendix.Check the class website for the due date.
You may decide to trade in the account and this is fine. And we may look at the accounts to see how the groups are progressing.
However, the project is graded on your approach and final composition of the portfolio, and addressing 1-7 above.
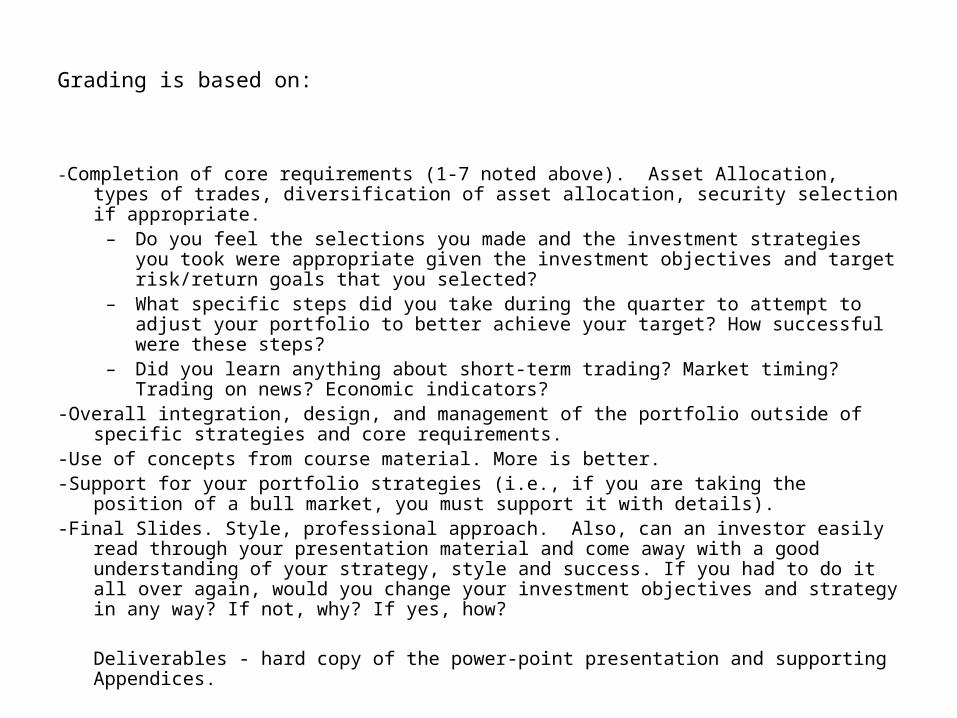
Grading is based on:
-Completion of core requirements (1-7 noted above). Asset Allocation, types of trades, diversification of asset allocation, security selection if appropriate.
– Do you feel the selections you made and the investment strategies you took were appropriate given the investment objectives and target risk/return goals that you selected?
– What specific steps did you take during the quarter to attempt to adjust your portfolio to better achieve your target? How successful were these steps?
– Did you learn anything about short-term trading? Market timing? Trading on news? Economic indicators?
-Overall integration, design, and management of the portfolio outside of specific strategies and core requirements.
-Use of concepts from course material. More is better.-Support for your portfolio strategies (i.e., if you are taking the position of a bull market,
you must support it with details).-Final Slides. Style, professional approach. Also, can an investor easily read through your
presentation material and come away with a good understanding of your strategy, style and success. If you had to do it all over again, would you change your investment objectives and strategy in any way? If not, why? If yes, how?
Deliverables - hard copy of the power-point presentation and supporting Appendices.
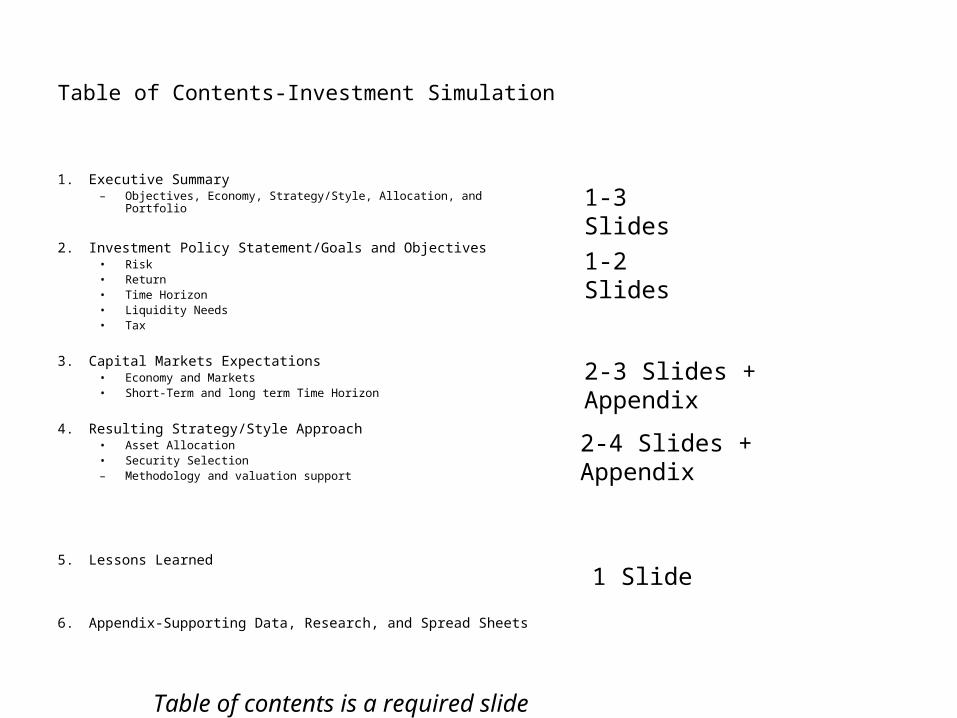
Table of Contents-Investment Simulation
1. Executive Summary– Objectives, Economy, Strategy/Style, Allocation, and Portfolio
2. Investment Policy Statement/Goals and Objectives• Risk• Return• Time Horizon• Liquidity Needs• Tax
3. Capital Markets Expectations• Economy and Markets• Short-Term and long term Time Horizon
4. Resulting Strategy/Style Approach• Asset Allocation• Security Selection– Methodology and valuation support
5. Lessons Learned
6. Appendix-Supporting Data, Research, and Spread Sheets
1-3 Slides
2-3 Slides + Appendix
1 Slide
1-2 Slides
Table of contents is a required slide
2-4 Slides + Appendix
Appendix
Note that there are only two required slides in the appendix. The rest of the slides include models that may be useful to you.
6
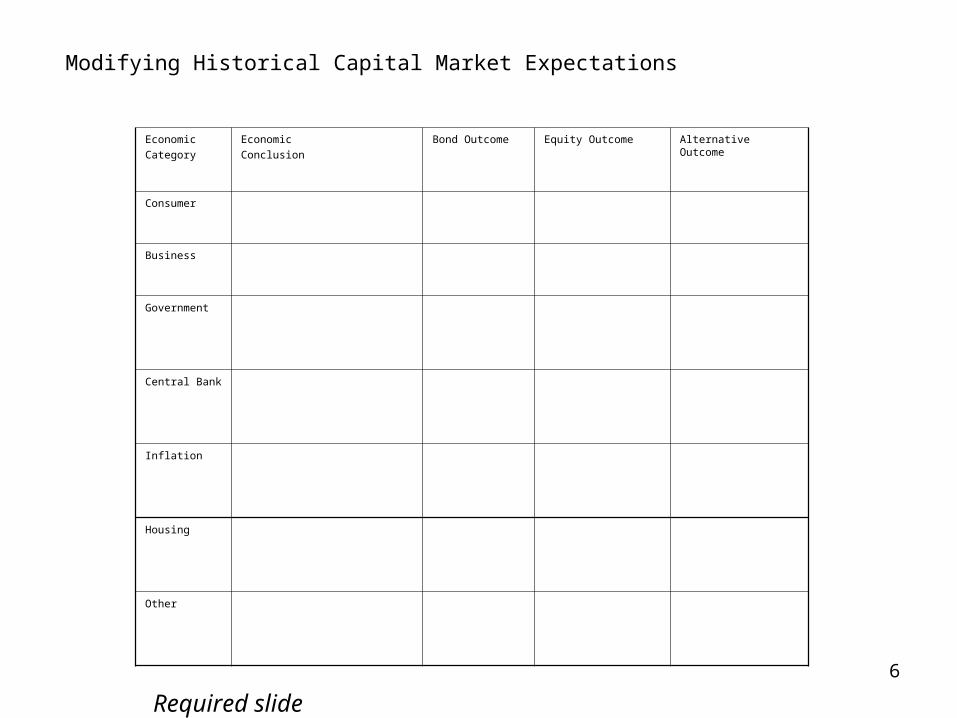
Modifying Historical Capital Market Expectations
Economic
Category
Economic
Conclusion
Bond Outcome Equity Outcome Alternative Outcome
Consumer
Business
Government
Central Bank
Inflation
Housing
Other
Required slide
7
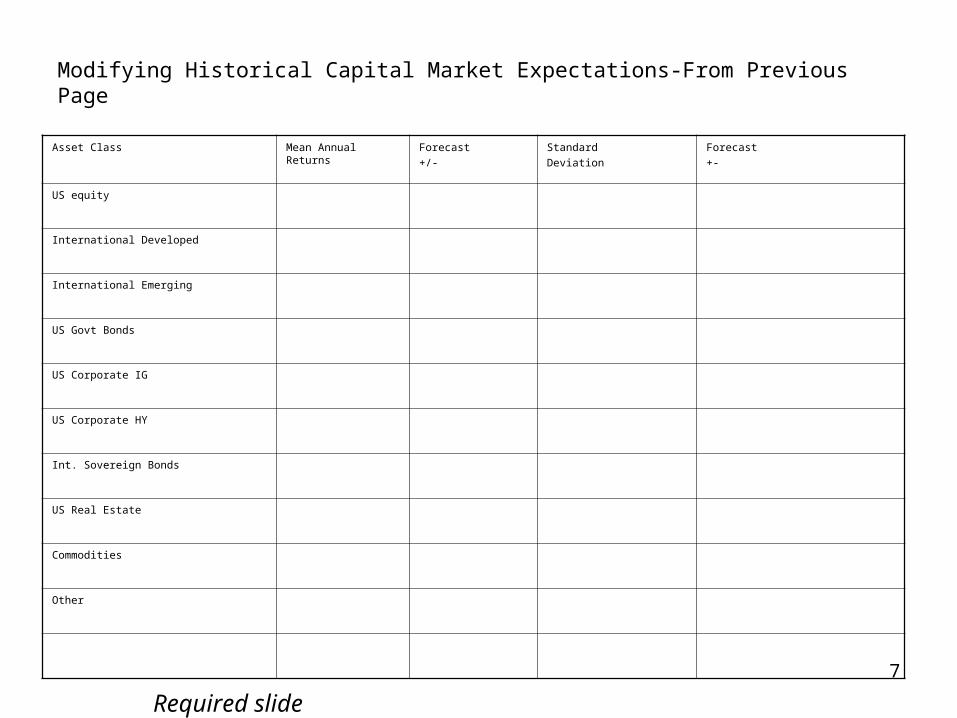
Modifying Historical Capital Market Expectations-From Previous Page
Asset Class Mean Annual Returns Forecast
+/-
Standard
Deviation
Forecast
+-
US equity
International Developed
International Emerging
US Govt Bonds
US Corporate IG
US Corporate HY
Int. Sovereign Bonds
US Real Estate
Commodities
Other
Required slide
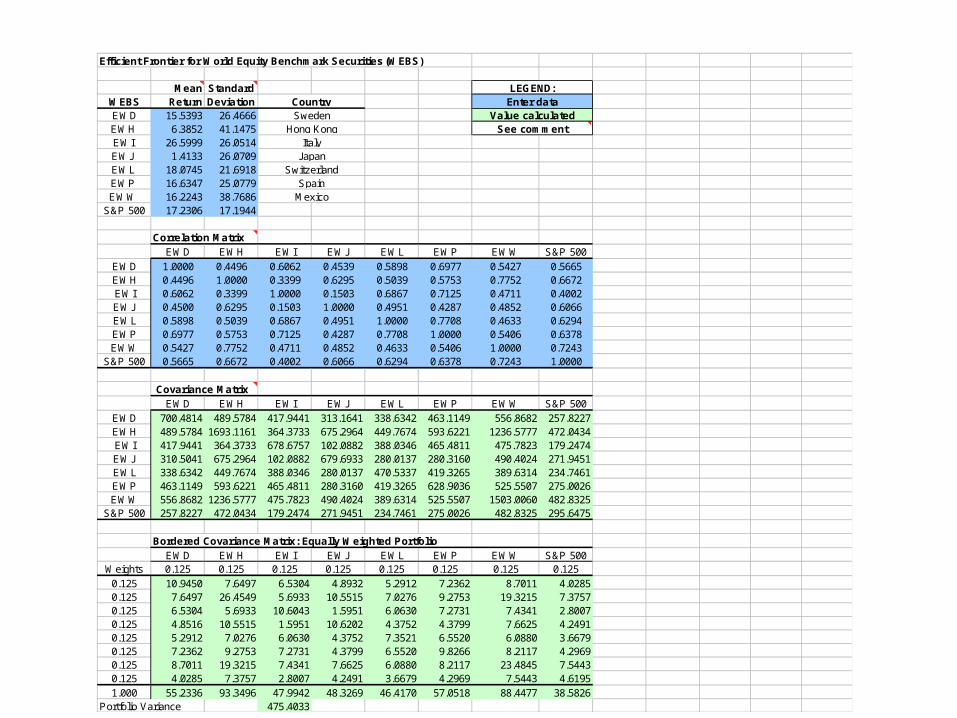
Efficient Frontier for World Equity Benchmark Securities (WEBS)
Mean StandardWEBS Return DeviationEWD 15.5393 26.4666EWH 6.3852 41.1475EWI 26.5999 26.0514EWJ 1.4133 26.0709EWL 18.0745 21.6918EWP 16.6347 25.0779EWW 16.2243 38.7686
S&P 500 17.2306 17.1944
Correlation MatrixEWD EWH EWI EWJ EWL EWP EWW S&P 500
EWD 1.0000 0.4496 0.6062 0.4539 0.5898 0.6977 0.5427 0.5665EWH 0.4496 1.0000 0.3399 0.6295 0.5039 0.5753 0.7752 0.6672EWI 0.6062 0.3399 1.0000 0.1503 0.6867 0.7125 0.4711 0.4002EWJ 0.4500 0.6295 0.1503 1.0000 0.4951 0.4287 0.4852 0.6066EWL 0.5898 0.5039 0.6867 0.4951 1.0000 0.7708 0.4633 0.6294EWP 0.6977 0.5753 0.7125 0.4287 0.7708 1.0000 0.5406 0.6378EWW 0.5427 0.7752 0.4711 0.4852 0.4633 0.5406 1.0000 0.7243
S&P 500 0.5665 0.6672 0.4002 0.6066 0.6294 0.6378 0.7243 1.0000
Covariance Matrix EWD EWH EWI EWJ EWL EWP EWW S&P 500
EWD 700.4814 489.5784 417.9441 313.1641 338.6342 463.1149 556.8682 257.8227EWH 489.5784 1693.1161 364.3733 675.2964 449.7674 593.6221 1236.5777 472.0434EWI 417.9441 364.3733 678.6757 102.0882 388.0346 465.4811 475.7823 179.2474EWJ 310.5041 675.2964 102.0882 679.6933 280.0137 280.3160 490.4024 271.9451EWL 338.6342 449.7674 388.0346 280.0137 470.5337 419.3265 389.6314 234.7461EWP 463.1149 593.6221 465.4811 280.3160 419.3265 628.9036 525.5507 275.0026EWW 556.8682 1236.5777 475.7823 490.4024 389.6314 525.5507 1503.0060 482.8325
S&P 500 257.8227 472.0434 179.2474 271.9451 234.7461 275.0026 482.8325 295.6475
Bordered Covariance Matrix: Equally Weighted Portfolio EWD EWH EWI EWJ EWL EWP EWW S&P 500Weights 0.125 0.125 0.125 0.125 0.125 0.125 0.125 0.125
0.125 10.9450 7.6497 6.5304 4.8932 5.2912 7.2362 8.7011 4.02850.125 7.6497 26.4549 5.6933 10.5515 7.0276 9.2753 19.3215 7.37570.125 6.5304 5.6933 10.6043 1.5951 6.0630 7.2731 7.4341 2.80070.125 4.8516 10.5515 1.5951 10.6202 4.3752 4.3799 7.6625 4.24910.125 5.2912 7.0276 6.0630 4.3752 7.3521 6.5520 6.0880 3.66790.125 7.2362 9.2753 7.2731 4.3799 6.5520 9.8266 8.2117 4.29690.125 8.7011 19.3215 7.4341 7.6625 6.0880 8.2117 23.4845 7.54430.125 4.0285 7.3757 2.8007 4.2491 3.6679 4.2969 7.5443 4.61951.000 55.2336 93.3496 47.9942 48.3269 46.4170 57.0518 88.4477 38.5826
Portfolio Variance 475.4033
SpainMexico
CountrySweden
Hong KongItaly
JapanSwitzerland
LEGEND:Enter data
Value calculatedSee comment
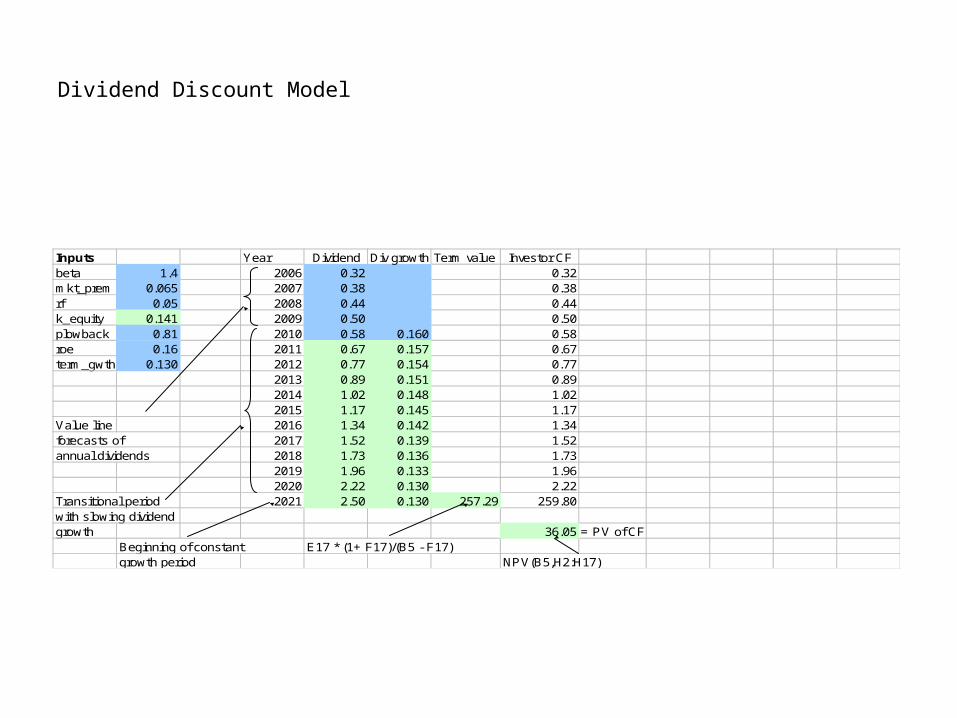
Dividend Discount Model
Inputs Year Dividend Div growth Term value Investor CFbeta 1.4 2006 0.32 0.32mkt_prem 0.065 2007 0.38 0.38rf 0.05 2008 0.44 0.44k_equity 0.141 2009 0.50 0.50plowback 0.81 2010 0.58 0.160 0.58roe 0.16 2011 0.67 0.157 0.67term_gwth 0.130 2012 0.77 0.154 0.77
2013 0.89 0.151 0.892014 1.02 0.148 1.022015 1.17 0.145 1.17
Value line 2016 1.34 0.142 1.34forecasts of 2017 1.52 0.139 1.52annual dividends 2018 1.73 0.136 1.73
2019 1.96 0.133 1.962020 2.22 0.130 2.22
Transitional period 2021 2.50 0.130 257.29 259.80with slowing dividendgrowth 36.05 = PV of CF
Beginning of constant E17 * (1+ F17)/(B5 - F17)growth period NPV(B5,H2:H17)
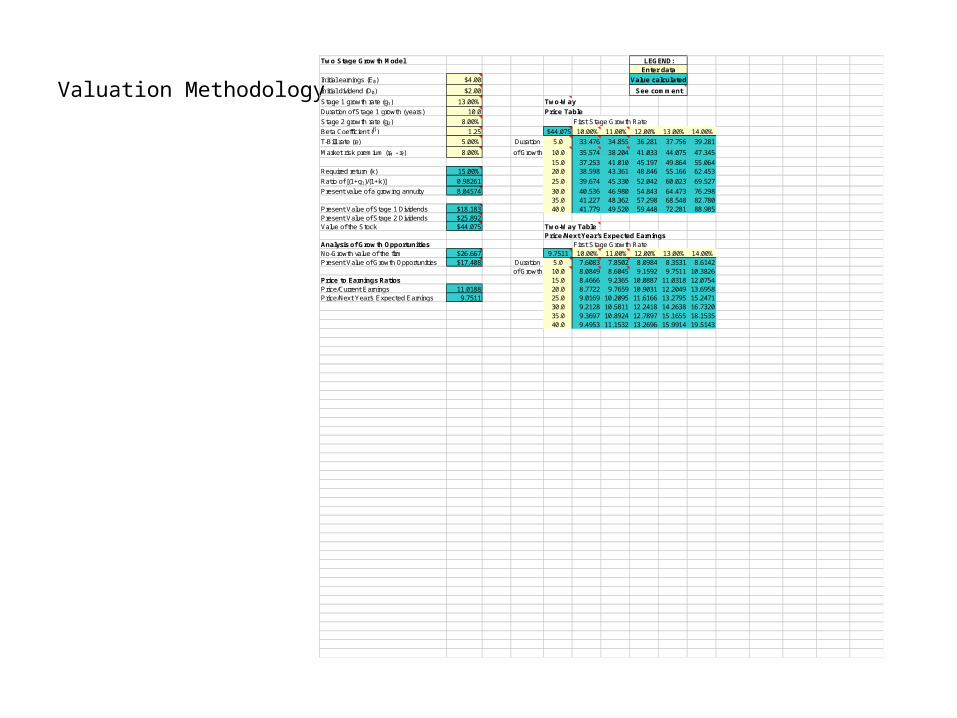
Valuation Methodology
Two Stage Growth Model
Initial earnings (E0) $4.00
Initial dividend (D0) $2.00
Stage 1 growth rate (g1) 13.00% Two-Way
Duration of Stage 1 growth (years) 10.0 Price Table
Stage 2 growth rate (g2) 8.00% First Stage Growth Rate
Beta Coefficient (b) 1.25 $44.075 10.00% 11.00% 12.00% 13.00% 14.00%
T-Bill rate (rf ) 5.00% Duration 5.0 33.476 34.855 36.281 37.756 39.281
Market risk premium (rM - rf ) 8.00% of Growth 10.0 35.574 38.204 41.033 44.075 47.345
15.0 37.253 41.010 45.197 49.864 55.064Required return (k) 15.00% 20.0 38.598 43.361 48.846 55.166 62.453
Ratio of [(1+g1)/(1+k)] 0.98261 25.0 39.674 45.330 52.042 60.023 69.527
Present value of a growing annuity 8.04574 30.0 40.536 46.980 54.843 64.473 76.29835.0 41.227 48.362 57.298 68.548 82.780
Present Value of Stage 1 Dividends $18.183 40.0 41.779 49.520 59.448 72.281 88.985Present Value of Stage 2 Dividends $25.892Value of the Stock $44.075 Two-Way Table
Price/Next Year's Expected EarningsAnalysis of Growth Opportunities First Stage Growth RateNo-Growth value of the firm $26.667 9.7511 10.00% 11.00% 12.00% 13.00% 14.00%Present Value of Growth Opportunities $17.408 Duration 5.0 7.6083 7.8502 8.0984 8.3531 8.6142
of Growth 10.0 8.0849 8.6045 9.1592 9.7511 10.3826Price to Earnings Ratios 15.0 8.4666 9.2365 10.0887 11.0318 12.0754Price/Current Earnings 11.0188 20.0 8.7722 9.7659 10.9031 12.2049 13.6958Price/Next Year's Expected Earnings 9.7511 25.0 9.0169 10.2095 11.6166 13.2795 15.2471
30.0 9.2128 10.5811 12.2418 14.2638 16.732035.0 9.3697 10.8924 12.7897 15.1655 18.153540.0 9.4953 11.1532 13.2696 15.9914 19.5143
LEGEND:Enter data
Value calculated
See comment
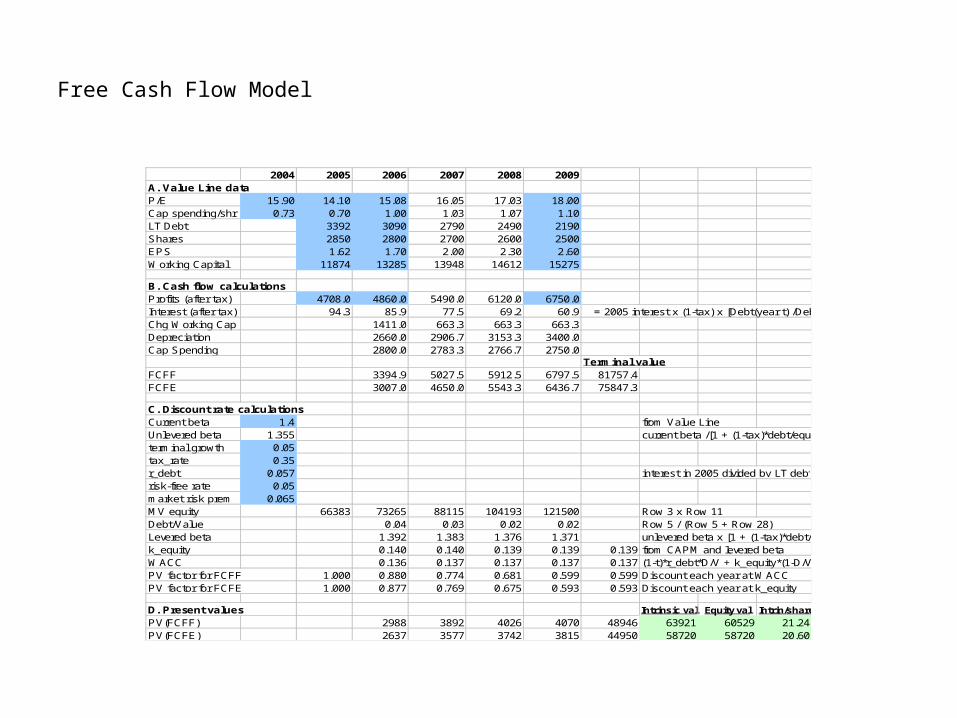
Free Cash Flow Model
2004 2005 2006 2007 2008 2009A. Value Line dataP/E 15.90 14.10 15.08 16.05 17.03 18.00Cap spending/shr 0.73 0.70 1.00 1.03 1.07 1.10LT Debt 3392 3090 2790 2490 2190Shares 2850 2800 2700 2600 2500EPS 1.62 1.70 2.00 2.30 2.60Working Capital 11874 13285 13948 14612 15275
B. Cash flow calculationsProfits (after tax) 4708.0 4860.0 5490.0 6120.0 6750.0Interest (after tax) 94.3 85.9 77.5 69.2 60.9 = 2005 interest x (1-tax) x [Debt(year t) /Debt(2005)] Chg Working Cap 1411.0 663.3 663.3 663.3Depreciation 2660.0 2906.7 3153.3 3400.0Cap Spending 2800.0 2783.3 2766.7 2750.0
Terminal valueFCFF 3394.9 5027.5 5912.5 6797.5 81757.4FCFE 3007.0 4650.0 5543.3 6436.7 75847.3
C. Discount rate calculationsCurrent beta 1.4 from Value LineUnlevered beta 1.355 current beta /[1 + (1-tax)*debt/equity)]terminal growth 0.05tax_rate 0.35r_debt 0.057 interest in 2005 divided by LT debtrisk-free rate 0.05market risk prem 0.065MV equity 66383 73265 88115 104193 121500 Row 3 x Row 11Debt/Value 0.04 0.03 0.02 0.02 Row 5 / (Row 5 + Row 28)Levered beta 1.392 1.383 1.376 1.371 unlevered beta x [1 + (1-tax)*debt/equity]k_equity 0.140 0.140 0.139 0.139 0.139 from CAPM and levered betaWACC 0.136 0.137 0.137 0.137 0.137 (1-t)*r_debt*D/V + k_equity*(1-D/V)PV factor for FCFF 1.000 0.880 0.774 0.681 0.599 0.599 Discount each year at WACCPV factor for FCFE 1.000 0.877 0.769 0.675 0.593 0.593 Discount each year at k_equity
D. Present values Intrinsic val Equity val Intrin/share
PV(FCFF) 2988 3892 4026 4070 48946 63921 60529 21.24PV(FCFE) 2637 3577 3742 3815 44950 58720 58720 20.60
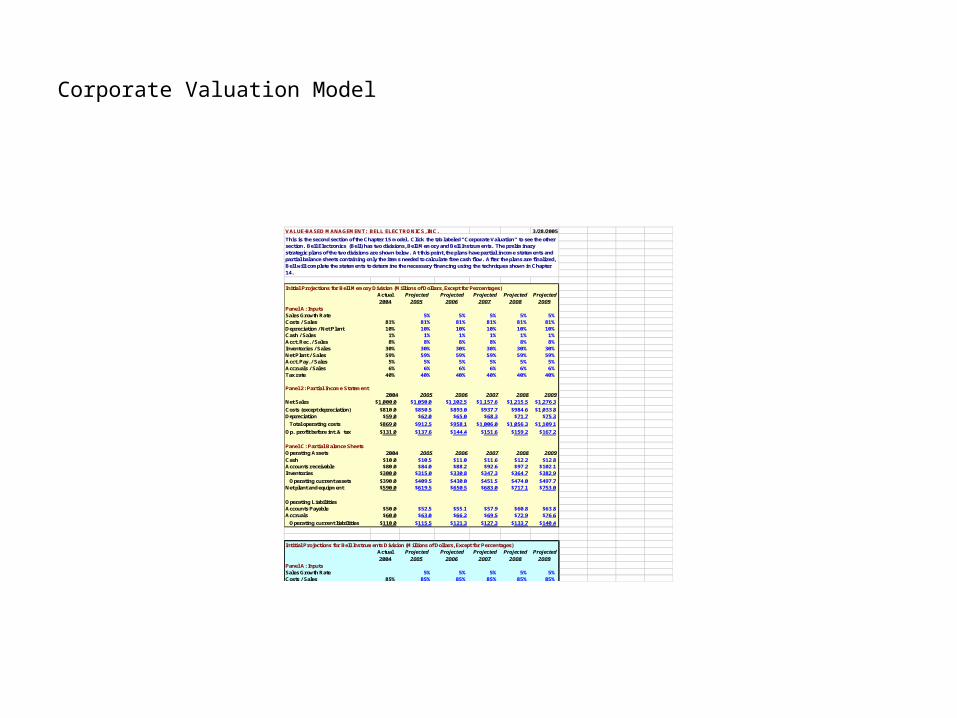
Corporate Valuation Model
VALUE-BASED MANAGEMENT: BELL ELECTRONICS, INC. 3/28/2005
Initial Projections for Bell Memory Division (Millions of Dollars, Except for Percentages)Actual Projected Projected Projected Projected Projected
2004 2005 2006 2007 2008 2009
Panel A: InputsSales Growth Rate 5% 5% 5% 5% 5%Costs / Sales 81% 81% 81% 81% 81% 81%Depreciation / Net Plant 10% 10% 10% 10% 10% 10%Cash / Sales 1% 1% 1% 1% 1% 1%Acct. Rec. / Sales 8% 8% 8% 8% 8% 8%Inventories / Sales 30% 30% 30% 30% 30% 30%Net Plant / Sales 59% 59% 59% 59% 59% 59%Acct. Pay. / Sales 5% 5% 5% 5% 5% 5%Accruals / Sales 6% 6% 6% 6% 6% 6%Tax rate 40% 40% 40% 40% 40% 40%
Panel 2: Partial Income Statement2004 2005 2006 2007 2008 2009
Net Sales $1,000.0 $1,050.0 $1,102.5 $1,157.6 $1,215.5 $1,276.3
Costs (except depreciation) $810.0 $850.5 $893.0 $937.7 $984.6 $1,033.8Depreciation $59.0 $62.0 $65.0 $68.3 $71.7 $75.3
Total operating costs $869.0 $912.5 $958.1 $1,006.0 $1,056.3 $1,109.1
Op. profit before int. & tax $131.0 $137.6 $144.4 $151.6 $159.2 $167.2
Panel C: Partial Balance SheetsOperating Assets 2004 2005 2006 2007 2008 2009
Cash $10.0 $10.5 $11.0 $11.6 $12.2 $12.8Accounts receivable $80.0 $84.0 $88.2 $92.6 $97.2 $102.1Inventories $300.0 $315.0 $330.8 $347.3 $364.7 $382.9
Operating current assets $390.0 $409.5 $430.0 $451.5 $474.0 $497.7Net plant and equipment $590.0 $619.5 $650.5 $683.0 $717.1 $753.0
Operating Liabilities Accounts Payable $50.0 $52.5 $55.1 $57.9 $60.8 $63.8Accruals $60.0 $63.0 $66.2 $69.5 $72.9 $76.6
Operating current liabilities $110.0 $115.5 $121.3 $127.3 $133.7 $140.4
Intitial Projections for Bell Instruments Division (Millions of Dollars, Except for Percentages)Actual Projected Projected Projected Projected Projected
2004 2005 2006 2007 2008 2009
Panel A: InputsSales Growth Rate 5% 5% 5% 5% 5%Costs / Sales 85% 85% 85% 85% 85% 85%
This is the second section of the Chapter 15 model. Click the tab labeled "Corporate Valuation" to see the other section. Bell Electronics (Bell) has two divisions, Bell Memory and Bell Instruments. The preliminary strategic plans of the two divisions are shown below. At this point, the plans have partial income statements and partial balance sheets containing only the items needed to calculate free cash flow. After the plans are finalized, Bell will complete the statements to determine the necessary financing using the techniques shown in Chapter 14.
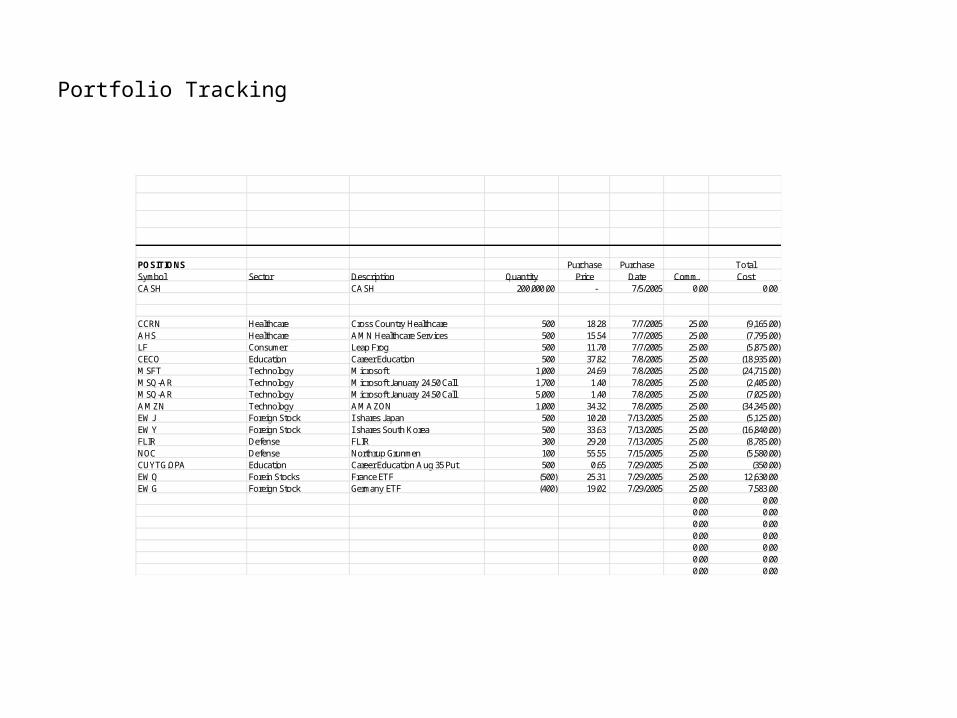
Portfolio Tracking
POSITIONS Purchase Purchase TotalSymbol Sector Description Quantity Price Date Comm. CostCASH CASH 200,000.00 - 7/5/2005 0.00 0.00
CCRN Healthcare Cross Country Healthcare 500 18.28 7/7/2005 25.00 (9,165.00)AHS Healthcare AMN Healthcare Services 500 15.54 7/7/2005 25.00 (7,795.00)LF Consumer Leap Frog 500 11.70 7/7/2005 25.00 (5,875.00)CECO Education Career Education 500 37.82 7/8/2005 25.00 (18,935.00)MSFT Technology Microsoft 1,000 24.69 7/8/2005 25.00 (24,715.00)MSQ-AR Technology Microsoft January 24.50 Call 1,700 1.40 7/8/2005 25.00 (2,405.00)MSQ-AR Technology Microsoft January 24.50 Call 5,000 1.40 7/8/2005 25.00 (7,025.00)AMZN Technology AMAZON 1,000 34.32 7/8/2005 25.00 (34,345.00)EWJ Foreign Stock I shares Japan 500 10.20 7/13/2005 25.00 (5,125.00)EWY Foreign Stock I shares South Korea 500 33.63 7/13/2005 25.00 (16,840.00)FLIR Defense FLIR 300 29.20 7/13/2005 25.00 (8,785.00)NOC Defense Northrup Grunmen 100 55.55 7/15/2005 25.00 (5,580.00)CUYTG.OPA Education Career Education Aug 35 Put 500 0.65 7/29/2005 25.00 (350.00)EWQ Forein Stocks France ETF (500) 25.31 7/29/2005 25.00 12,630.00EWG Foreign Stock Germany ETF (400) 19.02 7/29/2005 25.00 7,583.00
0.00 0.000.00 0.000.00 0.000.00 0.000.00 0.000.00 0.000.00 0.00
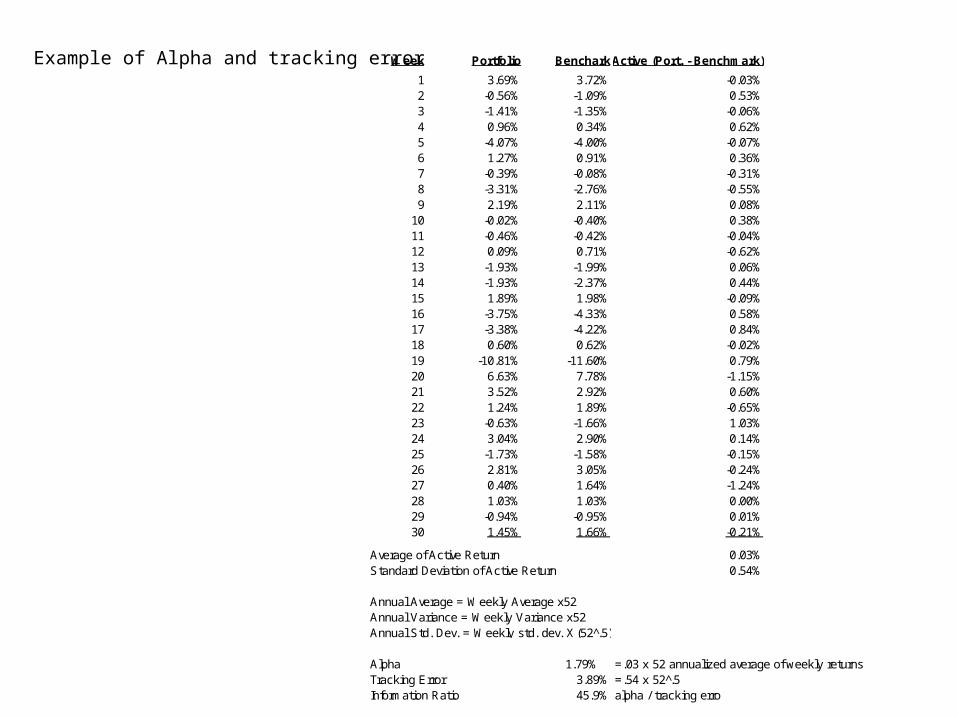
Example of Alpha and tracking error Week Portfolio BencharkActive (Port. - Benchmark)
1 3.69% 3.72% -0.03%2 -0.56% -1.09% 0.53%3 -1.41% -1.35% -0.06%4 0.96% 0.34% 0.62%5 -4.07% -4.00% -0.07%6 1.27% 0.91% 0.36%7 -0.39% -0.08% -0.31%8 -3.31% -2.76% -0.55%9 2.19% 2.11% 0.08%
10 -0.02% -0.40% 0.38%11 -0.46% -0.42% -0.04%12 0.09% 0.71% -0.62%13 -1.93% -1.99% 0.06%14 -1.93% -2.37% 0.44%15 1.89% 1.98% -0.09%16 -3.75% -4.33% 0.58%17 -3.38% -4.22% 0.84%18 0.60% 0.62% -0.02%19 -10.81% -11.60% 0.79%20 6.63% 7.78% -1.15%21 3.52% 2.92% 0.60%22 1.24% 1.89% -0.65%23 -0.63% -1.66% 1.03%24 3.04% 2.90% 0.14%25 -1.73% -1.58% -0.15%26 2.81% 3.05% -0.24%27 0.40% 1.64% -1.24%28 1.03% 1.03% 0.00%29 -0.94% -0.95% 0.01%30 1.45% 1.66% -0.21%
Average of Active Return 0.03%Standard Deviation of Active Return 0.54%
Annual Average = Weekly Average x52Annual Variance = Weekly Variance x52Annual Std. Dev. = Weekly std. dev. X (52 .̂5)
Alpha 1.79% =.03 x 52 annualized average of weekly returnsTracking Error 3.89% =.54 x 52 .̂5Information Ratio 45.9% alpha / tracking erro