investment opportunity in indonesia 12 november 2011
TRANSCRIPT


Top Down Issues.1. Global
1. Balance Sheet Recessions and Their Remedies.
2. Do Quantitative Easing Exacerbate or Solve The Balance Sheet Recession?
3. China A Savior?
4. Black Swan Event: US Treasury Bond Bubbles Burst.
2. Indonesia
1. Hot Issues For year 2012 and Beyond.
2. Investment Thesis.

History 2000, IT Bubble or DotCom Bubble. When bubble burst, US aggregate demand falling
sharply.
Fed responded by slashing interest rates from 6% to 1%.
Effectively create housing bubbles.
Housing bubble repairing US company and resident balance sheet.
2007, Sub-prime Mortgage bubble burst .
2008, Lehman Brother Collapse create banking crisis including Pan Arab Property Crises, European Debt Crisis.
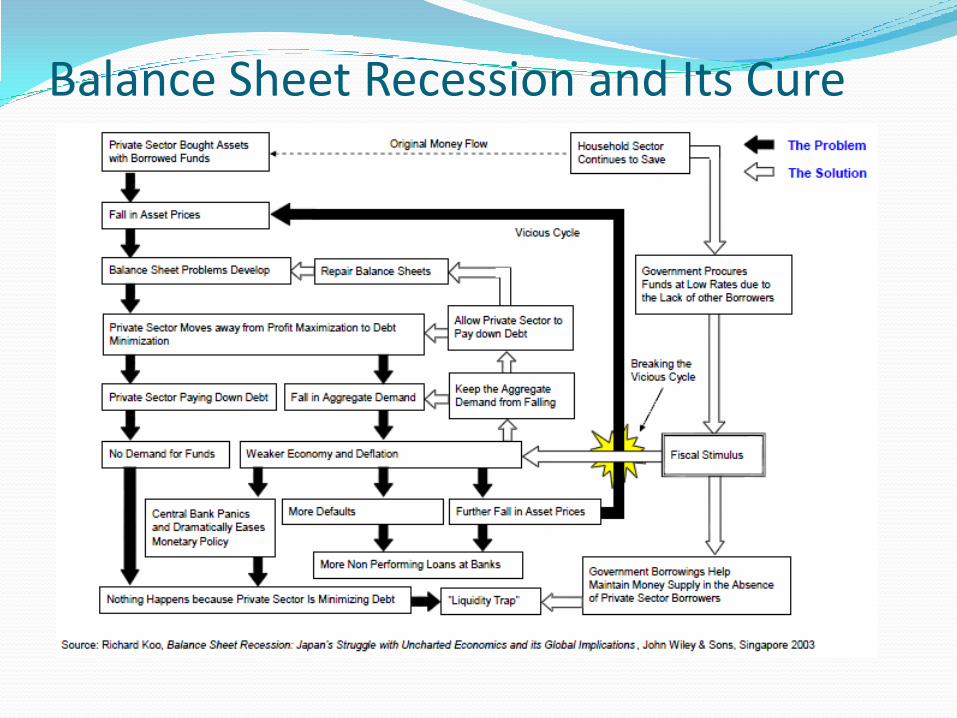
Balance Sheet Recession and Its Cure

Yin Yang Cycle of Bubbles and Balance Sheet Recessions
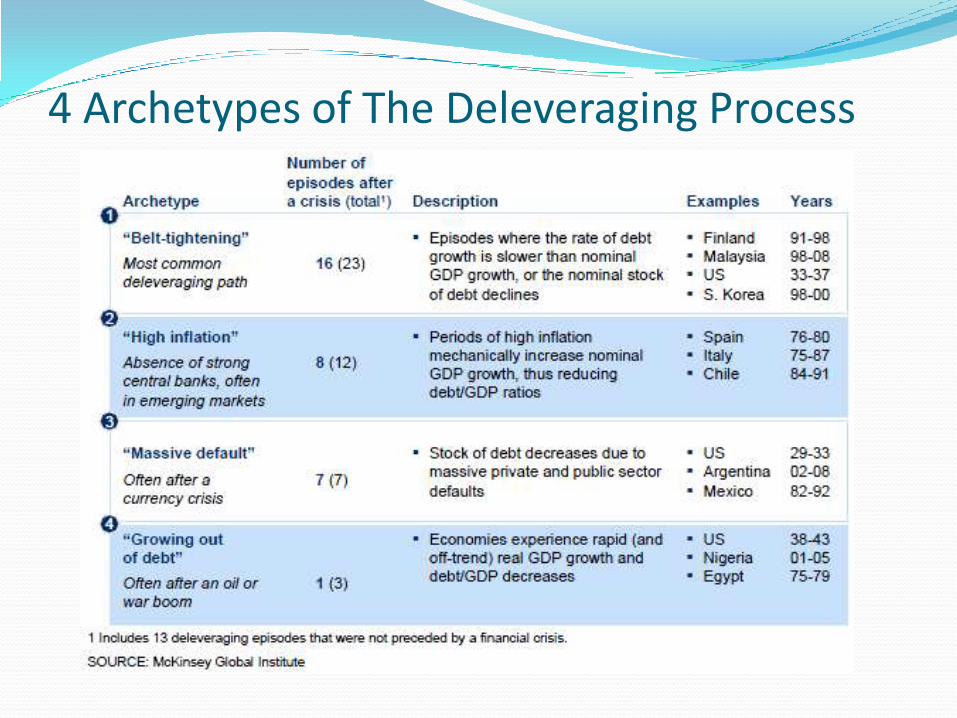
4 Archetypes of The Deleveraging Process

Impact of Deleveraging of GDP Growth

Strategy To Solve Debt Crisis Previous Strategy – Fiscal Stimulus – Tax Cut,
Government Spending, and Monetary Stimulus –Lowering Interest Rate.
Ongoing Strategy – Quantitative and Qualitative Easing.
Latest Strategy – Hair Cut and Operation Twist.
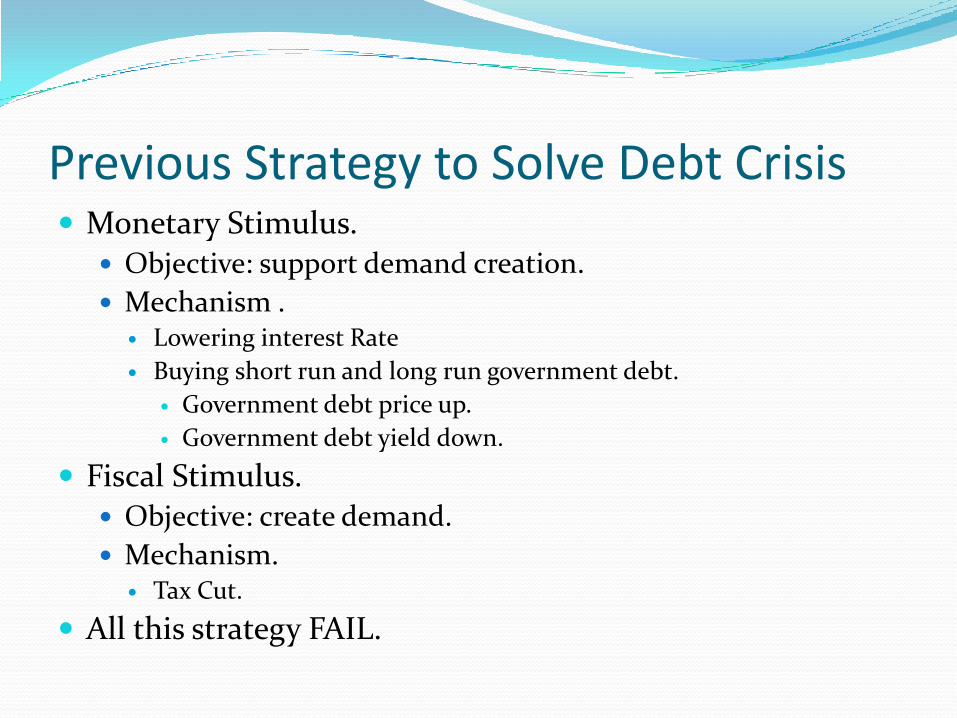
Previous Strategy to Solve Debt Crisis Monetary Stimulus.
Objective: support demand creation.
Mechanism . Lowering interest Rate
Buying short run and long run government debt.
Government debt price up.
Government debt yield down.
Fiscal Stimulus. Objective: create demand.
Mechanism. Tax Cut.
All this strategy FAIL.
US Economy GDP growth weakening after inventory restocking.
Unemployment rate may increase again.
Saving rate weakening.
Inflation pressure may increase again.

US GDP Growth and Unemployment

US Saving Rate and Inflation Rate
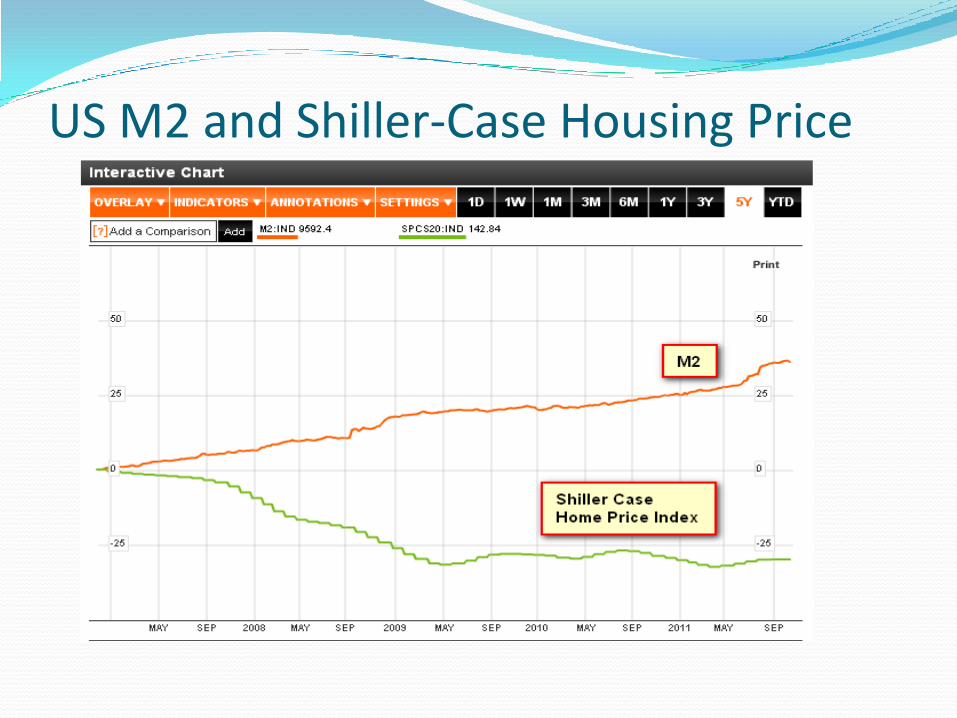
US M2 and Shiller-Case Housing Price
Europe Economy Portugal GDP growth weak.
Ireland GDP growth weak.
Spain GDP growth weak.
Italy GDP Growth weak.
Unemployment very high.
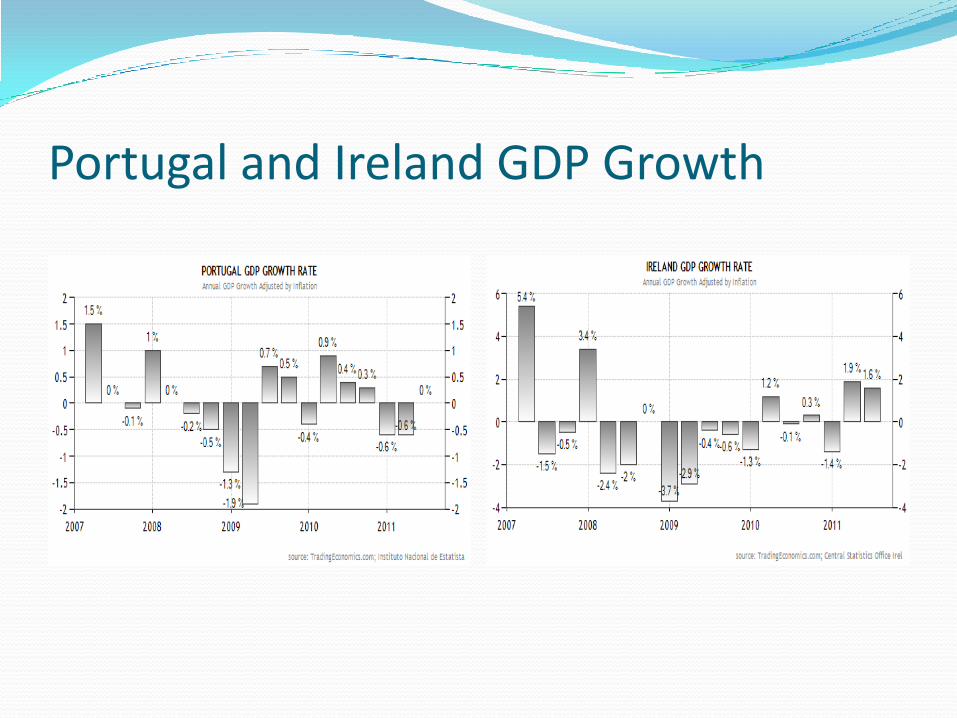
Portugal and Ireland GDP Growth

Spain and Italy GDP Growth

High Europe Unemployment Ratehttp://epp.eurostat.ec.europa.eu/cache/ITY_PUBLIC/3-31102011-BP/EN/3-31102011-BP-EN.PDF

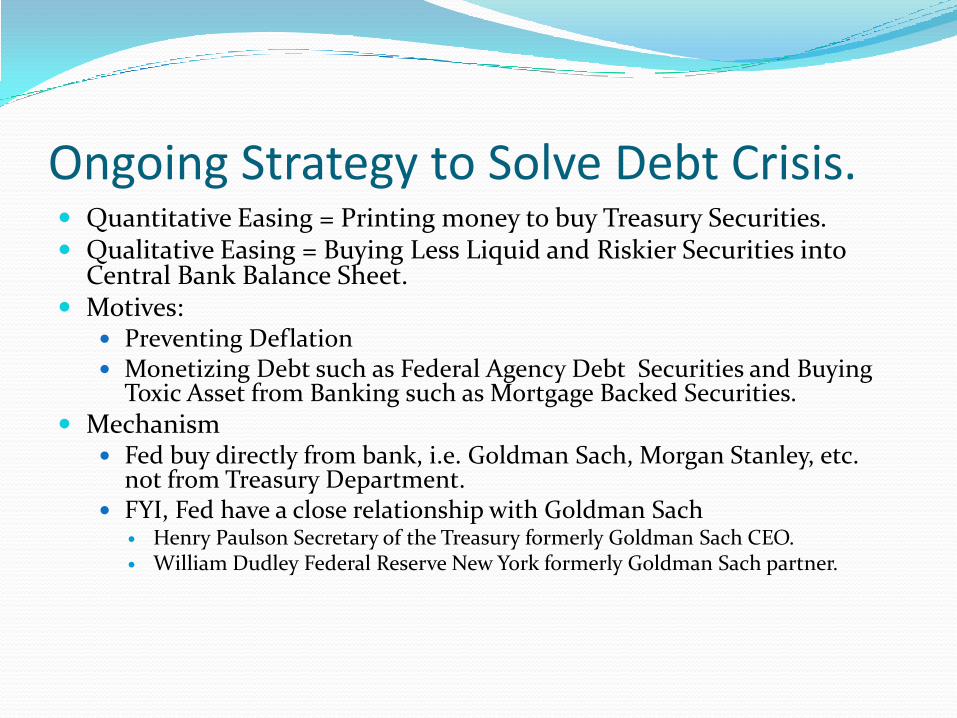
Ongoing Strategy to Solve Debt Crisis. Quantitative Easing = Printing money to buy Treasury Securities. Qualitative Easing = Buying Less Liquid and Riskier Securities into
Central Bank Balance Sheet. Motives:
Preventing Deflation Monetizing Debt such as Federal Agency Debt Securities and Buying
Toxic Asset from Banking such as Mortgage Backed Securities.
Mechanism Fed buy directly from bank, i.e. Goldman Sach, Morgan Stanley, etc.
not from Treasury Department. FYI, Fed have a close relationship with Goldman Sach
Henry Paulson Secretary of the Treasury formerly Goldman Sach CEO. William Dudley Federal Reserve New York formerly Goldman Sach partner.
Problems with Quantitative and Qualitative Easing Monetizing debt
Printing money won’t solve debt crises.
Planting the seeds of hyperinflation.
Japan history show Quantitative Easing FAIL.

We Believe QE Exacerbate Debt Crisis Primary reason why de-leveraging process need at
least 10 years to revive real economic power.
We do not want to accept reality that deflation are good and unavoidable.
Waiting present capacity to be obsolete and replace with new capacity.
Property bubbles destroy value, while previous bubbles from railroad bubbles to dotcom bubbles created economic infrastructure for future value creation.
De-Leveraging cannot be done by printing money.
Latest Strategy to Solve Debt Crisis Europe Hair Cut Country : Greek government debt hair cut 50%. Detail unknown yet ...
US Operation Twist Selling Short Term Treasury. Buying Long Term Treasury. Motives:
Investor: increase investor appetite to invest in US. Break Liquidity Trap: reduce banking sector appetite to invest in
long term treasury financed by short term treasury.
Result: Fail.

Problem With Hair Cut. Greek economic structural problem not addressed,
debt problem will reemerge.
Currency overvalue.
Large debt and corporate debt overhang (… but mostly hidden).
Moral Hazard problems.
Other PIIGS country may follow suit.

After Hair Cut Agreement Bond Yield Keep On Rising.
Political Instability Getting Severe.

Greek Debt Still In Financial Distress (01 Nov ‘11)

Greek Debt Still In Financial Distress (09 Nov ‘11)

Spain In Financial Distress (01 Nov ‘11)
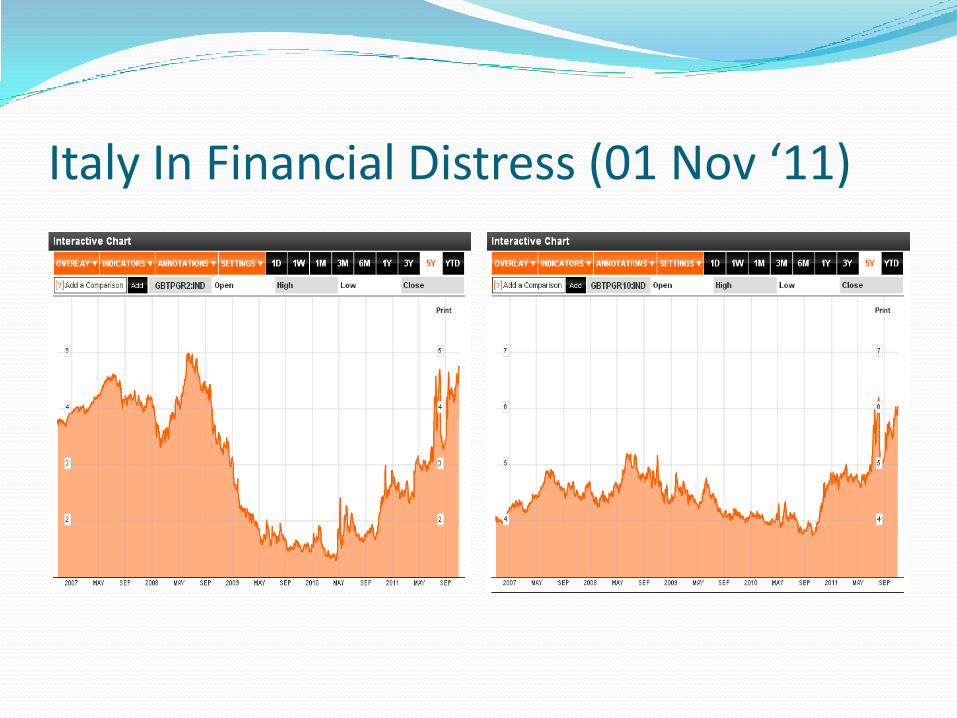
Italy In Financial Distress (01 Nov ‘11)
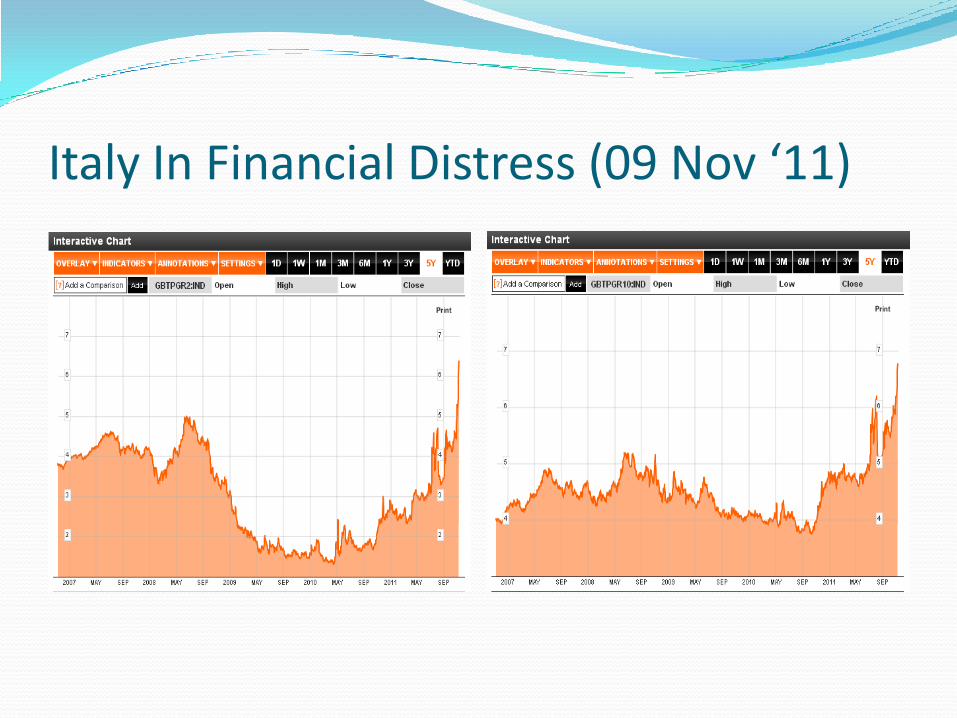
Italy In Financial Distress (09 Nov ‘11)

Europe problems are bigger …

Quo Vadis Euro? Why Euro need to breakup?
No homogeneity in economic performance within euro country. No instrument available to correct differences in economic
performance within euro country.
Who should leave Euro? Source of problem perspective, Germany and France should leave Euro.
Consistently experience surplus economy while neighbors country consistently experience deficit economy.
Currency exchange rate too low.
Capacity to absorb shock perspective, Germany and France. Economic adjustment, PIIGS countries. Politic perspective, no countries permitted to leave Euro.
Will Euro breakup in 2012? Unlikely.

Is China Strong Enough to be A Savior? At first glance, ….
Large currency reserve.
High economic growth rate.

China GDP Growth and Currency Reserve

Deeper Analysis (1) US and China Economy Relationship.
A bugs life movie.
Hopper: It's a bug-eat-bug world out there, princess. One of those Circle of Life kind of things. Now let me tell you how things are supposed to work: The sun grows the food, the ants pick the food, the grasshoppers eat the food...
Paul Krugman
They give us poisoned products, we give them worthless paper.
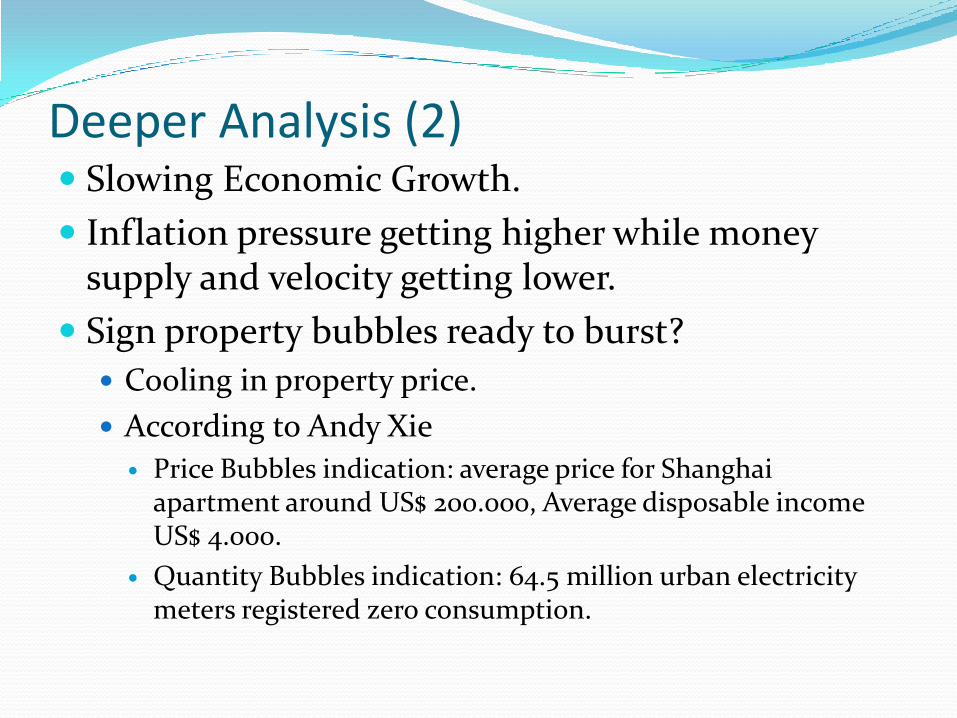
Deeper Analysis (2) Slowing Economic Growth.
Inflation pressure getting higher while money supply and velocity getting lower.
Sign property bubbles ready to burst?
Cooling in property price.
According to Andy Xie
Price Bubbles indication: average price for Shanghai apartment around US$ 200.000, Average disposable income US$ 4.000.
Quantity Bubbles indication: 64.5 million urban electricity meters registered zero consumption.
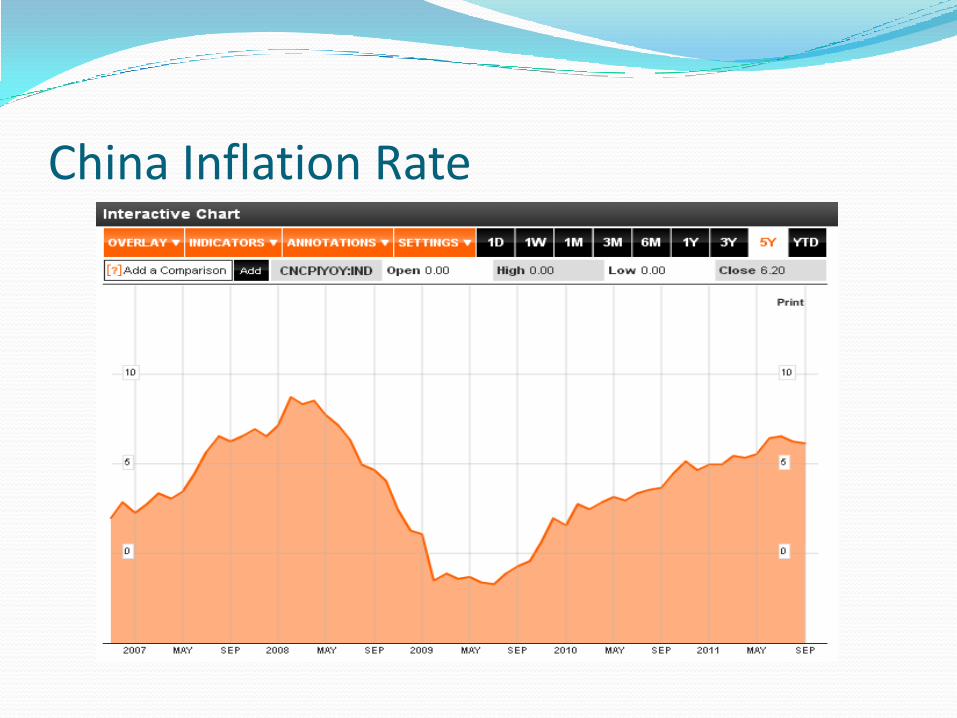
China Inflation Rate
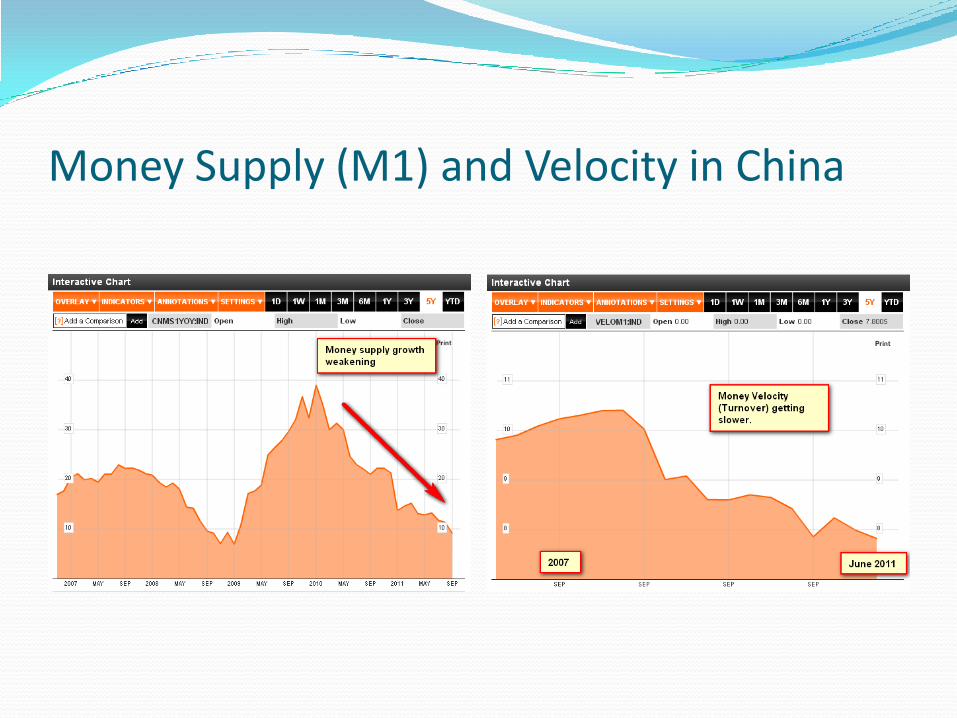
Money Supply (M1) and Velocity in China

China Cooling Property Prices
Last Issue, US Treasury Bond Bubbles What is bond bubbles?
Price above fundamental values.
Reasons of Treasury Bond Bubbles Persistent US Deficit financed by debt. Fed printing money, M2 growth around 35% since 2007 until
present. Treasury Yield very low, not justified by US government
ability to pay and real value keep on plummet as fed printing press still active.
I think investor do not want to be paid by funny money. This maybe a black swan event. When bond bubbles burst similar to “A straw that broke
camel back”.

Why US Treasury Bond Bubbles Burst Matter? All central bank hold their currency reserve in US$
currency and in US Treasury Bond as risk free instrument.
When US Treasury Bond price plummet, all central bank losing money and losing credibility as lender of last resort, bank run may emerging, creating panic.
When US Treasury Bond price plummet, money market fund, structured product i.e. CDO may default, panic among banks, fund managers, and investors.
Massive wealth loss will lead to hyper deflation.

Early Indication US$ Losing Foreign Investor Appetite According to Nouriel Roubini
US Public debt holding period declining
A decade ago the average maturity was close to 60 months.
2009, the average maturity drop to below 50 month.
Acquired US$ for foreign currency reserve declining.
2001, US$ made up a little over 70% of the currency reserves held overseas.
2008, 63% of newly acquired reserves.
Third quarter 2009, 37% of newly acquired reserves.

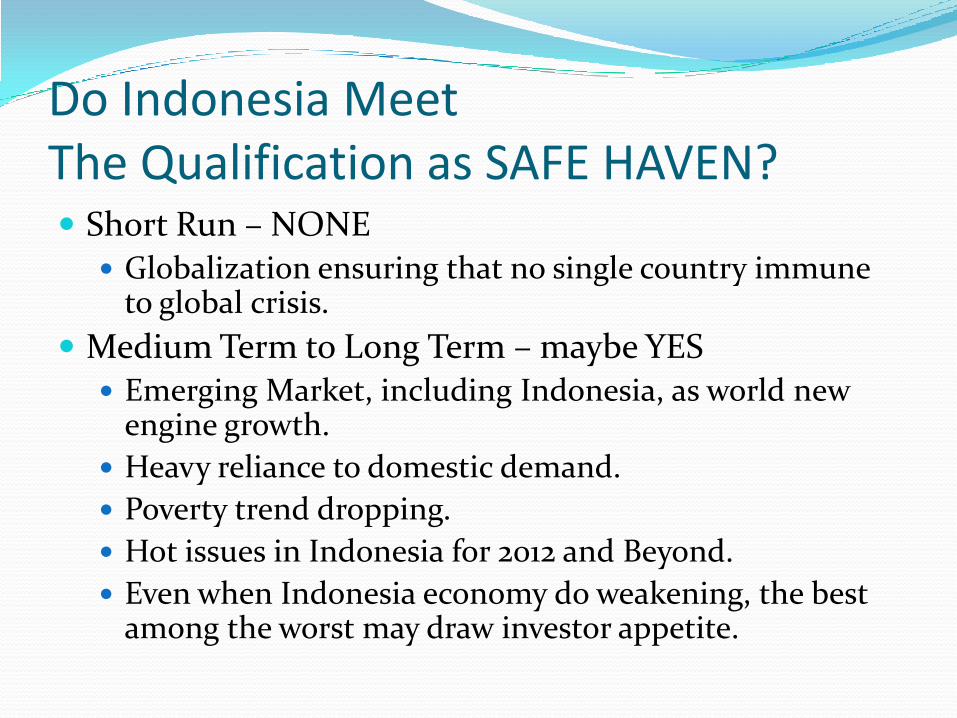
Do Indonesia Meet The Qualification as SAFE HAVEN? Short Run – NONE Globalization ensuring that no single country immune
to global crisis.
Medium Term to Long Term – maybe YES Emerging Market, including Indonesia, as world new
engine growth.
Heavy reliance to domestic demand.
Poverty trend dropping.
Hot issues in Indonesia for 2012 and Beyond.
Even when Indonesia economy do weakening, the best among the worst may draw investor appetite.
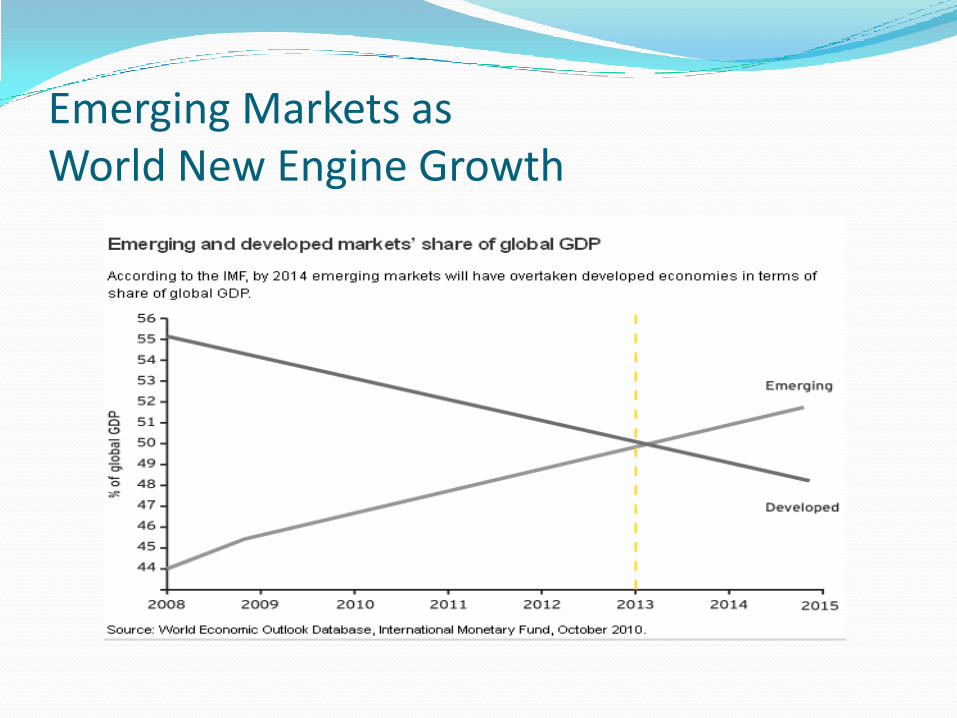
Emerging Markets as World New Engine Growth

Indonesia Export
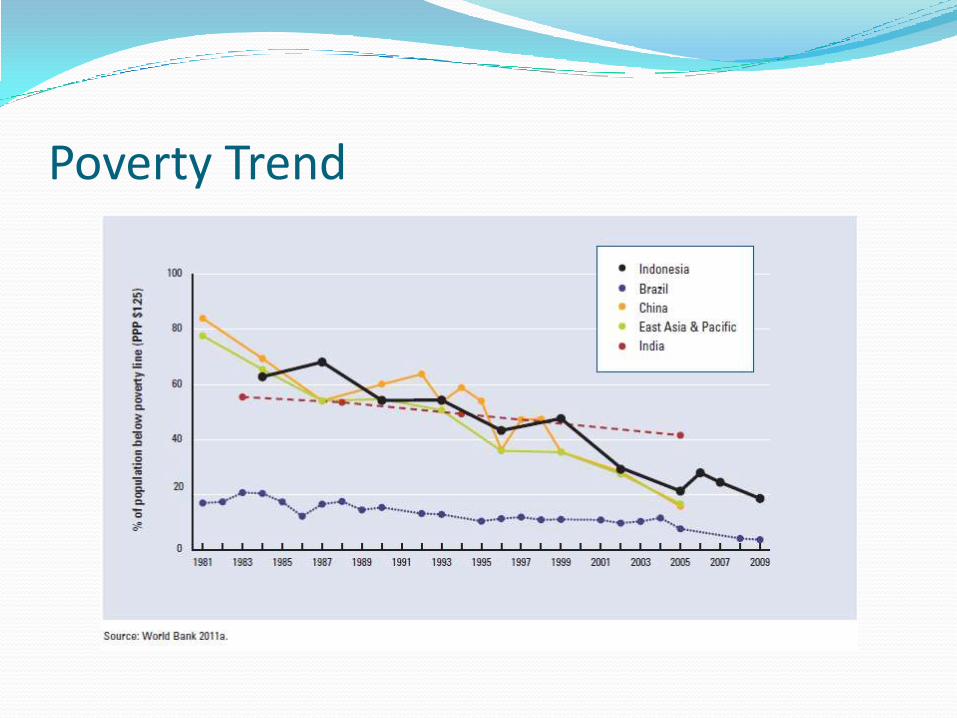
Poverty Trend
Hot Issues For Indonesia In Year 2012 And Beyond
Demographic Bonus.
Efficiency Driven Economic Growth.
Strong GDP Growth.
Strong Capital Inflow.
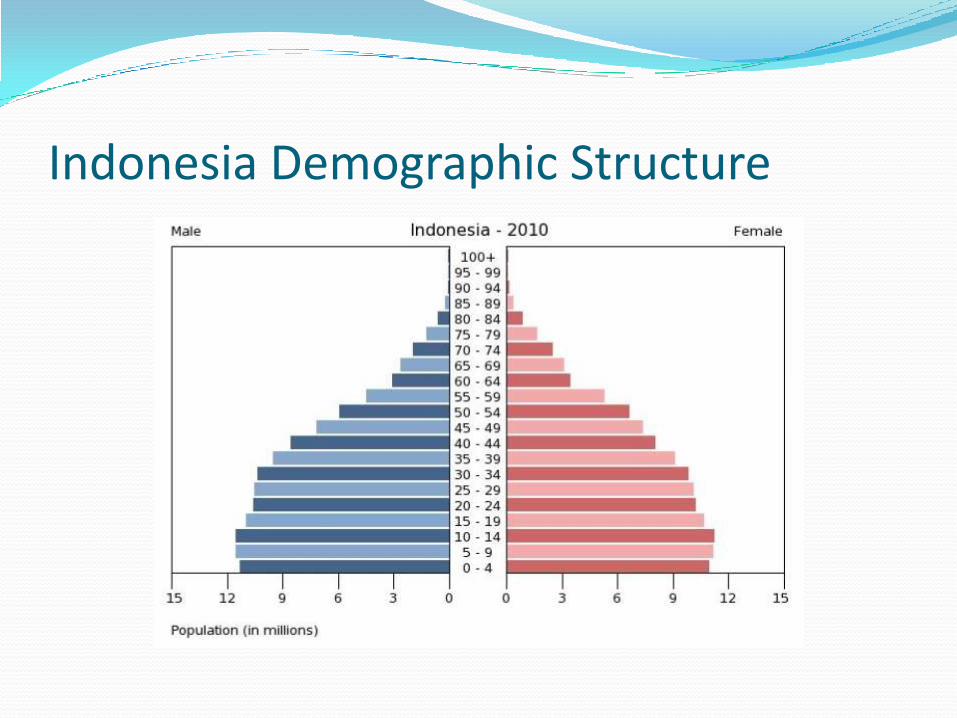
Indonesia Demographic Structure

Indonesia Demographic Bonus

Indonesia Stages of Development
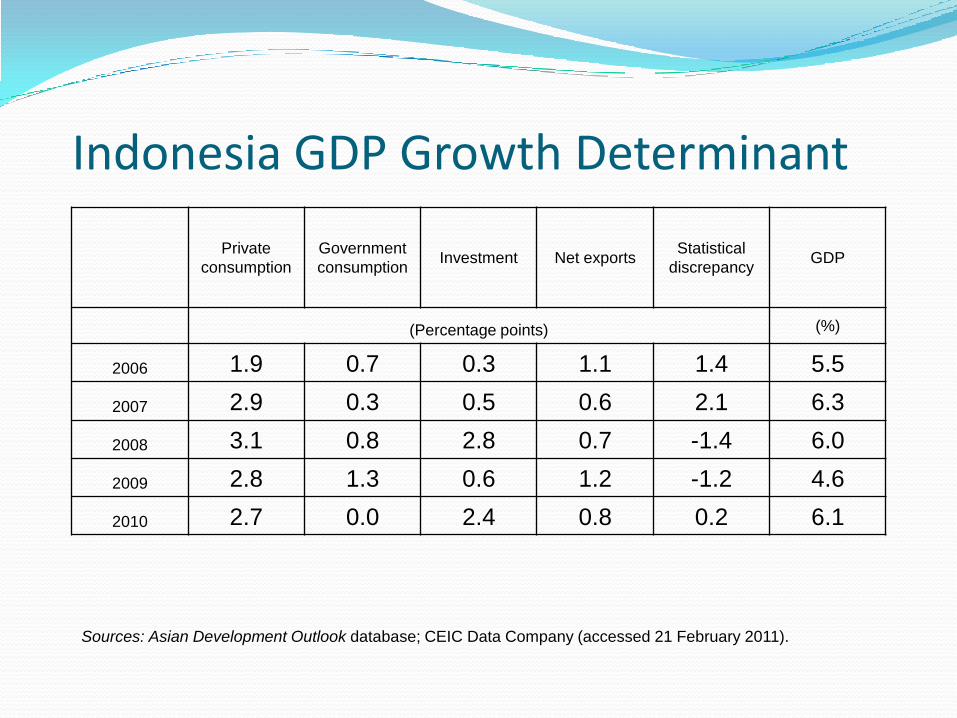
Indonesia GDP Growth Determinant
Private
consumption
Government
consumptionInvestment Net exports
Statistical
discrepancyGDP
(Percentage points) (%)
2006 1.9 0.7 0.3 1.1 1.4 5.5
2007 2.9 0.3 0.5 0.6 2.1 6.3
2008 3.1 0.8 2.8 0.7 -1.4 6.0
2009 2.8 1.3 0.6 1.2 -1.2 4.6
2010 2.7 0.0 2.4 0.8 0.2 6.1
Sources: Asian Development Outlook database; CEIC Data Company (accessed 21 February 2011).

Indonesia Currency Reserve

Accelerating Economic Growth Needs Increasing infrastructure and education spending.
Increasing access to financing
Banking and Multi Finance will benefit most.
Bigger network the better.
Increasing need for better life standard.
Food, beverage, housing, pharmaceutical, insurance, leisure will benefit most.
Increasing need for investing.

Risk For Not Investing Properly Central thesis.
Hidden Inflation.
Fast Money Supply Growth.
Wealth acquired growth lower than wealth destroyed growth.

Indonesia Hidden Inflation
Year GDP M2Expected
Inflation
Official
InflationDifferences
2007 6.30% 15.90% 9.60% 6.40% -3.20%
2008 6.00% 16.40% 10.40% 9.80% -0.60%
2009 4.60% 15.90% 11.30% 4.80% -6.50%
2010 6.10% 12.20% 6.10% 5.10% -1.00%
2011E 6.00% 17.50% 11.50% 6.90% -4.60%
Index Value 32.55% 106.13% 59.32% 37.56% -15.03%

Indonesia GDP Growth Pattern

Indonesia’s Hidden Quantitative Easing

Investment ThesisFor 2012 and Beyond Currency US$ relative to Rupiah.
Bank Indonesia Money Printing Press more active than Fed.
No US$ depreciation relative to Rupiah expected.
Bond Market.
Current yield very low.
Domestic investor perspective: Government Bond Overvalue.
Foreign investor perspective: Government Bond Undervalue.

Stock Investment Not For The Faint Hearted
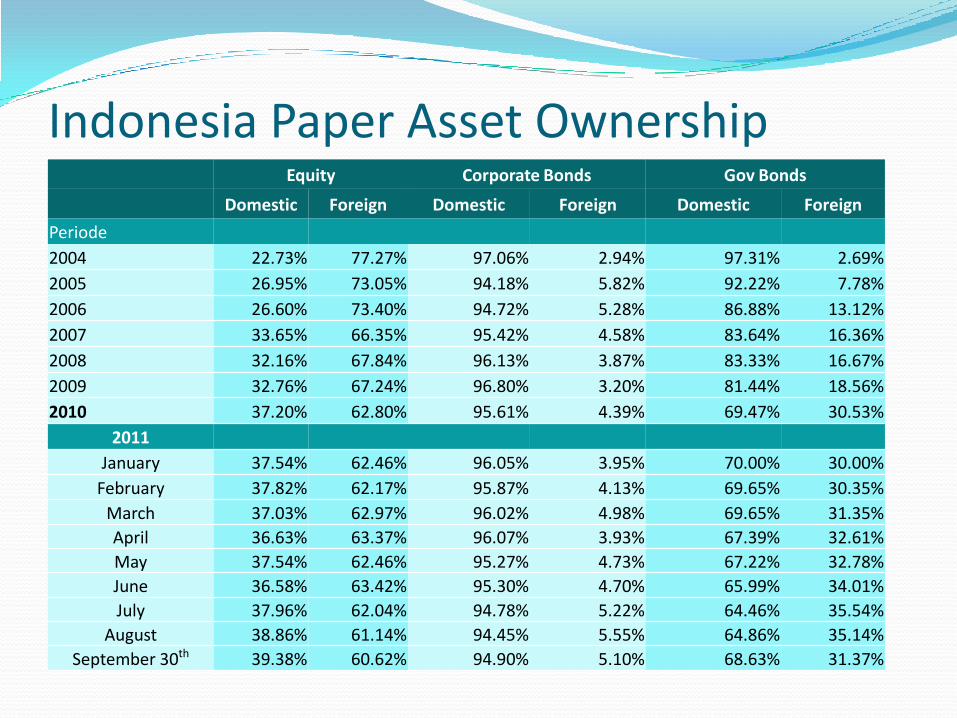
Indonesia Paper Asset OwnershipEquity Corporate Bonds Gov Bonds
Domestic Foreign Domestic Foreign Domestic Foreign
Periode
2004 22.73% 77.27% 97.06% 2.94% 97.31% 2.69%
2005 26.95% 73.05% 94.18% 5.82% 92.22% 7.78%
2006 26.60% 73.40% 94.72% 5.28% 86.88% 13.12%
2007 33.65% 66.35% 95.42% 4.58% 83.64% 16.36%
2008 32.16% 67.84% 96.13% 3.87% 83.33% 16.67%
2009 32.76% 67.24% 96.80% 3.20% 81.44% 18.56%
2010 37.20% 62.80% 95.61% 4.39% 69.47% 30.53%
2011
January 37.54% 62.46% 96.05% 3.95% 70.00% 30.00%
February 37.82% 62.17% 95.87% 4.13% 69.65% 30.35%
March 37.03% 62.97% 96.02% 4.98% 69.65% 31.35%
April 36.63% 63.37% 96.07% 3.93% 67.39% 32.61%
May 37.54% 62.46% 95.27% 4.73% 67.22% 32.78%
June 36.58% 63.42% 95.30% 4.70% 65.99% 34.01%
July 37.96% 62.04% 94.78% 5.22% 64.46% 35.54%
August 38.86% 61.14% 94.45% 5.55% 64.86% 35.14%
September 30th 39.38% 60.62% 94.90% 5.10% 68.63% 31.37%

Indonesia Price Earning Ratio History
SECTORALPRICE EARNING RATIO
Dec. 31st 2008 Dec. 31st 2009 Dec. 30th,2010 Sept 30th, 2011
JAKARTA AGRICULTURAL INDEX 4.64 37.10 25.28 10.37
JAKARTA MISCELLANEOUS INDUSTRIES INDEX 6.26 24.56 14.41* 14.59
JAKARTA MINING INDEX 5.18 21.88 42.17 14.62
JAKARTA BASIC IND & CHEMICAL INDEX 9.57 31.92 14.13 14.33
JAKARTA TRADE AND SERVICE INDEX 6.31 9.15 15.69 15.95
JAKARTA INFRA., UTIL., TRANSPORTATION 8.94 25.32 23.60 24.27
JAKARTA CONSUMER GOODS INDEX 11.87 19.00 23.02 20.87
JAKARTA CONSTRUCTION PROPERTY AND REAL ESTATE INDEX
12.74 21.66 22.16 17.01
JAKARTA FINANCE INDEX 10.86 20.36 17.69 12.70

Concluding Remarks Global Economic Condition Weak and may deteriorate further.
Money printing press may more active.
No genuine recovery until 2020.
Indonesia Economic Condition Infected but may recover faster.
May received money inflow larger than Indonesia asset and economic condition could absorb. Asset bubbles will emerge.
Stock investment, through mutual fund, offer good value compared to other instrument.
Disclaimer. Past performance is not a guarantee or a reliable indicator of future results. Equities may decline in value due to both real and perceived general market, economic,
and industry conditions. Investments in value securities involve the risk the market’s value assessment may differ from the manager and the performance of the securities may decline. There is no guarantee that these investment strategies will work under all market conditions and each investor should evaluate their ability to invest for a long-term especially during periods of downturn in the market.
This material contains the current opinions of the author but not necessarily those of PT Panin Sekuritas, Tbk. and such opinions are subject to change without notice. This material has been distributed for informational purposes only and should not be considered as investment advice or a recommendation of any particular security, strategy or investment product. Information contained herein has been obtained from sources (Bloomberg, Yahoo, and Asianbondsonline, etc.) believed to be reliable, but not guaranteed.
PT Panin Sekuritas, Tbk. May be involved in transactions contrary to any opinion herein to make markets, or have positions in the securities recommended herein. PT Panin Sekuritas, Tbk. may seek investment banking or other business relationships with the companies in this report.
For further information please contact +62 22 732 1434 or fax +62 22 732 1435.