investment breakfast - michelin · product launches driving volume and market share gains 10 paris...
TRANSCRIPT
Investment Breakfast
Bryan, Garnier & Co
Paris, November 22, 2017

November 22, 2017
Paris Investment Breakfast
Levers for Growth
Levers for Competitiveness
Ambition for Profitability
2017 in line with 2020 objectives
Paris - Bryan, Garnier & Co - November 22, 2017 2
1
2
3
4

November 22, 2017
Paris Investment Breakfast
1 Levers for Growth
Paris - Bryan, Garnier & Co - November 22, 2017 3

Four domains of growth
Paris - Bryan, Garnier & Co - November 22, 2017 4
by
EFFITIRE™
EverGripTM
MICHELIN Net promoter Score
2015-2020
ambition
Net sales
+20%
Net sales
x 2
Net sales
x 3
Capitalize on our
leadership
3D metal printer
Synthetic
rubbers
CUSTOMER – INNOVATION – GROWTH – COMPETITIVENESS
Tires Services Experiences Materials
Action plan
and first steps
Shorter
product time-to-market
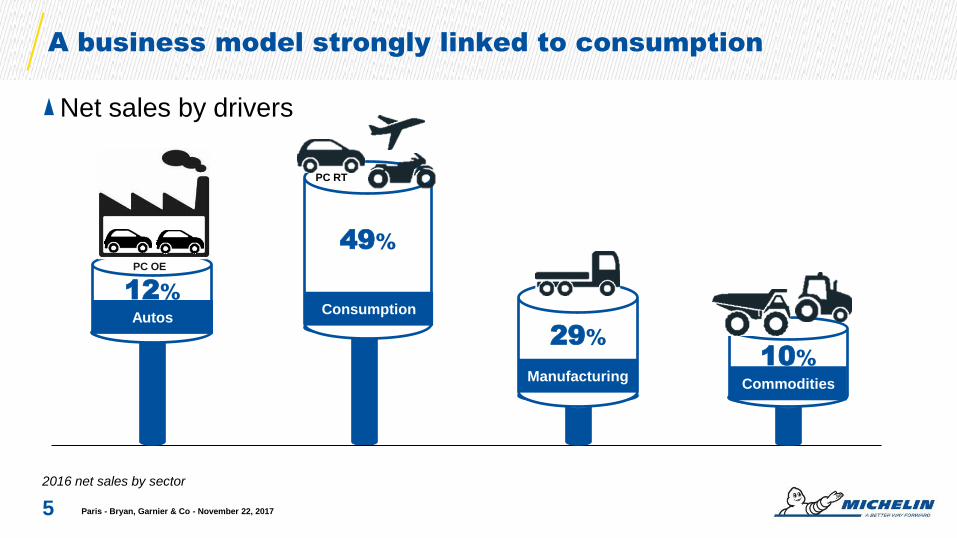
A business model strongly linked to consumption
2016 net sales by sector
49%
Consumption
Net sales by drivers
Autos
PC OE
12%
29%
Manufacturing 10%
Commodities
PC RT
5 Paris - Bryan, Garnier & Co - November 22, 2017
Paris - Bryan, Garnier & Co - November 22, 2017 6
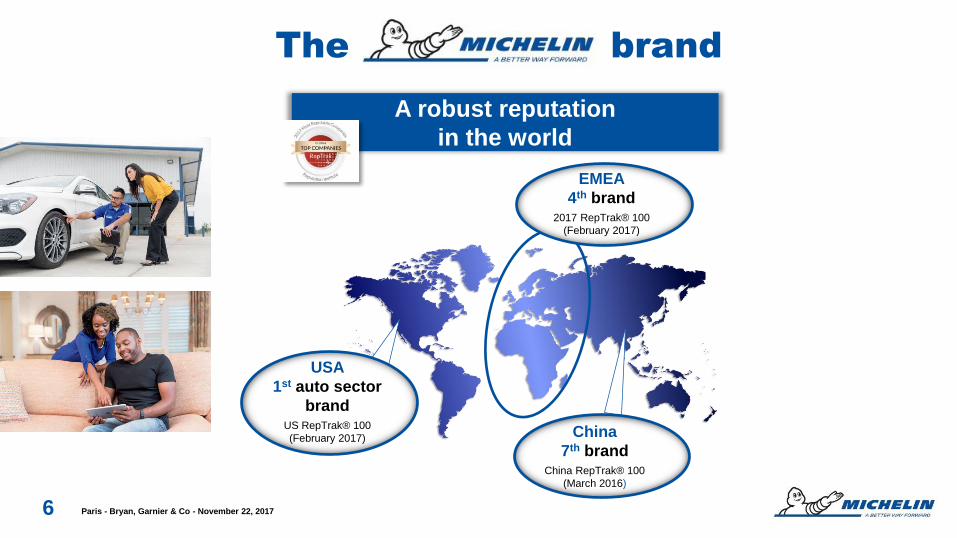
A robust reputation
in the world
The brand
USA
1st auto sector
brand US RepTrak® 100
(February 2017) China
7th brand China RepTrak® 100
(March 2016)
EMEA
4th brand 2017 RepTrak® 100
(February 2017)
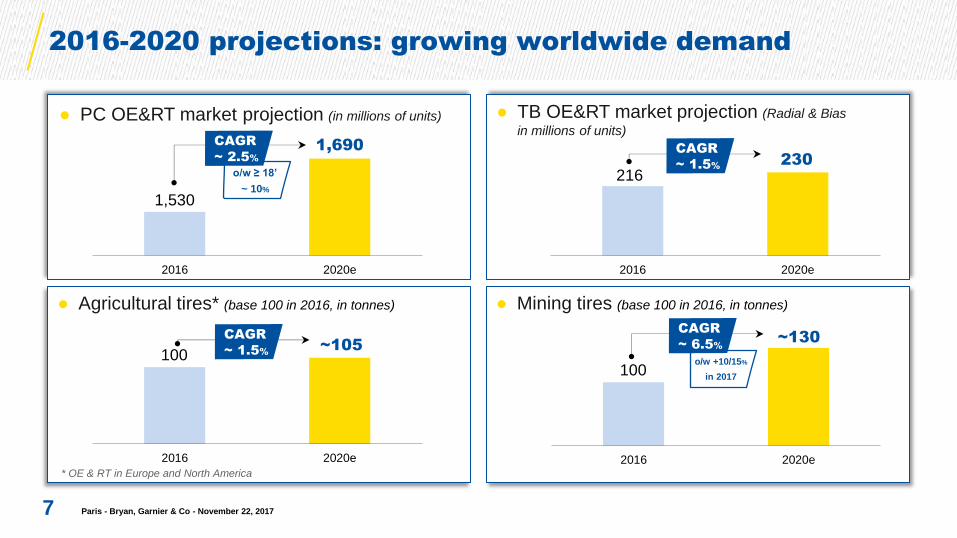
2016-2020 projections: growing worldwide demand
7
● TB OE&RT market projection (Radial & Bias
in millions of units)
● Agricultural tires* (base 100 in 2016, in tonnes) ● Mining tires (base 100 in 2016, in tonnes)
● PC OE&RT market projection (in millions of units)
1,530
1,690
2016 2020e
216 230
2016 2020e
CAGR
~ 1.5%
100 ~105
2016 2020e
CAGR
~ 1.5%
* OE & RT in Europe and North America
100
~130
2016 2020e
o/w ≥ 18’
~ 10%
CAGR
~ 2.5%
o/w +10/15% in 2017
CAGR
~ 6.5%
Paris - Bryan, Garnier & Co - November 22, 2017

≥ 18’’ tires : a successful Premium strategy delivering
continuous market share gains
Paris - Bryan, Garnier & Co - November 22, 2017
≥ 18” tire growth (YoY, markets in units and sales in kt)
8
WW Market
MICHELIN
+9%
+20%
+15% +17%
+13%
+21%
2015 2016 09’17 YTD
● Customers who value the MICHELIN brand and its product performance: a price premium of
around 10% compared to Premium competitors
● A force of innovation sought by premium manufacturers
● Continuous growth made possible by new industrial capabilities

Leading position at premium OEMs and prestige vehicles
Paris - Bryan, Garnier & Co - November 22, 2017 9
AMG Project One
Concept presented at the Frankfurt Motor Show
will be launched in 2019
Porsche GT2 RS beat the record of the German circuit of
the Nürburgring
These two vehicles are fitted with
FERRARI

Product launches driving volume and market share gains
Paris - Bryan, Garnier & Co - November 22, 2017 10
Passenger Car Truck Specialty
MICHELIN
X-One Urban Bus MICHELIN
X®Guard
MICHELIN
XWorks
MICHELIN
X Line Energy Z
MICHELIN
Power RS MICHELIN
XDR3
Convoy TripleA
MICHELIN Pilot
Sport 4 S
MICHELIN
CrossClimate +
MICHELIN
Premier LTX
2 tires in 1
technology
BFGoodrich All Terrain T/A K02
MICHELIN
Alpin 5

November 22, 2017
Paris Investment Breakfast
2 Levers for Competitiveness
Paris - Bryan, Garnier & Co - November 22, 2017 11

H1 2017 savings in line with 2017-2020
competitiveness plan
12 Paris - Bryan, Garnier & Co - November 22, 2017
H1 2017 2017-2020 plan
SG&A 64 500/550
Manufacturing
- Logistics 60 450/500
Materials 22 150/200
Total 146 ~1,200
In € millions

The reorganization project announced in June will enable
corporate positions to be reduced by 1,420 worldwide
A more agile, customer-focused Group capable of unleashing all its power
* Manufacture Française des Pneumatiques Michelin
13 Paris - Bryan, Garnier & Co - November 22, 2017
● Leverage the age pyramid:
─ 3,500 employees retiring in France
and the United States between 2018 and 2021
● Optimize hiring:
─ 2,080 new hires in France
and the United States between 2018 and 2021
● Age pyramid, Group and France*
25.2%
16.4%
Up to 24 years old
25-34 years old
35-44 years old
45-54 years old
Above 54 years old
Group France

Investing to create value
Paris - Bryan, Garnier & Co - November 22, 2017
Closing the gap between Capex
and depreciation:
(in € billions, at current exchange rates) ● In growing markets: Premium PC, North
America and Asia
● In the supply chain to improve customer
service (information systems, logistics)
● In digital services and distribution
● In raw materials and semi-finished
products
Successfully carry out our priority Capex
and M&A projects to drive expansion:
14
2016 2017e 2018e 2020e
1.8
1.4 1.4 1.5
1.5 to 1.7
Capex Depreciation
1.6 to 1.8
1.6
1.7 to 1.8

Optimizing Working Capital Requirements
Paris - Bryan, Garnier & Co - November 22, 2017 15
● Inventory:
─ At least a €250m reduction expected
from OPE by 2020 from 2016
● Receivables:
─ Benchmark position around 13% of net
sales
● Payables:
─ Further improvement through TOP
and reverse factoring
40.2 41.8
47.3 47.7
52.7
58.3
39
44
49
54
59
DPO rolling 12 month
November 22, 2017
Paris Investment Breakfast
3 Ambition for Profitability
Paris - Bryan, Garnier & Co - November 22, 2017 16

5.4%
10.9%
11.9%
12.2% 12.1% ≥ 15.0%
10.0%
15.8%
17.3% 17.6% 17.5%
≥ 21.7%
2009 2011 2013 2015 2016 2020target*
ROCE after tax
ROCE before tax
Deliver an after-tax ROCE* ≥ 15%
as from 2020 (in %)
2016 performance in line with 2020 objectives
Deliver structural FCF > €1,400m
as from 2020 (in € millions)
* At constant scope of consolidation excluding goodwill
17
517
749 833
961
2011 2013 2015 2016 2020target
> 1,400
Paris - Bryan, Garnier & Co - November 22, 2017
Price offsetting Raw
materials costs
2016 2020
2016-2020 organic scenario: profitability levers
* At 2016 exchange rates
18
Competitiveness
plan beating inflation:
+€200m
2,692
> 3,500*
PC&TB above-
market growth
Mining market
rebound
Profitable growth
from services &
solutions
Volume &
Mix
D&A Services
Paris - Bryan, Garnier & Co - November 22, 2017

November 22, 2017
Paris Investment Breakfast
4 2017 in line
with 2020 objectives
Paris - Bryan, Garnier & Co - November 22, 2017 19

Q3: cooling RT Passenger car and Truck tire markets;
robust Specialty and OE Truck tire markets
*Full-year market estimate
Paris - Bryan, Garnier & Co - November 22, 2017 20 20
Q3: ● Decline in mature regions as
dealers drew down excess
inventory. Growth in emerging
markets in line with previous
quarters
● Decrease in OE demand in North
America
Q3: ● Growth led by surging OE demand
notably in China and North America
(+23%)
● Cooling growth in the RT segment,
due to a slowdown in Europe (up
1.5%) and a contraction in China
and India
PASSENGER CAR – YTD: +3% SPECIALTIES: +8%/+10%*
Q1 2017
+5% +1%
Q2 2017
TRUCK – YTD: +4%
+1%
Q3 2017 Q1 2017
+8%
-1%
Q2 2017 +4%
Q3 2017
● Mining tires: +10%/+15%
● Agricultural tires: rebound in OE
demand starting in Q2, decrease
in RT sales following the Q1
spike in early buying
● Growth in demand in the other
businesses

9M 2017 net sales supported by growth in volumes and
price mix effect
Paris - Bryan, Garnier & Co - November 22, 2017
YoY change (in € millions and %)
* Levorin, NexTraq
21
15,471
16,394
+90
+424
+404 +5
9m 2016Net sales
9m 2017Net sales
Organic growth
Volumes
(+2.8%)
Price mix
(+2.6%)
o/w mix +0.8%
Currency effect
(+0.0%)
External growth
Scope effect*
(+0.6%)
+6.0%
Group growth
+3.4%

Improving price mix, despite a less favorable RT market
environment in Q3
Paris - Bryan, Garnier & Co - November 22, 2017
YoY quarterly change (in %)
22
-1.3
-2.7
-1.0
-1.9
-0.1
2.8
5.0
-1.9
-3.7
-1.3
-0.1
2.5
1.3
-3.7
Volumes Price mix Currency effect
3.7
1.4
-0.9
4.2
7.3
0.0
1.0
2016 2017
Q1 Q2 Q3 Q4 Q1 Q2 Q3
2016 2017
Q1 Q2 Q3 Q4 Q1 Q2 Q3
2016 2017
Q1 Q2 Q3 Q4 Q1 Q2 Q3
Q3 price effect: much faster improvement, as announced, led
by RT price increases and the application of indexation clauses
23 Paris - Bryan, Garnier & Co - November 22, 2017
-2.2 -2.9
-3.7
-2.2
-1.0
2.1
4.4
2013 2014 2015 2016 Q1 17 Q2 17
(in %)
Q3 17
4 3
0
5
8
-2
1
3
-1 -1
1 3
-3 -3
0
-3 -4
6
14
17
13
Dealer inventory back to normal, priority given to profitability
in Truck, strong growth in the Specialty businesses
YoY quarterly change in volume (in % & in tonnes)
* & related distribution
24
Passenger car tires* Truck tires* Specialty businesses
Paris - Bryan, Garnier & Co - November 22, 2017
2016 2017
Q1 Q2 Q3 Q4 Q1 Q2 Q3
2016 2017
Q1 Q2 Q3 Q1 Q2 Q3
2016 2017
Q1 Q2 Q3 Q4 Q1 Q2 Q3
+7/8%
9m 2017 Q4 2017e
~+3%
9m 2017 Q4 2017e
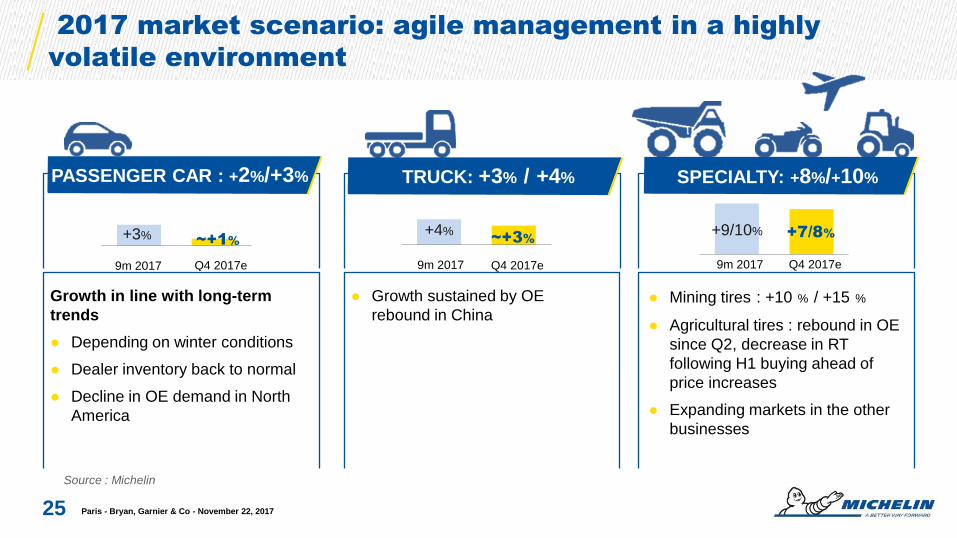
2017 market scenario: agile management in a highly
volatile environment
25
● Mining tires : +10 % / +15 %
● Agricultural tires : rebound in OE
since Q2, decrease in RT
following H1 buying ahead of
price increases
● Expanding markets in the other
businesses
Source : Michelin
PASSENGER CAR : +2%/+3%
9m 2017
+3% ~+1%
Q4 2017e
+4%
TRUCK: +3% / +4%
Paris - Bryan, Garnier & Co - November 22, 2017
+9/10%
Growth in line with long-term
trends
● Depending on winter conditions
● Dealer inventory back to normal
● Decline in OE demand in North
America
● Growth sustained by OE
rebound in China
SPECIALTY: +8%/+10%

2017 guidance confirmed: on the road to our 2020 objectives
Paris - Bryan, Garnier & Co - November 22, 2017
* Reported FCF adjusted for acquisitions and the impact of raw materials prices on trade receivables, trade payables and inventory, and
end-of-year volumes on WCR, and for 2017, the payment in January of the €193m capitalized interest on OCEANE bonds
26
2017
Volumes Growth in line
with the markets
Operating income from recurring activities
at constant exchange rates
Net price-mix/raw materials effect
> 2016
Non-indexed businesses: neutral
Structural FCF* > €900m

2017 scenario: agile management in a highly volatile
environment
Paris - Bryan, Garnier & Co - November 22, 2017 27
H1 2017 as reported H2 2017 2017
Impact of raw
materials costs -€331m Around €450m headwind Around €800m headwind
Currency effect +€37m Around €150m headwind Around €110-120m headwind*
Net price-mix/
raw materials effect
Indexed -€106m
Non-indexed: -€80m Positive
Indexed businesses: negative
Non-indexed: neutral
Competitiveness plan
gains vs. inflation +€4m Slightly positive Slightly positive
* Based on September rates
Impact on operating income from
recurring activities
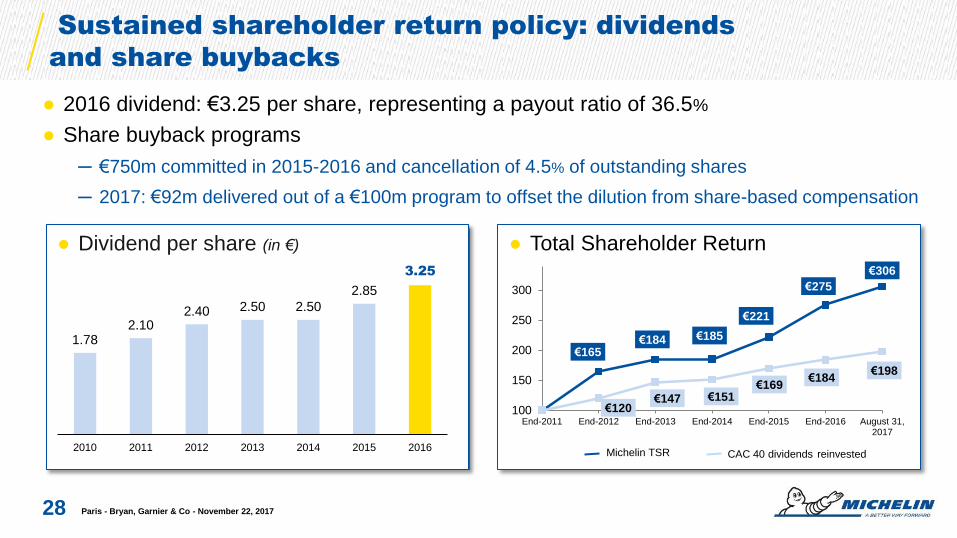
● 2016 dividend: €3.25 per share, representing a payout ratio of 36.5%
● Share buyback programs
─ €750m committed in 2015-2016 and cancellation of 4.5% of outstanding shares
─ 2017: €92m delivered out of a €100m program to offset the dilution from share-based compensation
Sustained shareholder return policy: dividends
and share buybacks
28
● Total Shareholder Return
Paris - Bryan, Garnier & Co - November 22, 2017
€165 €184 €185
€221
€275
€306
€120 €147 €151
€169 €184
€198
100
150
200
250
300
End-2011 End-2012 End-2013 End-2014 End-2015 End-2016 August 31,2017
● Dividend per share (in €)
1.78 2.10
2.40 2.50 2.50
2.85
3.25
2010 2011 2012 2013 2014 2015 2016Michelin TSR CAC 40 dividends reinvested
29 Paris - Bryan, Garnier & Co - November 22, 2017
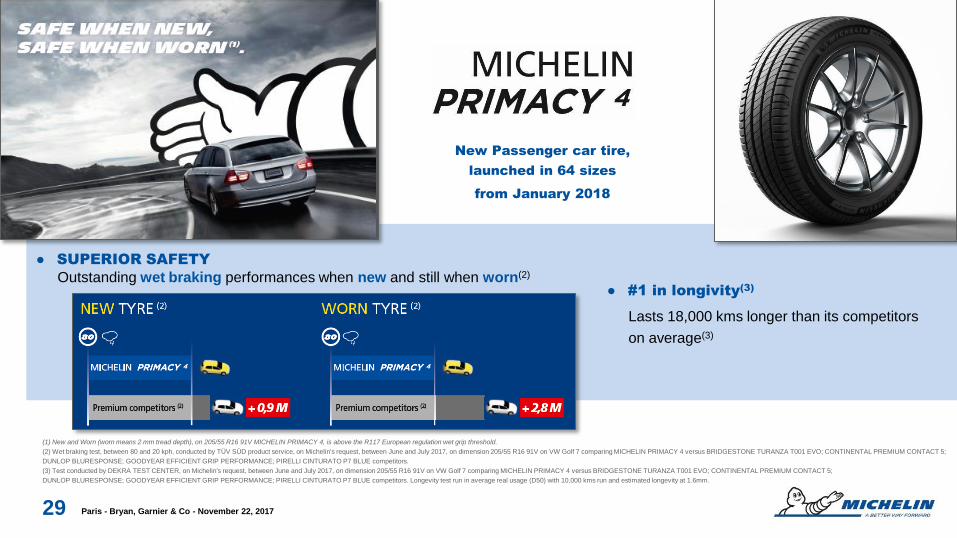
● SUPERIOR SAFETY
Outstanding wet braking performances when new and still when worn(2)
New Passenger car tire,
launched in 64 sizes
from January 2018
(1) New and Worn (worn means 2 mm tread depth), on 205/55 R16 91V MICHELIN PRIMACY 4, is above the R117 European regulation wet grip threshold.
(2) Wet braking test, between 80 and 20 kph, conducted by TÜV SÜD product service, on Michelin's request, between June and July 2017, on dimension 205/55 R16 91V on VW Golf 7 comparing MICHELIN PRIMACY 4 versus BRIDGESTONE TURANZA T001 EVO; CONTINENTAL PREMIUM CONTACT 5;
DUNLOP BLURESPONSE; GOODYEAR EFFICIENT GRIP PERFORMANCE; PIRELLI CINTURATO P7 BLUE competitors.
(3) Test conducted by DEKRA TEST CENTER, on Michelin's request, between June and July 2017, on dimension 205/55 R16 91V on VW Golf 7 comparing MICHELIN PRIMACY 4 versus BRIDGESTONE TURANZA T001 EVO; CONTINENTAL PREMIUM CONTACT 5;
DUNLOP BLURESPONSE; GOODYEAR EFFICIENT GRIP PERFORMANCE; PIRELLI CINTURATO P7 BLUE competitors. Longevity test run in average real usage (D50) with 10,000 kms run and estimated longevity at 1.6mm.
● #1 in longivity(3)
Lasts 18,000 kms longer than its competitors
on average(3)
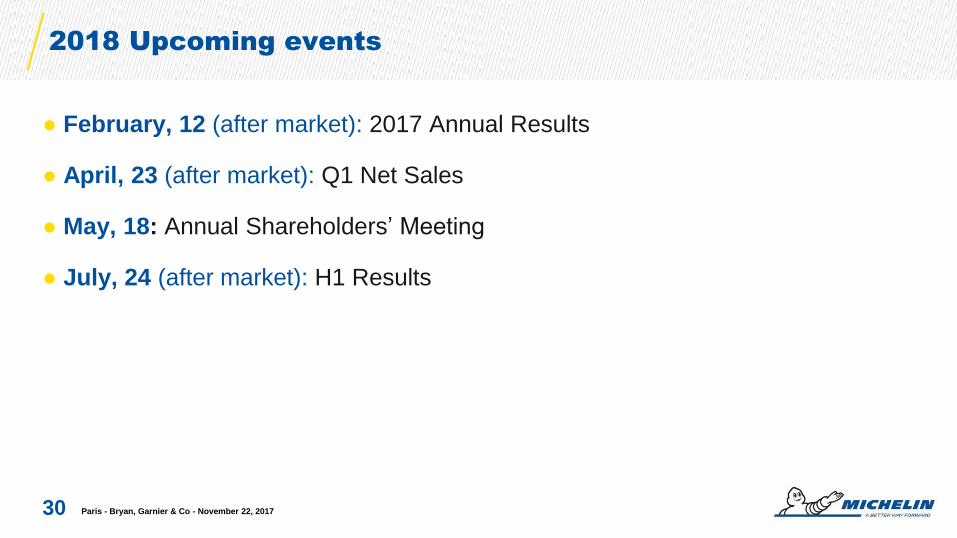
● February, 12 (after market): 2017 Annual Results
● April, 23 (after market): Q1 Net Sales
● May, 18: Annual Shareholders’ Meeting
● July, 24 (after market): H1 Results
2018 Upcoming events
30 Paris - Bryan, Garnier & Co - November 22, 2017

November 22, 2017
Paris Investment Breakfast
Appendices
Paris - Bryan, Garnier & Co - November 22, 2017 31
PC Tire Market: In October with one additional business day, OE markets well oriented,
except in North America; stable replacement markets in mature areas, well oriented in China and strong
rebound in Brazil.
32
* Turkey included
Paris - Bryan, Garnier & Co - November 22, 2017
October 2017/2016
% YoY change
in number of tires
Europe including
Russia & CIS*
Europe excluding
Russia & CIS* North America Brazil China
Original equipment +6% +5% -7% +6% +2%
Replacement +3% +2% +4% +28% +8%
YTD October 2017
% YoY change
in number of tires
Europe including
Russia & CIS*
Europe excluding
Russia & CIS* North America Brazil China
Original equipment +1% +1% -4% +19% +3%
Replacement +4% +1% +0% +16% +7%

TB Tire Market: In October with one additional business day and in a favorable economic context,
sustained growth in OE segment and in Brazil market and a slight slowdown in Europe Replacement demand.
33 Paris - Bryan, Garnier & Co - November 22, 2017
* Turkey included
October 2017/2016
% YoY change
in number of tires
(Radial + Bias)
Europe including
Russia & CIS*
Europe excluding
Russia & CIS* North America Brazil
Original equipment +15% +16% +14% +79%
Replacement +1% +2% +14% +31%
YTD October 2017
% YoY change
in number of tires
(Radial + Bias)
Europe including
Russia & CIS*
Europe excluding
Russia & CIS* North America Brazil
Original equipment +8% +7% +11% +17%
Replacement +6% +4% +5% +16%
Africa India
Middle East
-3% GLOBAL MARKET
PC: Growth in line with long-term trends. OE rebound in new markets.
Dealer inventory drawdown.
34
North America
Asia
(excluding India)
+2%
+8%
+3% +3%
OE RT
Passenger car market at September 30, 2017/2016 (YoY in %, in number of tires)
Europe incl. Russia & CIS
+3% +2%
Paris - Bryan, Garnier & Co - November 22, 2017
<=17’
>=18’
Europe excl. Russia & CIS
+1% +7 %
-3%
+3% +4%
-1%
+1%
+4%
+19%
South America
<=17’
>=18’
+10 %
-0 %
* Source: Michelin
Truck & Bus: Rebound in global market fueled by sharp OE
growth in China and North America
Paris - Bryan, Garnier & Co - November 22, 2017
Truck & Bus tire market at September 30, 2017/2016
(YoY in %, in number of new tires)
35
Europe excl. Russia & CIS North America
Africa India
Middle East
China
+3%
+10%
+1% +4%
Asia*
(excluding India)
+5% +8%
South
America
Europe incl. Russia & CIS
+6% +7%
+2% +12%
-3% -7%
+4% +2%
OE RT
+0%
+23%
* including China
Source: Michelin
GLOBAL MARKET

H1 2017: Net sales breakdown by currency and EBIT impact
* Actual dropthrough linked to the export/manufacturing/sales base
36
USD EUR
GBP
CNY
CAD BRL
AUD Other
TRY
THB RUB
MXN
JPY INR
PLN
TWD
% of net sales
9M17 / 9M16
YoY Currency
Change /€
Net sales to
EBIT
dropthrough*
AUD 1% +3% 80% - 85%
BRL 3% +10% -20% / - 30%
CAD 3% +1% 25% - 30%
CNY 5% -3% 25% - 30%
EUR 34% NA -
GBP 3% -9% 25% - 30%
INR 1% +3% 25% - 30%
JPY 1% -3% 80% - 85%
MXN 2% -3% 25% - 30%
PLN 1% +2% 25% - 30%
RUB 1% +15% 25% - 30%
THB 1% +3% -100% / -130%
TRY 1% -22% 80% - 85%
TWD 1% +6% 80% - 85%
USD 38% -0% 25% - 30%
Other 4% 80% - 85% Paris - Bryan, Garnier & Co - November 22, 2017

1,405 1,393
+139 -331
+145
+146 -142
-6 +37
H1 2016 H1 2017
YoY change in operating income from recurring activities (in € millions)
H1 2017 Operating income from recurring activities
of €1.4 billion, stable and in line with the Group’s roadmap
37
Volumes
+3.6% Currency
effect
Other Inflation
Competitiveness
Price mix
o/w mix:
+85
Raw
materials
+4 -186 o/w indexed
Businesses: -106
Paris - Bryan, Garnier & Co - November 22, 2017

9m 2017 9m 2016 % change
RS1 net sales 9,242 8,880 +4.1%
RS2 net sales 4,605 4,440 +3.7%
RS3 net sales 2,547 2,151
+18.4%
9M 2017 net sales growth driven by volumes and price
increases
Paris - Bryan, Garnier & Co - November 22, 2017 38
(in € millions)
Short term S&P
Moody’s
A-2
P-2
Long term S&P
Moody’s
A-
A3
Outlook S&P
Moody’s
Stable
Stable
A robust balance sheet after the share buybacks,
confirmed by the rating agencies
Gearing Net debt/equity, in %
Solid long-term ratings
Paris - Bryan, Garnier & Co - November 22, 2017 39
20 22
12
2
7
11 9
2010 2011 2012 2013 2014 2015 2016
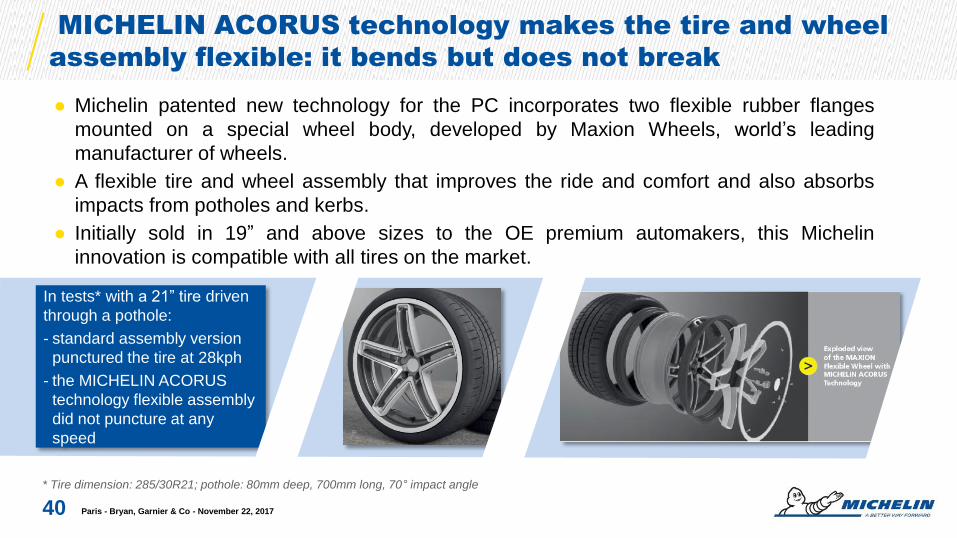
MICHELIN ACORUS technology makes the tire and wheel
assembly flexible: it bends but does not break
Paris - Bryan, Garnier & Co - November 22, 2017
* Tire dimension: 285/30R21; pothole: 80mm deep, 700mm long, 70° impact angle
40
● Michelin patented new technology for the PC incorporates two flexible rubber flanges
mounted on a special wheel body, developed by Maxion Wheels, world’s leading
manufacturer of wheels.
● A flexible tire and wheel assembly that improves the ride and comfort and also absorbs
impacts from potholes and kerbs.
● Initially sold in 19” and above sizes to the OE premium automakers, this Michelin
innovation is compatible with all tires on the market.
Connected tire
In tests* with a 21” tire driven
through a pothole:
- standard assembly version
punctured the tire at 28kph
- the MICHELIN ACORUS
technology flexible assembly
did not puncture at any
speed

Acquisition of NexTraq, a US industry leader in the field of
commercial-fleet telematics
41
● Leader in SaaS fleet management for small-to
medium-size businesses (Class 3-5 fleets ranging
from 2 to 50 vehicles)
● NexTraq helps customers with driver behavior,
scheduling, route optimization, vehicle trip history,
fuel card integration, vehicle maintenance, and
data integration enhancing fleet productivity
● Significant synergies expected with the Michelin
Group through:
─ Service and solutions platform in North America
─ Technology expertise cross-fertilization between
Sascar, Michelin solutions and NexTraq
─ Volume growth thanks to the strategic fit between
Michelin and NexTraq customer bases;
• Turnover: ~$50m
• EBITDA: ~50%
• 110,000 subscribers in 2016
(67,000 in 2010)
• 100 employees
Paris - Bryan, Garnier & Co - November 22, 2017
KEY FIGURES
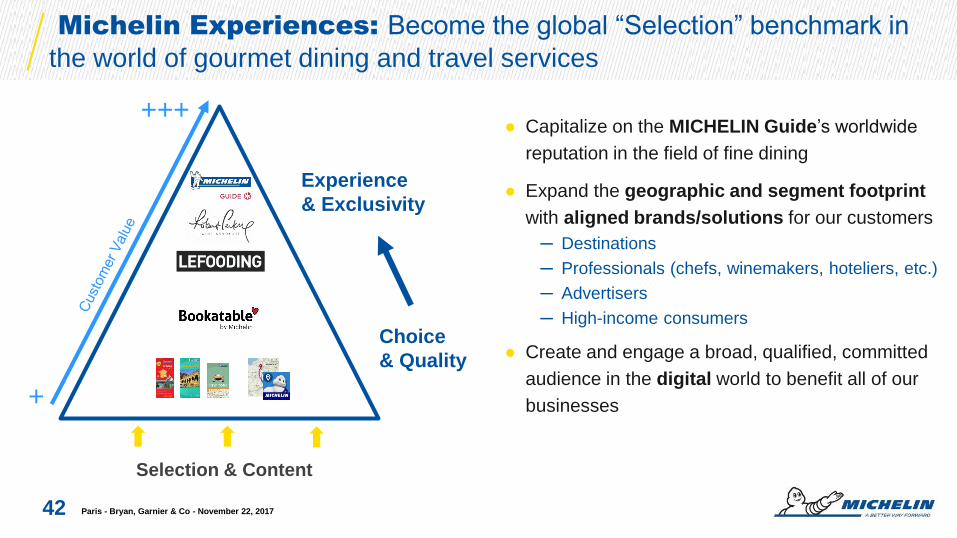
Michelin Experiences: Become the global “Selection” benchmark in
the world of gourmet dining and travel services
Paris - Bryan, Garnier & Co - November 22, 2017 42
● Capitalize on the MICHELIN Guide’s worldwide
reputation in the field of fine dining
● Expand the geographic and segment footprint
with aligned brands/solutions for our customers
─ Destinations
─ Professionals (chefs, winemakers, hoteliers, etc.)
─ Advertisers
─ High-income consumers
● Create and engage a broad, qualified, committed
audience in the digital world to benefit all of our
businesses
Selection & Content
+
+++
Experience
& Exclusivity
Choice
& Quality
0
50
100
150
0
100
200
300
400
100
150
200
250
300
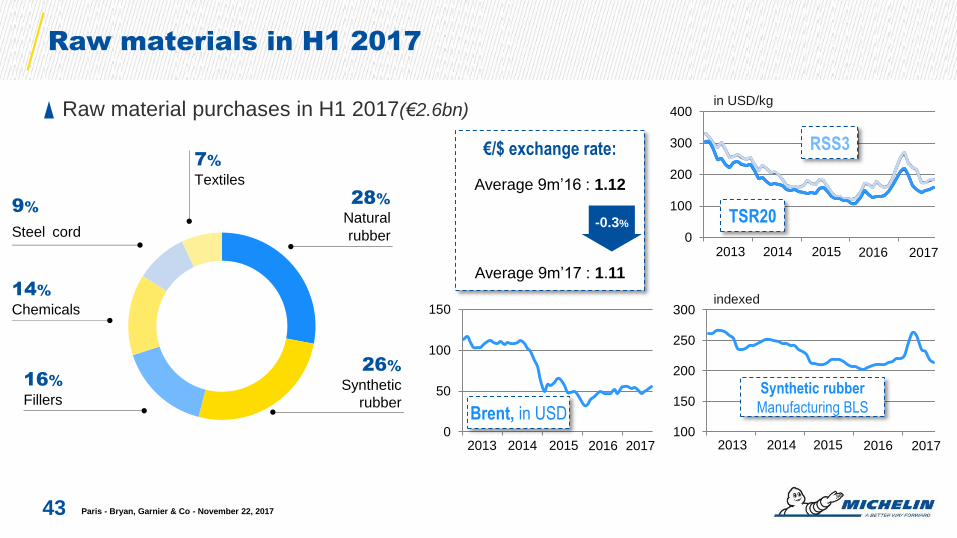
Raw materials in H1 2017
Raw material purchases in H1 2017(€2.6bn)
43
28%
Natural
rubber
26%
Synthetic
rubber
16%
Fillers
14%
Chemicals
9%
Steel cord
7%
Textiles
€/$ exchange rate:
Average 9m’16 : 1.12
Average 9m’17 : 1.11
-0.3%
RSS3
TSR20
in USD/kg
indexed
2013 2014 2015 2016 2017
Paris - Bryan, Garnier & Co - November 22, 2017
2013 2014 2015 2016 2017
2013 2014 2015 2016 2017
Synthetic rubber
Manufacturing BLS Brent, in USD
0,0
20,0
40,0
60,0
80,0
100,0
120,0
140,0
160,0
180,0
200,0
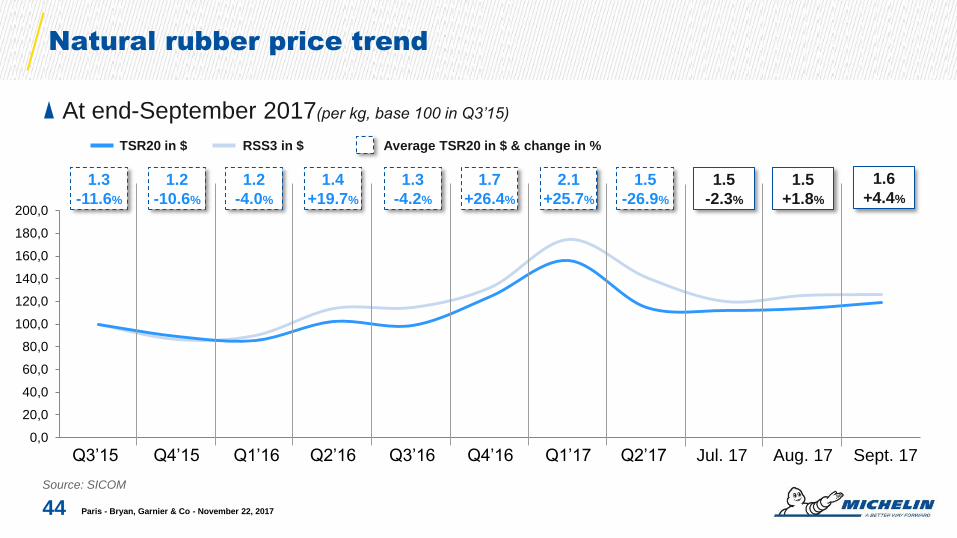
Natural rubber price trend
At end-September 2017(per kg, base 100 in Q3’15)
Source: SICOM
44
Average TSR20 in $ & change in % TSR20 in $ RSS3 in $
Paris - Bryan, Garnier & Co - November 22, 2017
Q3’15 Q4’15 Q1’16 Q2’16 Q3’16 Q4’16 Q1’17 Q2’17 Jul. 17 Sept. 17 Aug. 17
1.3
-11.6%
1.2
-10.6%
1.2
-4.0%
1.4
+19.7%
1.3
-4.2%
1.7
+26.4%
1.5
-26.9%
2.1
+25.7%
1.5
-2.3%
1.5
+1.8%
1.6
+4.4%

Brent price trend
At end-September 2017(per barrel, base 100 in Q3’15)
45
Brent in $ Average Brent in $ & change in %
Paris - Bryan, Garnier & Co - November 22, 2017
20
30
40
50
60
70
80
90
100
110
120
49
-3.7%
52
+5.5%
51
-19.3%
45
-12.4%
35
-21.7%
47
+33.2%
47
+0.3%
51
+8.8%
55
+7.2%
51
-7.0%
55
+6.9%
Q3’15 Q4’15 Q1’16 Q2’16 Q3’16 Q4’16 Q1’17 Q2’17 Jul. 17 Sept. 17 Aug. 17

Butadiene price trend
At end-September 2017(per tonne, base 100 in Q3’15)
Source: IHS
46
Average Butadiene in € & change in % Butadiene Europe
Paris - Bryan, Garnier & Co - November 22, 2017
50
70
90
110
130
150
170
190
210
230
Aug. 17
745
+16%
628
-16%
515
-18%
618
+20%
670
+8%
773
+15%
1,500
+10%
1,363
+76%
825
-45%
750
-9%
775
+3%
Q3’15 Q4’15 Q1’16 Q2’16 Q3’16 Q4’16 Q1’17 Q2’17 Jul. 17 Sept. 17

1,645
920 862
1,695 1,945
2,423 2,234 2,170 2,577 2,692
1,405 1,393
9.8%
5.6% 5.8%
9.5% 9.4%
11.3% 11.0%
11.1% 12.2% 12.9%
13.7% 12.6%
9.7% 5.6%
5.4%
10.5% 10.9%
12.8% 11.9%
11.1% 12.2%
12.1%
0%
2%
4%
6%
8%
10%
12%
14%
16%
0
500
1000
1500
2000
2500
3000
2007 2008 2009 2010 2011 2012 2013 2014 2015 2016 H1 2016 H1 2017
Operating profit (in €m) Operating margin (as a % of net sales) ROCE after tax (in %)
2016: a year of progress, in line with our 2020 roadmap
Paris - Bryan, Garnier & Co - November 22, 2017
Group operating income and margin* & ROCE
* On recurring activities.
47
3,000
2,500
2,000
1,500
1,000
500
0

PC margins led by product innovation, contribution from the 18“ and
above strategy, better customer service
RS1 operating income and margin* (in € millions and %)
* On recurring activities.
** At constant scope of consolidation and raw materials prices, and with markets expanding at a 2.5% CAGR
Paris - Bryan, Garnier & Co - November 22, 2017 48
830 370 661
1,014 1,018 1,033 1,090 1,010
1,384 1,585
814 800
9.2%
4.3%
8.0%
10.4% 9.4% 9.3%
10.2% 10.5% 11.5%
13.1% 13.8%
12.8%
0
200
400
600
800
1 000
1 200
1 400
1 600
1 800
2007 2008 2009 2010 2011 2012 2013 2014 2015 2016 H12016
H12017
Operating profit (in €m) Operating margin (as a % of net sales)
1,800
1,600
1,400
1,200
1,000 11%
Target for 2016-2020**
15%
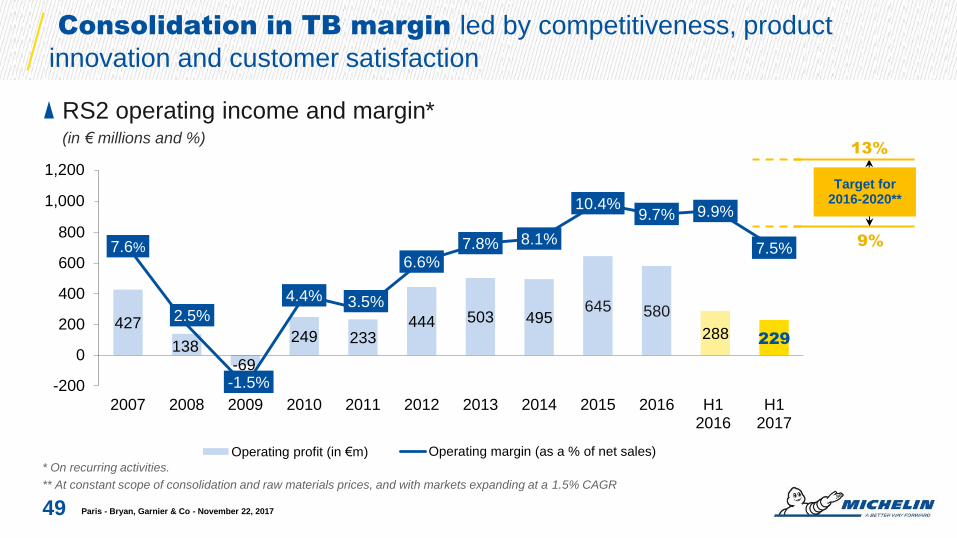
Consolidation in TB margin led by competitiveness, product
innovation and customer satisfaction
* On recurring activities.
** At constant scope of consolidation and raw materials prices, and with markets expanding at a 1.5% CAGR
Paris - Bryan, Garnier & Co - November 22, 2017 49
RS2 operating income and margin* (in € millions and %)
427
138 -69
249 233 444 503 495
645 580
288 229
7.6%
2.5%
-1.5%
4.4% 3.5%
6.6% 7.8% 8.1%
10.4% 9.7% 9.9%
7.5%
-200
0
200
400
600
800
1 000
1 200
2007 2008 2009 2010 2011 2012 2013 2014 2015 2016 H12016
H12017
Operating profit (in €m) Operating margin (as a % of net sales)
13%
9%
Target for 2016-2020**
1,200
1,000

Specialty businesses: solid margin despite raw material headwind
* On recurring activities.
** At constant scope of consolidation and raw materials prices, and with markets expanding
Paris - Bryan, Garnier & Co - November 22, 2017 50
RS3 operating income and margin* (in € millions and %)
388 412
270
432
694
946
645 574 548 527
303 364
17.8% 17.9%
13.3%
17.8%
21.5%
26.0%
20.6% 19.3%
18.6% 18.6%
20.6% 20.8%
0
100
200
300
400
500
600
700
800
900
2007 2008 2009 2010 2011 2012 2013 2014 2015 2016 H12016
H12017
Operating profit (in €m) Operating margin (as a % of net sales)
24%
17%
Target for 2016-2020**
"This presentation is not an offer to purchase or a solicitation to recommend the purchase
of Michelin shares. To obtain more detailed information on Michelin, please consult the
documentation published in France by Autorité des Marchés Financiers available from the
http://www.michelin.com/eng/ website.
This presentation may contain a number of forward-looking statements. Although the
Company believes that these statements are based on reasonable assumptions at the time
of the publication of this document, they are by nature subject to risks and contingencies
liable to translate into a difference between actual data and the forecasts made or induced
by these statements."
Disclaimer
Paris - Bryan, Garnier & Co - November 22, 2017 51

Contacts
Paris - Bryan, Garnier & Co - November 22, 2017 52
Valérie MAGLOIRE
Matthieu DEWAVRIN
Humbert de FEYDEAU
+33 (0)4 15 39 84 68
27, cours de l’île Seguin
92100 Boulogne-Billancourt - France