bryan garnier - 02.07.2008 - pierrel
TRANSCRIPT

Healthcare
Please see the section headed “Important information” on the back cover.
CORPORATE RESEARCH Pierrel Stepping Up The Pace
1st July 2008 Fair Value €92.8m Current market cap: €72.9m
ITALY - Expandi Luke Poloniecki Equity Analyst +33 (0)1 56 68 75 49 [email protected]
Caroline Lacroux Equity Analyst [email protected] +33 (0)1 56 68 75 89
Bloomberg PRL IMReuters PRL.MI52 week High / Low (€) 10.8 / 6.6Market Cap (€m) 72.9EV (BGe) (€m) 105Volume 6m Avge (in shares) 7,628Free float (June 2008) 32.5%EPS growth 09-11e (CAGR) 42.2%Gearing (2007 pro forma) 119.8%Dividend yield (2007 pro forma) None
YE: 31 Dec 2008e 2009e 2010e 2011e Sales (€m) 49.4 65.2 73.9 82.4 % change yoy 22.7% 32.0% 13.4% 11.6% EBITDA (€m) 1.8 9.6 13.0 16.2 EBIT (€m) (0.2) 7.7 11.1 14.3 EBIT margin, % nm 11.8% 15.0% 17.3% EPS (€) (0.1) 0.4 0.7 0.9 EV / Sales 2.1x 1.6x 1.4x 1.3x EV / EBIT na 13.7x 9.5x 7.4x PE (x) na 16.0x 10.6x 7.9x
Pierrel is a European leader in Pharmaceutical Outsourcing, offering Contract Research (CRO) and Contract Manufacturing (CMO) for the development and production of existing and nascent therapeutics. Three recent CRO acquisitions bolted onto an established CMO platform, have given Pierrel the critical mass and full-service offering necessary to open up the lucrative, and less competitive mid-Pharma market.
High earnings visibility: With its unique, integrated services offering, the group’s capabilities encompass early clinical development through to large-scale production, rendering it highly appealing to mid-size drug developers seeking the outsourcing route. Long-term contracts with high renewal rates, lower overall risks, and give great visibility over revenue streams.
Competitive advantage: Proven expertise in both CRO and CMO holds Pierrel in good stead. With 50 years of CMO manufacturing experience and a truly Pan-European CRO network - across 14 countries - Pierrel has significant competitive advantages.
Strong sector growth: Global CMO and CRO markets are set to enjoy 9.2% and 7.0% CAGRs 2006-2011e: Pharmas are increasingly turning to outsourcing, to focus on core areas of R&D and marketing.
Solid organic and external growth drivers: Experienced management team has a proven track record in M&A, both in target selection and deal execution.
Low risk profile: CRO activities are already profitable, with profitability at group level expected in FY 2008. Pierrel enjoys a backlog of almost €44m (December 2007). Exciting opportunities in the growing Generics market should also see Pierrel opening doors mid-term.
Plentiful newsflow. Forthcoming catalysts include an acquisition by year-end/1H09, and FDA approval of the Capua plant (mid 2009) opening up the all-important US market.
27% upside potential: Our SOTP DCF methodology derives a Fair Value of €92.8m.
4
5
6
7
8
9
10
11
12
May-06 Jul-06 Oct-06 Dec-06 Feb-07 May-07 Jul-07 Sep-07 Nov-07 Feb-08 Apr-08 Jun-08
Pierrel CAC Mid & Small 190 (rebased) Expandi (rebased)

Pierrel
2
Please see the section headed “Important information” on the back cover.
2006 2007C 2007PF 2008e 2009e 2010e 2011e Growth Credentials Sales growth, % 344.6% 90.9% 198.2% 22.7% 32.0% 13.4% 11.6% EBITDA margin, % nm nm nm 3.6% 14.7% 17.5% 19.6% EBIT margin, % nm nm nm nm 11.8% 15.0% 17.3% EPS growth (diluted), % nm nm nm nm nm 51.6% 33.5% Income statement (key data) Total revenues 13.5 25.8 40.2 49.4 65.2 73.9 82.4 ...of which CMO 10.2 9.3 9.3 12.5 25.1 30.5 35.6 ...of which CRO 3.3 15.8 30.3 35.7 38.6 41.6 45.0 Gross profit 13.5 25.8 2.7 5.7 13.6 17.2 20.5 Operating expenses (14.7) (29.5) (42.2) (47.6) (55.6) (60.9) (66.2) EBITDA (1.2) (3.8) (2.0) 1.8 9.6 13.0 16.2 Depreciation & Amortisation (0.6) (1.4) (1.8) (2.0) (1.9) (1.9) (1.9) EBIT (1.8) (5.1) (3.8) (0.2) 7.7 11.1 14.3 PBT (Profit before income tax) (2.3) (5.6) (5.0) (1.1) 6.8 10.3 13.7 Net profit (loss) (1.9) (4.6) (4.4) (0.7) 4.5 6.9 9.2 Diluted Earnings per share (€) (0.2) (0.5) (0.4) (0.1) 0.4 0.7 0.9 Cash Flow (+) Depreciation 0.1 1.0 1.4 1.1 1.1 1.1 1.1 (+) Amortisation 0.5 0.4 0.4 0.9 0.9 0.8 0.8 (+) Decrease (increase) in working capital requirement (WCR) 0.0 (0.7) (2.3) (3.1) (1.6) 0.6 1.3 Net cash from operating activities (4.1) (5.0) (5.0) (1.8) 4.9 9.4 12.4 (-) Capex (4.8) (6.1) (14.4) (2.2) (1.8) (1.8) (1.8) (-) Acquisitions of subsidiaries, net of cash acquired - (12.1) (11.2) - - - - Net cash used in investing activities (5.4) (14.4) (21.8) (1.2) (1.8) (1.8) (1.8) (+) Increase (decrease) in new financing 2.6 8.5 14.0 - - - - (-) Repayment of financing (0.3) (3.8) (3.8) (0.4) (1.3) (1.8) (1.8) Net cash used in financing activities 23.6 10.4 15.9 (0.4) (1.3) (1.8) (1.8) Net change in cash and cash equivalents 14.0 (9.0) (10.8) (3.5) 1.8 5.8 8.9 Cash flow per share 1.7 (0.9) (1.1) (0.3) 0.2 0.6 0.9 Balance Sheet Tangible assets 24.1 22.0 22.1 21.3 21.3 21.2 21.2 Intangible assets 2.2 15.6 23.6 23.7 23.5 23.4 23.4 Total non-current assets 29.0 41.5 49.6 48.8 48.6 48.5 48.4 Inventories of finished goods and work in progress 3.6 3.0 4.9 6.0 6.2 6.1 5.6 Trade receivables 2.3 7.3 11.3 13.8 16.1 16.2 15.8 Cash and cash equivalents 16.8 7.8 5.9 2.4 4.2 10.1 18.9 Total assets 54.3 67.3 79.3 80.4 87.6 94.9 104.5 Total equity 26.6 24.5 24.5 23.8 28.3 35.2 44.4 Total non-current liabilities 16.6 17.6 22.9 22.4 21.1 19.4 17.6 Trade payables 4.5 6.1 10.2 12.5 16.5 18.7 20.8 S/T Financial liabilities 4.1 13.7 15.4 15.4 15.4 15.4 15.4 Total current liabilities 11.1 25.1 31.9 34.2 38.2 40.4 42.5 Total equity and liabilities 54.3 67.3 79.3 80.4 87.6 94.9 104.5 Ratios ROCE -5% -13% -10% -2% 14% 19% 22% ROE -7% -19% -18% -3% 16% 20% 21% ROA -3% -8% -5% 0% 9% 12% 14% Net gearing 8% 86% 120% 136% 103% 61% 25% EV/Sales 7.8x 4.1x 2.6x 2.1x 1.6x 1.4x 1.3x CapEx/depreciation 8.3x 4.4x 8.0x 1.1x 0.9x 0.9x 0.9x P/BV 0.3x 0.8x 7.6x 61.1x 1.5x 0.6x 0.3x EV / EBIT na na na na 13.7x 9.5x 7.4x PE na na na na 16.0x 10.6x 7.9x
Source: Bryan, Garnier & Co ests
Sales growth / EBIT margin
1.0%
6.0%
11.0%
16.0%
21.0%
26.0%
31.0%
2008e 2009e 2010e 2011e0.0%
5.0%
10.0%
15.0%
20.0%
Sales growth, % EBIT margin, %
FREE CAS H FLOW ( €m) / EBI TDA ma r gi n ( %)
(10.0)
(5.0)
-
5.0
10.0
15.0
2007C 2008e 2009e 2010e 2011e
-10%
-5%
0%
5%
10%
15%
20%
Free cash-f lowsEBITDA margin, %
Company description Headquartered in Italy, but with a pan-European presence, Pierrel is a service provider to the pharmaceutical industry for the development, manufacture and commercialisation of medical therapies. The company has over 50 years’ experience, gained initially in the production of active ingredients, and later by specialising in Contract Manufacturing (CMO) and Contract Research (CRO). Aside from the two principal CMO & CRO business units, Pierrel also retains Other Activities in dental hygiene: Pierrel Dental (100% ownership) and Pierrel Nature Concept (50% ownership). Pierrel was floated on the Milan Stock Exchange in May 2006, and raised a total of €24m in equity funding. The company is 37% management owned.

Pierrel
3
Please see the section headed “Important information” on the back cover.
1. Investment summary The only European “one-stop-shop” with an attractive competitive advantage Pierrel offers differentiation, combining a full range of CMO & CRO services: from early clinical development through to large scale production. The group is in a position of strength, operating in markets with high barriers to entry, given the considerable expertise and technical know-how required.
Pierrel is the only listed European company offering both CMO & CRO services, and as such is able to leverage commercial synergies from the integration of these two businesses. The company is in the process of upgrading both its offer and profitability from transaction-based services, to much more value-added partnerships, targetting mid-sized pharmas. Pierrel is ideally positioned to reap the benefits of new growth opportunities, such as the generic drug outsourcing market.
Capitalising on proven track-records in both CRO and CMO Pierrel has over 50 years of expertise in the CMO business, with a proven capacity and expertise in dental anaesthetics manufacturing, as demonstrated by the partnership with Dentsply, the leading global supplier of dental products and instruments. The company also has a 16-year history in the CRO business, and a Pan-European network in 14 European countries lending considerable competitive advantage. Strong sector growth Pharmaceutical companies are increasingly turning to outsourcing to concentrate on core functions: mainly R&D and commercialisation, in turn driving strong sector growth. The reference market in CMO is expected to grow 9.2% annually over 2006-2011e, and 7.0% in CRO.
Highly fragmented sector offers many M&A opportunities upon which to leverage. Pierrel has so far demonstrated excellence in M&A, both in target selection and deal execution at attractive prices (5-7.5x EV/EBITDA). We are confident in management’s ability to execute an attractive CMO acquisition in 2H08/1H09, extending its technical capabilities and capacity.
Strong visibility on sales & profitability combined with expanding margins With a backlog of almost € 44 m as of December 2007, and the Dentsply supply contract for the US Dental Anaesthetics market, we predict a sales CAGR of 18.6% 2008-11. The CRO business is already EBIT positive, and the overall group is expected to be EBITDA positive in 2008. Therefore, we model EBIT margins for Pierrel expanding to 17.3% in 2011 from 11.8% in 2009. Attractive valuation Pierrel trades on an estimated 2010 PE of 10.6x. Our €92.8m Fair Value is derived from a SOTP valuation, based on a DCF methodology. We value CMO, CRO and Other Activities via three separate DCFs. In all cases we apply a terminal growth rate of 2%, and a conservative WACC of 9.7%, based on a beta of 1.67.

Pierrel
4
Please see the section headed “Important information” on the back cover.
2. Company profile
Activities are split as follows:
- CMO: Pierrel is an acknowledged leader in injectable products, specialising in cartridges for dental anaesthetics.
- CRO: the group made its entry with the acquisition of 51% of Pharmapart AG (a leading Swiss CRO with more than 14 years of experience in clinical services) in 2005.
Other Activities: consist of :
1). Pierrel Dental a joint venture with 2 industrial partners, active in the marketing of dental and oral hygiene products.
2). Pierrel Nature Concept, producing organic cosmetics and homeopathic remedies.
CEO, Canio Mazzaro, headed the group since its origins as a local CMO provider, to its emergence as the only listed European player offering both CRO and CMO outsourcing services. Following four acquisitions in the CRO field since 2005, and a clear strategy intent on pursuing the integration of CMO and CRO activities, Pierrel today represents a global outsourcing partner of choice for the mid-sized pharmaceutical firms.
Earnings visibility is strong, especially since the recently signed CMO contract with Dentsply. This supply contract sees Pierrel exclusively supplying all the dental anaesthetics sold by Dentsply globally (with the exception of Latin America & Japan). The 15-year life of the contract, not only affords management high visibility on sales, but achieves a dramatic increase in its size and the ability to generate significant economies of scale going forward.
We predict Pierrel will generate sales in excess of €65m in 2009, enjoying a revenues CAGR of 18.6% over 2008-11e, with an EBITDA margin expected to attain 19.6% in 2011 vs. 3.6% in 2008.
Pierrel was listed in May 2006 on the Expandi segment of the Milan Stock Exchange, in an IPO which raised net proceeds of €24m. The share capital is backed by a solid base of management (36.6%) and industrial players (20.4%). The free float is 32.5%.

Pierrel
5
Please see the section headed “Important information” on the back cover.
2.1. History Pierrel was an active pharmaceutical industry player since 1948 - initially as a chemical trading company, and then from 1958, as a producer of pharmaceutical active ingredients. The company was first listed on the Milan Stock Exchange in 1968, and later bought out by the multi-national, Kabi-Pharmacia in 1992 and subsequently de-listed.
In 1997, P Farmaceutici bought the manufacturing activities from Kabi-Pharmacia and implemented an extensive reorganisation and strategic development plan, focusing on Contract Manufacturing (CMO) and Contract Research (CRO).
In June 2005, in order to develop and strengthen its CMO business, P Farmaceutici created Pierrel S.r.l. (later Pierrel S.p.A), transferring over the manufacturing assets. In this way, Pierrel returned to being a stand-alone entity in the manufacturing of proprietary medicinal products, supported by the Capua facility and the Pierrel brand name, which is well-known by consumers for its toothpaste and oral hygiene products.
To build on its CRO business, Pierrel acquired 51% of Pharmapart in July 2005, followed by three further CRO acquisitions – IFE Europe and Goodwill Research in 2007, and Hyperphar, in 2008.
In September 2006, Pierrel acquired a US based production plant from the multinational Dentsply, whose machinery (recently transferred to Capua), combined with additional capex spend in 2007-08, significantly boosted production capacity in Capua. The empty US plant based in Elk-Grove (Illinois) was recently sold for €3.5m, and as part of the transaction, a 15-year contract for the manufacture of injectable dental anaesthetics was forged with Dentsply. Initially, this relates to supplying the European market, and on FDA approval of the Capua plant, is extendable to the US market. Pierrel continues to supply the RoW market as per the original 2002 contract.
Fig. 1: Pierrel’s recent history as an independent entity
Date Event June 2005 P Farmaceutici creates Pierrel S.r.l. (later Pierrel S.p.A.) as a stand-alone entity, responsible
for manufacturing proprietary medicinal products July 2005 Pierrel acquires 51% of the share capital of Pharmapart AG, a leading CRO in Switzerland December 2005 Pierrel Dental is created by entering into a JV with two partners specialised in the marketing
& distribution of dental products. Pierrel acquires 52% of the share capital. May 2006 IPO on the Expandi segment of the Milan Stock Exchange September 2006 Creation of Pierrel Nature Concept by entering into a partnership agreement with Diaco
September 2006 Purchase of a dental anaesthetics manufacturing plant from Dentsply in the USA. The alliance includes a 15 year manufacturing contract.
March 2007 Acquisition of 85% of the German CRO group, IFE Europe May 2007 €2.7m capital increase reserved for EurizonVita S.p.A. May 2007 I.M.A. a leading packaging machinery manufacturer takes a 8.5% stake in Pierrel September 2007 Acquisition of Goodwill Research Kft (CRO). January 2008 Acquisition of Hyperphar Group (CRO) April 2008 Awarded AIFA (Italian Pharma Agency) authorisation to start production in the upgraded
manufacturing plant in Capua, Italy. April 2008 Fin Posillipo, a pharma distribution holding company acquires a 10% stake in Pierrel.
Source: Company Data and Bryan, Garnier & Co

Pierrel
6
Please see the section headed “Important information” on the back cover.
2.2. Activity Highlights Today, Pierrel principally operates in outsourcing for pharmaceutical companies, and is active in two key areas:
Contract Research (CRO): Consultancy service for research and development of new molecules and drugs, and;
Contract Manufacturing (CMO): Production of specially commissioned medicines.
Fig. 2: Pierrel's market positioning (CRO in dark blue; CMO in light blue)
Bulk Dev.
Clinicaltrials
Pre Clinical
Research DistributionSalesMarketing
R&D Marketing, Sales, Distribution
Process & Bulk Dev.
Commercial Manufacturing
Clinical Trial Supplies
Dev.
Dosage Form Dev.
Manufacturing, Development, PackagingBulk Dev.
Clinicaltrials
Pre Clinical
Research DistributionSalesMarketing
R&D Marketing, Sales, Distribution
Process & Bulk Dev.
Commercial Manufacturing
Clinical Trial Supplies
Dev.
Dosage Form Dev.
Manufacturing, Development, Packaging
Source: Bryan, Garnier & Co
Other Activities: Pierrel operates an ancillary Dental business (Pierrel Dental) focusing on the marketing of dental anaesthetics and toothpastes to dentists and pharmacies. Pierrel is also active in the field of natural cosmetics products (Pierrel Nature Concept) in partnership with the Italian company Diaco. These products are sold only in pharmacies.

Pierrel
7
Please see the section headed “Important information” on the back cover.
2.3. Organisational structure Since the IPO in May 2006, the number of staff increased from 130 to some 500 across its two main business units. This is explained by CRO acquisitions, with CRO now accounting for 80% of total staff.
Fig. 3: Organisational structure
HOLDING
OTHER
CMO Pierrel S.p.A.PierrelPierrel S.p.AS.p.A..
IFE Europe GmbH
IFE Europe IFE Europe GmbHGmbH
PharmaPartGmbH
PharmaPartPharmaPartGmbHGmbH
(51%)(51%) ((85%)85%)
PharmaPart AGPharmaPartPharmaPart AGAG
(100%)(100%)
Pierrel USA inc.PierrelPierrel USA inc.USA inc.
Pierrel America LLCPierrelPierrel America LLCAmerica LLC
Pierrel Dental SrlPierrelPierrel Dental Dental SrlSrl
Pierrel Natural ConceptPierrelPierrel Natural ConceptNatural Concept
(100%)(100%)
(100%)(100%)
(100%)(100%)
(50%)(50%)
(25%)(25%)
(100%)(100%)
(100%)(100%)
(100%)(100%)
GR Biometric unit
GR Biometric GR Biometric unitunit
GR RomaniaGR RomaniaGR Romania
GR SlovakiaGR SlovakiaGR Slovakia
(70%)(70%)
(80%)(80%)
(100%)(100%)
(100%)(100%)
IFE AustriaIFE AustriaIFE Austria
IFE UKIFE UKIFE UK
IFE RussiaIFE RussiaIFE Russia
IFE Germany
IFE IFE GermanyGermany
IFE HFIFE HFIFE HF
IFE BalcanIFE IFE
BalcanBalcan
IFE Bulgaria
IFE IFE BulgariaBulgaria
IFE BalticIFE BalticIFE Baltic
(100%)(100%)
(100%)(100%)
(99%)(99%)
(100%)(100%)
(70%)(70%)
(100%)(100%)Goodwill
Research KftGoodwill Goodwill
Research Research KftKftNew Hyperphar
srlNew New HyperpharHyperphar
srlsrl
HyperpharGroup spaHyperpharHyperpharGroup spaGroup spa
HyperpharGermany
HyperpharHyperpharGermanyGermany
Farma ResaCRO
FarmaFarma ResaResaCRO CRO
HyperpharResearch
Benelux
HyperpharHyperpharResearchResearchBeneluxBenelux
(100%)(100%)
(100%)(100%)
(100%)(100%)
(100%)(100%)
(35%)(35%)CRO
IFE Romania
IFE IFE RomaniaRomania
IFE Baltic States
IFE Baltic IFE Baltic StatesStates
IFE PolskaIFE IFE PolskaPolska
IFE WittenIFE WittenIFE Witten
(*)(*)
Source: Bryan, Garnier & Co
2.4. Financial history & shareholder structure Pierrel raised a total of €26.7m in the capital markets to date The IPO in May 2006 raised €24m before the payment of underwriting fees. Four million shares were listed at €6 per share, raising €24m. Continuous trading began on the Expandi segment of the Milan Stock Exchange on 23rd May 2006.
A capital increase in March 2007 raised a further €2.7m. On 12th March 2007, the Italian insurance company EurizonVita invested €3.15m, raising its stake in Pierrel to 4.5% from 1%. Some 3% or €2.m, was derived from the issuance of 300,000 new shares at €9.0, with the remaining 0.5% from a direct purchase of shares for €0.45m from Pierrel’s holding company – P Farmaceutici.
Pierrel’s share capital is made up of an industrial and managerial investor base P Farmaceutici (controlled by Mr Canio Mazarro) holds 30.2% of Pierrel’s share capital. P Farmaceutici was the sole shareholder until the IPO, after which P Farmaceutici continued to hold 60%. From January 2007 P Farmaceutici sold some of its shares to strategic investors, including I.M.A and Fin Posillipo.

Pierrel
8
Please see the section headed “Important information” on the back cover.
Today’s management team has a vested interest in the group’s future success. CEO, Mr Canio Mazzaro, has a 30.2% stake through P Farmaceutici. Former CEO of Hyperphar, Dr Luigi Visani (now Head of Pierrel’s CRO operations) holds 2% after exchanging Hyperphar stock for Pierrel stocks upon acquisition.
Industrial players own 20.4% of the share capital. The recent entry into the share capital of industrial players I.M.A. and Fin Posillipo lend credibility and validate Pierrel management’s, strategy and execution.
Fin Posillipo is the owner of the Petrone Group which is a holding company of approximately 30 firms operating in the pharmaceutical, parapharmaceutical and healthcare sectors. Activities include sales and distribution of pharmaceutical products, and R&D within the pharmaceutical and cosmetics sectors.
The I.M.A. Group is a world leader in the design and manufacture of automatic machines for the processing and packaging of pharmaceuticals, cosmetics, tea and coffee. It has 17 manufacturing sites globally, including a worldwide sales network covering more than 70 countries. I.M.A. was listed on the Milan Stock Exchange in 1995, and has a market capitalisation of c.€500m.
Fig. 4: Pierrel's shareholder structure
I.M.A. S.p.A.8.5%
P Farmaceutici30.2%
Eurizon Vita S.p.A. (Intesa Sanpaolo) 4.4%
Free float32.5%
FB trust3.9%
Zenit Multistrategy Sicav2.1%
Bootes S.r.l./Rosario Bifulco4.4%
Luigi Visani2.0%Fin Posilipo S.p.A.
11.9%
3
Management & Founders
Industrial investors with Board representation
Financial investors
Free float
Source: Consob website (12th June 2008)

Pierrel
9
Please see the section headed “Important information” on the back cover.
2.5. Solid management team
Pierrel boasts a management team consisting of individual experts in their fields. Most current executives were part of the Pierrel story for much of its history.
Rosario Bifulco (Chairman of the Board; 53) From 1978-93, Mr Bifulco held several management positions within the FIAT group. From 1993-2002, he served as CEO of Technosp and Humanitas Mirasole, as well as holding other top management positions in the Techint Group. From 2002-06 he served as the General Manager, CEO and Chairman of Lottomatica Spa. He was appointed Chairman of the Board on 19th September 2007.
Canio Giovanni Mazzaro (CEO; 48) Mr Mazzaro is Managing Director of P Farmaceutici, and was Chief Executive Officer of Pierrel since its spin-off in 2005. From 2001-05, he was a member of the Board of Directors of Ferrara University. He holds an MBA in Planning and Strategic analysis. Canio Mazzaro is the major shareholder of Pierrel owning a 30.2% stake indirectly through the holding company – P Farmaceutici.
Andrea Bordignon (Head of General Affairs & M&A; 40) Mr Bordignon joined Pierrel in 2002 as Head of Financial Accounting and Administration. Since April 2008 he served as Director of General Affairs and M&A. He was appointed a Director of Pharmapart’s Board in July 2005, and was a Director of Pierrel Dental since December 2005.
Gabriella Fabotti (CFO; 43) From 1990-98, Ms. Fabotti held several positions in the Strategic Planning division of Gruppo Ansaldo-Finmeccanica. From 1998-99, she served as the Controller of the Oral Care division in Gillette Group, Italy. From 1999-2004, she held several key positions in the Finance department of various Pirelli and Telecom Italia Group subsidiaries. Between 2004–07 she was the CFO of Lottomatica S.p.A. Ms Fabotti joined Pierrel as CFO and Head of Investor Relations, in January 2008.
Luigi Visani (Head of CRO Operations; 52) From 1984–98, Dr Visani was the Research Director at Boheringer Ingelheim Italia. From 1998, he was the Chairman and Chief Executive Officer of Hyperphar Group S.p.A., until its acquisition in January 2008 by Pierrel.
Angelo Colombo (Head of Manufacturing; 45) Mr Colombo joined Pierrel in March 2008 as Head of Manufacturing. From 2003-06 he headed Pfizer’s manufacturing plant in Nerviano. Prior to that, he served in various production facilities at Farmitalia Carlo Erba, Pharmacia&Upjohn and Pharmacia. Between 2006–08, he was Manufacturing Director at Nerviano Medical Sciences. He holds a degree in Chemistry and Formulation Chemistry.

Pierrel
10
Please see the section headed “Important information” on the back cover.
2.6. Company strategy
Pierrel’s strategic aim is to make the group the outsourcing partner of choice for mid-sized pharmaceutical and generic drug companies.
The company aims to build an integrated group, and as such, the first priority is to pursue the integration of its CRO activities and acquisitions, as well as integrate its CRO and CMO businesses.
The aim is not only to leverage commercial synergies, but also to gradually upgrade its project portfolio from transaction-based outsourcing projects, to more global, extended and profitable partnerships, requiring both CRO and CMO competencies.
Geographical expansion within the CRO business is strategically key, given the network of relationships with reference centres across Europe is critical in operating this business. Pierrel does not exclude M&A opportunities here, despite the fact that, after 3 transactions concluded in 2007-2008, the company now operates on the entire chain of clinical development, from Preclinical Phase to Phase IV.
To attain critical mass & optimise the utilisation of its current production capacity, Pierrel also aims at keeping up the pace of external growth in the CMO business. This sector is still highly fragmented in Europe, and therefore offers highly interesting consolidation opportunities.
Growing importance of the Generic drug business. The company intends to imminently reinforce its capabilities in the legal authorisation of generics (CRO), and its relevant production support (CMO). The company is presently looking at M&A opportunities giving access to other forms (possibly solid) in its CMO service offering, that are more widely used for generic drugs. The integration of CMO and CRO services, are critical factors in the possible outsourcing of generic drugs. Indeed, the "comparative bioavailability" studies (i.e. studies that compare the generic drug with the original brand name drug) include demonstrations that not just the ingredients, but also the manufacturing processes and facilities, meet guidelines for Good Manufacturing Practices.
Greater focus on Biotechs. Typically, Biotechs, even if they wanted to remain as involved as possible in the production processes, have neither the capacity nor financial means to establish expensive manufacturing facilities. Penetration of this segment will not be easy, as Biotech manufacturing is more complex than that of traditional Pharma.

Pierrel
11
Please see the section headed “Important information” on the back cover.
2.7. Catalysts
We expect Pierrel to unveil significant newsflow in 2008 and 2009, with the potential to generate valuable upside for investors. In our view, the most crucial event will be the FDA approval of the Capua production facility, expected in April 2009. We are encouraged that Pierrel has already received approval from the Italian authorities (AIFA), which is valid across Europe, Japan, Canada and Australia. FDA approval would mark a major turning point for Pierrel and its CMO business, opening the gateway to the US, worth c.60% of the total CMO market. We forecast CMO revenues of €35.6m in 2011e, of which €18.9m is derived from the Dentsply contract.
Quarterly results For the most part, the foundations have been laid for outperformance in 2008 and 2009 in the form of significant CRO acquisitions, the Dentsply alliance and CMO capital expenditure. As such, we expect the major share price catalysts to be quarterly results, when the successful execution of the 2008-11 business plan will be evident in revenue growth and margin expansion. NB. EBITDA is expected to be positive for full year 2008. 1H08 results are scheduled for 28th August 2008.
Further acquisitions to come Pierrel is yet to announce the last of its planned acquisitions, as outlined in its external strategy announced in July 2007. The market awaits a CMO acquisition, which, depending on the size of the target and the technology selected, we expect to be a significant catalyst for the stock in 2H08 or 1H09. It is also possible that management will unveil the acquisition of a Western European niche manufacturer. Any acquisition will be dependent on a successful capital increase of €20-25m, which we expect to take place in 3Q08.
Expansion of the network Successful integration of CRO acquisitions sees the expansion of the combined network, leading to the forging of new contracts. Though only 7% of 2011 CMO revenues will be derived from new contracts, we nevertheless hope for news of new CRO and CMO contracts over the 2008-11 period. If significant, we expect their announcement will bring considerable share price upside.
Fig. 5: Upcoming newsflow
Date Event 28th August 2008 1H08 financial results 12th Nov 2008 3Q08 financial results 2H08/1H09 Significant CMO acquisition 2H08/1H09 Possible second smaller acquisition of a Western European boutique CMO player Mid 2009 FDA approval of the Capua, production facility in Caserta, Italy
Source: Company Data; Bryan, Garnier & Co ests.

Pierrel
12
Please see the section headed “Important information” on the back cover.
Fig. 6: SWOT Analysis
Opportunities Threats
• Both CRO and CMO markets offer high organic development rates
• Emerging countries like India and soon China will provide low cost products that will meet GMP regulations
• Generic drug projects • Potential delays of CMO and CRO businesses integration
• Consolidation opportunities for existing CMO/CRO players
• Larger CROs favoured particularly in clinical business
Strengths Weaknesses
• "One-stop shop" strategy • Small size compared to sector peers
• Strong visibility on the top line • Risk of bottlenecks in production
• Track record of sales growth • High dependence on a small number of clients particularly in CMO
• Breakeven expected in 2008 • Limited financial track-record
• Industrial support and validation
Source: Bryan, Garnier & Co

Pierrel
13
Please see the section headed “Important information” on the back cover.
3.Valuation
3.1. Historic share price performance
Since the IPO, the stock performed well, attaining a high of €10.7 per share on 23rd May 2007, and returning a performance of 19% for investors entering the stock at flotation.
Strong performances in 2H06 and 1H07 followed the announcement of the Dentsply alliance in September 2006, and the acquisitions of CRO players: IFE Europe in January 2007; and Goodwill Research in June 2007. Pierrel also benefited from a capital increase in March 2007 raising €2.7m, and strengthening the investor base with the addition of the Italian insurance company, EurizonVita.
Pierrel’s relatively small market capitalisation has left the company more exposed to negative fall-outs of the sub-prime crisis, and consequent heightened risk aversion amongst investors. With this in mind, Pierrel underperformed larger peers by 15% year to date.
Fig. 7: Pierrel gained 19% since its IPO in May 2006
4
5
6
7
8
9
10
11
24/05
/2006
19/07
/2006
14/09
/2006
09/11
/2006
09/01
/2007
06/03
/2007
04/05
/2007
29/06
/2007
27/08
/2007
22/10
/2007
17/12
/2007
18/02
/2008
16/04
/2008
12/06
/2008
Sha
re p
rice
(€)
0
100000
200000
300000
400000
500000
600000
Vol
ume
(sha
res)
Source: Bryan, Garnier & Co

Pierrel
14
Please see the section headed “Important information” on the back cover.
Overall, we believe the current valuation does not fully reflect the 2008-11 business plan potential, the beneficial impacts of recent CRO acquisitions, nor related synergies and integration benefits to come. Additionally, positive newsflow in the year ahead, particularly related to the CMO business and the Dentsply agreement, have been largely ignored.
3.2. 2008-11 business plan
In July 2007, Pierrel announced its four year 2008-11 strategic plan. The plan sees 2008 revenues of c.€49m, with a 2008-11 CAGR of c.17%, and 2008 EBITDA of c.€1.7m, with a 2008-11 CAGR of c.107%.
The plan incorporates all four CRO acquisitions and the extension of the Dentsply contract to the US, but excludes any further upside derived from acquisition synergies or an expansion of its CRO client network. The plan also excludes any upside derived from the planned CMO acquisition.
The table below highlights the main differences between the new business plan and Bryan, Garnier & Co’s estimates.
Fig. 8: Pierrel’s 2008-11 business plan vs. BG forecasts
€m 2008e 2008 BGe 2011e 2011 BGe 2008-11e CAGR 2008-11e CAGR BGe
Revenues 49 49.4 79 82.4 +17% 18.6% EBITDA 1.7 1.8 15.7 16.2 +107% +108% Operating cash flow -2.0 -1.8 13.8 12.4 +69% +59.7% (2009-11e)
Source: Company Data and Bryan, Garnier & Co ests.
We are highly confident in our 2008 revenue forecast of €49m, considering that, as of December 2007 (pro-forma), Pierrel had an order book at €43.8m, which clearly does not take into account any additional revenues generated in 2008.
Revenue forecasts
We forecast 18.6% revenue CAGR 2008-11. Our above-guidance estimates incorporate additional revenues derived from the expansion of the network, which management does not yet include in guidance. The current strategic focus for Pierrel, is to move from transactional-based contracts, to partnership-based alliances. Given Pierrel is able to offer a wide range of outsourcing services; we deem the group ideally positioned to reap the benefits. The successful integration of the CRO acquisitions and the beneficial impact of offering both CRO and CMO operations, justify our above guidance forecasts.
Pierrel
15
Please see the section headed “Important information” on the back cover.
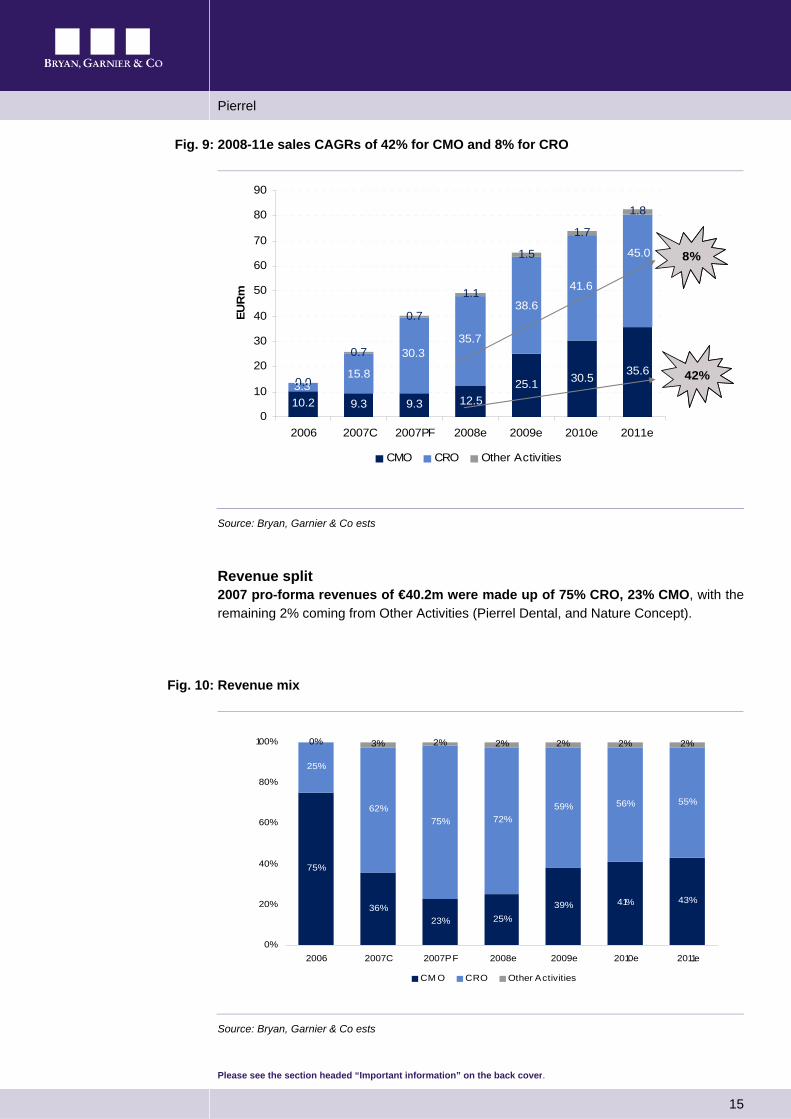
Fig. 9: 2008-11e sales CAGRs of 42% for CMO and 8% for CRO
10.2 9.3 9.3 12.525.1 30.5 35.6
0.0
0.7
0.7
1.1
1.5
1.7
1.8
3.315.8
30.335.7
38.6
41.6
45.0
0
10
20
30
40
50
60
70
80
90
2006 2007C 2007PF 2008e 2009e 2010e 2011e
EUR
m
CMO CRO Other Activities
8%
42%
10.2 9.3 9.3 12.525.1 30.5 35.6
0.0
0.7
0.7
1.1
1.5
1.7
1.8
3.315.8
30.335.7
38.6
41.6
45.0
0
10
20
30
40
50
60
70
80
90
2006 2007C 2007PF 2008e 2009e 2010e 2011e
EUR
m
CMO CRO Other Activities
8%
42%
Source: Bryan, Garnier & Co ests
Revenue split 2007 pro-forma revenues of €40.2m were made up of 75% CRO, 23% CMO, with the remaining 2% coming from Other Activities (Pierrel Dental, and Nature Concept).
Fig. 10: Revenue mix
75%
36%23% 25%
39% 41% 43%
25%
62%75% 72%
59% 56% 55%
0% 3% 2% 2% 2% 2% 2%
0%
20%
40%
60%
80%
100%
2006 2007C 2007PF 2008e 2009e 2010e 2011e
CM O CRO Other Activities
Source: Bryan, Garnier & Co ests

Pierrel
16
Please see the section headed “Important information” on the back cover.
In 2008, the company guides for revenues to be split 73% CRO and 27% CMO. The 2011 target allocates 53% of revenues to CRO, and 27% of revenues to CMO.
Our model anticipates 2008-11 CAGR of c.42% for the CMO division. Strong growth in CMO revenues is generated by the volume boost from Dentsply, and the use of the expanded production capacity currently being prepared at the Capua facility. In line with the business plan, we have not incorporated positive effects of any future CMO acquisitions.
Our 2008 revenues mix almost matches that of the business plan, though in 2011 we forecast the mix to be 43% CMO and 55% CRO (with the remaining 2% derived from Other Activities). Our model takes into account additional CRO revenues sourced from the integration effects of CRO acquisitions. As such, the proportion of revenues on the CRO side is buoyed. We see CRO revenues growing at a 2008-11 CAGR of 8.0%.
Margin forecasts
We forecast EBITDA margin expansion to 19.6% in 2011e from 3.6% in 2008e. Our above guidance estimates incorporate the synergies from the integration of CRO activities, and the integration of the CMO & CRO business units, neither of which are included in Pierrel’s four year business plan.
NB. The CRO business is already EBIT positive in 2007 on the basis of pro-forma accounts.
Fig. 11: Margin forecasts by business unit
€m CMO – 2007PF CMO – 2008e CMO – 2011e CRO – 2007PF CRO – 2008e CRO – 2011e Revenues 9.3 12.5 35.6 30.3 35.7 45.0 EBITDA -3.6 -3.7 6.4 2.4 5.5 9.5 EBITDA margin, % nm nm 18.1% 8.0% 15.3% 21.1% EBIT -4.7 -4.3 5.6 1.7 4.0 8.5 EBIT margin, % nm nm 15.8% 5.6% 11.3% 18.8%
Source: Bryan, Garnier & Co ests.
We expect 2008-11 EBITDA CAGR of 108%. The strong growth in profitability is derived principally from the dynamic revenue growth of 18.6%. We believe the existing cost structure is sufficient to support this revenues growth, particularly given that Pierrel’s Capua plant is already structured for a near optimum production capacity of 170m units.

Pierrel
17
Please see the section headed “Important information” on the back cover.
Operating Cash Flow forecasts We forecast gross operating cash flow will grow at a 2009-11 CAGR of 59.7% vs. 69% guidance. The gross operating cashflow takes advantage of the EBITDA growth. In both cases (i.e. EBITDA and gross op.CF) our forecasts are above guidance, given the business plan excludes acquisition-derived synergies, and the benefits derived from the integration of the business units.
3.3. We value all three business units using a sum-of-the parts DCF methodology
Our DCF derives a Fair Value of €92.8m, suggesting a potential upside of 27% to current levels.
Our valuation approach comprises of the sum of three separate DCFs, one for each of Pierrel’s business units: 1). Contract Manufacturing (CMO); 2). Clinical Research (CRO), and; 3). Non-core business (Other Activities), consisting of Pierrel Dental and Pierrel Nature Concept which collectively account for just 2.3% of estimated 2008 sales.
Fig. 12: DCF SOTP analysis
BUSINESS UNIT SALES CAGR
2008-11e
SALES 2009e
EBITDA 2009e
EBITDA margin 2009e
BETA TERMINAL GROWTH RATE (%)
WACC (%)
NET PRESENT
VALUE (€m)
NPV/ EBITDA 2009e
FAIR VALUE
(€m)
Contract Manufacturing Organisation (CMO)
41.7% 25.13 3.13 12.4% 1.67 2.0% 9.70% 44.8 14.3x -
Clinical Research Organisation (CRO)
8.0% 38.56 6.33 16.4% 1.67 2.0% 9.70% 79.2 6.3x -
Other Activities 17.1% 1.48 0.14 9.4% 1.67 2.0% 9.70% 1.1 7.9x - Cash (debt) - - - - - - - (32.3) PIERREL GROUP 18.6% 65.16 9.60 14.7% 1.67 2.0% 9.70% 125.1 13.0x 92.76
Source: Bryan, Garnier & Co ests.
Fig. 13: Net Present Value contribution per business unit
CRO63%
CMO36%
Other Activities1%
Source: Bryan, Garnier & Co ests

Pierrel
18
Please see the section headed “Important information” on the back cover.
Each DCF is based on a WACC of 9.7% and a terminal growth rate of 2%. We forecast free cash flows out to 2012, applying a marginal tax rate 33%, depreciating tangible assets over 20 years, and amortising intangible assets over 5 years. Overall, we assume almost no capital expenditure (<2% of sales) from 2008-12, given the significant investments already made in the Capua factory in 2007 (€2.5m), and the company’s preference for growth by acquisition.
Fig. 14: Pierrel’s overall free cash flow forecasts
FCF Forecasts - €m 2005 2006 2007C 2008e 2009e 2010e 2011e 2012e Revenues 3.0 13.5 25.8 49.4 65.2 73.9 82.4 92.1 EBITDA 0.2 (1.2) (3.8) 1.8 9.6 13.0 16.2 18.0 EBIT 0.1 (1.8) (5.1) (0.2) 7.7 11.1 14.3 16.1 (-) Less adjusted taxes (0.0) 0.3 0.9 0.4 (2.2) (3.4) (4.5) (5.2) (+) Depreciation and amortisation 0.1 0.6 1.4 2.0 1.9 1.9 1.9 1.9 (+) Decrease/(increase) in WCR 1.6 0.0 (0.7) (3.1) (1.6) 0.6 1.3 0.1 Cash-flows from operating activities 1.8 (0.9) (3.5) (0.9) 5.8 10.2 13.0 12.9 (-) Capex (0.5) (4.8) (6.1) (2.2) (1.8) (1.8) (1.8) (1.8) Free cash-flows 1.3 (5.7) (9.6) (3.2) 4.0 8.4 11.2 11.1 % growth nm nm nm nm nm 109% 33% -1%
Source: Bryan, Garnier & Co ests.
3.4. We value Pierrel’s CMO business with a Net Present Value of €44.8m The table below shows our Free Cash Flow (FCF) forecasts for the Contract Manufacturing business. FCFs grow at a 2009-12e CAGR of 65%.
Fig. 15: CMO free cash flow forecasts
FCF Forecasts - €m 2006 2007C 2008e 2009e 2010e 2011e 2012e Revenues 10.2 9.3 12.5 25.1 30.5 35.6 41.6 EBITDA (0.8) (3.6) (3.7) 3.1 4.8 6.4 7.5 EBIT before exceptionals - (4.7) (4.3) 2.4 4.0 5.6 6.7 (-) Less adjusted taxes 0.2 0.3 0.1 (0.9) (1.4) (2.0) (2.4) (+) Depreciation and amortisation 0.4 0.5 0.5 0.7 0.8 0.8 0.9 (+) Decrease/(increase) in WCR 0.0 (0.2) (0.8) (0.6) 0.2 0.6 0.0 Cash-flows from operating activities 0.7 (4.1) (4.4) 1.7 3.6 5.1 5.2 (-) Capex (3.6) (2.2) (0.6) (0.7) (0.7) (0.8) (0.8) Free cash-flows (3.0) (6.3) (5.0) 1.0 2.9 4.3 4.4 % growth nm nm nm nm 200% 47% 2%
Source: Bryan, Garnier & Co ests.
Fig. 16: CMO Discounted Cash Flow analysis
DCF calculation - €m 0 1 2 3 4Year 2008e 2009e 2010e 2011e 2012eFree cash-flows -5.0 1.0 2.9 4.3 4.4WACC discount factor (compounded) 1.00 0.91 0.83 0.76 0.69NPV of FCF -5.0 0.9 2.4 3.2 3.0Residual value 58NPV of residual value 40
Total present value 44.8
Source: Bryan, Garnier & Co ests

Pierrel
19
Please see the section headed “Important information” on the back cover.
3.5. We value Pierrel’s CRO business at a Net Present Value of €79.2m The table below shows our Free Cash Flow (FCF) forecasts for the Contract Research business. FCFs grow at a 2009-12 CAGR of 30%.
Fig. 17: CRO free cash flows forecasts
FCF Forecasts - €m 2006 2007C 2008e 2009e 2010e 2011e 2012e Revenues 3.3 15.8 35.7 38.6 41.6 45.0 48.6 EBITDA (0.4) 0.6 5.5 6.3 7.9 9.5 10.3 EBIT before exceptionals - 0.3 4.0 5.2 6.9 8.5 9.3 (-) Less adjusted taxes 0.1 0.5 0.3 (1.3) (1.9) (2.5) (2.8) (+) Depreciation and amortisation 0.1 0.8 1.4 1.1 1.1 1.0 1.0 (+) Decrease/(increase) in WCR 0.0 (0.4) (2.2) (0.9) 0.3 0.7 0.0 Cash-flows from operating activities 0.2 1.3 3.5 4.1 6.4 7.8 7.5 (-) Capex (1.2) (3.7) (1.6) (1.0) (1.0) (1.0) (0.9) Free cash-flows (1.0) (2.4) 1.9 3.0 5.4 6.8 6.6 % growth nm nm nm 61% 78% 26% -3%
Source: Bryan, Garnier & Co ests.
Fig. 18: CRO Discounted Cash Flow analysis
DCF calculation - €m 0 1 2 3 4Year 2008e 2009e 2010e 2011e 2012eFree cash-flows 1.9 3.0 5.4 6.8 6.6WACC discount factor (compounded) 1.00 0.91 0.83 0.76 0.69NPV of FCF 1.9 2.8 4.5 5.1 4.6Residual value 87NPV of residual value 60
Total present value 79.2
Source: Bryan, Garnier & Co ests
WACC Calculation In all cases we discounted our Free Cash Flows using a Weighted Average Cost of Capital of 9.7%. In calculating our WACC, we employed a beta of 1.67, a pre-tax Cost of Debt of 6.5%, and an Equity Risk Premium of 5.5%.
Fig. 19: WACC calculation
WACC calculation assumptions %LT Debt / (LT Debt + Book Equity) % 44.9%Cost of debt % 6.5%Marginal tax rate % 33.0%Effective cost of debt % 4.4%Risk free rate (10-yr yield bond) % 4.9%Equity risk premium % 5.5%Qualitative beta 1.67Cost of equity % 14.0%Weighted average cost of capital % 9.70%
Source: Bryan Garnier & Co ests.

Pierrel
20
Please see the section headed “Important information” on the back cover.
Fig. 20: Sensitivity analysis to WACC, beta and terminal growth rates
Price sensitivity table, EURWACC 8.8% 9.1% 9.4% 9.70% 10.0% 10.3% 10.6%
1.0% 94.4 89.3 84.6 80.2 76.1 72.3 68.7Terminal 1.5% 102.0 96.3 91.0 86.1 81.6 77.3 73.4growth 2.0% 110.7 104.2 98.2 92.8 87.7 83.0 78.6
rate 2.5% 120.7 113.3 106.5 100.3 94.6 89.4 84.53.0% 132.5 123.9 116.1 109.0 102.6 96.6 91.2
Price sensitivity table, EURBeta WACC 1.52 1.57 1.62 1.67 1.72 1.77 1.82
1.0% 80.2 80.2 80.2 80.2 80.2 80.2 80.2Terminal 1.5% 86.1 86.1 86.1 86.1 86.1 86.1 86.1growth 2.0% 92.8 92.8 92.8 92.8 92.8 92.8 92.8
rate 2.5% 100.3 100.3 100.3 100.3 100.3 100.3 100.33.0% 109.0 109.0 109.0 109.0 109.0 109.0 109.0
Source: Bryan, Garnier & Co ests
3.6. Comparable companies analysis
We have screened numerous CRO and CMO players in both Europe and the US, and have run an extensive comparable companies analysis shown in the two figures below:
Fig. 21: Market multiples analysis
€m Sector Mkt cap
Net debt
(cash)
Sales 08-10e CAGR
EBIT margin 2009e
EBIT margin 2010e
EV/ Sales 2009e
EV/ Sales 2010e
EV/ EBITDA 2009e
EV/ EBITDA 2010e
EV/ EBIT 2009e
EV/ EBIT 2010e
PE 2009e
PE 2010e
Pierrel CM/RO 71 32 22% 11.8% 15.0% 1.6x 1.4x 10.8x 8.0x 13.5x 9.4x 15.7x 10.3x Patheon Inc CMO 239 238 5% 9.6% 9.4% 1.0x 0.9x 6.5x 5.7x 10.6x 10.1x 18.4x na AMR CMO 284 -46 15% 10.7% 12.8% 1.6x 1.4x 8.5x 6.9x 14.7x 10.5x 23.7x 17.1x PPD CRO 3,299 -312 16% 20.2% 20.0% 2.6x 2.2x 10.9x 9.5x 13.0x 11.2x 20.4x 17.8x Covance CRO 3,396 -120 16% 16.5% 17.0% 2.5x 2.2x 12.4x 10.5x 15.5x 12.8x 22.5x 18.6x Kendle CRO 356 108 16% 13.4% 13.4% 1.4x 1.2x 8.4x 6.8x 10.1x 8.6x 15.5x 13.4x Icon CRO 865 -9 18% 11.6% 12.2% 1.3x 1.1x 9.1x 7.6x 11.4x 9.4x 15.8x 13.0x Parexel CRO 899 1 17% 9.6% 10.3% 1.1x 1.0x 8.4x na 12.0x 9.7x 21.9x 17.7x Average 14.8% 13.1% 13.6% 1.7x 1.4x 9.2x 7.9x 12.5x 10.3x 19.7x 16.3x Median 16.1% 11.6% 12.8% 1.4x 1.2x 8.5x 7.3x 12.0x 10.1x 20.4x 17.4x
Source: Bryan, Garnier & Co ests. & Reuters ests. (close on 26h June 2008)
(N.B. AMR = Albany Molecular Research; & PPD = Pharmaceutical Product Development)
Pierrel
21
Please see the section headed “Important information” on the back cover.
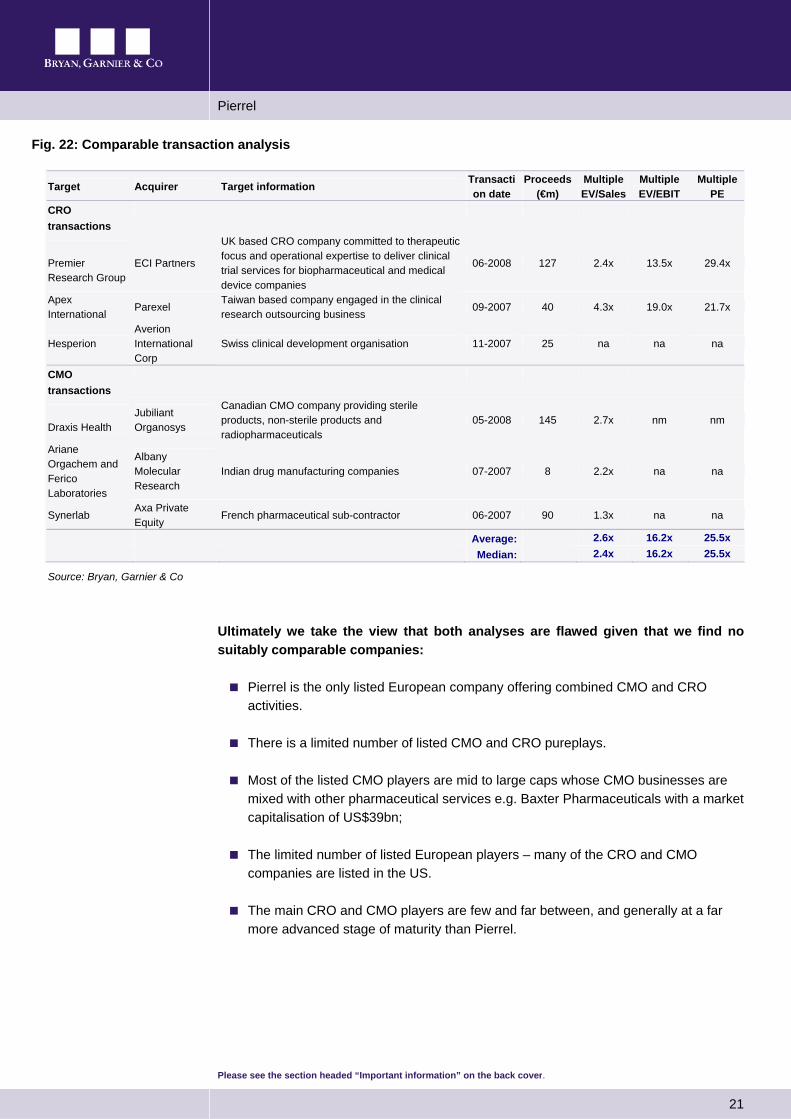
Fig. 22: Comparable transaction analysis
Target Acquirer Target information Transaction date
Proceeds (€m)
Multiple EV/Sales
Multiple EV/EBIT
Multiple PE
CRO transactions
Premier Research Group
ECI Partners
UK based CRO company committed to therapeutic focus and operational expertise to deliver clinical trial services for biopharmaceutical and medical device companies
06-2008 127 2.4x 13.5x 29.4x
Apex International
Parexel Taiwan based company engaged in the clinical research outsourcing business
09-2007 40 4.3x 19.0x 21.7x
Hesperion Averion International Corp
Swiss clinical development organisation 11-2007 25 na na na
CMO transactions
Draxis Health
Jubiliant Organosys
Canadian CMO company providing sterile products, non-sterile products and radiopharmaceuticals
05-2008 145 2.7x nm nm
Ariane Orgachem and Ferico Laboratories
Albany Molecular Research
Indian drug manufacturing companies 07-2007 8 2.2x na na
Synerlab Axa Private Equity
French pharmaceutical sub-contractor 06-2007 90 1.3x na na
Average: 2.6x 16.2x 25.5x Median: 2.4x 16.2x 25.5x
Source: Bryan, Garnier & Co
Ultimately we take the view that both analyses are flawed given that we find no suitably comparable companies:
Pierrel is the only listed European company offering combined CMO and CRO activities.
There is a limited number of listed CMO and CRO pureplays.
Most of the listed CMO players are mid to large caps whose CMO businesses are mixed with other pharmaceutical services e.g. Baxter Pharmaceuticals with a market capitalisation of US$39bn;
The limited number of listed European players – many of the CRO and CMO companies are listed in the US.
The main CRO and CMO players are few and far between, and generally at a far more advanced stage of maturity than Pierrel.

Pierrel
22
Please see the section headed “Important information” on the back cover.
4. The importance of outsourcing
The outsourcing of activities involved in the development and production of drugs represents a rising trend in the global pharmaceutical industry. Pharma companies are increasingly turning to outsourcing due to rising levels in the complexity of manufacturing and development.
Typically pharmaceutical companies use outsourcing in the execution of clinical trials (CRO), the production of dosage forms (CMO) and the packaging of finished products, while concentrating their in-house activities on basic research and marketing, sales and distribution phases.
The market is split into two fundamental segments:
Contract Research Organisation (CRO): the provision of consultancy services in the research and development of new substances and drugs, and;
Contract Manufacturing Organisation (CMO): the manufacture of medicinal specialities on the basis of a contract.
Fig. 23: Product life-cycle
Marketing, Sales & Dist.Dev., Manufacture & Packaging of Dosage FormsBulk Development
DistributionMarketing
& SalesPack-aging
Dosage form
manufacture
Dosage form dev.
Bulkdevelop-
ment
1° processdevel-
opment
Clinicaltest
R&D
Pre-clinicalDevelop-
ment
Basic research
Outsourcingto CRO
Outsourcingto CMO
Marketing, Sales & Dist.Dev., Manufacture & Packaging of Dosage FormsBulk Development
DistributionMarketing
& SalesPack-aging
Dosage form
manufacture
Dosage form dev.
Bulkdevelop-
ment
1° processdevel-
opment
Clinicaltest
R&D
Pre-clinicalDevelop-
ment
Basic research
Marketing, Sales & Dist.Dev., Manufacture & Packaging of Dosage FormsBulk Development
DistributionMarketing
& SalesPack-aging
Dosage form
manufacture
Dosage form dev.
Bulkdevelop-
ment
1° processdevel-
opment
Clinicaltest
R&D
Pre-clinicalDevelop-
ment
Basic research
Outsourcingto CRO
Outsourcingto CMO
Source: Bryan, Garnier & Co

Pierrel
23
Please see the section headed “Important information” on the back cover.
The CMO market is divided into two further segments, according to the physical characteristics of the medicinal product manufactured:
Solid Dosage Form: made up of drugs in the solid state;
Liquid Dosage Form: made up of drugs in the liquid state, divided between Sterile and Non-sterile Liquid Dosage forms.
Pierrel operates in a European outsourcing market valued at US$10.7bn in 2011. The reference CMO market for Pierrel is the Global Sterile Liquid Dosage Form market, valued at US$4.5bn in 2011e, and growing at an est. 2007-11 CAGR of 9.2%. The 2011e European CRO market is valued at US$6.2bn, growing at a 2007-11e CAGR of 7.6%.
Fig. 24: Sterile Liquid Dosage Form market (left) and CRO market (right) (US$bn)
2.22.5
2.93.2
3.53.8
4.1
4.5
0.6 0.7 0.8 0.9 0.9 1.0 1.1 1.2
0.0
0.5
1.0
1.5
2.0
2.5
3.0
3.5
4.0
4.5
5.0
2004 2005 2006 2007 2008e 2009e 2010e 2011e
USD
bill
ions
Global Sterile Liquid Dosage Form European Sterile Liquid Dosage Form
14.515.9
17.318.5
19.821.2
22.724.3
3.7 4.1 4.3 4.6 5.0 5.4 5.8 6.2
0.0
5.0
10.0
15.0
20.0
25.0
30.0
2004 2005 2006 2007 2008e 2009e 2010e 2011e
USD
bill
ions
Global market European market
Source: Bryan, Garnier & Co ests
4.1. CRO market drivers Drug development company reliance on the outsourcing of clinical research activities continues to rise sharply. According to the Tufts Center for the Study of Drug Development, in 2007, biopharmaceutical companies spent approximately US$8.5bn worldwide on contract clinical service providers. Sponsors spent 17% of their total development budget on CRO services in 2007, up from 14% in 2001. Tufts calculates the annual growth in spending on CRO services at 14.9% p.a. since 2001, well outpacing the 10.5% annual growth rate in total global development spending.

Pierrel
24
Please see the section headed “Important information” on the back cover.
A number of factors have contributed to the growing dependence on CROs:
An increase in worldwide clinical trial volume.
A demand for flexible R&D resource, correlated to development activity.
The proliferation of small & mid-sized companies with limited R&D capabilities, known as virtual companies.
Technical and regulatory specialisations.
Demand for improved development performance reducing time to market.
An increase in worldwide clinical trial volumes.
Rising clinical trial volumes
At a time when global clinical trial volume and scope is increasing, drug developers face significant capacity constraints. The number of projects in worldwide development grew 6% annually since 2002, yet many major pharmaceutical and biotechnology companies did not increased their internal clinical research headcount. Indeed, these internal capacity constraints are expected to worsen.
Fluctuating development activity demands flexible R&D resources Drug development companies are turning to outsourcing to correlate their R&D spend more closely to the flow of projects under development. The number of projects is obviously prone to variation. Partnerships with Clinical Research Organisations allow for a more efficient use of R&D budgets and headcount.
Virtual companies lack core capabilities The dramatic proliferation of small and mid-sized companies conducting clinical research programmes has driven outsourcing growth. Tufts estimates 1,800 companies worldwide are actively conducting at least one clinical trial, a 65% increase over the number of companies doing so five years ago. Smaller companies, many of them biotechnology firms, typically outsource a much higher percentage of their total clinical research budgets, for expertise that falls outside their core capabilities.
Technical, regulatory and post-marketing specialisations CROs offer clinical expertise via access to specialist physicians and suites, and regulatory expertise through their considerable experience, ensuring that clinical trials are in full compliance with regulatory requirements. To optimise risk management, CROs conduct comprehensive post-marketing safety programmes, coordinating pharmacovigilance with safety surveillance studies. CROs are able to carry out highly specialised Phase IIIb and IV research that help sponsors develop and support claims that position brands, crucial in achieving commercial objectives.

Pierrel
25
Please see the section headed “Important information” on the back cover.
Improvement in development performance CROs can provide speed advantages at comparable quality, when used effectively. A study conducted by the Tufts Centre for the Study of Drug Development (CSDD) in 2006 found that projects that made use of CROs at higher levels tended to reduce cycle times by 2-4 weeks compared to those with lower CRO usage.
Compared to low CRO usage projects, projects with high CRO usage
showed a median of 78 days, compared to 98 days, from protocol readiness to FPFV (“First Patient, First Visit”).
reached study data availability from protocol readiness in 196 days, compared to 231 days.
moved from protocol readiness to LPFV (“Last Patient, First Visit”) in 294 days, compared to 308 days.
required an average of 42 days to move from Last Patient, Last Visit (LPLV) to database lock, compared to 56 days.
4.2. CMO market drivers
The CMO market is driven by the benefits outsourcing delivers to drug developers. The outsourcing of manufacturing provides drug developers with:
Specialisation and technical know-how.
Added & flexible capacity.
Solutions to challenges in clinical trial supplies.
Freedom to focus on core competencies.
Freeing up financial resources.
Keeping up with latest technologies Over the past few years, the pharmaceutical industry favoured the growth of the Contract Manufacturing market. This was due to the need to keep up with the latest production processes in particular, and to attain high levels of efficiency in cost management, and the production of new emerging drugs.
Pierrel
26
Please see the section headed “Important information” on the back cover.
New challenges in clinical trial supply chain management The current manufacturing environment is becoming increasingly demanding for drug developers. According to a study by BearingPoint and AMR Research, drug developers require a more versatile and efficient clinical supply chain than currently exists. As clinical trial size, reach and design complexity increases, the manufacturing of clinical supplies needs to become globally agile, with adaptable capacity. It is not surprising that drug developers are turning to CMO outsourcing to plug this gap.
4.3. High barriers to enter the outsourcing market
Both CMO & CRO markets are protected by significant barriers to entry:
Strict regulations that characterise both sectors and impose long and expensive authorisation procedures on companies wishing to operate there.
High level of specific know-how required to obtain and manage contracts.
Substantial investments required, particularly in Contract Manufacturing.
High value of intellectual property managed in research contracts, which induces customers only to use operators benefiting from a good image and reputation.

Pierrel
27
Please see the section headed “Important information” on the back cover.
5. CMO growth
Boost from increased production capacity & Dentsply contract
Estimated 2008 CMO revenues are expected to double in 2009, following Pierrel’s significant investment in its manufacturing facilities, and a lucrative contract signed with Dentsply, a world leader in dental anaesthetics. The proviso being the FDA’s approval of Pierrel’s Capua facilities, expected in April 2009. FDA approval would mark a major turning point for Pierrel and its CMO business, opening the gateway to the US, worth some 60% of the total CMO market. We forecast CMO revenues of €35.6m in 2011, of which €18.9m is attributable to the Dentsply contract.
Fig. 25: CMO revenues and margins
€m 2006 2007C 2007PF 2008e 2009e 2010e 2011e CMO revenues 10.2 9.3 9.3 12.5 25.1 30.5 35.6 Growth, % -9.0% -9.0% 35.4% 100.5% 21.4% 16.8% As a % of total revenues 75.4% 35.9% 23.0% 25.4% 38.6% 41.3% 43.2% CMO EBITDA (0.8) (3.6) (3.6) (3.7) 3.1 4.8 6.4 CMO EBITDA margin, % nm nm nm nm 12.4% 15.8% 18.1%
Source: Bryan, Garnier & Co ests.
We predict an EBITDA margin expansion of nearly 460bps from est. 2009 levels, to 18.1% in 2011. Capacity increased to c.180m units,from c.50m units (cartridges & vials) at the time of the IPO in May 2006. Economies of scale, allowing the number of personnel committed to the CMO division to remain unchanged at around 100 people, are driving this margin expansion.

Pierrel
28
Please see the section headed “Important information” on the back cover.
5.1. CMO revenues
We forecast overall CMO revenues of €35.6m in 2011, for an impressive 2008-11e CAGR of 42%. Our sales model calculates revenues by formulation, be it cartridges, ampoules or vials. Guided by the company, we make assumptions on capacity, production volumes, and blended price per unit (as summarised in the table below) to derive our CMO forecasts.
Fig. 26: Forecast CMO revenues by formulation
€m 2008e 2009e 2010e 2011e Total CMO revenues 12.5 25.1 30.5 35.6 Growth, % 100.5% 21.4% 16.8% Cartridges capacity (m) 170.0 180.0 190.0 200.0 Cartridges production (m) 77.5 151.4 174.2 193.0 …growth, % 95.3% 15.0% 10.8% Blended price per unit (€) 0.15 0.16 0.17 0.18 Cartridges revenue (€m) 11.6 24.2 29.6 34.7 …growth, % 108.3% 22.2% 17.3% …as a % of CMO revenues 92.8% 96.4% 97.0% 97.5% Injectable ampoules & vials capacity (m) 10.0 10.0 10.0 10.0 Injectable ampoules & vials production (m) 9.0 9.0 9.0 9.0 …growth, % 0.0% 0.0% 0.0% Blended price per unit (€) 0.1 0.1 0.1 0.1 Injectable ampoules & vials revenue (€m) 0.9 0.9 0.9 0.9 …growth, % 0.0% 0.0% 0.0% …as a % of CMO revenues 7.2% 3.6% 3.0% 2.5%
Source: Bryan, Garnier & Co ests.
NB. Historic data is unavailable
5.2. Over 50 years of manufacturing expertise
Pierrel has a proven track record of highly reliable manufacturing, using its state-of-the-art, GMP approved facility. Reputation amongst sponsors through word-of-mouth is known to be an important element in the generation of new contracts. With over 50 years of manufacturing experience Pierrel is renown within the industry. Current contracts with international pharmaceutical companies include: AstraZeneca - a customer since 1998, Solvay, Serono and Dentsply Anaesthetics - a customer since 2002.
The Capua facility, Italy The CMO business is carried out directly by Pierrel at its production plant in Capua, Italy. Manufacturing is based on a broad range of production authorisations from the Italian Ministry of Health and a dedicated infrastructure, compliant with GMP standards. Pierrel has made heavy investments in specialised facilities, technology and know-how.
The site covers 40,000m², dedicated to pharma production and control, and to storage at 6-8°C, 15°C and 25°C. The plant is GMP approved, and has been certified by AIFA (the Italian regulator).

Pierrel
29
Please see the section headed “Important information” on the back cover.
Fig. 27: Pierrel's manufacturing facility in Capua, Italy
Source: Company Data
5.3. The Dentsply contract and an increased capacity offering
We estimate the current total cartridges capacity of the Capua plant to be 170m units, substantially increased from the 40m units possible at the time of the IPO in 2006. Today’s capacity offering has been driven by considerable investment in the Capua plant:
Pierrel invested €6.5m (€3.0m in 2006, and a further €3.5m in 2007) on a new production line for its Capua plant. The modifications were completed in June 2007.
In addition, machinery from the Elk Grove, Illinois factory, bought as part of the Dentsply agreement, was shipped to Italy and placed in the Capua plant.
Pierrel forms a “two-part” 15 year collaboration with Dentsply In September 2006, Pierrel acquired a production plant from Dentsply, and formed a 15-year manufacturing agreement with the company. Pierrel agreed an acquisition price of US$19.5m for Dentsply’s Chicago-based dental anaesthetics manufacturing plant, of which US$3m were paid upfront, with the remaining US$16.5m to be paid via rebates (see Fig. below) on the transfer price of manufactured products.

Pierrel
30
Please see the section headed “Important information” on the back cover.
Pierrel shipped the machines and laboratory equipment to its Italian manufacturing plant in Capua as part of its factory upgrade. The empty property is expected to be sold in 2008 for €3.5m. The €3.5m has already been booked in the 2007 pro-forma accounts, and can be found on the balance sheet under “Other receivables”, in current assets.
The 15 year supply agreement is an extension of the 2002 agreement, allowing Pierrel to expand its production of injectable dental anaesthetics into new markets. Pierrel had already been manufacturing dental anaesthetics for Dentsply since 2002. The original contract covered European geographies and certain other countries such as Saudi Arabia, with a total capacity of approximately 25m cartridges per annum. According to our estimates, the new contract is expected to exceed 100m doses by 2010.
Fig. 28: Dentsply revenue forecasts
2008e 2009e 2010e 2011e Total Dentsply production (m) 26.8 78.9 105.0 105.0 Price per cartridge (€) 0.18 0.18 0.18 0.18 Total Pierrel revenues (€m) 4.8 14.2 18.9 18.9 Rebate rate (€/cartridge) 0.017 0.017 0.017 0.017 Rebate (€m) (0.4) (1.3) (1.8) (1.8) Net Pierrel revenues (€m) 4.4 12.9 17.1 17.1
Source: Bryan, Garnier & Co ests.
We are encouraged by the existing AIFA approval of the Capua plant With the Italian authorities (AIFA) approval under its belt, which is also valid across Europe, Japan, Canada and Australia, Pierrel already holds experience in manufacturing regulatory affairs. We believe this experience and endorsement bodes well for the forthcoming FDA approval.
5.4. High contract renewal rates Due to its history of excellence in execution, Pierrel has demonstrated a high contract renewal rate. Recently Pierrel renewed two significant contracts with international pharmaceutical players:
In December 2007 Pierrel was granted a three-year extension of its manufacturing contract to produce Talofen for Solvay Pharma. The deal is worth up to €2.5m.
In February 2008 Pierrel signed a two year extension of its manufacturing agreement with AstraZeneca worth an estimated €2m.
Furthermore, manufacturing outsourcing relations in the sector are usually long-lasting, particularly in the light of the high technical barriers to entry. As such Pierrel stands to benefit from clear visibility on its revenue streams.

Pierrel
31
Please see the section headed “Important information” on the back cover.
5.5. Broad technical offering Pierrel offers broad technical capabilities for the production of medicinal specialities, clinical trial supplies, and a wide range of active ingredients across numerous formulations.
Pierrel offers manufacturing from raw materials to the finished dosage form Pierrel offers a full range of services in pharmaceutical development including regulatory support, analytical development, pharmaceutical technology and pilot batches for clinical trials:
Dosage Form Development: Close collaboration with clients during the initial stages of product development to create an appropriate dosage form, with optimal levels of drug delivery and reliability to ensure clinical effectiveness, accurate dosage, ease of administration and stability.
Clinical trial supplies: Expertise in all relevant areas of clinical trial supply manufacturing including research and development, blinding, packaging and distribution.
Active ingredients: Over 20 active ingredients have been manufactured by Pierrel over the past 10 years.
Fig. 29: Examples of Pierrel’s manufactured active ingredients
Active ingredient Formulation Acetyl salicylic acid Tablets Lidocaine Injectables, sprays, ointments and creams Amino acids Oral solution, coated tablets and parenterals Buflomedil Coated and sustain release tablets, injectables and drops Prilocaine Injectables; cream
Source: Company Data
Specialties The CMO activity is especially focused on the manufacturing of injectable products with a significant degree of specialisation in the field of cartridges for dental anaesthetics.
The current manufacturing license covers sterile injectable products, glass ampoules produced with terminal sterilisation, glass vials produced with terminal sterilisation, and cartridges produced both aseptically and with terminal sterilisation.

Pierrel
32
Please see the section headed “Important information” on the back cover.
Fig. 30: Examples, from left to right of Pierrel's cartridges, vials and ampoules
Source: Bryan, Garnier & Co
Also:
Oral Liquids: Drops, sprays, syrups
Oral Solids: Tablets; normal, coated, sugar coated and sustained release
Terminal Packaging: Tablets, transdermal patches
Future acquisitions will move Pierrel up the complexity ladder Currently Pierrel’s expertise sits in the medium category in terms of the complexity involved in producing drug substances, and the complexity involved in manufacturing.
Fig. 31: Complexity of drug substance technology
Low Medium High Powder Tablets Sterile powder
Solid tablets Capsules (Freeze-dried) Non-sterile liquids Sterile liquids
Ointments Sterile emulsions Creams Gums Lotions Patches
Suppositories Aerosols
Nasal sprays
Source: NIPT (The National Institute for Pharmaceutical Technology and Education)

Pierrel
33
Please see the section headed “Important information” on the back cover.
Fig. 32: Complexity of manufacturing technology
Low Medium High Non-biologics Biologics General
Without granulation Bags Devices Sachets Vials Controlled release systems Bottles Soft, liquid-filled gels
Regular tablets Soft, semisolid-filled gels Suspensions Nano-systems
Ampoules Micro-encapsulated Layered Syringes Blow-fill-seal Others
Source: NIPT (The National Institute for Pharmaceutical Technology and Education)
A future acquisition, expected in the coming year, of a CMO player with lyophilised manufacturing technology would further distinguish Pierrel from its peers, and make it particularly attractive for partnering with Biotech players.
Lyophilised technology (which comes under “dry powder” formulation) is in high demand amongst Biotech companies as biologics are often designed for lyophilised dry powder formulations. Furthermore, dry powder formulation remains popular among producers as it avoids the cold chain and the necessity for refrigerated distribution, as is often required with biological preparations.
Fig. 33: Pierrel’s shift up the complexity matrix of (liquid) dosage forms
Vial
COMPLEXITY
2007 2008/9
biologicalchemical biologicalchemical biologicalchemical
Ampoule /bag
Vial
COMPLEXITY
2007 2008/9
biologicalchemical biologicalchemical biologicalchemical
Ampoule /bag
2007 2008/9
biologicalchemical biologicalchemical biologicalchemical biologicalchemical biologicalchemical biologicalchemical
Ampoule /bag
Source: NIPT (The National Institute for Pharmaceutical Technology and Education) & Bryan, Garnier & Co

Pierrel
34
Please see the section headed “Important information” on the back cover.
5.6. Increased trial complexity is raising the demand for CMO outsourcing Pierrel is well adapted to benefit from the demand for CMO coming from increased trial complexity in the form of:
Larger multi-centre studies
Adaptive trials
An “adaptive” approach to clinical trial design is being favoured as a way of increasing product development efficiency. Nearly 50% of Life Science companies will have more than 20 studies per year by 2010, of which, 39% will run at least six adaptive trials per annum. The simplest forms of adaptive trials are known as "staged" protocols or "group sequential" trials. Essentially, group-sequential trials are fragmented versions of the classic trial design, giving investigators more opportunities for decision points rather than waiting until the end of the trial to make a go/no-go decision. Adaptive clinical trials bring considerable benefits: accelerating time to endpoint, reducing R&D costs, and allowing candidates likely to fail to be deleted at the earliest possible stage.
Inefficient clinical supply chains will put these complex global trials at risk. The success of these studies is heavily dependent on providing study supplies, often to large numbers of sites so that drugs can be administered at the correct times throughout the study. Issues such as supply stock-outs can result in patients being disqualified, potentially jeopardising an entire study.

Pierrel
35
Please see the section headed “Important information” on the back cover.
6. CRO outperformance to come
Four CRO acquisitions since 2005 transformed Pierrel from a CMO provider, to the only listed European player offering both CMO and CRO services. Pierrel expanded its CRO business by means of external growth, and we estimate CRO sales at €36m in 2008 with a 2008-11 CAGR of 8%.
Pierrel now controls the Swiss company Pharmapart AG, the German company IFE Europe GmbH, the Hungarian company Goodwill Research, and the Hyperphar Group. As such, Pierrel has become a specialist in providing consultancy services in the field of clinical and medical research; in delivering scientific services for the carrying-out of clinical studies, the development, registration and licensing of medicinal products and medical apparatus; as well as in regulatory and marketing consultancy services.
Fig. 34: CRO revenues and margins
€m 2006 2007C 2007PF 2008e 2009e 2010e 2011e CRO revenues 3.3 15.8 30.3 35.7 38.6 41.6 45.0 Growth, % 377% 813% 17.7% 8.0% 8.0% 8.0% As a % of total revenues 24.6% 61.5% 75.4% 72.3% 59.2% 56.4% 54.6% CRO EBITDA (0.4) 0.6 2.4 5.5 6.3 7.9 9.5 CRO EBITDA margin, % nm 4.1% 8.0% 15.3% 16.4% 19.1% 21.1%
Source: Bryan, Garnier & Co ests.
We see a 8% 2008-11e revenues CAGR from Pierrel’s CRO business driven by:
A Pan-European presence.
The successful integration of acquisitions.
Broad therapeutic knowledge and investigator relationships.
An expansion of the network.
A shift towards partner-based alliances.
Pierrel
36
Please see the section headed “Important information” on the back cover.
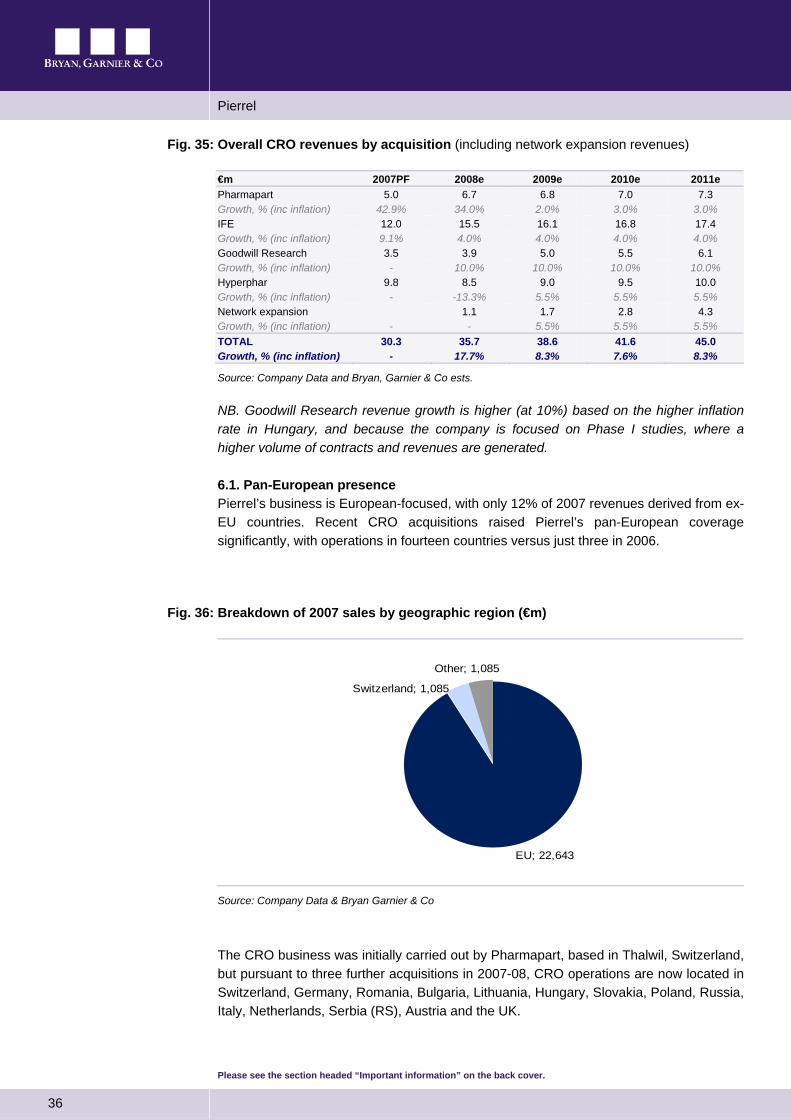
Fig. 35: Overall CRO revenues by acquisition (including network expansion revenues)
€m 2007PF 2008e 2009e 2010e 2011e Pharmapart 5.0 6.7 6.8 7.0 7.3 Growth, % (inc inflation) 42.9% 34.0% 2.0% 3.0% 3.0% IFE 12.0 15.5 16.1 16.8 17.4 Growth, % (inc inflation) 9.1% 4.0% 4.0% 4.0% 4.0% Goodwill Research 3.5 3.9 5.0 5.5 6.1 Growth, % (inc inflation) - 10.0% 10.0% 10.0% 10.0% Hyperphar 9.8 8.5 9.0 9.5 10.0 Growth, % (inc inflation) - -13.3% 5.5% 5.5% 5.5% Network expansion 1.1 1.7 2.8 4.3 Growth, % (inc inflation) - - 5.5% 5.5% 5.5% TOTAL 30.3 35.7 38.6 41.6 45.0 Growth, % (inc inflation) - 17.7% 8.3% 7.6% 8.3%
Source: Company Data and Bryan, Garnier & Co ests. NB. Goodwill Research revenue growth is higher (at 10%) based on the higher inflation rate in Hungary, and because the company is focused on Phase I studies, where a higher volume of contracts and revenues are generated.
6.1. Pan-European presence Pierrel’s business is European-focused, with only 12% of 2007 revenues derived from ex-EU countries. Recent CRO acquisitions raised Pierrel’s pan-European coverage significantly, with operations in fourteen countries versus just three in 2006.
Fig. 36: Breakdown of 2007 sales by geographic region (€m)
EU; 22,643
Other; 1,085
Switzerland; 1,085
Source: Company Data & Bryan Garnier & Co
The CRO business was initially carried out by Pharmapart, based in Thalwil, Switzerland, but pursuant to three further acquisitions in 2007-08, CRO operations are now located in Switzerland, Germany, Romania, Bulgaria, Lithuania, Hungary, Slovakia, Poland, Russia, Italy, Netherlands, Serbia (RS), Austria and the UK.

Pierrel
37
Please see the section headed “Important information” on the back cover.
Fig. 37: Pierrel's Pan-European presence
Corporate HQManufacturingContract Research
BulgariaSlovakia LithuaniaGermanyHungaryPolandRomaniaRussiaSwitzerlandItalyUnited KingdomHollandAustriaSerbia
O
O
O
OO
O
O
O
O
OO
OO
CRO HQ
Ph. 1
Corporate HQManufacturingContract Research
BulgariaSlovakia LithuaniaGermanyHungaryPolandRomaniaRussiaSwitzerlandItalyUnited KingdomHollandAustriaSerbia
O
O
O
OO
O
O
O
O
OO
OO
CRO HQ
Ph. 1
Corporate HQManufacturingContract Research
BulgariaSlovakia LithuaniaGermanyHungaryPolandRomaniaRussiaSwitzerlandItalyUnited KingdomHollandAustriaSerbia
O
O
O
OO
O
O
O
O
OO
OO
CRO HQ
Ph. 1
Source: Company Data & Bryan Garnier & Co
6.2. Pierrel is benefiting from the shift towards partner-based alliances
In the face of a challenging global operating environment, biopharmaceutical companies are looking to consistently increase CRO efficiency and performance. A 2008 Tufts study of ten biopharmaceutical companies found that sponsors are poised to move from widely-followed transactional outsourcing practices to more strategic, partner-based relationships. This transition signals a profound shift that has major implications for internal management decision-making processes and structures and for the CRO marketplace.
Traditionally, sponsors outsourced on an ad hoc, per project basis, driven by insufficient internal personnel capacity to perform a given task or function. Under transactional relationships, sponsors typically interact with a large number of service providers, both full-service and niche. Additionally, sponsors contract full-time staff to supplement internal capacity.
Typically, in transactional relationships, once CROs are selected, sponsors tend to micro-manage the relationship in order to ensure communication and coordination with the project team, as well as adherence to the sponsor's own standard operating procedures. Middle managers usually serve as the primary parties involved in outsourcing planning and governance.

Pierrel
38
Please see the section headed “Important information” on the back cover.
7. Integration and Generics potential
Pierrel’s strategic aim is to make the group the outsourcing partner of choice for mid-sized pharmaceutical and generic drug companies. To this end, successfully establishing group integration is key, not only in terms of aligning the recent CRO acquisitions, but also in terms of CRO & CMO integration.
The successful integration of Pierrel’s two principal business units will allow the company to capitalise on its expansive solutions offering; from target identification to manufacturing and marketing.
The aim is to go beyond leveraging commercial synergies, and to gradually upgrade the project portfolio from transaction-based outsourcing projects to more global, extended and profitable partnerships, which require both CRO and CMO competencies.
An integrated offering is expected to drive future revenues by facilitating Pierrel’s Generic Medicines Service. Pierrel intends to offer “ready-to-sell” generic medicines to generic drug companies, leveraging its expertise in drug sourcing, patent law, manufacturing and marketing.
7.1. Integration synergies Pierrel is an integrated group, capable of assisting its customers with the outsourcing of the characteristic phases of the research, development and production of a medicinal entity.
The close relationship between CMO and CRO activities gives clients access to a valuable mix of skill sets and capabilities, and affords Pierrel a competitive advantage in the acquisition of new projects and orders.

Pierrel
39
Please see the section headed “Important information” on the back cover.
Fig. 38: Integrated service structure
Marketing & Distribution
Pre-clinical studies (animal)
Selection of possible products Screening/Delivery
Clinical Studies Phases I/II/III
Registration (EMEA, National Authority)
GMP Production
Marketing Support (Partner, licensing.. )
Consulting
Not covered
Services
CMO
CRO
Marketing & Distribution
Pre-clinical studies (animal)
Selection of possible products Screening/Delivery
Clinical Studies Phases I/II/III
Registration (EMEA, National Authority)
GMP Production
Marketing Support (Partner, licensing.. )
Consulting
Not covered
Services
CMO
CRO
Source: Bryan, Garnier & Co
7.2. Future revenues coming from Pierrel’s Generic Medicines Service
A growing importance given to the generic drug business is a key element in Pierrel’s strategy. The Company imminently intends to reinforce its capabilities in the legal authorisation of generics (CRO) and its relevant production support (CMO). The company is presently looking at M&A opportunities that will allow it to include other forms (possibly solid) in its CMO service offering that are more widely used for generic drugs.
The integration of CMO and CRO services are critical factors in the possible outsourcing of generic drugs. Indeed the "comparative bioavailability" studies (i.e. the studies that compare the generic drug with the original brand name drug) include demonstrations that not only the ingredients, but also the manufacturing processes and facilities meet regulatory acceptance.

Pierrel
40
Please see the section headed “Important information” on the back cover.
7.3. Combined CRO/CMO offering enhances clinical supply chain efficiency
Pierrel’s combined CRO and CMO offering facilitates strong communication between those executing the trial, and those responsible for manufacturing the clinical trial supply. Forecasting trial stock requirements is difficult, particularly with the rise of adaptive trials. Patient recruitment occurs at different speeds and patients sometimes drop out of trials before study completion. Effective communication and planning between CRO and CMO business units ensures a timely and reliable clinical trial supply.
CRO & CMO synergies eliminate unexpected regulatory setbacks Ease and expense of patient recruitment is a key reason why companies are looking further afield to perform studies. However, the need to comply with GMP (Good Manufacturing Practice) regulations presents a significant challenge in the compliant shipment of the drug to multiple trial sites. Offering both CRO and CMO platforms under one management roof, safeguards against unexpected regulatory difficulties arising for poorly matched trial and supply sites.

Pierrel
41
Please see the section headed “Important information” on the back cover.
8. Risks
8.1. FDA approval of the Capua manufacturing facility In order to achieve some of the targets in the 2008–11 business plan, Pierrel is counting on FDA approval of its Capua facility by the end of 1H09, to ensure the plant is compliant with certain manufacturing standards. Any delay in the approval process beyond this, could negatively affect the achievement of such targets.
8.2. Dependency on key employees Some of the activities of Pierrel are closely connected to the services provided by members of the current top management. The loss of such individuals and/or the inability to attract, train or retain further qualified employees could cause a decrease in group competitiveness and impact future growth.
8.3. Unsuccessful acquisition integration Should Pierrel be unsuccessful in integrating its recent CRO acquisitions, forecast upside, in terms of network expansion and synergy generation would not be realised.
8.4. High concentration on certain clients Pierrel is dependent on a few clients, representing a significant percentage of its annual sales. This risk is more applicable to its CMO business relative to CRO.
8.5. Regulatory framework for Contract Manufacturing and Contract Research The Contract Manufacturing and Contract Research activities currently performed by Pierrel are subject to stringent regulation both in Italy and overseas, in relation to the performance of research and development for pharmaceutical products and to their production and subsequent marketing.
8.6. Replacement of certain suppliers In the Contract Manufacturing activity, the regulatory framework imposes significant restrictions on Pierrel, concerning the sourcing of raw materials necessary to produce drugs. Raw materials may only be purchased from qualified suppliers. The potential stoppage of such supplies by these producers could therefore cause a reduction in Pierrel’s turnover.
8.7. Execution of development strategies Pierrel’s development strategies include expanding the range of offered products and services, particularly in the area of generic drugs, and the sale of dental and oral hygiene products. In this respect, Pierrel has already incurred costs and made investments to support these initiatives and expects to continue to do so in the future.
8.8. Increased competition Growth perspectives for the Contract Manufacturing and Contract Research market could attract large international or national operators in adjacent sectors and cause an increase in competition. In this event, if Pierrel was unable to compete adequately with such an increase in competition, revenues could be adversely affected.

Pierrel
42
Please see the section headed “Important information” on the back cover.
9. Financials
Fig. 39: Income Statement (€m)
€m 2005 2006 2007C 2007PF 2008e 2009e 2010e 2011e 2012e Total revenues 3.0 13.5 25.8 40.2 49.4 65.2 73.9 82.4 92.1 Growth, % 344.6% 90.9% 198.2% 22.7% 32.0% 13.4% 11.6% 11.7% Core revenues 13.5 25.1 39.6 48.2 63.7 72.1 80.6 90.2 Growth, % na 86.0% 193.4% 21.9% 32.0% 13.3% 11.7% 11.9% ...of which CMO 10.2 9.3 9.3 12.5 25.1 30.5 35.6 41.6 …growth, % na -9.0% -9.0% 35.4% 100.5% 21.4% 16.8% 16.8% …as a % of total revenues 75.4% 35.9% 23.0% 25.4% 38.6% 41.3% 43.2% 45.2% ...of which CRO 3.3 15.8 30.3 35.7 38.6 41.6 45.0 48.6 …growth, % na 377.1% 813.1% 17.7% 8.0% 8.0% 8.0% 8.0% …as a % of total revenues 24.6% 61.5% 75.4% 72.3% 59.2% 56.4% 54.6% 52.8% Other revenues (Pierrel Dental & Nature Concept) - 0.7 0.7 1.1 1.5 1.7 1.8 1.9 Growth, % na na 0.0% 71.0% 31.3% 17.4% 4.0% 3.0% As a % of total revenues nm 2.6% 1.6% 2.3% 2.3% 2.3% 2.2% 2.0% Cost of goods sold (37.6) (43.6) (51.5) (56.7) (62.0) (69.3) As a % of revenues 93.4% 88.4% 79.1% 76.8% 75.2% 75.3% Gross profit 2.7 5.7 13.6 17.2 20.5 22.8 Gross margin, % 6.6% 11.6% 20.9% 23.2% 24.8% 24.7% General & Administrative expenses (4.6) (3.9) (4.0) (4.2) (4.3) (4.7) Operating expenses (2.8) (14.7) (29.5) (42.2) (47.6) (55.6) (60.9) (66.2) (74.0) As a % of revenues 93.5% 108.8% 114.6% 104.9% 96.4% 85.3% 82.5% 80.4% 80.4% EBITDA 0.2 (1.2) (3.8) (2.0) 1.8 9.6 13.0 16.2 18.0 EBITDA margin, % 6.5% nm nm nm 3.6% 14.7% 17.5% 19.6% 19.6% ...of which CMO EBITDA (0.8) (3.6) (3.6) (3.7) 3.1 4.8 6.4 7.5 …CMO EBITDA margin, % nm nm nm nm 12.4% 15.8% 18.1% 18.1% ...of which CRO EBITDA (0.4) 0.6 2.4 5.5 6.3 7.9 9.5 10.3 …CRO EBITDA margin, % nm 4.1% 8.0% 15.3% 16.4% 19.1% 21.1% 21.1% ...of which Other EBITDA - (0.8) (0.7) 0.1 0.1 0.2 0.2 0.2 …Other EBITDA margin, % nm nm nm 7.1% 9.4% 12.0% 12.7% 12.7% Depreciation & Amortisation (0.1) (0.6) (1.4) (1.8) (2.0) (1.9) (1.9) (1.9) (1.9) As a % of Tangible & Intangible assets 0.4% 2.2% 3.7% 3.9% 4.4% 4.3% 4.3% 4.3% 4.2% EBIT 0.1 (1.8) (5.1) (3.8) (0.2) 7.7 11.1 14.3 16.1 EBIT margin, % 4.7% nm nm nm nm 11.8% 15.0% 17.3% 17.5% Finance income (losses), net (0.1) (0.6) (0.4) (1.2) (0.9) (0.9) (0.8) (0.6) (0.3) PBT (Profit before income tax) 0.0 (2.3) (5.6) (5.0) (1.1) 6.8 10.3 13.7 15.8 Income tax expense (0.0) 0.3 0.9 0.5 0.4 (2.2) (3.4) (4.5) (5.2) Tax rate, % 123.1% 12.7% 15.9% 9.9% 33.0% 33.0% 33.0% 33.0% 33.0% Result for the period (0.0) (2.0) (4.7) (4.5) (0.7) 4.5 6.9 9.2 10.6 Minorities 0.0 (0.2) (0.1) (0.1) Net profit (loss) (0.1) (1.9) (4.6) (4.4) (0.7) 4.5 6.9 9.2 10.6 Net margin, % nm nm nm nm nm 7.0% 9.3% 11.1% 11.5% Weighted average number of shares (m) - 8.3 10.2 10.2 10.2 10.2 10.2 10.2 10.2 Earnings per share (€) - (0.22) (0.46) (0.43) (0.07) 0.45 0.68 0.90 1.0 EPS growth, % na nm nm nm nm nm 52% 33% 16%
Source: Bryan, Garnier & Co ests.
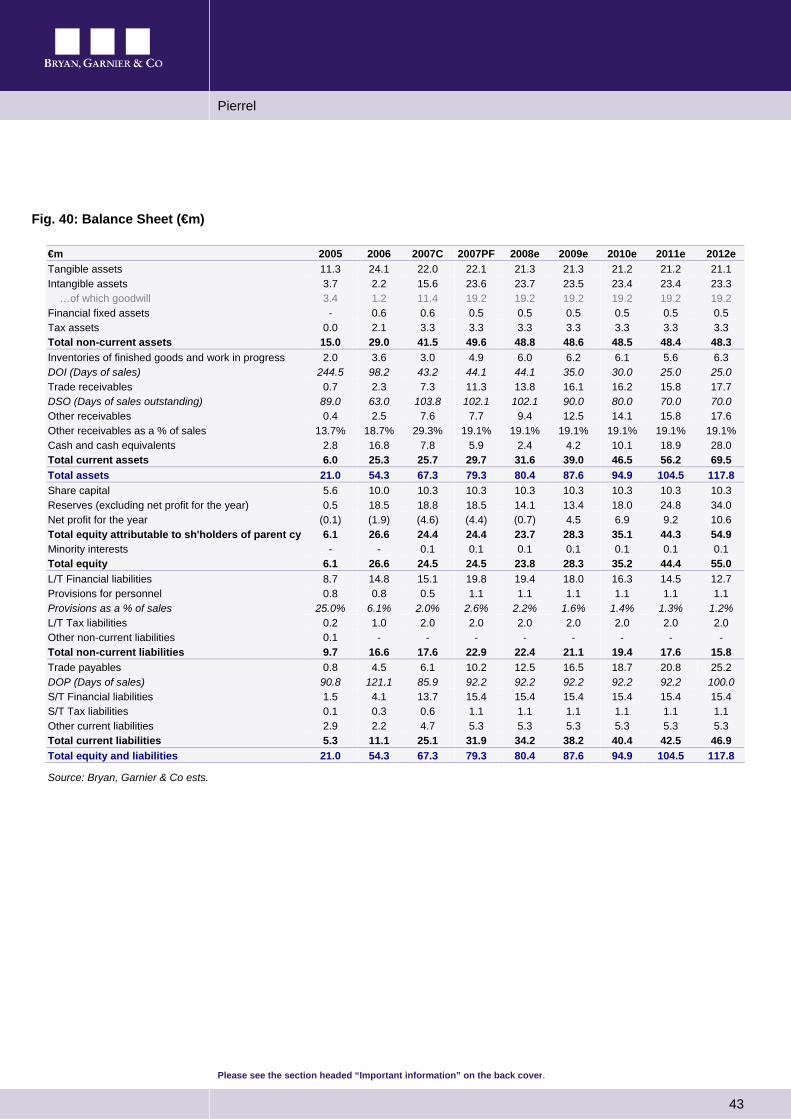
Pierrel
43
Please see the section headed “Important information” on the back cover.
Fig. 40: Balance Sheet (€m)
€m 2005 2006 2007C 2007PF 2008e 2009e 2010e 2011e 2012e Tangible assets 11.3 24.1 22.0 22.1 21.3 21.3 21.2 21.2 21.1 Intangible assets 3.7 2.2 15.6 23.6 23.7 23.5 23.4 23.4 23.3 …of which goodwill 3.4 1.2 11.4 19.2 19.2 19.2 19.2 19.2 19.2 Financial fixed assets - 0.6 0.6 0.5 0.5 0.5 0.5 0.5 0.5 Tax assets 0.0 2.1 3.3 3.3 3.3 3.3 3.3 3.3 3.3 Total non-current assets 15.0 29.0 41.5 49.6 48.8 48.6 48.5 48.4 48.3 Inventories of finished goods and work in progress 2.0 3.6 3.0 4.9 6.0 6.2 6.1 5.6 6.3 DOI (Days of sales) 244.5 98.2 43.2 44.1 44.1 35.0 30.0 25.0 25.0 Trade receivables 0.7 2.3 7.3 11.3 13.8 16.1 16.2 15.8 17.7 DSO (Days of sales outstanding) 89.0 63.0 103.8 102.1 102.1 90.0 80.0 70.0 70.0 Other receivables 0.4 2.5 7.6 7.7 9.4 12.5 14.1 15.8 17.6 Other receivables as a % of sales 13.7% 18.7% 29.3% 19.1% 19.1% 19.1% 19.1% 19.1% 19.1% Cash and cash equivalents 2.8 16.8 7.8 5.9 2.4 4.2 10.1 18.9 28.0 Total current assets 6.0 25.3 25.7 29.7 31.6 39.0 46.5 56.2 69.5 Total assets 21.0 54.3 67.3 79.3 80.4 87.6 94.9 104.5 117.8 Share capital 5.6 10.0 10.3 10.3 10.3 10.3 10.3 10.3 10.3 Reserves (excluding net profit for the year) 0.5 18.5 18.8 18.5 14.1 13.4 18.0 24.8 34.0 Net profit for the year (0.1) (1.9) (4.6) (4.4) (0.7) 4.5 6.9 9.2 10.6 Total equity attributable to sh'holders of parent cy 6.1 26.6 24.4 24.4 23.7 28.3 35.1 44.3 54.9 Minority interests - - 0.1 0.1 0.1 0.1 0.1 0.1 0.1 Total equity 6.1 26.6 24.5 24.5 23.8 28.3 35.2 44.4 55.0 L/T Financial liabilities 8.7 14.8 15.1 19.8 19.4 18.0 16.3 14.5 12.7 Provisions for personnel 0.8 0.8 0.5 1.1 1.1 1.1 1.1 1.1 1.1 Provisions as a % of sales 25.0% 6.1% 2.0% 2.6% 2.2% 1.6% 1.4% 1.3% 1.2% L/T Tax liabilities 0.2 1.0 2.0 2.0 2.0 2.0 2.0 2.0 2.0 Other non-current liabilities 0.1 - - - - - - - - Total non-current liabilities 9.7 16.6 17.6 22.9 22.4 21.1 19.4 17.6 15.8 Trade payables 0.8 4.5 6.1 10.2 12.5 16.5 18.7 20.8 25.2 DOP (Days of sales) 90.8 121.1 85.9 92.2 92.2 92.2 92.2 92.2 100.0 S/T Financial liabilities 1.5 4.1 13.7 15.4 15.4 15.4 15.4 15.4 15.4 S/T Tax liabilities 0.1 0.3 0.6 1.1 1.1 1.1 1.1 1.1 1.1 Other current liabilities 2.9 2.2 4.7 5.3 5.3 5.3 5.3 5.3 5.3 Total current liabilities 5.3 11.1 25.1 31.9 34.2 38.2 40.4 42.5 46.9 Total equity and liabilities 21.0 54.3 67.3 79.3 80.4 87.6 94.9 104.5 117.8
Source: Bryan, Garnier & Co ests.

Pierrel
44
Please see the section headed “Important information” on the back cover.
Fig. 41: Cash Flow Statement (€m)
€m 2005 2006 2007C 2007PF 2008e 2009e 2010e 2011e 2012e Net profit (loss) (0.0) (2.0) (4.7) (4.5) (0.7) 4.5 6.9 9.2 10.6 (+) Depreciation 0.1 0.1 1.0 1.4 1.1 1.1 1.1 1.1 1.1 (+) Amortisation 0.5 0.4 0.4 0.9 0.9 0.8 0.8 0.8 (+) Accruals and impairment 0.1 0.2 0.3 0.3 (+) Increase (decrease) in provisions 0.0 0.1 (0.3) 0.2 - - - - - (+) Decrease (increase) in working capital requirement 1.6 0.0 (0.7) (2.3) (3.1) (1.6) 0.6 1.3 0.1 (+) Increase (decrease) in tax assets 0.0 (0.4) (0.6) (0.7) - - - - - (+) Income tax (paid) credited (0.6) (0.1) 0.3 (0.1) (+) Increase (decrease) in other assets & liabilities (0.3) (2.4) (0.6) 0.3 - - - - - Net cash from operating activities 1.0 (4.1) (5.0) (5.0) (1.8) 4.9 9.4 12.4 12.6 (-) Capex (0.5) (4.8) (6.1) (14.4) (2.2) (1.8) (1.8) (1.8) (1.8) ...Purchase of property, plant and equipment (0.3) (4.2) (4.8) (11.7) (1.2) (1.1) (1.0) (1.0) (1.0) ...As a % of sales 9.4% 31.2% 18.5% 29.1% 2.5% 1.7% 1.4% 1.2% 1.0% ...Purchase of intangible assets (0.3) (0.6) (1.3) (2.7) (1.0) (0.7) (0.7) (0.8) (0.8) ...As a % of sales 8.5% 4.5% 5.1% 6.6% 2.0% 1.0% 1.0% 1.0% 0.9% (-) Acquisitions of subsidiaries, net of cash acquired (0.0) - (12.1) (11.2) (+/-) Net proceeds from sale of tangible assets - 0.0 3.8 3.8 1.0 (+) Increase (decrease) in other non-current assets (0.0) (0.6) 0.0 0.0 Net cash used in investing activities (0.6) (5.4) (14.4) (21.8) (1.2) (1.8) (1.8) (1.8) (1.8) (+) Increase (decrease) in current financing - 1.6 0.2 0.2 - - - - - (+) Increase (decrease) in new financing 0.7 2.6 8.5 14.0 (-) Repayment of financing - (0.3) (3.8) (3.8) (0.4) (1.3) (1.8) (1.8) (1.8) (+) Increase (decrease) in L/T financing - - 2.8 2.8 (+) Increase (decrease) in Equity (net of costs) 1.6 19.8 2.7 2.7 Net cash used in financing activities 2.4 23.6 10.4 15.9 (0.4) (1.3) (1.8) (1.8) (1.8) Net change in cash and cash equivalents 2.8 14.0 (9.0) (10.8) (3.5) 1.8 5.8 8.9 9.0 Cash and cash equivalents on 1 January 2.8 16.8 16.8 6.0 2.5 4.3 10.1 19.0 Cash and cash equivalents at period end 2.8 16.8 7.8 6.0 2.5 4.3 10.1 19.0 28.0
Source: Bryan, Garnier & Co ests.

Pierrel
45
Please see the section headed “Important information” on the back cover.

Pierrel
46
Please see the section headed “Important information” on the back cover.
Bryan Garnier stock rating system For the purposes of this Report, the Bryan Garnier stock rating system is defined as follows: Stock rating BUY Share price expected to rise in excess of 20% from initiation over a 12
months investment horizon, outperforming the market & peers on an unweighted basis. This rating takes into account improving fundamentals and valuation, with a target price derived using one of the following methods: DCF, SOTP, peer comparisons and EVA. All quoted prices on this research report, are closing prices on Friday 27th June 2008.
SELL Share price expected to fall in excess of 20% from initiation over a 12 months investment horizon, underperforming the market & peers on an unweighted basis. This rating takes into account deteriorating fundamentals and valuation, with a target price derived using one of the following methods: DCF, SOTP, peer comparisons and EVA. All quoted prices on this research report, are closing prices on 27th Friday June 2008.
Distribution of stock ratings In the last quarter, Bryan Garnier research ratings comprised: BUY ratings 64% SELL ratings 36%

Pierrel
47
Please see the section headed “Important information” on the back cover.
Research Disclosure Legend 1 Bryan Garnier
shareholding in Issuer Bryan Garnier & Co Limited or another company in its group (together, the “Bryan Garnier Group”) has a shareholding that, individually or combined, exceeds 5% of the paid up and issued share capital of a company that is the subject of this Report (the “Issuer”).
No
2 Issuer shareholding in Bryan Garnier
The Issuer has a shareholding that exceeds 5% of the paid up and issued share capital of one or more members of the Bryan Garnier Group.
No
3 Financial interest A member of the Bryan Garnier Group holds one or more financial interests in relation to the Issuer which are significant in relation to this report
No
4 Market maker or liquidity provider
A member of the Bryan Garnier Group is a market maker or liquidity provider in the securities of the Issuer or in any related derivatives.
No
5 Lead/co-lead manager In the past twelve months, a member of the Bryan Garnier Group has been lead manager or co-lead manager of one or more publicly disclosed offers of securities of the Issuer or in any related derivatives.
No
6 Investment banking agreement
A member of the Bryan Garnier Group is or has in the past twelve months been party to an agreement with the Issuer relating to the provision of investment banking services, or has in that period received payment or been promised payment in respect of such services.
Yes
7 Research agreement A member of the Bryan Garnier Group is party to an agreement with the Issuer relating to the production of this Report.
Yes
8 Analyst receipt or purchase of shares in Issuer
The investment analyst or another person involved in the preparation of this Report has received or purchased shares of the Issuer prior to a public offering of those shares.
No
9 Remuneration of analyst
The remuneration of the investment analyst or other persons involved in the preparation of this Report is tied to investment banking transactions performed by the Bryan Garnier Group.
No
10 Corporate finance client
In the past twelve months a member of the Bryan Garnier Group has been remunerated for providing corporate finance services to the issuer or may expect to receive or intend to seek remuneration for corporate finance services from the Issuer in the next six months.
Yes
11 Analyst has short position
The investment analyst or another person involved in the preparation of this Report has a short position in the securities or derivatives of the Issuer.
No
12 Analyst has long position
The investment analyst or another person involved in the preparation of this Report has a long position in the securities or derivatives of the Issuer.
No
13 Bryan Garnier executive is an officer
A partner, director, officer, employee or agent of the Bryan Garnier Group, or a member of such person’s household, is a partner, director, officer or an employee of, or adviser to, the Issuer or one of its parents or subsidiaries. The name of such person or persons is disclosed above.
No
14 Other disclosures Other specific disclosures: Report sent to Issuer to verify factual accuracy (with the recommendation/rating, price target/spread and summary of conclusions removed).
Yes
Except as stated above, Bryan Garnier & Co Limited is not aware of any material conflicts of interest for the research analyst, of which the research analyst knows or has reason to know in the preparation of this Report. A copy of the Bryan Garnier & Co Limited conflicts policy in relation to the production of research is available at www.bryangarnier.com

London 36 Queen Street London EC4R 1BN Tel: +44 (0) 207 332 2500 Fax: +44 (0) 207 332 2559 Authorised and regulated by the Financial Services Authority (FSA)
Paris 33, Avenue de Wagram 75017 Paris Tel: +33 (0) 1 56 68 75 00 Fax: +33 (0) 1 56 68 75 01 Regulated by l’Autorité des Marchés Financiers (AMF)
Geneva 24 Avenue de Champel 1206 Geneva Tel: + 41 (0) 22 347 7555 Fax: +41 (0) 22 347 7556 Regulated by the Swiss Federal Banking Commission
Important information This non-independent research report (the “Report”) was prepared by Bryan Garnier & Co Limited and is being distributed only to clients of Bryan Garnier & Co Limited (the “Firm”). Bryan Garnier & Co Limited is authorised and regulated by the Financial Services Authority (the “FSA”) and is a member of the London Stock Exchange. This Report has been sent to you for marketing purposes. It is non-independent research within the meaning of the FSA rules. It is not being held out as an objective or independent explanation of the matters contained in it and should not be treated as such. It has not been prepared in accordance with the legal requirements designed to promote the independence of investment research. Accordingly, the Firm is not subject to any prohibition on dealing ahead of the dissemination of investment research. This Report focuses on emerging European growth companies. The contents of this Report as well as the other research documents on emerging growth stocks do not contain the Firms’ usual stock ratings. The intrinsic value analysis is presented to provide a framework for stock valuation and discussion, and represents an estimated value on the date of publishing, which may be subject to change without notice. The Firms’ rationale for not having ratings on the stock includes the fact that such stock may have limited market capitalisation and liquidity and while the Firms may express an opinion on the near-term movement of the stock, what action investors should take depends on many factors, including liquidity/risk tolerance, holdings timeframe and investment philosophy. Emerging companies evolve rapidly with a continuous flow of information that can significantly impact the company and in the Firm’s opinion this cannot be reflected by a periodic rating. Additionally, the Firms may have an advisory relationship with the company which is the subject of the Report, including for the production of sponsored research, and may expect to receive or intend to seek compensation for investment banking services from that company in the six months following the date of this Report. This Report may not be reproduced, distributed or published by you for any purpose except with the Firms’ prior written permission. The Firm reserves all rights in relation to this Report. To the fullest extent permitted by law, the Firms do not accept any liability whatsoever for any direct or consequential loss arising from any use of the information contained in this Report. Information may be available to the Firm which is not reflected in this Report. This Report is provided for information purposes only and does not constitute an offer or solicitation to buy or sell any of the securities discussed in it. The Report is for general circulation to clients of the Firm and as such is not, and should not be construed as, investment advice or a personal recommendation. No account is taken of the investment objectives, financial situation or particular needs of any person. Past performance information contained in this Report is not an indication of future performance. The information in this Report has not been audited or verified by an independent party and should not be seen as any indication of returns which might be received by investors. Similarly, where projections, forecasts, targeted or illustrative returns or related statements or expressions of opinion are given (“Forward Looking Information”) they should not be regarded as a guarantee, prediction or definitive statement of fact or probability. Actual events and circumstances are difficult or impossible to predict and will differ from assumptions. A number of factors, in addition to the risk factors stated in this Report, could cause actual results to differ materially from those in any Forward Looking Information. Disclosures specific to clients in the United Kingdom This Report has not been approved by Bryan Garnier & Co Limited for the purposes of section 21 of the Financial Services and Markets Act 2000 because it is being distributed in the United Kingdom only to persons who have been classified by Bryan Garnier & Co Limited as professional clients or eligible counterparties. Any recipient who is not such a person should return the Report to Bryan Garnier & Co Limited immediately and should not rely on it for any purposes whatsoever.