investigation on wind power potential on hong kong islands—an analysis of wind power and wind...
TRANSCRIPT
Renewable Energy 27 (2002) 1–12www.elsevier.com/locate/renene
Investigation on wind power potential on HongKong islands—an analysis of wind power and
wind turbine characteristics
Lin Lu*, Hongxing Yang, John BurnettCenter for Development of Solar Energy Technology, Department of Building Services Engineering,
The Hong Kong Polytechnic University, Hong Kong
Received 16 October 2001; accepted 11 January 2002
Abstract
This paper discusses the potential for electricity generation on Hong Kong islands throughan analysis of the local weather data and typical wind turbine characteristics. An optimumwind speed, uop, is proposed to choose an optimal type of wind turbine for different weatherconditions. A simulation model has been established to describe the characteristics of a parti-cular wind turbine. A case study investigation allows wind speed and wind power density tobe obtained using different hub heights, and the annual power generated by the wind turbineto be simulated. The wind turbine’s capacity factor, being the ratio of actual annual powergeneration to the rated annual power generation, is shown to be 0.353, with the capacity factorin October as high as 0.50. The simulation shows the potential for wind power generation onthe islands surrounding Hong Kong. 2002 Elsevier Science Ltd. All rights reserved.
Keywords: Capacity factor; Optimum wind speed; Wind turbine characteristics; Wind power density;Wind power generation
1. Introduction
Potential applications of renewable energy have been on the Hong Kong govern-ment’s working agenda in recent years. Wind power is one of the potential renewableenergy resources for this location, due to the strong winds on the islands surrounding
* Corresponding author. Tel.: +852-2766-4559; fax: +852-2774-6146.E-mail addresses: [email protected] (L. Lu); [email protected] (H. Yang).
0960-1481/02/$ - see front matter 2002 Elsevier Science Ltd. All rights reserved.PII: S 09 60 -1481( 01 )0 0164-1
2 L. Lu et al. / Renewable Energy 27 (2002) 1–12
Hong Kong Island and the Kowloon Peninsula. Taking Waglan Island as an example,the average annual wind speed is 6.92 m/s at 26.3 m above ground level, 82 m abovesea level, as obtained from the weather data recorded by the Hong Kong Observatory.A mean wind speed such as this is very high for wind power applications [1].
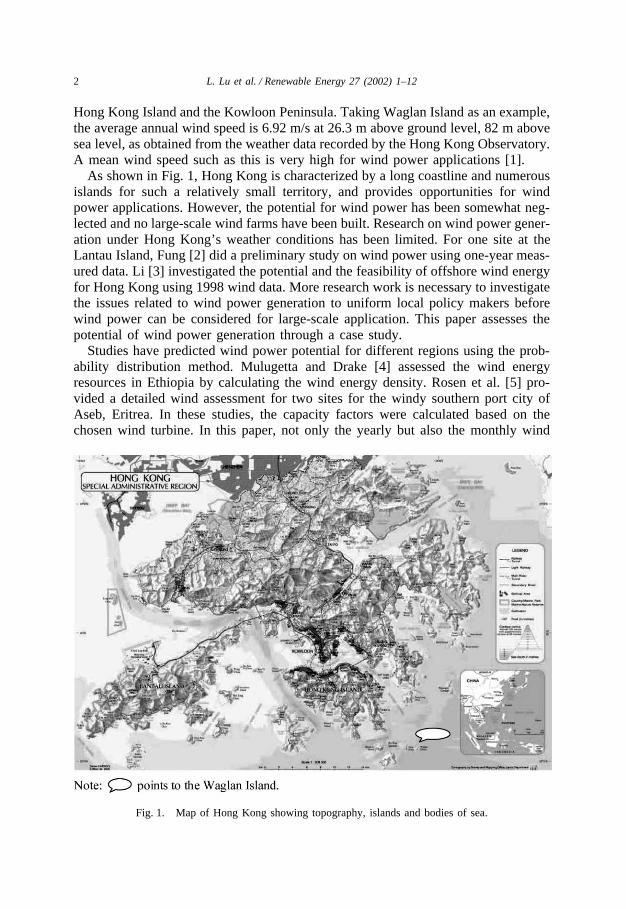
As shown in Fig. 1, Hong Kong is characterized by a long coastline and numerousislands for such a relatively small territory, and provides opportunities for windpower applications. However, the potential for wind power has been somewhat neg-lected and no large-scale wind farms have been built. Research on wind power gener-ation under Hong Kong’s weather conditions has been limited. For one site at theLantau Island, Fung [2] did a preliminary study on wind power using one-year meas-ured data. Li [3] investigated the potential and the feasibility of offshore wind energyfor Hong Kong using 1998 wind data. More research work is necessary to investigatethe issues related to wind power generation to uniform local policy makers beforewind power can be considered for large-scale application. This paper assesses thepotential of wind power generation through a case study.
Studies have predicted wind power potential for different regions using the prob-ability distribution method. Mulugetta and Drake [4] assessed the wind energyresources in Ethiopia by calculating the wind energy density. Rosen et al. [5] pro-vided a detailed wind assessment for two sites for the windy southern port city ofAseb, Eritrea. In these studies, the capacity factors were calculated based on thechosen wind turbine. In this paper, not only the yearly but also the monthly wind
Fig. 1. Map of Hong Kong showing topography, islands and bodies of sea.
3L. Lu et al. / Renewable Energy 27 (2002) 1–12
speed probability density and wind power density (for different ground levels) arecalculated to assess the wind power potential for Hong Kong islands. The results ofthe wind speed distribution and wind power density are related to the preferredheights, so that the height, being one important factor, must be established, but whichis neglected in most studies. Here, the power generated by a particular wind turbineand its capacity factors are investigated for different hub heights.
2. Simulation of wind power and wind turbine characteristics
2.1. Probability density function
There are several density functions that can be used to describe the wind speedfrequency curve. Here, the Weibull distribution is used to describe the wind speeddistribution. The wind speed probability density function (pdf) can be described as[6]:
f(v) �kc�v
c�k�1
exp���vc�k� (k�0,v�0,c�1) (1)
where c is the scale parameter, unit of speed; k is the shape parameter; v is windspeed.
Once the mean and variance of the wind speed are known, the following approxi-mation can be used to calculate the Weibull parameters c and k:
k � �sv̄��1.086
(1�k�10) (2)
c �v̄
�(1 � 1/k)(3)
where
v̄ �1n�
n
i � 1
vi
and
s2 �1
n�1�n
i � 1
(vi�v̄)2
2.2. Wind-speed variation with height
Wind speed near to the ground changes with height, which requires an equationthat predicts the wind speed at one height in terms of the measured speed at another
4 L. Lu et al. / Renewable Energy 27 (2002) 1–12
height. For a wind turbine, it is also necessary to know the wind speed at its hubcenter. The most common expression is the power law, expressed as:
v � v0� zz0�a (4)
where v is wind speed estimated at desired height, z; v0 is wind speed measured atthe reference height, z0; a is the ground surface friction coefficient.
The exponent a varies with height, time of day, season, nature of the terrain, windspeeds, and temperature. For relatively low heights from the ground, the values ofa for typical classes are given in [7]. In this study, without specific site data, theone-seventh-power law ratio is applied [6].
2.3. The average power in the wind
The average power in the wind can be expressed as:
P̄w �12rA�
�
0
v3f(v)dv (5)
If f(v) is the Weibull density function, the average power becomes:
P̄w �rAv̄3�(1 � 3/k)2[�(1 � 1/k)]3 (6)
2.4. The optimum wind speed
The optimum wind speed for a wind turbine, uop, is the speed that produces themost energy [6]. The wind turbine should be chosen with a rated wind speed thatmatches this maximum-energy wind speed for maximizing energy output. The calcu-lation can be written as:
uop � c�k � 2k �1/k
(m/s) (7)
Once uop is obtained for one site, the optimal rated wind speed of a wind turbinecan be found. For the annual energy output, the chosen wind turbine will have thehighest capacity factor, defined by the ratio of the actual power generated to therated power output.
2.5. Power output characteristics of wind turbines
Different wind generators have different power output performance curves, so themodel used to describe the performance is also different. In most literature [8–11],the following equation is used to simulate the power output of a wind turbine:

5L. Lu et al. / Renewable Energy 27 (2002) 1–12
Pw(v) � �PR
vk�vkC
vkR�vk
C
(vC�v�vR)
PR (vR�v�vF)
0 (v�vC and v�vF)
(8)
where PR is the rated electrical power; vC is the cut-in wind speed; vR is the ratedwind speed; vF is the cut-off wind speed; k is the Weibull shape parameter.
This model is simplified when the wind speed is higher than rated speed. In studiesby Alhusein et al. [12] and Kim et al. [13], a quadratic function was used for simul-ation, i.e.
Pw(v) � av2 � bv � c (9)
3. A case study for wind power potential analysis
Waglan Island is chosen for the case study. As shown in Fig. 1, Waglan Islandis located on the southeast of the territory with no surrounding mountains. Ameteorological data recording station is located on the island and operated by theHong Kong Observatory. In this paper the recorded data from 1989 to 1995 is usedfor analysis.
3.1. Yearly probability density function
As there are no calms (zero wind speeds) in the wind data, the calculation resultsmeet the Weibull distribution. From the recorded wind data, the shape parameter kis found to be 1.99, and the scale parameter c is 7.8 m/s using Eqs. (1)–(3). Thedistribution is shown in Fig. 2.
Fig. 2. Yearly wind probability density (k=1.99, c=7.81 m/s).
6 L. Lu et al. / Renewable Energy 27 (2002) 1–12
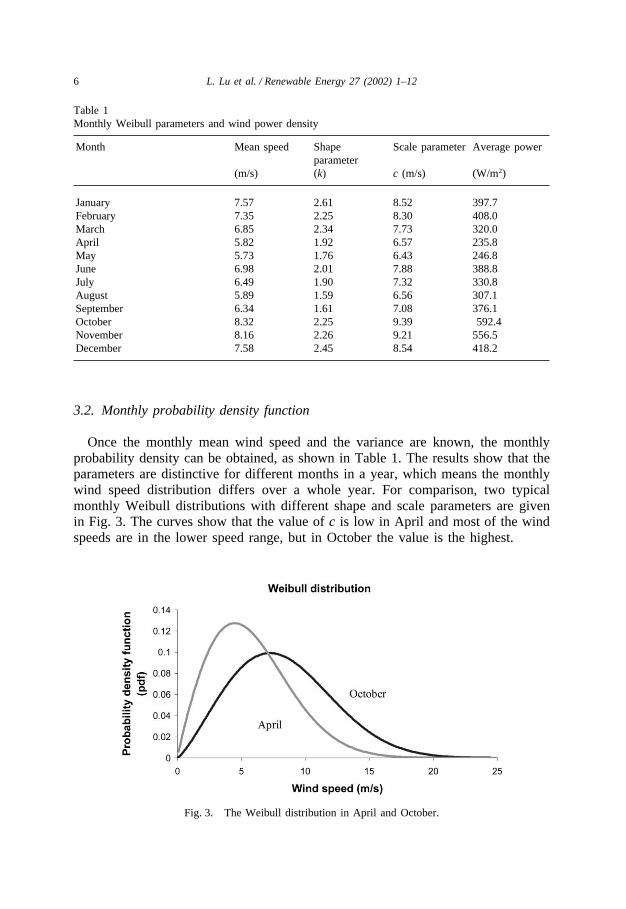
Table 1Monthly Weibull parameters and wind power density
Month Mean speed Shape Scale parameter Average powerparameter
(m/s) (k) c (m/s) (W/m2)
January 7.57 2.61 8.52 397.7February 7.35 2.25 8.30 408.0March 6.85 2.34 7.73 320.0April 5.82 1.92 6.57 235.8May 5.73 1.76 6.43 246.8June 6.98 2.01 7.88 388.8July 6.49 1.90 7.32 330.8August 5.89 1.59 6.56 307.1September 6.34 1.61 7.08 376.1October 8.32 2.25 9.39 592.4November 8.16 2.26 9.21 556.5December 7.58 2.45 8.54 418.2
3.2. Monthly probability density function
Once the monthly mean wind speed and the variance are known, the monthlyprobability density can be obtained, as shown in Table 1. The results show that theparameters are distinctive for different months in a year, which means the monthlywind speed distribution differs over a whole year. For comparison, two typicalmonthly Weibull distributions with different shape and scale parameters are givenin Fig. 3. The curves show that the value of c is low in April and most of the windspeeds are in the lower speed range, but in October the value is the highest.
Fig. 3. The Weibull distribution in April and October.
7L. Lu et al. / Renewable Energy 27 (2002) 1–12
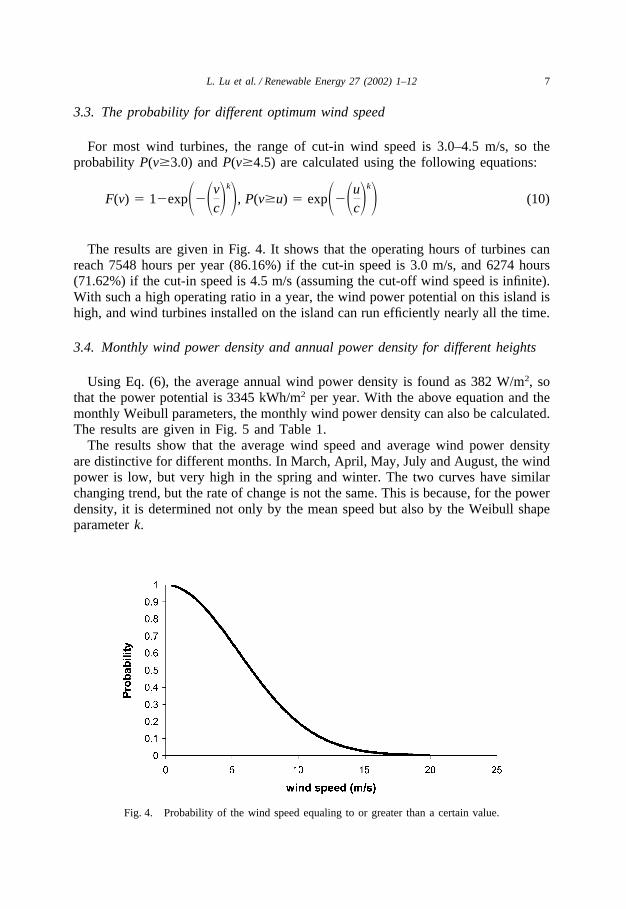
3.3. The probability for different optimum wind speed
For most wind turbines, the range of cut-in wind speed is 3.0–4.5 m/s, so theprobability P(v�3.0) and P(v�4.5) are calculated using the following equations:
F(v) � 1�exp���vc�k�, P(v�u) � exp���u
c�k� (10)
The results are given in Fig. 4. It shows that the operating hours of turbines canreach 7548 hours per year (86.16%) if the cut-in speed is 3.0 m/s, and 6274 hours(71.62%) if the cut-in speed is 4.5 m/s (assuming the cut-off wind speed is infinite).With such a high operating ratio in a year, the wind power potential on this island ishigh, and wind turbines installed on the island can run efficiently nearly all the time.
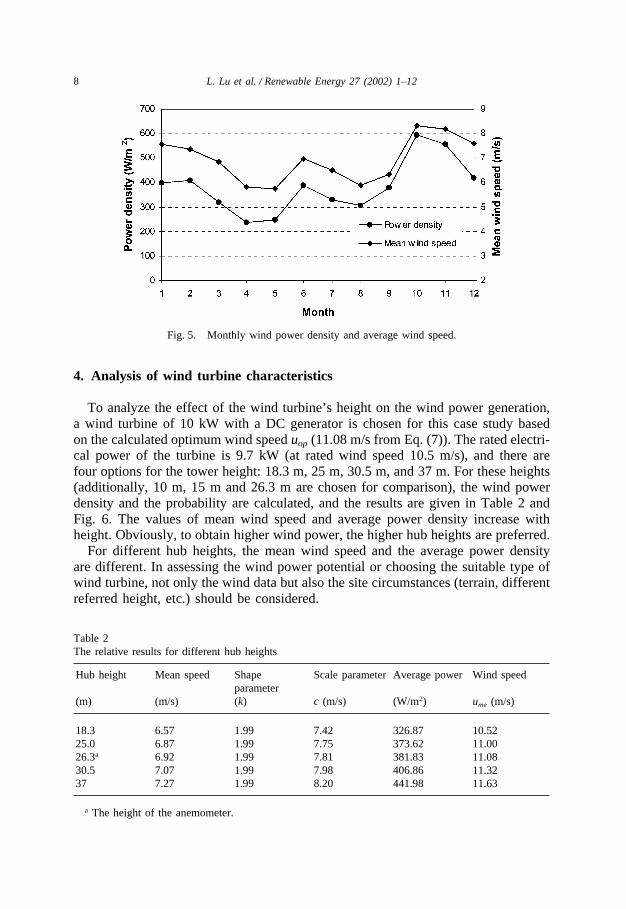
3.4. Monthly wind power density and annual power density for different heights
Using Eq. (6), the average annual wind power density is found as 382 W/m2, sothat the power potential is 3345 kWh/m2 per year. With the above equation and themonthly Weibull parameters, the monthly wind power density can also be calculated.The results are given in Fig. 5 and Table 1.
The results show that the average wind speed and average wind power densityare distinctive for different months. In March, April, May, July and August, the windpower is low, but very high in the spring and winter. The two curves have similarchanging trend, but the rate of change is not the same. This is because, for the powerdensity, it is determined not only by the mean speed but also by the Weibull shapeparameter k.
Fig. 4. Probability of the wind speed equaling to or greater than a certain value.
8 L. Lu et al. / Renewable Energy 27 (2002) 1–12
Fig. 5. Monthly wind power density and average wind speed.
4. Analysis of wind turbine characteristics
To analyze the effect of the wind turbine’s height on the wind power generation,a wind turbine of 10 kW with a DC generator is chosen for this case study basedon the calculated optimum wind speed uop (11.08 m/s from Eq. (7)). The rated electri-cal power of the turbine is 9.7 kW (at rated wind speed 10.5 m/s), and there arefour options for the tower height: 18.3 m, 25 m, 30.5 m, and 37 m. For these heights(additionally, 10 m, 15 m and 26.3 m are chosen for comparison), the wind powerdensity and the probability are calculated, and the results are given in Table 2 andFig. 6. The values of mean wind speed and average power density increase withheight. Obviously, to obtain higher wind power, the higher hub heights are preferred.
For different hub heights, the mean wind speed and the average power densityare different. In assessing the wind power potential or choosing the suitable type ofwind turbine, not only the wind data but also the site circumstances (terrain, differentreferred height, etc.) should be considered.
Table 2The relative results for different hub heights
Hub height Mean speed Shape Scale parameter Average power Wind speedparameter
(m) (m/s) (k) c (m/s) (W/m2) ume (m/s)
18.3 6.57 1.99 7.42 326.87 10.5225.0 6.87 1.99 7.75 373.62 11.0026.3a 6.92 1.99 7.81 381.83 11.0830.5 7.07 1.99 7.98 406.86 11.3237 7.27 1.99 8.20 441.98 11.63
a The height of the anemometer.
9L. Lu et al. / Renewable Energy 27 (2002) 1–12
Fig. 6. Annual power density vs. mean wind speed for different hub heights.
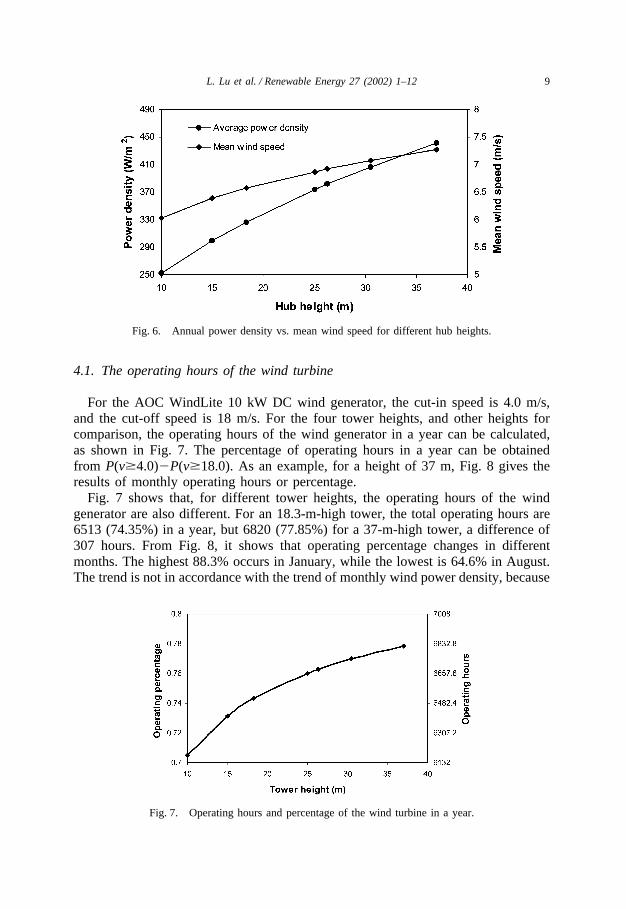
4.1. The operating hours of the wind turbine
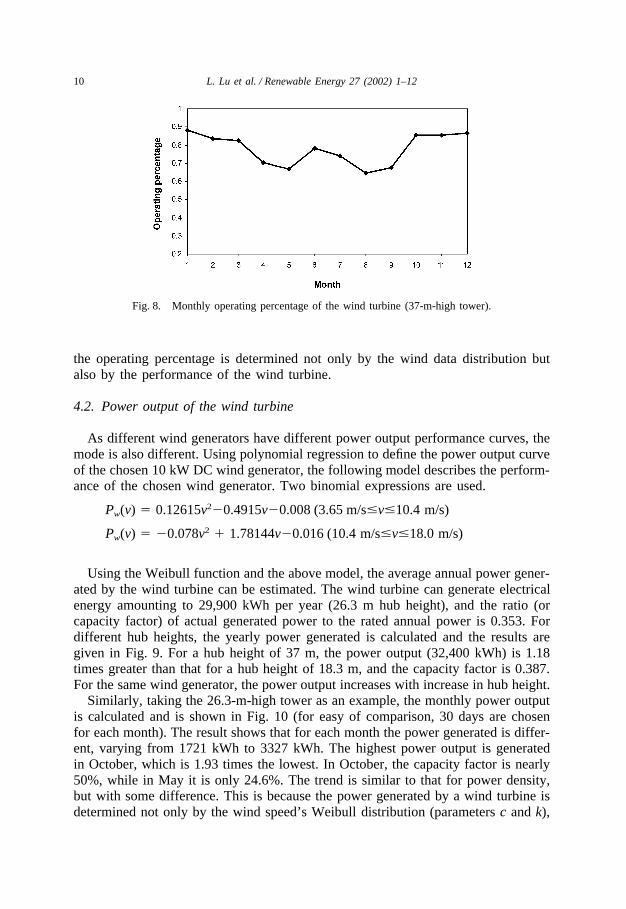
For the AOC WindLite 10 kW DC wind generator, the cut-in speed is 4.0 m/s,and the cut-off speed is 18 m/s. For the four tower heights, and other heights forcomparison, the operating hours of the wind generator in a year can be calculated,as shown in Fig. 7. The percentage of operating hours in a year can be obtainedfrom P(v�4.0)�P(v�18.0). As an example, for a height of 37 m, Fig. 8 gives theresults of monthly operating hours or percentage.
Fig. 7 shows that, for different tower heights, the operating hours of the windgenerator are also different. For an 18.3-m-high tower, the total operating hours are6513 (74.35%) in a year, but 6820 (77.85%) for a 37-m-high tower, a difference of307 hours. From Fig. 8, it shows that operating percentage changes in differentmonths. The highest 88.3% occurs in January, while the lowest is 64.6% in August.The trend is not in accordance with the trend of monthly wind power density, because
Fig. 7. Operating hours and percentage of the wind turbine in a year.
10 L. Lu et al. / Renewable Energy 27 (2002) 1–12
Fig. 8. Monthly operating percentage of the wind turbine (37-m-high tower).
the operating percentage is determined not only by the wind data distribution butalso by the performance of the wind turbine.
4.2. Power output of the wind turbine
As different wind generators have different power output performance curves, themode is also different. Using polynomial regression to define the power output curveof the chosen 10 kW DC wind generator, the following model describes the perform-ance of the chosen wind generator. Two binomial expressions are used.
Pw(v) � 0.12615v2�0.4915v�0.008 (3.65 m/s�v�10.4 m/s)
Pw(v) � �0.078v2 � 1.78144v�0.016 (10.4 m/s�v�18.0 m/s)
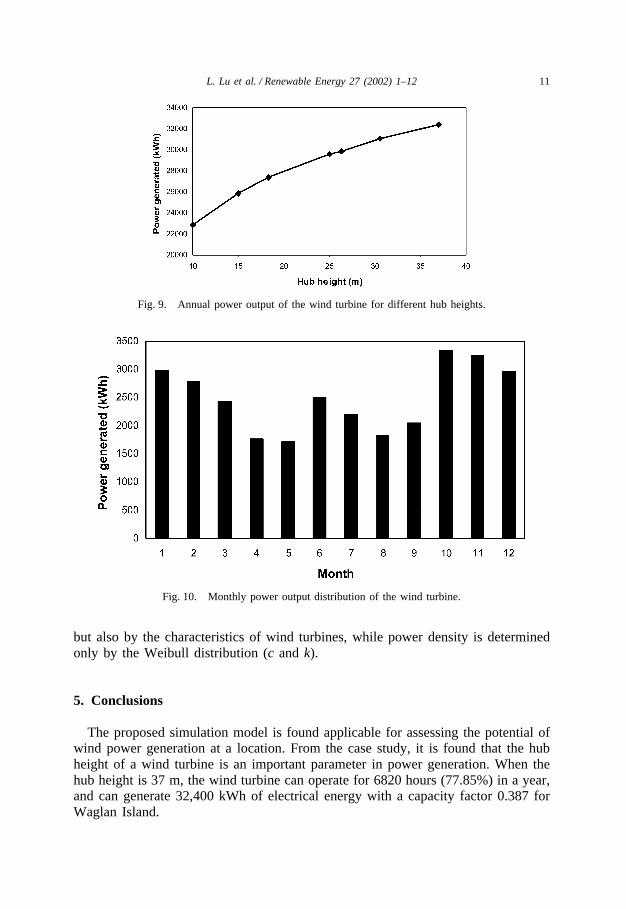
Using the Weibull function and the above model, the average annual power gener-ated by the wind turbine can be estimated. The wind turbine can generate electricalenergy amounting to 29,900 kWh per year (26.3 m hub height), and the ratio (orcapacity factor) of actual generated power to the rated annual power is 0.353. Fordifferent hub heights, the yearly power generated is calculated and the results aregiven in Fig. 9. For a hub height of 37 m, the power output (32,400 kWh) is 1.18times greater than that for a hub height of 18.3 m, and the capacity factor is 0.387.For the same wind generator, the power output increases with increase in hub height.
Similarly, taking the 26.3-m-high tower as an example, the monthly power outputis calculated and is shown in Fig. 10 (for easy of comparison, 30 days are chosenfor each month). The result shows that for each month the power generated is differ-ent, varying from 1721 kWh to 3327 kWh. The highest power output is generatedin October, which is 1.93 times the lowest. In October, the capacity factor is nearly50%, while in May it is only 24.6%. The trend is similar to that for power density,but with some difference. This is because the power generated by a wind turbine isdetermined not only by the wind speed’s Weibull distribution (parameters c and k),
11L. Lu et al. / Renewable Energy 27 (2002) 1–12
Fig. 9. Annual power output of the wind turbine for different hub heights.
Fig. 10. Monthly power output distribution of the wind turbine.
but also by the characteristics of wind turbines, while power density is determinedonly by the Weibull distribution (c and k).
5. Conclusions
The proposed simulation model is found applicable for assessing the potential ofwind power generation at a location. From the case study, it is found that the hubheight of a wind turbine is an important parameter in power generation. When thehub height is 37 m, the wind turbine can operate for 6820 hours (77.85%) in a year,and can generate 32,400 kWh of electrical energy with a capacity factor 0.387 forWaglan Island.
12 L. Lu et al. / Renewable Energy 27 (2002) 1–12
With its above average yearly wind speed and wind speed probability, WaglanIsland has great potential for wind power generation. Similar wind conditions canbe found on other islands surrounding Hong Kong. It is recommended to undertakefurther studies to explore other locations, and to develop this renewable energyresource.
References
[1] Elhadidy MA, Shaahid SM. Parametric study of hybrid (wind+solar+diesel) power generating sys-tems. Renewable Energy 2000;21(2):129–39.
[2] Fung WS. A feasibility study and engineering design of wind power in Hong Kong. Thesis (MSC),The Hong Kong Polytechnic University, 1999.
[3] Li G. Feasibility of large-scale offshore wind power for Hong Kong—a preliminary study. Renew-able Energy 2000;21(3):387–402.
[4] Mulugetta Y, Drake F. Assessment of solar and wind energy resources in Ethiopia. II. Wind energy.Solar Energy 1996;57(4):323–34.
[5] Rosen K et al. Wind energy potential of coastal Eritrea: an analysis of sparse wind data. SolarEnergy 1999;66(3):201–13.
[6] Johnson GL. Wind energy systems. USA: Prentice-Hall, 1985.[7] Patel MR. Wind and solar power systems. America: CRC Press, 1999.[8] Ghali FMA, Abd el Aziz MM, Syam FA. Simulation and analysis of hybrid systems using probabilis-
tic techniques. In: Power Conversion Conference, Nagaoka, 1997;2:831–5.[9] Borowy BS, Salameh ZM. Optimum photovoltaic array size for a hybrid wind/PV system. IEEE
Trans. Energy Conversion 1994;9(3):482–8.[10] Borowy BS, Salameh ZM. Methodology for optimally sizing the combination of a battery bank and
PV array in a wind/PV hybrid system. IEEE Trans. Energy Conversion 1996;11(2):367–75.[11] Gavanidou ES, Bakirtzis AG. Design of a stand alone system with renewable energy sources using
trade off methods. IEEE Trans. Energy Conversion 1992;7(1):42–8.[12] Alhusein MA, Abu-Leiyah O, Inayatullah GA. Combined system of renewable energy for grid-
connected advanced communities. Renewable Energy 1993;3(6/7):563–6.[13] Kim S, Kim C et al. Load sharing operation of a 14 kW photovoltaic/wind hybrid power system.
In: Conference Record of the Twenty-Sixth IEEE, 1997:1325–8.