investigation of the interaction of herbal ingredients
TRANSCRIPT
Research ArticleInvestigation of the Interaction of Herbal IngredientsContained in Triphala Recipe Using Simplex Lattice Design:Chemical Analysis Point of View
Chaowalit Monton ,1 Thaniya Wunnakup,1 Jirapornchai Suksaeree,2
Laksana Charoenchai,1 and Natawat Chankana3
1Drug and Herbal Product Research and Development Center, College of Pharmacy, Rangsit University,Pathum Thani 12000, Thailand2Department of Pharmaceutical Chemistry, College of Pharmacy, Rangsit University, Pathum Thani 12000, Thailand3Sun Herb Thai Chinese Manufacturing, College of Pharmacy, Rangsit University, Pathum Thani 12000, Thailand
Correspondence should be addressed to Chaowalit Monton; [email protected]
Received 16 March 2020; Revised 19 June 2020; Accepted 16 July 2020; Published 4 August 2020
Academic Editor: Carl J. Schaschke
Copyright © 2020 Chaowalit Monton et al. This is an open access article distributed under the Creative Commons AttributionLicense, which permits unrestricted use, distribution, and reproduction in any medium, provided the original work isproperly cited.
The aim of this work was to investigate the interaction of herbal ingredients contained in Triphala recipe (Terminalia chebula,Terminalia bellirica, and Phyllanthus emblica in equal proportion) using simplex lattice design. This work focused on chemicalanalysis of four phenolic compounds including gallic acid, corilagin, chebulagic acid, and chebulinic acid by validated high-performance liquid chromatography. The effect of the extraction technique (decoction vs. infusion) and gamma irradiation wasalso examined. The combination index was used as a tool for determination of interaction of the ingredients contained in theherbal recipe. Results showed that the extraction technique and gamma irradiation slightly altered the content of some phenoliccompounds as well as the combination index. The positive interaction seems to be found at the equal proportion of the threeplants. This work scientifically supported the suitable formula of the Triphala recipe in the traditional use.
1. Introduction
Triphala is an herbal formula composed of equal proportion ofdried fruits of three plants: Terminalia chebula Retz. var.chebula, Terminalia bellirica (Gaertn.) Roxb., and Phyllanthusemblica L. It has been used for a long time in Ayurvedicmedicines. Triphala possesses numerous activities, includingadaptogenic, antibacterial, antidiabetic, anti-inflammation,antimutagenic, antineoplastic, antioxidant, appetite stimulation,chemoprotective, immunomodulating, laxative, prevention ofdental caries, radioprotective, and reduction of hyperacidity[1]. Triphala contains high content of ascorbic acid and pheno-lic compounds, so it possesses good antioxidant activity [2].Pawar et al. [3] reported the use of gallic acid, chebulagic acid,and chebulinic acid as standard markers for Triphala. Char-oenchai et al. [4] report the high-performance liquid chroma-tography (HPLC)- mass spectrometry profiles of Triphala and
modified Triphala recipes. The major active compounds ofTriphala are ascorbic acid, gallic acid, corilagin, chebulagic acid,rutin, chebulinic acid, and quercetin. Varma et al. [5] alsoreported the chemical constituents, including gallic acid, ellagicacid, chebulinic acid, emblicanin A and B, and friedelin. Theother phenolic compounds were also reported, i.e., chebulicacid, tannic acid, epicatechin, and syringic acid [2]. Phenoliccompounds usually act as an antioxidant; the high content ofphenolic compounds has a positive effect on antioxidant activity[6–9]. Several studies reveal that Triphala is an antioxidant-richproduct so that it can be used as a food supplement and beverageto promote health [10].
Synergistic effects or positive interaction of drugs or herbalplants enhance therapeutic effects or biological activities bysome positive interactions among their different components[11]. The synergism is reported among herbal plants innumerous studies [12–19]. In some reports, herbal extract, as
HindawiInternational Journal of Food ScienceVolume 2020, Article ID 5104624, 14 pageshttps://doi.org/10.1155/2020/5104624
well as herbal plant, is synergized with some modern medi-cines, especially, essential oils with antibiotic [20–22]. Amongseveral traditional medicines, traditional Chinese medicinesare the most frequently reported in the literature to exhibitsynergism of herbal plants [23, 24]. A synergistic effect intraditional Chinese medicines is reviewed. Multicomponentcombinations of herbal plants are usually used in traditionalmedicines to boost the therapeutic efficacy and reduce sideeffects. The synergism can occur among herbs or other com-ponents in the prescription, among effective parts of herbs,and among bioactive compounds of herbs [25].
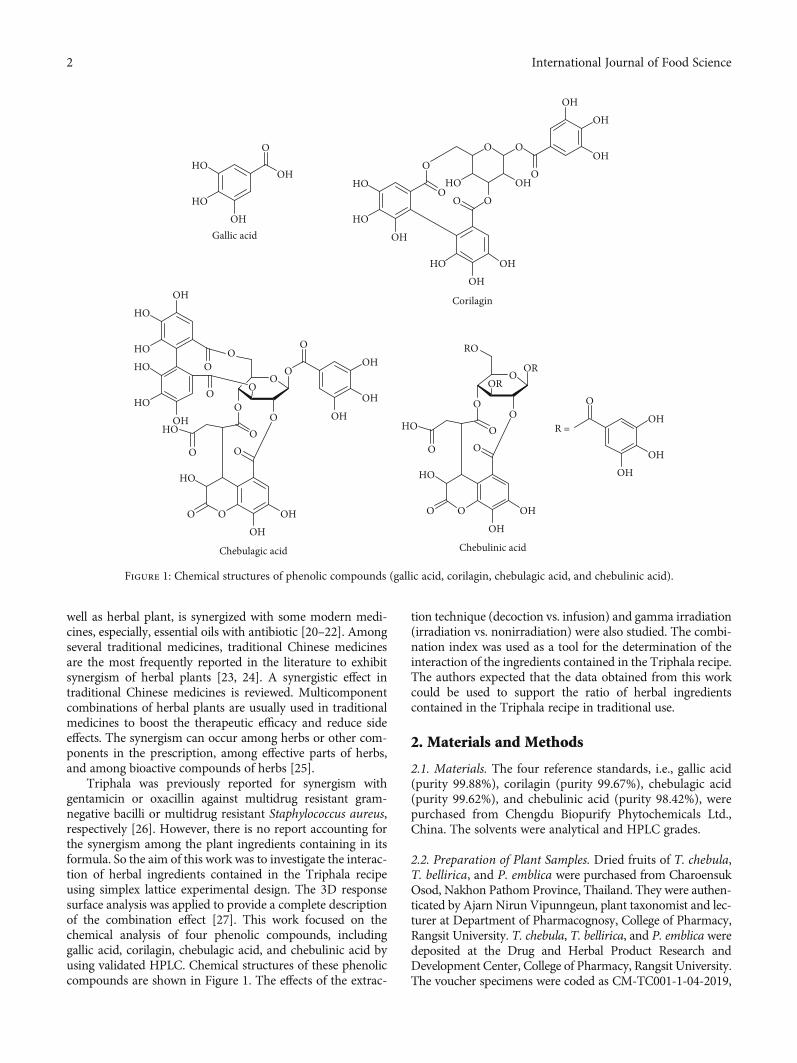
Triphala was previously reported for synergism withgentamicin or oxacillin against multidrug resistant gram-negative bacilli or multidrug resistant Staphylococcus aureus,respectively [26]. However, there is no report accounting forthe synergism among the plant ingredients containing in itsformula. So the aim of this work was to investigate the interac-tion of herbal ingredients contained in the Triphala recipeusing simplex lattice experimental design. The 3D responsesurface analysis was applied to provide a complete descriptionof the combination effect [27]. This work focused on thechemical analysis of four phenolic compounds, includinggallic acid, corilagin, chebulagic acid, and chebulinic acid byusing validated HPLC. Chemical structures of these phenoliccompounds are shown in Figure 1. The effects of the extrac-
tion technique (decoction vs. infusion) and gamma irradiation(irradiation vs. nonirradiation) were also studied. The combi-nation index was used as a tool for the determination of theinteraction of the ingredients contained in the Triphala recipe.The authors expected that the data obtained from this workcould be used to support the ratio of herbal ingredientscontained in the Triphala recipe in traditional use.
2. Materials and Methods
2.1. Materials. The four reference standards, i.e., gallic acid(purity 99.88%), corilagin (purity 99.67%), chebulagic acid(purity 99.62%), and chebulinic acid (purity 98.42%), werepurchased from Chengdu Biopurify Phytochemicals Ltd.,China. The solvents were analytical and HPLC grades.
2.2. Preparation of Plant Samples. Dried fruits of T. chebula,T. bellirica, and P. emblica were purchased from CharoensukOsod, Nakhon Pathom Province, Thailand. They were authen-ticated by Ajarn Nirun Vipunngeun, plant taxonomist and lec-turer at Department of Pharmacognosy, College of Pharmacy,Rangsit University. T. chebula, T. bellirica, and P. emblica weredeposited at the Drug and Herbal Product Research andDevelopment Center, College of Pharmacy, Rangsit University.The voucher specimens were coded as CM-TC001-1-04-2019,
Corilagin
Chebulagic acid Chebulinic acid
HO
HOOH
O
OH
Gallic acid
HO
HO
O
O
OH
HOOH
OH
O O
O O
OOHHO
OHOH
OH
OH
HO
HOHO
HO
OH
O
OO
OO
O
OOH
OH
OHO
OOHO
O
O OHOH
O
HO
O
OOR
OR
OO
OHO
O
O OH
OH
O
HO
O
RO
R =
O
OH
OHOH
Figure 1: Chemical structures of phenolic compounds (gallic acid, corilagin, chebulagic acid, and chebulinic acid).
2 International Journal of Food Science
CM-TB001-1-04-2019, and CM-PE001-1-04-2019, respec-tively. Seeds were removed from the fruits of each plant. Theobtained fruits were pulverized using a grinder and stored ina dry place until use.
2.3. Simplex Lattice Experimental Design for Extraction ofPlant Samples and the Optimization. The simplex latticedesign was applied in this work. The weight fraction of T.chebula, T. bellirica, and P. emblica ranged from 0 to 1, andthe summation of the weight fraction of the three plantswas equal to 1. The independent variables of this work werethe proportion of T. chebula (X1), T. bellirica (X2), and P.emblica (X3). The 12 formulas of plant mixture wereprepared: F1 to F9 contained T. chebula, T. bellirica, and P.emblica in proportions of 1 : 0 : 0, 0 : 1 : 0, 0 : 0 : 1, 0.5 : 0.5 : 0,0.5 : 0 : 0.5, 0 : 0.5 : 0.5, 0.66 : 0.17 : 0.17, 0.17 : 0.66 : 0.17, and0.17 : 0.17 : 0.66, respectively. F10 to F12 were the sameformula. They contained equal proportion of T. chebula, T.bellirica, and P. emblica (0.33 : 0.33 : 0.33).
The plant powder mixture was used for extraction bydecoction and infusion methods. In case of decoction, plantpowder mixture (6 g) was placed in a tea bag and boiled inwater (50mL) for 15min. The tea bag with powder mixturewas removed and boiled again three times in total. The threeparts of the obtained solution were pooled and filteredthroughWhatman® filter paper no.1. It was lyophilized usinga freeze dryer for 18-24 hours. The lyophilized extractpowder was collected and kept in desiccator until use.
In case of infusion, plant powder mixture (6 g) was placedin a tea bag, placed in boiling water (50mL), and stood for15min. The tea bag with powder mixture was removed andinfused again three times in total. The three parts of theobtained solution were pooled and filtered. It was lyophilizedsimilar to the decoction group. The lyophilized extractpowder was collected and kept in desiccator until use.
The extract powder obtained from decoction was sam-pled to gamma irradiation (10 kGy). The three groups ofsamples, i.e., extract from decoction without gamma irradia-tion, extract from decoction with gamma irradiation, andextract from infusion, were obtained. They have analyzedfor content of phenolic compounds, including gallic acid,corilagin, chebulagic acid, and chebulinic acid. The sixdependent variables, i.e., extraction yield (Y1), gallic acidcontent (Y2), corilagin content (Y3), chebulagic acid content(Y4), chebulinic acid content (Y5), and total content of thefour phenolic compounds (Y6) were monitored. They wereused to produce the 3D response surface by Design-Expert®version 11.0. Furthermore, the equations for prediction ofeach dependent factor were created.
2.4. Analysis of Phenolic Compounds. The HPLC was used toanalyze the four phenolic compounds, including gallic acid,corilagin, chebulagic acid, and chebulinic acid. The aqueoussolutions of the extract of F1 to F12 were prepared in aconcentration of 2mg/mL, except F3 which was preparedin a concentration of 0.5mg/mL, and F6 and F9 were pre-pared in a concentration of 1mg/mL. The content of the fourphenolic compounds was calculated based on the calibrationcurve of each compound.
The analysis of phenolic compounds was performedusing an HPLC instrument (Agilent 1260 infinity, Agilent,USA). The ACE C18-PFP column (250 × 4:6mm, internaldiameter, 5μm) was used. The column temperature wascontrolled at 25°C. The mobile phase was composed ofacetonitrile (A) and 1% acetic acid aqueous solution (B).The gradient elution system was similar to the previous workof Charoenchai et al. [4]. It was started by holding 5% A for1min, increased to 10% A in 3min, increased to 15% A in8min, increased to 35% A in 20min, increased to 50% A in3min, increased to 100% A in 2min and holding for 3min,and decreased to 5% A in 1min and holding for 4min. Themobile phase flow rate was 1mL/min. The injection volumewas 10μL. The photodiode array detector was set at 270 nm.
This method was validated to confirm its linearity, range,the limit of detection (LOD) and limit of quantitation(LOQ), specificity, precision, and accuracy. The linear equa-tions and coefficient of determination (R2) values of calibra-tion curves of gallic acid, corilagin, chebulagic acid, andchebulinic acid in the test range of 10-200μg/mL were y =4039955x + 6926719 (R2 = 0:9991), y = 2292681x + 9273157(R2 = 0:9978), y = 1672107x + 197458 (R2 = 1:0000), and y =2068580x – 298060 (R2 = 0:9999), respectively. The LODand LOQ values were 2.50 and 7.57μg/mL, 0.46 and1.39μg/mL, 0.98 and 2.96μg/mL, and 0.84 and 2.55μg/mL,respectively. The percent relative standard deviations of intra-day precision and interday precision of all phenolic compoundstandards were lower than 2% and 5%, respectively. The accu-racy values of the analysis of gallic acid, corilagin, chebulagicacid, and chebulinic acid were 95.23-105.2%, 91.74-107.0%,99.22-104.3%, and 92.98-101.2%, respectively. Furthermore,this method was specifically due to the UV spectrums of theindividual peak of each phenolic compound in the extractsimilar to the UV spectrum of each standard compounds.
2.5. Investigation of Interaction. The interaction was investi-gated based on the response additivity approach, which isalso referred to as the linear interaction effect. The posotoveinteraction occurred when the observed combination effectwas higher than the expected additive effect given by thesummation of the individual effect [27]. However, this workfocused on the content of phenolic compounds, so thepositive interaction in this work occurred when the observedcontent of phenolic compounds from the combination plantswas higher than the expected additive content given by thesummation of the individual plant. The tool used to investi-gate the interaction was adapted from the combination index(CI), a practical model used for determination of synergismof a multicomponent mixture in a fixed ratio [24], as
CI = EA + EB + EC
Ecombination, ð1Þ
where EA, EB, EC were the individual effect of T. chebula, T.bellirica, and P. emblica, respectively. Ecombination was theobserved combination effect of T. chebula, T. bellirica, andP. emblica. The positive interaction, additive effect, andnegative interaction occurred when the CI values were lowerthan 1, equal to 1, and higher than 1, respectively [24, 27].
3International Journal of Food Science
1
2
34
52
34
5
200
100
0
0 5 10 15Minutes
20 25 30 35
0
100
200m
AU
mAU
(a)
1
2 35
2 35
0 5 10 15Minutes
20 25 30 35
200
100
0
mAU
0
100
200
mAU
(b)
1
2
3
5
1
25
0 5 10 15Minutes
20 25 30 35
200
100
0
mAU
0
100
200
mAU
(c)
1
2 3 52 3 5
0 5 10 15Minutes
20 25 30 35
200
300
100
0
mA
U
0
100
200
300
mA
U
(d)
Figure 2: Continued.
4 International Journal of Food Science
The response surface methodology was also applied toclarify the interaction. The six dependent variables of CI valuesof the extraction yield (Y7), gallic acid content (Y8), corilagincontent (Y9), chebulagic acid content (Y10), chebulinic acidcontent (Y11), and total content of the four phenoliccompounds (Y12) were monitored. They were used to producethe contour plots by Design-Expert® version 11.0. Theequations for the prediction of each dependent variable werecreated. The plots between the predicted values and the actualvalues were produced, and the R2 values were reported toexplain the level of correlation. The plots between internallystudentized residuals and the run numbers were also producedto demonstrate the level of the distribution of the data. Thecontour plots of the desirability of the optimal conditionprovided the simultaneous minimizing CI of the extractionyield (Y7), and total content of the four phenolic compounds(Y12) was created. Finally, the overlay plots that CI values ofboth extraction yield and total content of four phenoliccompounds of less than 0.5 and 0.4 were reported.
3. Results and Discussion
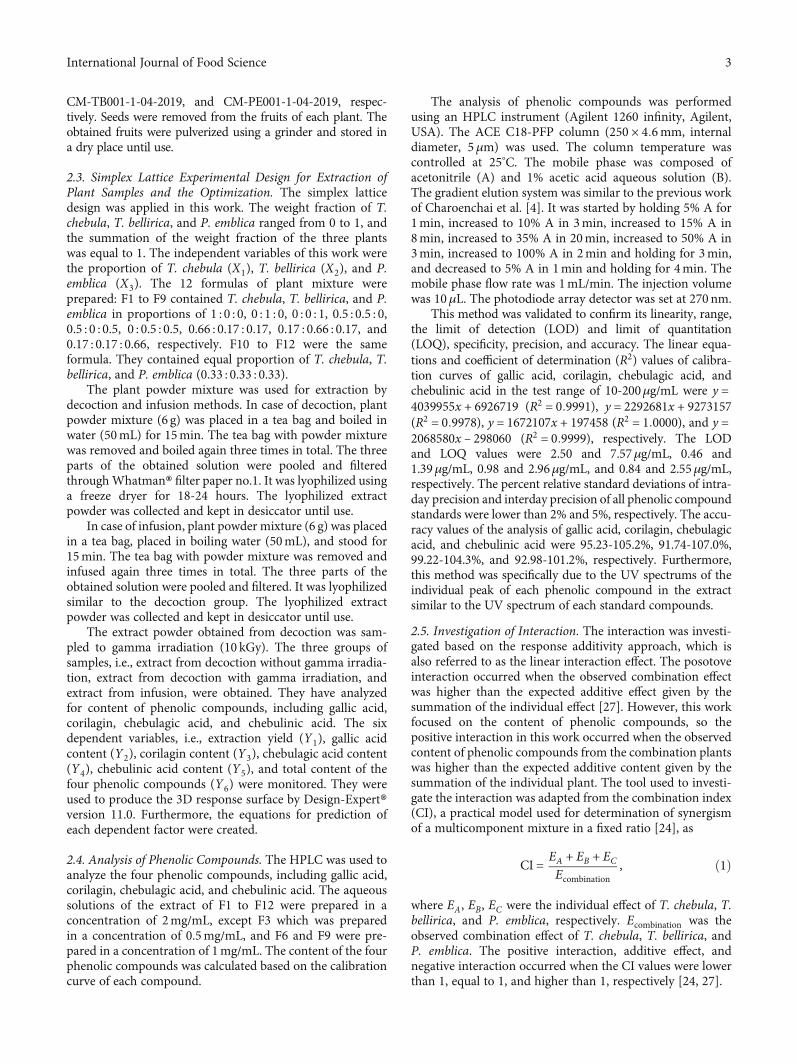
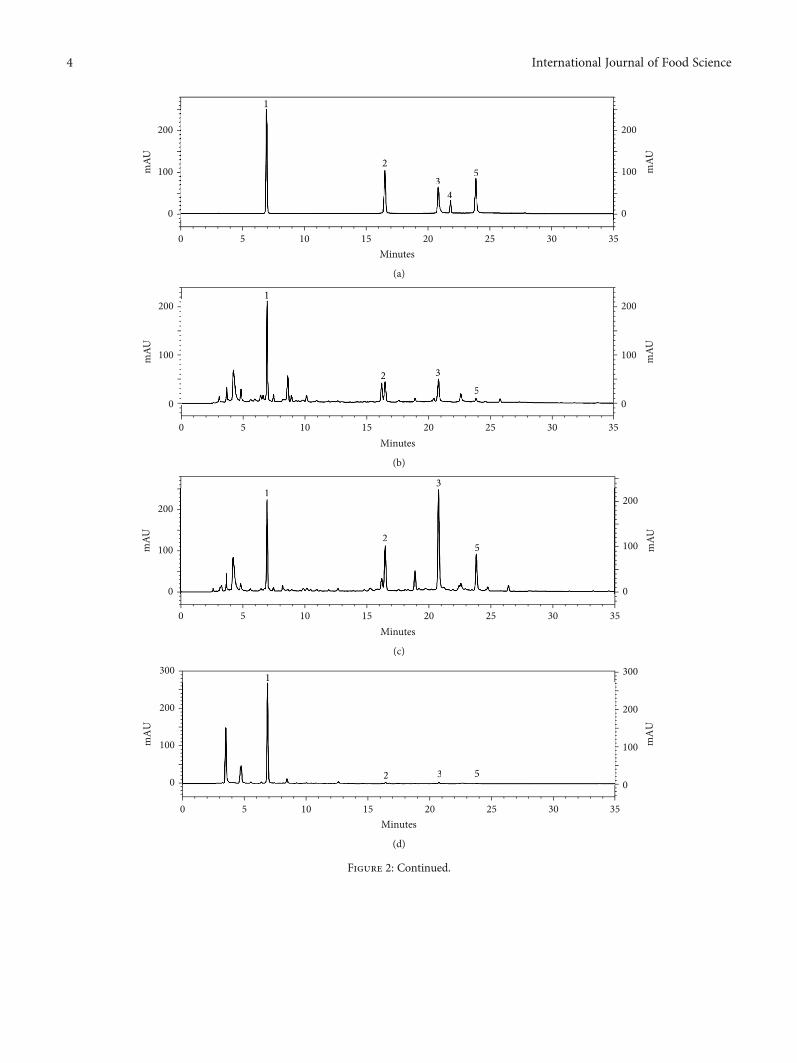
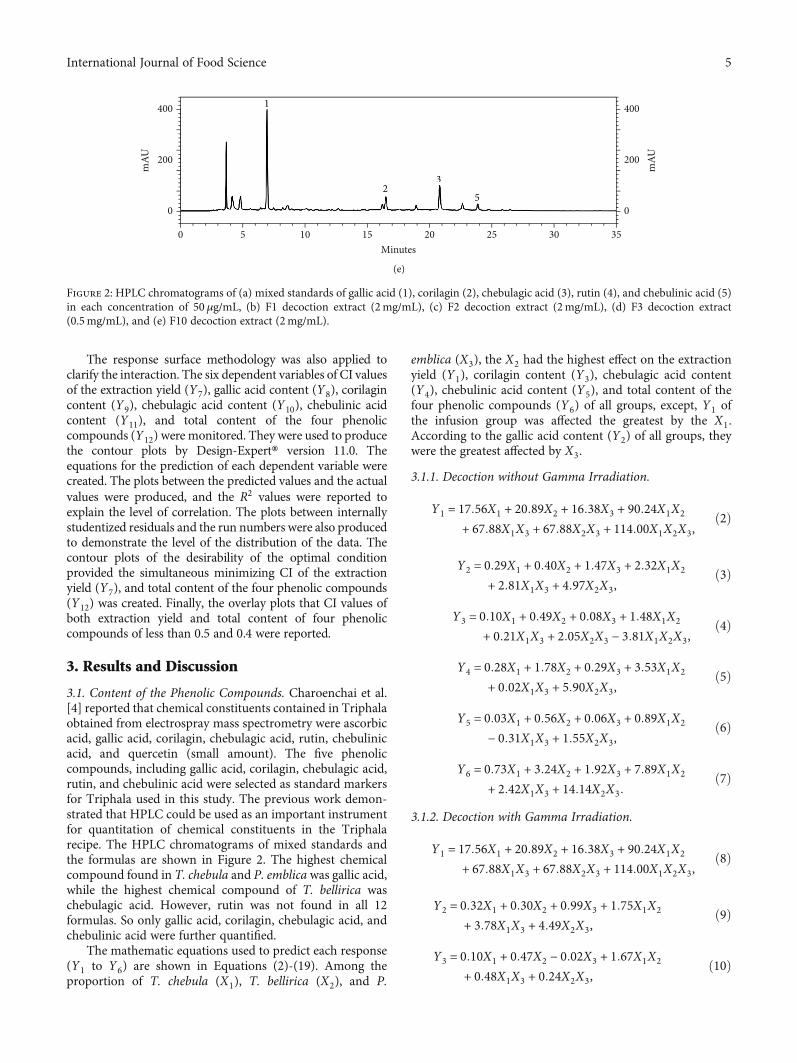
3.1. Content of the Phenolic Compounds. Charoenchai et al.[4] reported that chemical constituents contained in Triphalaobtained from electrospray mass spectrometry were ascorbicacid, gallic acid, corilagin, chebulagic acid, rutin, chebulinicacid, and quercetin (small amount). The five phenoliccompounds, including gallic acid, corilagin, chebulagic acid,rutin, and chebulinic acid were selected as standard markersfor Triphala used in this study. The previous work demon-strated that HPLC could be used as an important instrumentfor quantitation of chemical constituents in the Triphalarecipe. The HPLC chromatograms of mixed standards andthe formulas are shown in Figure 2. The highest chemicalcompound found in T. chebula and P. emblica was gallic acid,while the highest chemical compound of T. bellirica waschebulagic acid. However, rutin was not found in all 12formulas. So only gallic acid, corilagin, chebulagic acid, andchebulinic acid were further quantified.
The mathematic equations used to predict each response(Y1 to Y6) are shown in Equations (2)-(19). Among theproportion of T. chebula (X1), T. bellirica (X2), and P.
emblica (X3), the X2 had the highest effect on the extractionyield (Y1), corilagin content (Y3), chebulagic acid content(Y4), chebulinic acid content (Y5), and total content of thefour phenolic compounds (Y6) of all groups, except, Y1 ofthe infusion group was affected the greatest by the X1.According to the gallic acid content (Y2) of all groups, theywere the greatest affected by X3.
3.1.1. Decoction without Gamma Irradiation.
Y1 = 17:56X1 + 20:89X2 + 16:38X3 + 90:24X1X2+ 67:88X1X3 + 67:88X2X3 + 114:00X1X2X3,
ð2Þ
Y2 = 0:29X1 + 0:40X2 + 1:47X3 + 2:32X1X2+ 2:81X1X3 + 4:97X2X3,
ð3Þ
Y3 = 0:10X1 + 0:49X2 + 0:08X3 + 1:48X1X2+ 0:21X1X3 + 2:05X2X3 − 3:81X1X2X3,
ð4Þ
Y4 = 0:28X1 + 1:78X2 + 0:29X3 + 3:53X1X2+ 0:02X1X3 + 5:90X2X3,
ð5Þ
Y5 = 0:03X1 + 0:56X2 + 0:06X3 + 0:89X1X2− 0:31X1X3 + 1:55X2X3,
ð6Þ
Y6 = 0:73X1 + 3:24X2 + 1:92X3 + 7:89X1X2+ 2:42X1X3 + 14:14X2X3:
ð7Þ
3.1.2. Decoction with Gamma Irradiation.
Y1 = 17:56X1 + 20:89X2 + 16:38X3 + 90:24X1X2+ 67:88X1X3 + 67:88X2X3 + 114:00X1X2X3,
ð8Þ
Y2 = 0:32X1 + 0:30X2 + 0:99X3 + 1:75X1X2+ 3:78X1X3 + 4:49X2X3,
ð9Þ
Y3 = 0:10X1 + 0:47X2 − 0:02X3 + 1:67X1X2+ 0:48X1X3 + 0:24X2X3,
ð10Þ
1
23
52
3
5
0 5 10 15Minutes
20 25 30 35
200
400
0
mAU 200
0
400
mAU
(e)
Figure 2: HPLC chromatograms of (a) mixed standards of gallic acid (1), corilagin (2), chebulagic acid (3), rutin (4), and chebulinic acid (5)in each concentration of 50μg/mL, (b) F1 decoction extract (2mg/mL), (c) F2 decoction extract (2mg/mL), (d) F3 decoction extract(0.5mg/mL), and (e) F10 decoction extract (2mg/mL).
5International Journal of Food Science
Y4 = 0:48X1 + 1:89X2 + 0:01X3 + 6:17X1X2+ 1:24X1X3 + 1:28X2X3,
ð11Þ
Y5 = 0:29X1 + 0:62X2 + 0:01X3 + 1:29X1X2− 0:34X1X3 + 0:62X2X3,
ð12Þ
Y6 = 1:19X1 + 3:27X2 + 1:00X3 + 10:88X1X2+ 5:16X1X3 + 6:62X2X3:
ð13Þ
3.1.3. Infusion.
Y1 = 21:29X1 + 17:55X2 + 11:98X3 + 99:33X1X2+ 73:50X1X3 + 58:07X2X3,
ð14Þ
Y2 = 0:24X1 + 0:33X2 + 1:06X3 + 2:14X1X2+ 4:31X1X3 + 2:85X2X3,
ð15Þ
Y3 = 0:05X1 + 0:41X2 − 0:01X3 + 1:46X1X2+ 0:46X1X3 + 0:96X2X3,
ð16Þ
Y4 = 0:24X1 + 1:88X2 + 0:001X3 + 5:89X1X2+ 1:79X1X3 + 4:60X2X3,
ð17Þ
Y5 = 0:02X1 + 0:71X2 + 0:05X3 + 1:49X1X2+ 0:17X1X3 + 1:15X2X3,
ð18Þ
Y6 = 0:55X1 + 3:33X2 + 1:11X3 + 10:98X1X2+ 6:73X1X3 + 9:56X2X3,
ð19Þ
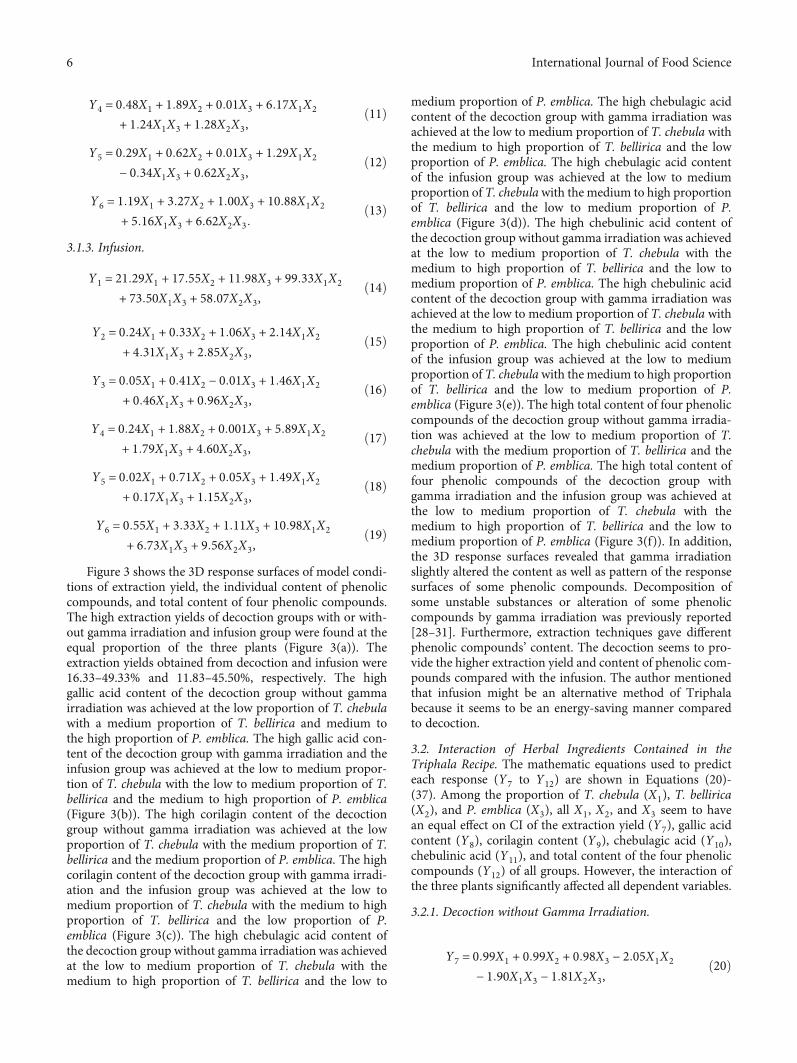
Figure 3 shows the 3D response surfaces of model condi-tions of extraction yield, the individual content of phenoliccompounds, and total content of four phenolic compounds.The high extraction yields of decoction groups with or with-out gamma irradiation and infusion group were found at theequal proportion of the three plants (Figure 3(a)). Theextraction yields obtained from decoction and infusion were16.33–49.33% and 11.83–45.50%, respectively. The highgallic acid content of the decoction group without gammairradiation was achieved at the low proportion of T. chebulawith a medium proportion of T. bellirica and medium tothe high proportion of P. emblica. The high gallic acid con-tent of the decoction group with gamma irradiation and theinfusion group was achieved at the low to medium propor-tion of T. chebula with the low to medium proportion of T.bellirica and the medium to high proportion of P. emblica(Figure 3(b)). The high corilagin content of the decoctiongroup without gamma irradiation was achieved at the lowproportion of T. chebula with the medium proportion of T.bellirica and the medium proportion of P. emblica. The highcorilagin content of the decoction group with gamma irradi-ation and the infusion group was achieved at the low tomedium proportion of T. chebula with the medium to highproportion of T. bellirica and the low proportion of P.emblica (Figure 3(c)). The high chebulagic acid content ofthe decoction group without gamma irradiation was achievedat the low to medium proportion of T. chebula with themedium to high proportion of T. bellirica and the low to
medium proportion of P. emblica. The high chebulagic acidcontent of the decoction group with gamma irradiation wasachieved at the low to medium proportion of T. chebula withthe medium to high proportion of T. bellirica and the lowproportion of P. emblica. The high chebulagic acid contentof the infusion group was achieved at the low to mediumproportion of T. chebulawith the medium to high proportionof T. bellirica and the low to medium proportion of P.emblica (Figure 3(d)). The high chebulinic acid content ofthe decoction group without gamma irradiation was achievedat the low to medium proportion of T. chebula with themedium to high proportion of T. bellirica and the low tomedium proportion of P. emblica. The high chebulinic acidcontent of the decoction group with gamma irradiation wasachieved at the low to medium proportion of T. chebula withthe medium to high proportion of T. bellirica and the lowproportion of P. emblica. The high chebulinic acid contentof the infusion group was achieved at the low to mediumproportion of T. chebulawith the medium to high proportionof T. bellirica and the low to medium proportion of P.emblica (Figure 3(e)). The high total content of four phenoliccompounds of the decoction group without gamma irradia-tion was achieved at the low to medium proportion of T.chebula with the medium proportion of T. bellirica and themedium proportion of P. emblica. The high total content offour phenolic compounds of the decoction group withgamma irradiation and the infusion group was achieved atthe low to medium proportion of T. chebula with themedium to high proportion of T. bellirica and the low tomedium proportion of P. emblica (Figure 3(f)). In addition,the 3D response surfaces revealed that gamma irradiationslightly altered the content as well as pattern of the responsesurfaces of some phenolic compounds. Decomposition ofsome unstable substances or alteration of some phenoliccompounds by gamma irradiation was previously reported[28–31]. Furthermore, extraction techniques gave differentphenolic compounds’ content. The decoction seems to pro-vide the higher extraction yield and content of phenolic com-pounds compared with the infusion. The author mentionedthat infusion might be an alternative method of Triphalabecause it seems to be an energy-saving manner comparedto decoction.
3.2. Interaction of Herbal Ingredients Contained in theTriphala Recipe. The mathematic equations used to predicteach response (Y7 to Y12) are shown in Equations (20)-(37). Among the proportion of T. chebula (X1), T. bellirica(X2), and P. emblica (X3), all X1, X2, and X3 seem to havean equal effect on CI of the extraction yield (Y7), gallic acidcontent (Y8), corilagin content (Y9), chebulagic acid (Y10),chebulinic acid (Y11), and total content of the four phenoliccompounds (Y12) of all groups. However, the interaction ofthe three plants significantly affected all dependent variables.
3.2.1. Decoction without Gamma Irradiation.
Y7 = 0:99X1 + 0:99X2 + 0:98X3 − 2:05X1X2− 1:90X1X3 − 1:81X2X3,
ð20Þ
6 International Journal of Food Science
Decoction Decoction withgamma irradiation
Infusion
A (1.00) B (0.00)C (1.00)
C (0.00)
10
20
30
40
50
Extr
actio
n yi
eld
(%)
A (0.00)
B (1.00)
A (1.00) B (0.00)C (1.00)
C (0.00) A (0.00)
B (1.00)
A (1.00) B (0.00)C (1.00)
C (0.00) A (0.00)
B (1.00)
10
20
30
40
50
Extr
actio
n yi
eld
(%)
10
20
30
40
50
Extr
actio
n yi
eld
(%)
A (1.00) B (0.00)C (1.00)
C (0.00)
0.0000.5001.0001.5002.0002.500
Gal
lic ac
id (%
)
Gal
lic ac
id (%
)A (0.00)
B (1.00)
A (1.00) B (0.00)C (1.00)
C (0.00)
0.0000.5001.0001.5002.000
A (0.00)
B (1.00)
A (1.00) B (0.00)C (1.00)
C (0.00)
0.0000.5001.0001.5002.0002.500
Gal
lic ac
id (%
)
A (0.00)
B (1.00)
A (1.00) B (0.00)C (1.00)
C (0.00)
1.0001.8000.6000.4000.2000.000C
orila
gin
(%)
A (0.00)
B (1.00)
A (1.00) B (0.00)C (1.00)
C (0.00)
−0.20
0.20.40.60.8
A (0.00)
B (1.00)
A (1.00) B (0.00)C (1.00)
C (0.00)
−0.200
0.8000.6000.4000.2000.000
Cor
ilagi
n (%
)
Cor
ilagi
n (%
)
A (0.00)
B (1.00)
A (1.00) B (0.00)C (1.00)
C (0.00)
3.0002.5002.0001.5001.0000.5000.000
Cheb
ulag
ic ac
id (%
)
A (0.00)
B (1.00)
A (1.00) B (0.00) C (1.00)
C (0.00)
3.0002.5002.0001.5001.0000.5000.000
3.0002.5002.0001.5001.0000.5000.000
Cheb
ulag
ic ac
id (%
)
Cheb
ulag
ic ac
id (%
)
A (0.00)
B (1.00)
A (1.00) B (0.00)C (1.00)
C (0.00)A (0.00)
B (1.00)
A (1.00) B (0.00)C (1.00)
C (0.00)
B (1.00) B (1.00) B (1.00)
−0.200
0.800 0.8000.8001.000
0.600 0.6000.6000.400
0.400 0.4000.2000.200 0.2000.0000.000 0.000
Cheb
ulin
ic ac
id (%
)
A (0.00)
A (1.00) B (0.00)C (1.00)
C (0.00)
Cheb
ulin
ic ac
id (%
)
A (0.00)
A (1.00) B (0.00)C (1.00)
C (0.00)
Cheb
ulin
ic ac
id (%
)
A (0.00)
A (1.00) B (0.00)C (1.00)
C (0.00)
7.0006.000
6.000
5.000 5.0004.000 4.0003.000 3.0002.000 2.0001.000
1.000
6.0005.0004.0003.0002.0001.0000.0000.000
Tota
l (%
)
A (0.00)
B (1.00)
A (1.00) B (0.00)C (1.00)
C (0.00)
Tota
l (%
)
A (0.00)
B (1.00)
A (1.00) B (0.00)C (1.00)
C (0.00)
Tota
l (%
)
A (0.00)
B (1.00)
(a)
(b)
(c)
(d)
(e)
(f)
Figure 3: 3D response surfaces of model conditions of (a) extraction yield, (b) gallic acid content, (c) corilagin content, (d) chebulagic acidcontent, (e) chebulinic acid content, and (f) total content of four phenolic compounds. A, B, and C were T. chebula, T. bellirica, and P. emblica,respectively.
7International Journal of Food Science
Y8 = 0:98X1 + 0:99X2 + 1:01X3 − 2:10X1X2− 1:45X1X3 − 2:03X2X3,
ð21Þ
Y9 = 0:98X1 + 1:00X2 + 0:93X3 − 1:88X1X2− 1:21X1X3 − 2:36X2X3,
ð22Þ
Y10 = 0:98X1 + 1:01X2 + 0:93X3 − 1:82X1X2− 1:31X1X3 − 2:38X2X3,
ð23Þ
Y11 = 0:98X1 + 1:02X2 + 0:91X3 − 1:89X1X2− 0:57X1X3 − 2:42X2X3,
ð24Þ
Y12 = 0:98X1 + 1:00X2 + 0:96X3 − 1:92X1X2− 1:37X1X3 − 2:24X2X3:
ð25Þ
3.2.2. Decoction with Gamma Irradiation.
Y7 = 0:99X1 + 0:99X2 + 0:98X3 − 2:05X1X2− 1:90X1X3 − 1:81X2X3,
ð26Þ
Y8 = 0:96X1 + 1:00X2 + 0:99X3 − 2:01X1X2− 2:15X1X3 − 2:20X2X3,
ð27Þ
Y9 = 0:99X1 + 1:01X2 + 1:00X3 − 2:28X1X2− 2:56X1X3 − 0:51X2X3,
ð28Þ
Y10 = 0:97X1 + 1:02X2 + 0:97X3 − 2:17X1X2− 2:06X1X3 − 0:87X2X3,
ð29Þ
Y11 = 0:99X1 + 0:99X2 + 0:99X3 − 1:68X1X2+ 5:85X1X3 − 1:29X2X3 − 35:69X2
1X2X3+ 18:20X1X
22X3 − 41:06X1X2X
23,
ð30Þ
Y12 = 1:00X1 + 1:00X2 + 1:00X3 − 2:15X1X2− 2:04X1X3 − 1:68X2X3 − 6:19X2
1X2X3+ 13:91X1X
22X3 − 2:67X1X2X
23:
ð31Þ
3.2.3. Infusion.
Y7 = 1:00X1 + 1:00X2 + 1:00X3 − 2:29X1X2− 2:16X1X3 − 2:05X2X3 − 3:66X2
1X2X3+ 14:24X1X
22X3 − 1:44X1X2X
23,
ð32Þ
Y8 = 0:97X1 + 1:00X2 + 1:00X3 − 2:14X1X2− 2:26X1X3 − 1:65X2X3,
ð33Þ
Y9 = 1:00X1 + 1:00X2 + 1:00X3 − 2:48X1X2− 3:54X1X3 − 2:22X2X3 − 6:96X2
1X2X3+ 25:33X1X
22X3 + 0:68X1X2X
23,
ð34Þ
Y10 = 1:00X1 + 1:00X2 + 1:00X3 − 2:35X1X2− 3:34X1X3 − 2:23X2X3 − 5:36X2
1X2X3+ 26:86X1X
22X3 − 3:68X1X2X
23,
ð35Þ
Y11 = 1:01X1 + 1:01X2 + 1:01X3 − 1:92X1X2− 1:40X1X3 − 1:63X2X3 − 21:43X2
1X2X3+ 22:80X1X
22X3 − 0:58X1X2X
23,
ð36Þ
Y12 = 1:00X1 + 1:00X2 + 1:00X3 − 2:28X1X2− 2:61X1X3 − 2:02X2X3 − 9:78X2
1X2X3+ 20:65X1X
22X3 − 1:11X1X2X
23:
ð37Þ
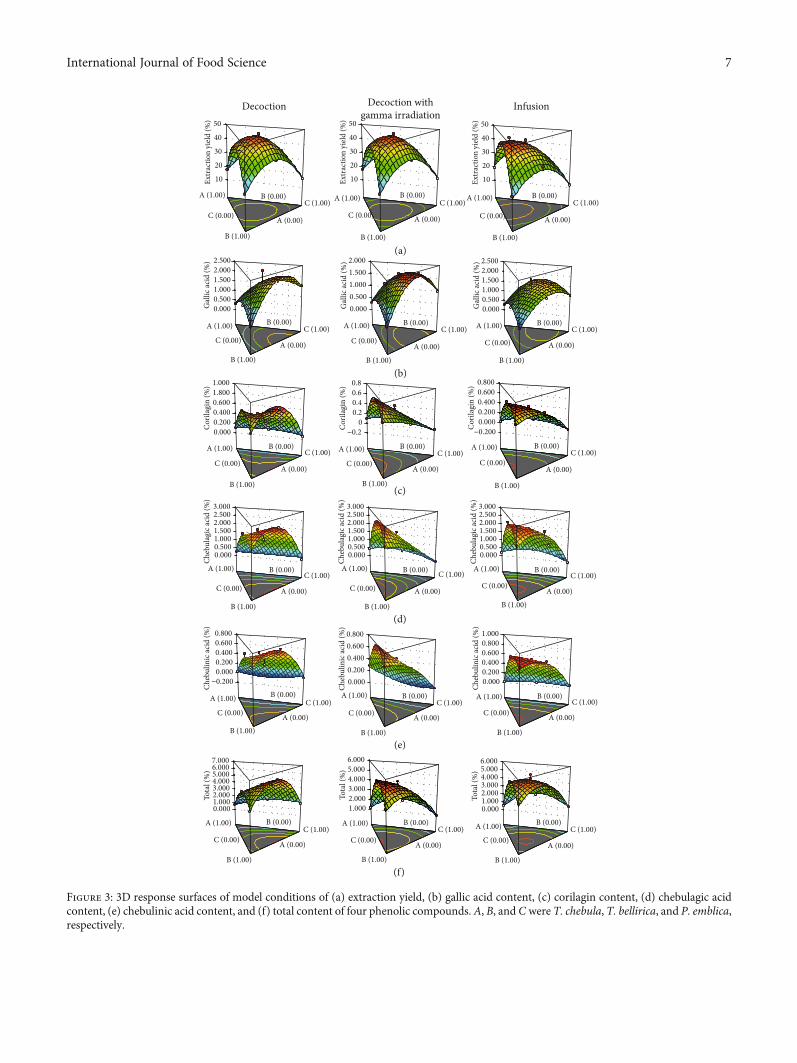
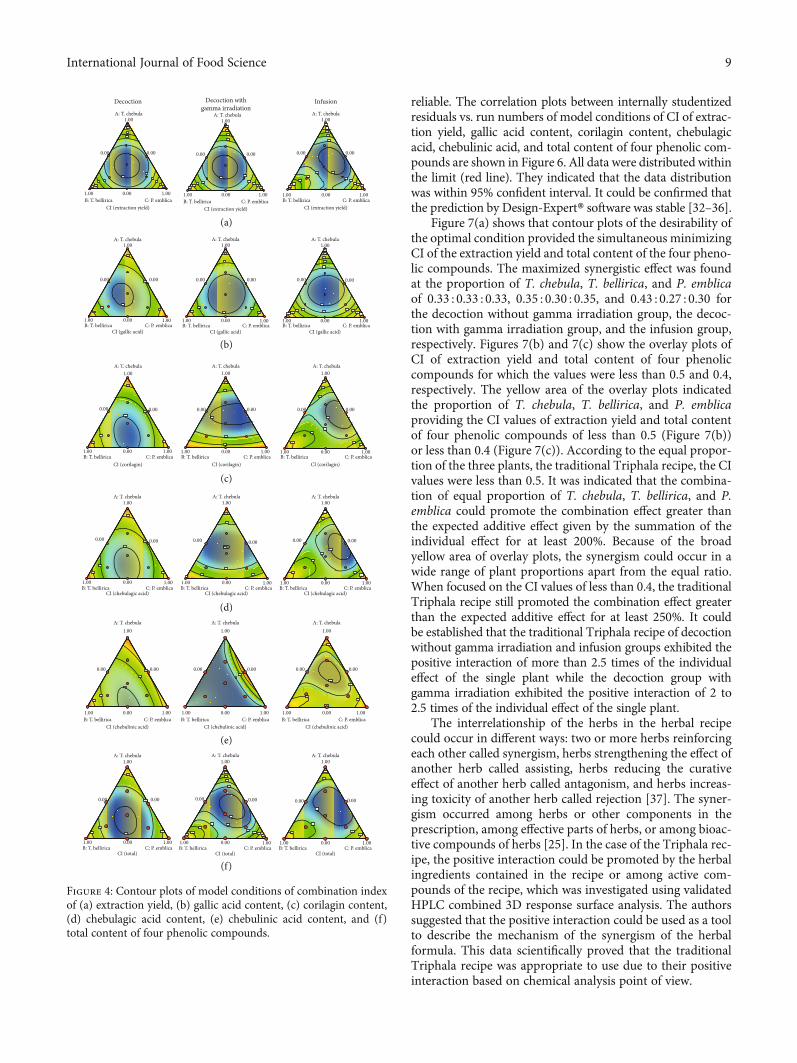
Figure 4 shows the contour plots of model conditions ofCI of extraction yield, the individual content of phenoliccompounds, and total content of four phenolic compounds.It was focused on the low CI value which reflects a high levelof interaction. The low CI of the extraction yield of decoctiongroups with or without gamma irradiation was found at theequal proportion of the three plants. In case of the infusiongroup, the low extraction yield was found at the mediumproportion of T. chebula with the low to medium proportionof T. bellirica and the medium proportion of P. emblica(Figure 4(a)). The low CI of gallic acid content of decoctiongroups with or without gamma irradiation and the infusiongroup were achieved at the equal proportion of the threeplants (Figure 4(b)). The low CI of corilagin and chebulagicacid content of the decoction group without gamma irradia-tion was achieved at the low to medium proportion of T.chebula with the medium proportion of T. bellirica and themedium proportion of P. emblica. The low CI of corilaginand chebulagic acid content of the decoction group withgamma irradiation was achieved at the equal proportion ofthe three plants. The low CI of corilagin and chebulagic acidcontent of the infusion group was achieved at the mediumproportion of T. chebula with the low proportion of T. bellir-ica and the medium proportion of P. emblica (Figures 4(c)and 4(d)). The low CI of chebulinic acid content of the decoc-tion group without gamma irradiation was achieved at thelow proportion of T. chebula with the medium proportionof T. bellirica and the medium proportion of P. emblica.The low CI of chebulinic acid content of the decoction groupwith gamma irradiation was achieved at the low to high pro-portion of T. chebula with the medium to high proportion ofT. bellirica and the low to high proportion of P. emblica. Thelow CI of chebulinic acid content of the infusion group wasachieved at the medium proportion of T. chebula with thelow to medium proportion of T. bellirica and the mediumproportion of P. emblica (Figure 4(e)). The low CI of totalcontent of four phenolic compounds of the decoction groupwithout gamma irradiation was achieved at the equal propor-tion of the three plants. The low CI of total content of fourphenolic compounds of the decoction group with gammairradiation and the infusion group was achieved at themedium proportion of T. chebula with the low to mediumproportion of T. bellirica and the medium proportion of P.emblica (Figure 4(f)).
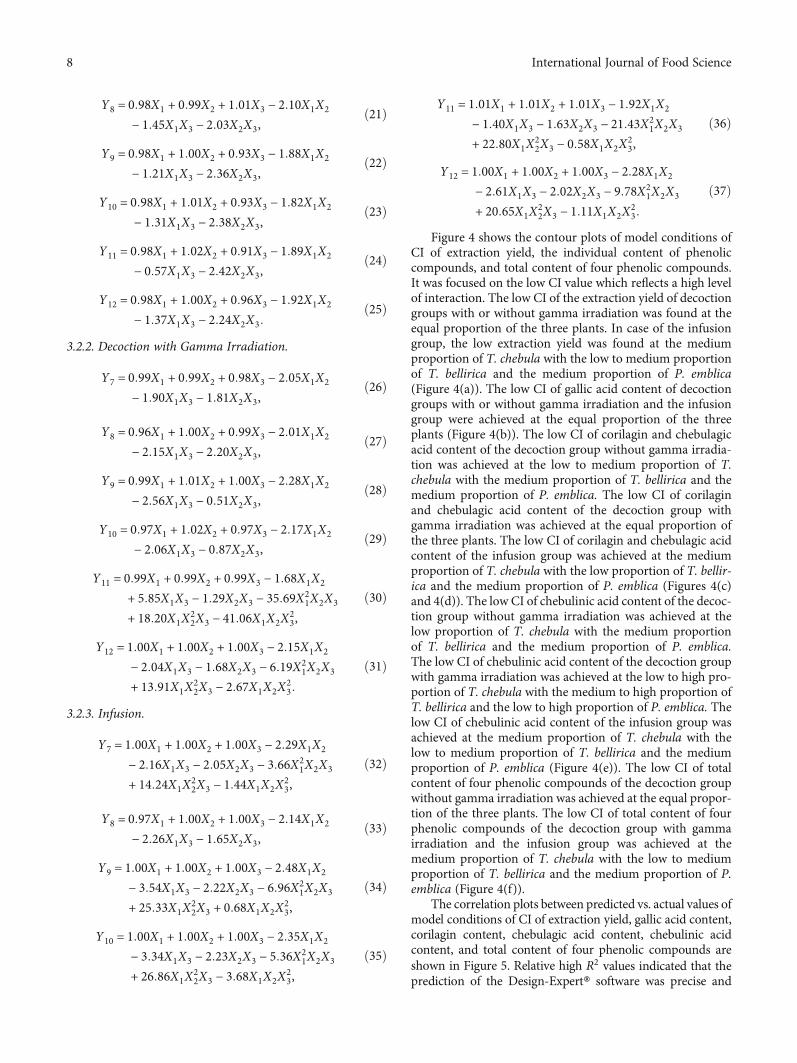
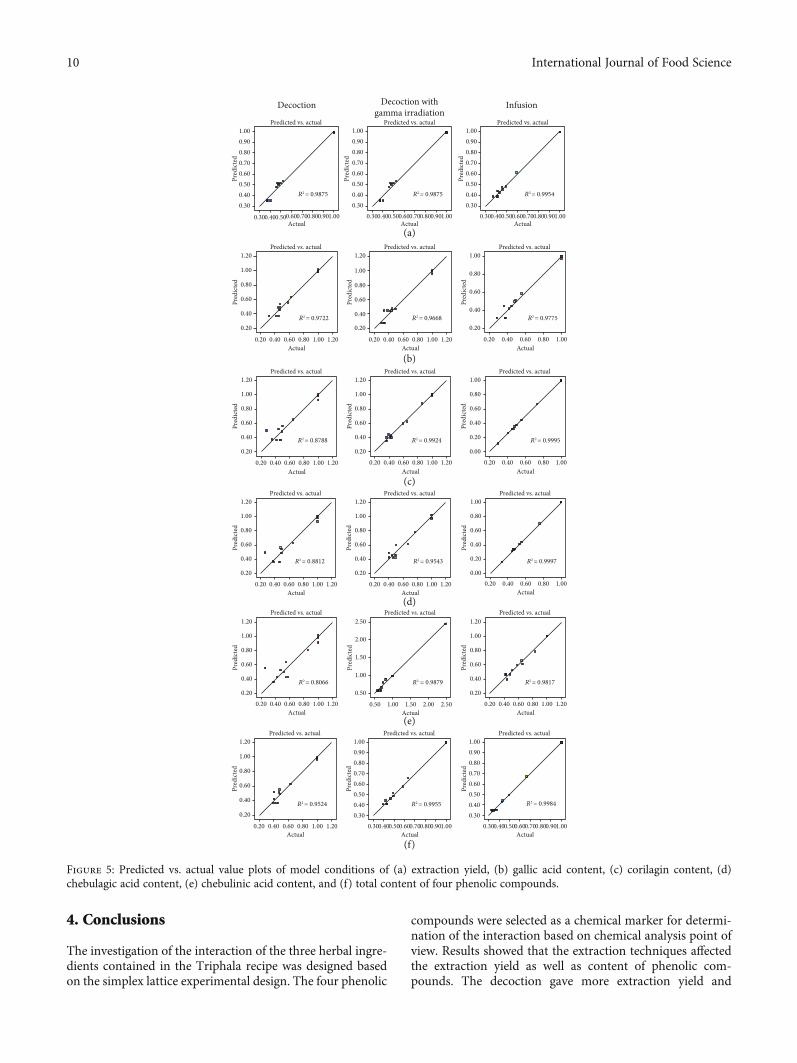
The correlation plots between predicted vs. actual values ofmodel conditions of CI of extraction yield, gallic acid content,corilagin content, chebulagic acid content, chebulinic acidcontent, and total content of four phenolic compounds areshown in Figure 5. Relative high R2 values indicated that theprediction of the Design-Expert® software was precise and
8 International Journal of Food Science
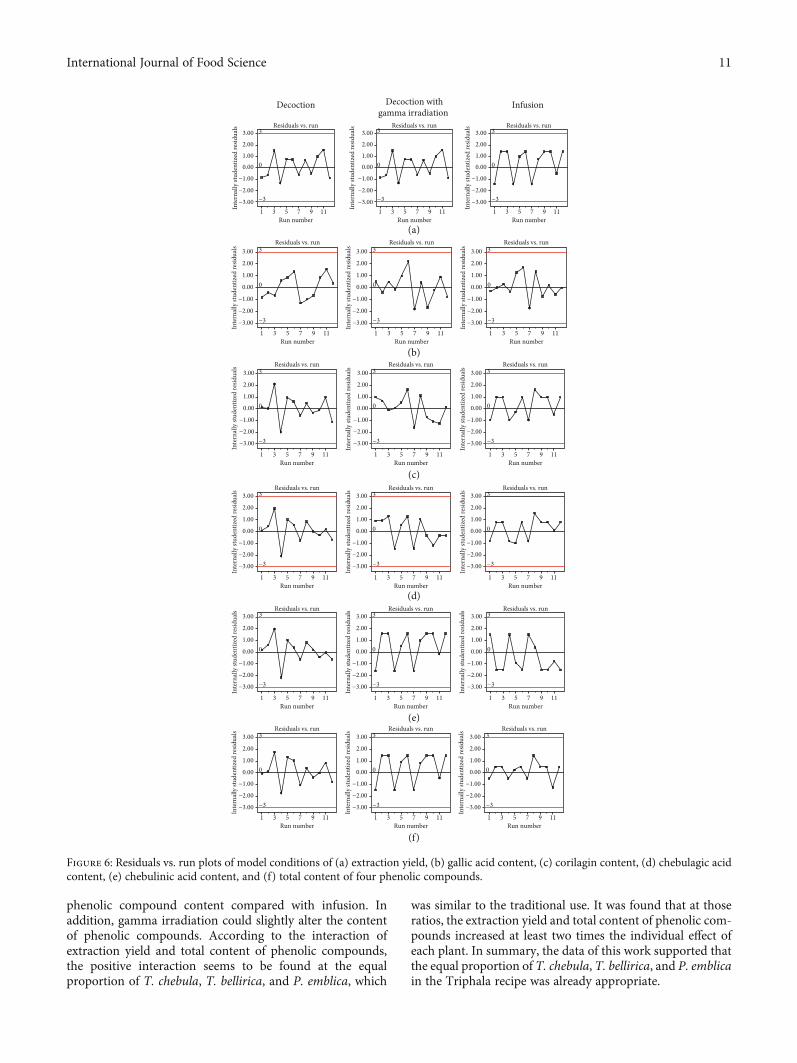
reliable. The correlation plots between internally studentizedresiduals vs. run numbers of model conditions of CI of extrac-tion yield, gallic acid content, corilagin content, chebulagicacid, chebulinic acid, and total content of four phenolic com-pounds are shown in Figure 6. All data were distributed withinthe limit (red line). They indicated that the data distributionwas within 95% confident interval. It could be confirmed thatthe prediction by Design-Expert® software was stable [32–36].
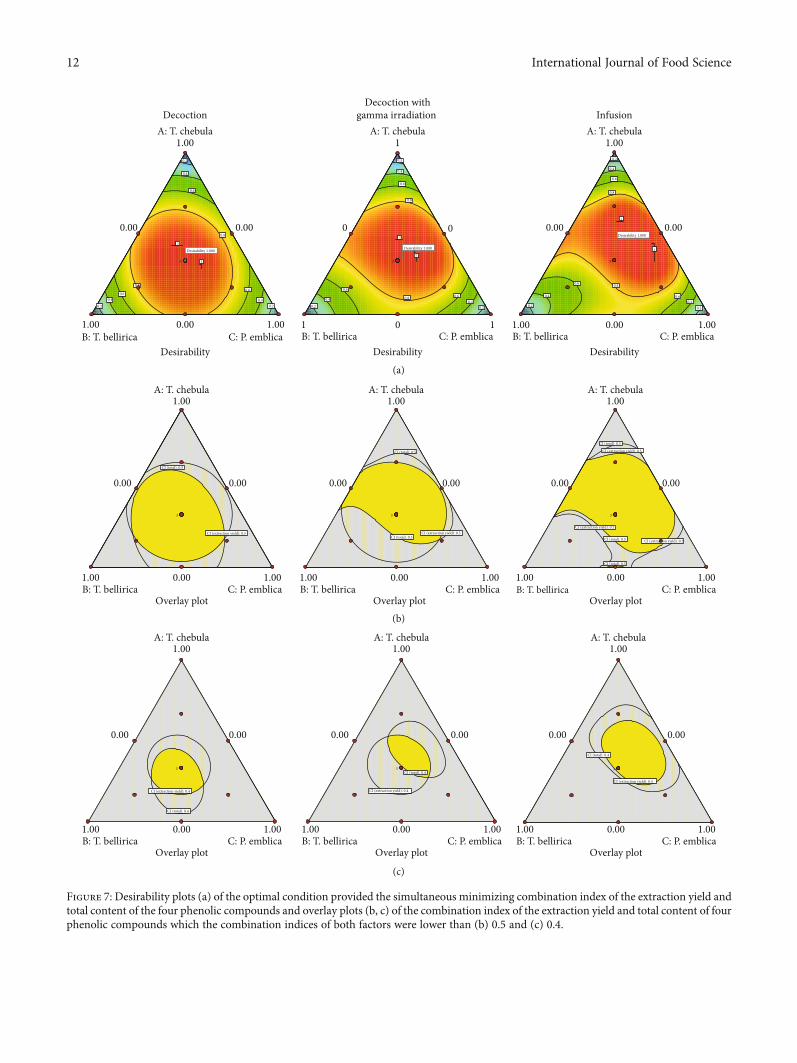
Figure 7(a) shows that contour plots of the desirability ofthe optimal condition provided the simultaneous minimizingCI of the extraction yield and total content of the four pheno-lic compounds. The maximized synergistic effect was foundat the proportion of T. chebula, T. bellirica, and P. emblicaof 0.33 : 0.33 : 0.33, 0.35 : 0.30 : 0.35, and 0.43 : 0.27 : 0.30 forthe decoction without gamma irradiation group, the decoc-tion with gamma irradiation group, and the infusion group,respectively. Figures 7(b) and 7(c) show the overlay plots ofCI of extraction yield and total content of four phenoliccompounds for which the values were less than 0.5 and 0.4,respectively. The yellow area of the overlay plots indicatedthe proportion of T. chebula, T. bellirica, and P. emblicaproviding the CI values of extraction yield and total contentof four phenolic compounds of less than 0.5 (Figure 7(b))or less than 0.4 (Figure 7(c)). According to the equal propor-tion of the three plants, the traditional Triphala recipe, the CIvalues were less than 0.5. It was indicated that the combina-tion of equal proportion of T. chebula, T. bellirica, and P.emblica could promote the combination effect greater thanthe expected additive effect given by the summation of theindividual effect for at least 200%. Because of the broadyellow area of overlay plots, the synergism could occur in awide range of plant proportions apart from the equal ratio.When focused on the CI values of less than 0.4, the traditionalTriphala recipe still promoted the combination effect greaterthan the expected additive effect for at least 250%. It couldbe established that the traditional Triphala recipe of decoctionwithout gamma irradiation and infusion groups exhibited thepositive interaction of more than 2.5 times of the individualeffect of the single plant while the decoction group withgamma irradiation exhibited the positive interaction of 2 to2.5 times of the individual effect of the single plant.
The interrelationship of the herbs in the herbal recipecould occur in different ways: two or more herbs reinforcingeach other called synergism, herbs strengthening the effect ofanother herb called assisting, herbs reducing the curativeeffect of another herb called antagonism, and herbs increas-ing toxicity of another herb called rejection [37]. The syner-gism occurred among herbs or other components in theprescription, among effective parts of herbs, or among bioac-tive compounds of herbs [25]. In the case of the Triphala rec-ipe, the positive interaction could be promoted by the herbalingredients contained in the recipe or among active com-pounds of the recipe, which was investigated using validatedHPLC combined 3D response surface analysis. The authorssuggested that the positive interaction could be used as a toolto describe the mechanism of the synergism of the herbalformula. This data scientifically proved that the traditionalTriphala recipe was appropriate to use due to their positiveinteraction based on chemical analysis point of view.
Infusion
0.00 0.00
A: T. chebula1.00
B: T. bellirica1.00
C: P. emblica1.000.00
CI (extraction yield)
0.40.5
0.5
0.5
0.6
0.6
0.6
0.7
0.7
0.7
0.8 0.8
0.8
0.9 0.9
0.9
Decoction
A: T. chebula1.00
B: T. bellirica1.00
C: P. emblica1.00
0.00 0.00
0.00
CI (extraction yield)
0.9
0.8
0.7
0.6
0.60.7
0.80.9
0.4
0.5
0.6
0.7
0.80.9
Decoction withgamma irradiation
A: T. chebula1.00
B: T. bellirica1.00
C: P. emblica1.00
0.00 0.00
0.00
CI (extraction yield)
0.40.5
0.6 0.6
0.6
0.7 0.7
0.7
0.8 0.80.9 0.9
0.9
0.8
0.00 0.00
A: T. chebula1.00
B: T. bellirica1.00
C: P. emblica1.000.00
CI (gallic acid)
0.4
0.60.6
0.6
0.8 0.8
0.8
0.00 0.00
A: T. chebula1.00
B: T. bellirica1.00
C: P. emblica1.000.00
CI (gallic acid)
0.4
0.5
0.5
0.6 0.6
0.6
0.7 0.7
0.7
0.8 0.8
0.8
0.9 0.9
0.9
A: T. chebula1.00
B: T. bellirica1.00
C: P. emblica1.00
0.00 0.00
0.00
CI (gallic acid)
0.4
0.6
0.6
0.8
0.8
0.8
0.00 0.00
CI (corilagin)
A: T. chebula1.00
B: T. bellirica1.00
C: P. emblica1.000.00
0.2
0.4
0.4
0.6
0.6
0.6
0.8
0.8
0.8
0.00 0.00
CI (corilagin)
A: T. chebula1.00
B: T. bellirica1.00
C: P. emblica1.000.00
0.4
0.6
0.6
0.8
0.8
A: T. chebula1.00
B: T. bellirica1.00
C: P. emblica1.00
0.00 0.00
0.00
CI (corilagin)
0.4
0.6
0.6
0.80.8
0.8
B: T. bellirica1.00
C: P. emblica1.000.00
CI (chebulagic acid)
0.4
0.6
0.6
0.8 0.8
0.8
0.00 0.00
A: T. chebula1.00
B: T. bellirica1.00
C: P. emblica1.000.00
CI (chebulagic acid)
0.4
0.6
0.6
0.8 0.8
0.8
1
0.00 0.00
A: T. chebula1.00
B: T. bellirica1.00
C: P. emblica1.000.00
CI (chebulagic acid)
0.2
0.4
0.6
0.6
0.6
0.8
0.8
0.8
0.00 0.00
A: T. chebula1.00
0.000.00
B: T. bellirica1.00
C: P. emblica1.000.00
CI (chebulinic acid)
0.4
0.6
0.6
0.8
0.8
0.8
A: T. chebula1.00
0.000.00
B: T. bellirica1.00
C: P. emblica1.000.00
CI (chebulinic acid)
1
1.52
A: T. chebula1.00
B: T. bellirica1.00
C: P. emblica1.00
0.00 0.00
0.00
CI (chebulinic acid)
0.4
0.6
0.6
0.8
A: T. chebula1.00
0.8
B: T. bellirica1.00
C: P. emblica1.00
0.00 0.00
0.00
CI (total)
0.4
0.6
0.6
0.80.8
0.8
A: T. chebula1.00
0.000.00
B: T. bellirica1.00
C: P. emblica1.000.00
CI (total)
0.4
0.5
0.5
0.6
0.6
0.6
0.7
0.7
0.7
0.80.8
0.8
0.9 0.9
0.9
A: T. chebula1.00
0.000.00
B: T. bellirica1.00
C: P. emblica1.000.00
CI (total)
0.4
0.6
0.6
0.6
0.8
0.8
0.8
A: T. chebula1.00
(a)
(b)
(c)
(d)
(e)
(f)
Figure 4: Contour plots of model conditions of combination indexof (a) extraction yield, (b) gallic acid content, (c) corilagin content,(d) chebulagic acid content, (e) chebulinic acid content, and (f)total content of four phenolic compounds.
9International Journal of Food Science
4. Conclusions
The investigation of the interaction of the three herbal ingre-dients contained in the Triphala recipe was designed basedon the simplex lattice experimental design. The four phenolic
compounds were selected as a chemical marker for determi-nation of the interaction based on chemical analysis point ofview. Results showed that the extraction techniques affectedthe extraction yield as well as content of phenolic com-pounds. The decoction gave more extraction yield and
Predicted vs. actual Predicted vs. actual Predicted vs. actual
Infusion
Pred
icte
d
0.30
0.300.400.500.600.700.800.901.00 0.300.400.500.600.700.800.901.00 0.300.400.500.600.700.800.901.00
0.400.500.600.700.800.901.00
Pred
icte
d
0.300.400.500.600.700.800.901.00
Pred
icte
d
0.300.400.500.600.700.800.901.00
R2 = 0.9875 R
2 = 0.9875 R2 = 0.9954
Decoction withgamma irradiation
Decoction
Actual Actual ActualPr
edic
ted
0.20
0.40
0.60
0.80
1.00
1.20
Pred
icte
d
0.20
0.40
0.60
0.80
1.00
1.20
Pred
icte
d
0.20
0.40
0.60
0.80
1.00
R2 = 0.9722 R
2 = 0.9668 R2 = 0.9775
0.20 0.40 0.60 0.80 1.00 1.20 0.20 0.40 0.60 0.80 1.00 1.20 0.20 0.40 0.60 0.80 1.00
Predicted vs. actual Predicted vs. actual Predicted vs. actual
Actual Actual Actual
Pred
icte
d
0.20
0.40
0.60
0.80
1.00
1.20
0.20
0.40
0.60
0.80
1.00
1.20
Pred
icte
d
Pred
icte
d0.00
0.20
0.40
0.60
0.80
1.00
Actual Actual Actual
Predicted vs. actual Predicted vs. actual Predicted vs. actual
R2 = 0.8788 R
2 = 0.9924 R2 = 0.9995
0.20 0.40 0.60 0.80 1.00 1.20 0.20 0.40 0.60 0.80 1.00 1.20 0.20 0.40 0.60 0.80 1.00
0.20
0.40
0.60
0.80
1.00
1.20
0.20
0.40
0.60
0.80
1.00
1.20
Pred
icte
d
Pred
icte
d
0.00
0.20
0.40
0.60
0.80
1.00
Pred
icte
d
0.20 0.40 0.60 0.80 1.00 1.20 0.20 0.40 0.60 0.80 1.00 1.20 0.20 0.40 0.60 0.80 1.00
R2 = 0.8812 R
2 = 0.9543 R2 = 0.9997
Actual Actual Actual
Predicted vs. actual Predicted vs. actual Predicted vs. actual
Pred
icte
d
0.20
0.40
0.60
0.80
1.00
1.20
Pred
icte
d
0.50
1.00
1.50
2.00
2.50
Pred
icte
d
0.20
0.40
0.60
0.80
1.00
1.20
0.20 0.40 0.60 0.80 1.00 1.20 0.50 1.00 1.50 2.00 2.50 0.20 0.40 0.60 0.80 1.00 1.20
R2 = 0.8066 R
2 = 0.9879 R2 = 0.9817
Actual Actual Actual
Predicted vs. actual Predicted vs. actual Predicted vs. actual
Pred
icte
d
0.20
0.40
0.60
0.80
1.00
1.20
Actual
Pred
icte
d
0.300.400.500.600.700.800.901.00
0.300.400.500.600.700.800.901.00
Pred
icte
d
Predicted vs. actual Predicted vs. actual Predicted vs. actual
0.20 0.40 0.60 0.80 1.00 1.20Actual
0.30 0.500.600.40 0.700.800.901.00 0.30 0.500.600.40 0.700.800.901.00Actual
R2 = 0.9524 R
2 = 0.9955 R2 = 0.9984
(a)
(b)
(c)
(d)
(e)
(f)
Figure 5: Predicted vs. actual value plots of model conditions of (a) extraction yield, (b) gallic acid content, (c) corilagin content, (d)chebulagic acid content, (e) chebulinic acid content, and (f) total content of four phenolic compounds.
10 International Journal of Food Science
phenolic compound content compared with infusion. Inaddition, gamma irradiation could slightly alter the contentof phenolic compounds. According to the interaction ofextraction yield and total content of phenolic compounds,the positive interaction seems to be found at the equalproportion of T. chebula, T. bellirica, and P. emblica, which
was similar to the traditional use. It was found that at thoseratios, the extraction yield and total content of phenolic com-pounds increased at least two times the individual effect ofeach plant. In summary, the data of this work supported thatthe equal proportion of T. chebula, T. bellirica, and P. emblicain the Triphala recipe was already appropriate.
Decoction Decoction withgamma irradiation
Infusion
Run number
Residuals vs. run Residuals vs. run Residuals vs. run
1 3 5 7 9 11Run number
1 3 5 7 9 11Run number
1 3 5 7 9 11
3
−3
0
Inte
rnal
ly st
uden
tized
resid
uals 3
−3
0
Inte
rnal
ly st
uden
tized
resid
uals 3
−3
0
Inte
rnal
ly st
uden
tized
resid
uals
−3.00
−2.00
−1.00
1.00
0.00
2.00
3.00
−3.00
−2.00
−1.00
1.00
0.00
2.00
3.00
−3.00
−2.00
−1.00
1.00
0.00
2.00
3.00
Inte
rnal
ly st
uden
tized
resid
uals
Inte
rnal
ly st
uden
tized
resid
uals
Inte
rnal
ly st
uden
tized
resid
uals3
−3
0
3
−3
0
3
−3
0
Run number
Residuals vs. run Residuals vs. run Residuals vs. run
1 3 5 7 9 11Run number
1 3 5 7 9 11Run number
1 3 5 7 9 11−3.00
−2.00
−1.00
1.00
0.00
2.00
3.00
−3.00
−2.00
−1.00
1.00
0.00
2.00
3.00
−3.00
−2.00
−1.00
1.00
0.00
2.00
3.00
3
−3
0
3
−3
0
3
−3
0
Inte
rnal
ly st
uden
tized
resid
uals
Inte
rnal
ly st
uden
tized
resid
uals
Inte
rnal
ly st
uden
tized
resid
uals
Run number1 3 5 7 9 11
Run number1 3 5 7 9 11
Run number1 3 5 7 9 11
Residuals vs. run Residuals vs. run Residuals vs. run
−3.00
−2.00
−1.00
1.00
0.00
2.00
3.00
−3.00
−2.00
−1.00
1.00
0.00
2.00
3.00
−3.00
−2.00
−1.00
1.00
0.00
2.00
3.00
3
−3
0
3
−3
0
3
−3
0
Inte
rnal
ly st
uden
tized
resid
uals
Inte
rnal
ly st
uden
tized
resid
uals
Inte
rnal
ly st
uden
tized
resid
uals
Run number1 3 5 7 9 11
Run number1 3 5 7 9 11
Run number1 3 5 7 9 11
Residuals vs. run Residuals vs. run Residuals vs. run
−3.00
−2.00
−1.00
1.00
0.00
2.00
3.00
−3.00
−2.00
−1.00
1.00
0.00
2.00
3.00
−3.00
−2.00
−1.00
1.00
0.00
2.00
3.00
3
−3
0
3
−3
0
3
−3
0
Run number
Residuals vs. run Residuals vs. run Residuals vs. run
−3.001 3 5 7 9 11
Run number1 3 5 7 9 11
Run number1 3 5 7 9 11
−2.00
−1.00
1.00
0.00
2.00
3.00
Inte
rnal
ly st
uden
tized
resid
uals
Inte
rnal
ly st
uden
tized
resid
uals
Inte
rnal
ly st
uden
tized
resid
uals
−3.00
−2.00
−1.00
1.00
0.00
2.00
3.00
−3.00
−2.00
−1.00
1.00
0.00
2.00
3.00
(a)
(b)
(c)
(d)
(e)
(f)
Figure 6: Residuals vs. run plots of model conditions of (a) extraction yield, (b) gallic acid content, (c) corilagin content, (d) chebulagic acidcontent, (e) chebulinic acid content, and (f) total content of four phenolic compounds.
11International Journal of Food Science
DecoctionDecoction with
gamma irradiation InfusionA: T. chebula
1.00A: T. chebula
1.00A: T. chebula
1
C: P. emblicaB: T. bellirica1.00 1.00
0.00 0.00 0.00 0.00
0.00
Desirability
0.2 0.2
0.2
0.4 0.4
0.4
0.60.6
0.6
0.8
0.8
1
1
3
B: T. bellirica1
C: P. emblica1
00
0
Desirability
0.2 0.2
0.2
0.4 0.4
0.4
0.60.6
0.6
0.8
0.8
1
1
1
3
B: T. bellirica1.00
C: P. emblica1.000.00
Desirability
0.2 0.2
0.2
0.40.4
0.4
0.6
0.6
0.6
0.8
0.8
1
1
3
Desirability 1.000 Desirability 1.000
Desirability 1.000
B: T. bellirica1.00
C: P. emblica1.000.00
Overlay plotB: T. bellirica1.00
C: P. emblica1.000.00
Overlay plotB: T. bellirica1.00
C: P. emblica1.000.00
Overlay plot
3 3 3
0.00 0.00 0.00 0.00 0.00 0.00
A: T. chebula1.00
A: T. chebula1.00
A: T. chebula1.00
CI (total): 0.5
CI (total): 0.5
CI (total): 0.5
CI (total): 0.5
CI (total): 0.5
CI (total): 0.5CI (extraction yield): 0.5 CI (extraction yield): 0.5
CI (extraction yield): 0.5
CI (extraction yield): 0.5
CI (extraction yield): 0.5
3 3 3
B: T. bellirica1.00
C: P. emblica1.000.00
Overlay plotB: T. bellirica1.00
C: P. emblica1.000.00
Overlay plotB: T. bellirica1.00
C: P. emblica1.000.00
Overlay plot
0.00 0.00 0.00 0.000.000.00
A: T. chebula1.00
A: T. chebula1.00
A: T. chebula1.00
CI (total): 0.4
CI (total): 0.4
CI (total): 0.4
CI (extraction yield): 0.4 CI (extraction yield): 0.4
CI (extraction yield): 0.4
(a)
(b)
(c)
Figure 7: Desirability plots (a) of the optimal condition provided the simultaneous minimizing combination index of the extraction yield andtotal content of the four phenolic compounds and overlay plots (b, c) of the combination index of the extraction yield and total content of fourphenolic compounds which the combination indices of both factors were lower than (b) 0.5 and (c) 0.4.
12 International Journal of Food Science
Data Availability
The data used to support the findings of this study areavailable from the corresponding author upon request.
Conflicts of Interest
All authors declare that they have no conflicts of interest.
Acknowledgments
We would like to acknowledge Mr. Wipas Wiboolsamai andMiss Patcharawadee Cheerawattana for research assistance.We also acknowledge Prof. Dr. J. E. Moreton, School of Phar-macy, University of Maryland, at Baltimore, USA, for readingand editing English language in this paper. This research didnot receive any specific grant from funding agencies in thepublic, commercial, or not-for-profit sectors.
References
[1] C. T. Peterson, K. Denniston, and D. Chopra, “Therapeuticuses of Triphala in Ayurvedic medicine,” Journal of Alternativeand Complementary Medicine, vol. 23, no. 8, pp. 607–614,2017.
[2] A. Tarasiuk, P. Mosińska, and J. Fichna, “Triphala: currentapplications and new perspectives on the treatment of func-tional gastrointestinal disorders,” Chinese Medicine, vol. 13,no. 1, p. 39, 2018.
[3] V. Pawar, P. Lahorkar, and D. B. Anantha Narayana, “Devel-opment of a RP-HPLC method for analysis of Triphala Curnaand its applicability to test variations in Triphala Curna prep-arations,” Indian Journal of Pharmaceutical Sciences, vol. 71,no. 4, pp. 382–386, 2009.
[4] L. Charoenchai, P. Pathompak, F. Madaka, S. Settharaksa, andW. Saingam, “HPLC-MS profiles and quantitative analysis ofTriphala formulation,” Bulletin of Health, Science and Technol-ogy, vol. 14, no. 1, pp. 57–67, 2016.
[5] S. R. Varma, T. O. Sivaprakasam, A. Mishra et al., “Protectiveeffects of Triphala on dermal fibroblasts and human keratino-cytes,” PLoS One, vol. 11, no. 1, article e0145921, 2016.
[6] E. Vamanu and S. Nita, “Antioxidant capacity and the correla-tion with major phenolic compounds, anthocyanin, andtocopherol content in various extracts from the wild edibleBoletus edulis mushroom,” BioMed Research International,vol. 2013, Article ID 313905, 11 pages, 2013.
[7] E. A. Turumtay, F. İslamoğlu, D. Çavuş, H. Şahin,H. Turumtay, and B. Vanholme, “Correlation between pheno-lic compounds and antioxidant activity of Anzer tea (Thymuspraecox Opiz subsp. caucasicus var. caucasicus),” IndustrialCrops and Products, vol. 52, pp. 687–694, 2014.
[8] G. Piluzza and S. Bullitta, “Correlations between phenolic con-tent and antioxidant properties in twenty-four plant species oftraditional ethnoveterinary use in the Mediterranean area,”Pharmaceutical Biology, vol. 49, no. 3, pp. 240–247, 2010.
[9] X. Li, X. Wu, and L. Huang, “Correlation between antioxidantactivities and phenolic contents of radix Angelicae sinensis(Danggui),” Molecules, vol. 14, no. 12, pp. 5349–5361, 2009.
[10] M. H. Carlsen, B. L. Halvorsen, K. Holte et al., “The total anti-oxidant content of more than 3100 foods, beverages, spices,
herbs and supplements used worldwide,” Nutrition Journal,vol. 9, no. 1, p. 3, 2010.
[11] S. N. Save and S. Choudhary, “Effects of triphala and guggulaqueous extracts on inhibition of protein fibrillation and disso-lution of preformed fibrils,” RSC Advances, vol. 7, no. 33,pp. 20460–20468, 2017.
[12] X. Zhou, V. Razmovski-Naumovski, A. Kam et al., “Synergisticstudy of a Danshen (Salvia Miltiorrhizae Radix et Rhizoma)and Sanqi (Notoginseng Radix et Rhizoma) combination oncell survival in EA.hy926 cells,” BMC Complementary andAlternative Medicine, vol. 19, no. 1, p. 50, 2019.
[13] M. Bahmani, M. Taherikalani, M. Khaksarian et al., “The syn-ergistic effect of hydroalcoholic extracts ofOriganum vulgare,-Hypericum perforatumand their active components carvacroland hypericin againstStaphylococcus aureus,” Future ScienceOA, vol. 5, no. 3, article FSO371, 2019.
[14] I. Y. Bae, B.-Y. Kwak, and H. G. Lee, “Synergistic antiradicalaction of natural antioxidants and herbal mixture for prevent-ing dioxin toxicity,” Food Science and Biotechnology, vol. 21,no. 2, pp. 491–496, 2012.
[15] A. Bag and R. R. Chattopadhyay, “Evaluation of synergisticantibacterial and antioxidant efficacy of essential oils of spicesand herbs in combination,” PLoS One, vol. 10, no. 7, articlee0131321, 2015.
[16] K. M. Lau, K. K. Lai, C. L. Liu et al., “Synergistic interactionbetween Astragali Radix and Rehmanniae Radix in a Chineseherbal formula to promote diabetic wound healing,” Journalof Ethnopharmacology, vol. 141, no. 1, pp. 250–256, 2012.
[17] F. S. Youssef, R. M. Labib, O. A. Eldahshan, and A. N. B. Sin-gab, “Synergistic hepatoprotective and antioxidant effect ofartichoke, fig, blackberry herbal mixture on HepG2 cells andtheir metabolic profiling using NMR coupled with chemo-metrics,” Chemistry & Biodiversity, vol. 14, no. 12, articlee1700206, 2017.
[18] M. Nikkhah, M. Hashemi, M. B. Habibi Najafi, andR. Farhoosh, “Synergistic effects of some essential oils againstfungal spoilage on pear fruit,” International Journal of FoodMicrobiology, vol. 257, pp. 285–294, 2017.
[19] Y. A. Crespo, L. R. Bravo Sánchez, Y. G. Quintana, A. S. T.Cabrera, A. Bermúdez del Sol, and D. M. G. Mayancha, “Eval-uation of the synergistic effects of antioxidant activity on mix-tures of the essential oil from Apium graveolens L., Thymusvulgaris L. and Coriandrum sativum L. using simplex-latticedesign,” Heliyon, vol. 5, no. 6, article e01942, 2019.
[20] A. Rosato, A. Carocci, A. Catalano et al., “Elucidation of thesynergistic action of Mentha piperita essential oil with com-mon antimicrobials,” PLoS One, vol. 13, no. 8, articlee0200902, 2018.
[21] C. Alaoui Jamali, A. Kasrati, M. Fadli, L. Hassani, D. Leach,and A. Abbad, “Synergistic effects of three Moroccan thymeessential oils with antibiotic cefixime,” Phytothérapie, vol. 16,no. S1, pp. S149–S154, 2018.
[22] Y. El Atki, I. Aouam, F. El Kamari et al., “Antibacterial activityof cinnamon essential oils and their synergistic potential withantibiotics,” Journal of Advanced Pharmaceutical Technology& Research, vol. 10, no. 2, pp. 63–67, 2019.
[23] S. Li and B. Zhang, “Traditional Chinese medicine networkpharmacology: theory, methodology and application,” ChineseJournal of Natural Medicines, vol. 11, no. 2, pp. 110–120, 2013.
[24] X. Zhou, S. W. Seto, D. Chang et al., “Synergistic effects of Chi-nese herbal medicine: a comprehensive review of methodology
13International Journal of Food Science
and current research,” Frontiers in Pharmacology, vol. 7,p. 201, 2016.
[25] H. Yuan, Q. Ma, H. Cui et al., “How can synergism of tradi-tional medicines benefit from network pharmacology?,”Mole-cules, vol. 22, no. 7, article 1135, 2017.
[26] A. Manoraj, V. Thevanesam, B. M. R. Bandara, A. Ekanayake,and V. Liyanapathirana, “Synergistic activity between Triphalaand selected antibiotics against drug resistant clinical isolates,”BMC Complementary and Alternative Medicine, vol. 19, no. 1,p. 199, 2019.
[27] J. Foucquier and M. Guedj, “Analysis of drug combinations:current methodological landscape,” Pharmacology Research& Perspectives, vol. 3, no. 3, article e00149, 2015.
[28] A. G. Chmielewski and W. Migdal, “Radiation decontamina-tion of herbs and spices,” Nukleonika, vol. 50, no. 4, pp. 179–184, 2005.
[29] E. Pereira, L. Barros, A. Antonio et al., “Is gamma radiationsuitable to preserve phenolic compounds and to decontami-nate mycotoxins in aromatic plants? A case-study with Aloysiacitrodora Paláu,” Molecules, vol. 22, no. 3, p. 347, 2017.
[30] T. Gumus, S. Albayrak, O. Sagdic, and M. Arici, “Effect ofgamma irradiation on total phenolic contents and antioxidantactivities of Satureja Hortensis, Thymus Vulgaris, and Thym-bra Spicata from Turkey,” International Journal of Food Prop-erties, vol. 14, no. 4, pp. 830–839, 2011.
[31] V. C. Ito, A. Alberti, S. Avila, M. Spoto, A. Nogueira, andG. Wosiacki, “Effects of gamma radiation on the phenoliccompounds and in vitro antioxidant activity of apple pomaceflour during storage using multivariate statistical techniques,”Innovative Food Science and Emerging Technologies, vol. 33,pp. 251–259, 2016.
[32] S. Duangjit, L. M. Mehr, M. Kumpugdee-Vollrath, andT. Ngawhirunpat, “Role of simplex lattice statistical design inthe formulation and optimization of microemulsions fortransdermal delivery,” Biological & Pharmaceutical Bulletin,vol. 37, no. 12, pp. 1948–1957, 2014.
[33] S. Duangjit, Y. Obata, H. Sano et al., “Menthosomes, novelultradeformable vesicles for transdermal drug delivery: opti-mization and characterization,” Biological & PharmaceuticalBulletin, vol. 35, no. 10, pp. 1720–1728, 2012.
[34] C. Monton and C. Luprasong, “Effect of temperature andduration time of maceration on nitrate content of Vernoniacinerea (L.) Less.: Circumscribed central composite designand method validation,” International Journal of Food Science,vol. 2019, Article ID 1281635, 8 pages, 2019.
[35] C. Monton, C. Luprasong, and L. Charoenchai, “Convectioncombined microwave drying affect quality of volatile oil com-positions and quantity of curcuminoids of turmeric raw mate-rial,” Revista Brasileira de Farmacognosia, vol. 29, no. 4,pp. 434–440, 2019.
[36] C. Monton, C. Luprasong, and L. Charoenchai, “Accelerationof turmeric drying using convection and microwave-assisteddrying technique: an optimization approach,” Journal of FoodProcessing and Preservation, vol. 43, no. 9, article e14096, 2019.
[37] W. Jia, W. Y. Gao, Y. Q. Yan et al., “The rediscovery of ancientChinese herbal formulas,” Phytotherapy Research, vol. 18,no. 8, pp. 681–686, 2004.
14 International Journal of Food Science