investigation of surface properties of lunar regolith
TRANSCRIPT

A N N A L E S U N I V E R S I T A T I S M A R I A E C U R I E - S K Ł O D O W S K A
L U B L I N – P O L O N I A
VOL. LXIII, 13 SECTIO AA 2008
Investigation of surface properties of lunar regolith – Part IV♣
E. Robens1*
, A. Dąbrowski2, E. Mendyk
2, J. Goworek
2, K. Skrzypiec
2,
M. Drewniak2, M. Dumańska-Słowik
4, W. Gac
2, R. Dobrowolski
2,
S. Pasieczna-Patkowska2, M. Huber
3, M. Iwan
2, K. J. Kurzydłowski
5,
T. Płociński5, J. Ryczkowski
2, Z. Rzączyńska
2 and J. W. Sobczak
6
1Institut für Anorganische Chemie und Analytische Chemie,
Johannes Gutenberg-Universität, Duesbergweg 10-14,
D-55099 Mainz, Germany, [email protected] 2Maria Curie-Skłodowska University. Faculty of Chemistry,
pl. Marii Curie-Skłodowskiej 2, 20-031 Lublin, Poland,
[email protected] 3Maria Curie-Skłodowska University, Department of Geology and
Protection of Litosphere. Institute of Earth Science,
Al. Kraśnicka 2cd, 20-718 Lublin, Poland, [email protected] 4 Department of Mineralogy, Petrography and Geochemistry.
Faculty of Geology, Geophysics and Environmental Protection,
AGH-University of Science and Technology, 30-059 Kraków,
Al. Mickiewicza 30., [email protected] 5 Warsaw University of Technology. Pl. Politechniki 1,
00-661 Warszawa, Poland, [email protected], 6 Institute of Physical Chemistry. Polish Academy of Sciences.
Kasprzaka 44/52, PL-01-224 Warszawa, Poland, [email protected]
We investigated three lunar regolith powder samples from the Apollo
missions. Apollo 11 and Apollo 12 samples come from lunar maria and
Apollo 16 sample from a highland region. In the present paper we
summarise in brief results of measurements using photoelectron
spectroscopy (XPS), micro-Raman spectroscopy (RM), x-ray diffraction
(XRD), x-ray fluorescence spectroscopy (XRF), temperature programmed
♣ This paper is dedicated to professor E. Chibowski on the occasion of his 65
th birthday
* Author for correspondence: [email protected]

Investigation of surface properties of lunar regolith – Part IV 145
reduction and oxidation (TPRO), thermogravimetry (TG), differential
thermal analysis (DTA) and nitrogen adsorption. Parts of samples are
visualised by means of scanning electron microscopy (SEM/EDX) and
atomic force microscopy (AFM).
1. INTRODUCTION
Between 1969 and 1972 six Apollo missions brought back 382 kg of lunar
rocks, core samples, pebbles, sand and dust from the lunar surface. The six space
flights returned 2200 separate samples from six different explorations sites on
the moon. In addition, three automated Soviet spacecraft returned samples
totalling 0.300 kg from three other lunar sites. Lunar soil and rock samples of the
Apollo and Luna missions have been examined in detail [1-5]. Planning of new
missions and establishing of a manned station at the moon require some more
information. Therefore we analysed the chemical composition and the
mineralogical structure of three soil samples of different origin using new
methods and modern equipment. The assumption of an inventory of water ice
suggests studying the surface properties of regolith in contact with water [6].
Besides remainders of bulk ice from asteroidal impacts, water- if present at the
moon - could exist as chemisorbed and vicinal water in some depth in regions,
which are protected from sun irradiation. Therefore new investigation and
evaluation methods have been applied for water sorption measurements at the
samples [7-9]. Looking at the moon with the naked eye, it can be seen easily that
there are bright and dark areas called 'maria' on its surface [10]. Telescopic
observations showed that the maria are very flat, and are very different from the
heavily cratered and mountainous so-called highlands. We have learned that the
maria are relatively young areas on the moon which were generated after very
large impacts penetrated moon’s crust and excavated the basins. During later
volcanic episodes, liquid magma came to the surface and filled these basins. As
this happened in comparatively recent times, the number of impact craters is far
less than in the highland areas.
Impact processes have formed the lunar regolith. The regolith top moon’s
crust varies from 3 to 5meters in the maria to 10 to 20 meters in the highlands.
Lunar soil is the subcentimeter fraction (<1mm) of the lunar regolith. Detailed
studies have shown that five basic particle types make up the lunar soils: mineral
fragments, pristine crystalline rock fragments, breccia fragments, glasses of
various kinds, and the unique lunar structured particles called agglutinates [1].

146 E. Robens et al.
2. SAMPLES
The Apollo samples are handled and stored either under vacuum or in clean
dry nitrogen gas at the Astromaterials and Curation Office of the NASA’s
Johnson Space Center, Houston, Texas [11]. Three samples each of about 3g
were chosen from the material gathered during Apollo 11, 12 and 16 missions,
respectively. The mineral and chemical composition of the lunar soils depends
on the mission landing sites [12]. Apollo 11 and Apollo 12 landed well inside
mare basalt regions, and consequently, soil samples from these sites have
abundant mare-derived basaltic rock clasts and mafic minerals like olivine and
pyroxene. On the other hand Apollo 16 landed in highland regions. Soils from
this mission contain abundant highland-derived components, e.g. lithic fragments
of anorthositic rocks, breccias, and anorthitic feldspar.
The measurements described in refs. [13,14] were performed with the original
samples, which have been exposed to the atmosphere for transfer into the
measuring equipment. The present measurements had been carried out with those
samples already investigated. The surface of which may be regarded as
contaminated by residuals of water molecules or organic molecules. However,
our adsorption experiments reported in refs. [13,14] have shown that only few
amounts of gas or vapour are adsorbed and subsequently had been desorbed in
vacuum completely even at ambient temperature. So we may value the results
presented here as to be authentic for the lunar material. Indeed, lunar material
has found to be stable in earth’s atmosphere also by other authors [2,3,5],
although slow oxidation of metallic Fe grains may occur.
3. INVESTIGATIONS
The present paper provides a survey on measurements performed at Maria
Curie-Skłodowska University (UMCS), Lublin, AGH-University of Science and
Technology, Cracow, Warsaw University of Technology, and the Polish
Academy of Sciences, Warsaw. Other investigations made at the University of
Münster, Germany and at POROTEC GmbH, Hofheim, Germany have been
published elsewhere [13,14]. The present report covers some results of x-ray
photoelectron spectroscopy (XPS), micro-Raman spectroscopy (RM), induction
coupled plasma mass spectrometry (ICP-MS), Fourier transform infrared
photoacoustic spectroscopy (FTIR/PAS), x-ray diffraction (XRD), x-ray
fluorescence spectroscopy (XRF), temperature programmed reduction and
oxidation (TPRO), thermogravimetry (TG), differential thermal analysis (DTA)
and volumetric adsorption measurements. Parts of samples are visualised by
means of scanning electron microscopy (SEM/EDX) and atomic force
microscopy (AFM).

Investigation of surface properties of lunar regolith – Part IV 147
4. X-RAY PHOTOELECTRON SPECTROSCOPY (XPS)
X-ray scattering techniques are a family of non-destructive analytical
techniques, which reveal information about the crystallographic structure,
chemical composition, and physical properties of materials and thin films. If the
sample is irradiated with soft (preferably monochromatic) x- rays then the
photoelectrons are emitted from the sample surface. Atomic number of the
emitting element and valence of its atoms determine the energy of these
photoelectrons, so that surface chemical state is obtained. These energies are
typically less than 2000 eV. Since the XPS method is surface sensitive, an ultra
high vacuum must be kept in a spectrometer system during analysis. If the
incident energy is high enough, an electron from the near-nucleus core is set
free, and a photoelectron is released. Then another higher situated electron falls
into the generated hole. Sometimes, due to energy released in the XPS process, a
third “Auger” electron is ejected, as well. Though the electrons interacts strongly
with materials only those emitted from the uppermost few atomic layers can
escape from the surface without energy loss and contribute to the peak. The
remains, inelastic scattered photoelectrons contribute to the background spectra
rather then to a specific peak. Electrostatic analyser determines photoelectrons
with respect to its binding energy (BE), in spectroscopic or imaging mode [15-
17]. From the binding energy and intensity of the photoelectron peak, the
elemental identity, chemical state and quantity of an element are determined.
XPS spectra of all samples were acquired at room temperature using
ESCALAB-210 spectrometer (VG Scientific, England) and non-monochromatic
Al Kα (hν = 1486.6 eV) X-ray radiation source, operated at 300 W (15 kV, 20
mA). Survey scan (0 - 1350 eV) was acquired at pass energy of a hemispherical
analyzer of 75 eV, with step 0.4 eV. Detail spectra in all regions were acquired
at pass energy 20 eV and step 0.1 eV. The samples were pressed into tablet form,
attached to sample holder and evacuated to vacuum below 8 x 10⁻⁹
mbar without
any further treatment. Data processing was performed using Avantage Data
System (Thermo Electron). Data were smoothed; nonlinear Shirley background
was subtracted. Peak synthesis by the symmetric Gaussian-Lorentzian product
function, with L/G ratio 0.3 ± 0.05, were used to approximate the line shapes of
the fitting components. For quantification the Scofield sensivity factors and
determined transmission function of the spectrometer were used. Binding energy
scale was referenced to the C1s peak of adventitious carbon at 285.00 eV.
Typical XPS spectrum is shown in Figs 1a, 1b and the corresponding results of
elemental analysis are collected in Table 1.

148 E. Robens et al.
Tab. 1. Results of an elemental analysis for the Apollo 11 sample by XPS method.
Name BE [eV] FWHM [ eV] Atom %
Mg1s 1308.74 2.67 2.63
Na1s 1076.54 3.03 0.44
Fe2p1/2 sat 733.09 4.7 0
Fe2p1/2 728.3 4.49 0
Fe2p1/2 723.93 2.5 0
Fe2p3/2 sat 721.59 3.46 0
Fe2p3/2 sat 718.11 4.01 0
Fe2p3/2 714.85 4.05 2.51
Fe2p3/2 710.82 2.97 0.46
=Σ 2.97
F1s A 692.49 3.17 0.28
F1s 689.21 2.75 0.22
=Σ 0.5
O1s C 538.1 1.98 2.26
O1s B 536.48 2.29 25.49
O1s A 535.16 2.21 19.18
O1s 533.79 2.3 7.1
=Σ 54.03
Ti2p1/2 468.14 3.19 0
Ti2p sat 465.58 2.43 0
Ti2p3/2 462.81 3.06 1.04
=Σ 1.04
Ca2p1/2 355.81 3.28 0
Ca2p3/2 352.17 2.89 3.06
=Σ 3.06
C1s E 292.88 2.22 0.95
C1s D 290.9 1.86 0.88
C1s C 289.73 1.84 1.65
C1s B 289.25 1.69 1.63
C1s A 288.43 1.79 3.28
C1s 287.23 1.8 0.94
=Σ 9.33
Al2s 123.45 3.28 0
Si2p A 106.65 2.76 18.59
Si2p 104.15 2.72 1.78
=Σ 20.37
Al2p 78.63 2.79 5.62
5.62

Investigation of surface properties of lunar regolith – Part IV 149
0 , 0 0 E + 0 0
1 , 0 0 E + 0 5
2 , 0 0 E + 0 5
3 , 0 0 E + 0 5
4 , 0 0 E + 0 5
5 , 0 0 E + 0 5
100 200 300 400 500 600 700 800 900 1000 1100 1200 1300
Coun
ts / s
Binding Energy (eV)
wide Al
a)
8
9
1
1
1
1
1
1
1
349 350 351 352 353 354 355 356 357 358 359 360 Binding Energy (eV)
-700
-600
-500
-400
-300
-200
-100
0
Resid
uals
Ca 2p
Ca2p3
Ca2p1
b)
Fig 1. XPS spectrum of the Apollo 11 sample (a) and an example of the data processing
for Ca bands (b).
5. X-RAY FLUORESCENCE AND X-RAY DIFFRACTION ANALYSIS
The XRF method is widely used to measure the elemental composition of
materials. This method is fast and non-destructive to the sample. When an
external radiation from x-ray tube or radioactive source irradiates a substance.
the exciting x-ray can be absorbed by atom due to photoelectric effect. If an
exciting x-ray had sufficient energy. electrons are ejected from the inner shells
creating vacancies. and thus bringing the atom about an unstable state. As the
atom comes back to its stable condition. electrons from the outer shells can jump
in to fill the hole. Due to this process characteristic x-ray fluorescence. unique to
this element is emitted with energy to be difference between the two binding
energies of the corresponding shells. In the most cases K and L atomic shells are

150 E. Robens et al.
involved in XRF detection. A typical XRF spectrum displays multiple peaks of
different intensity as a function of photon energy.
An identification of elements composing the lunar samples was based on
XRF method. The ED-XRF spectrometer model 1510 (Canberra Packard. USA)
equipped with set of radioactive sources was used for measurements. Small
samples of lunar regolith of 150 mg in size were prepared as very thin pellets
with surface density of 0.0478g cm-2
. The excitation source was Fe-55 for light
elements (from Al to Ti) or Cd-109 for heavier ones (from Ti to Mo). The mass
analysis was carried out using the standardless method. The results of element
abundance are given in Tables 2.
X-ray powder diffraction pattern were measured with HZG-4 Diffractometer
(Carl Zeiss. Germany) using Cu Kα radiation. XRD patterns were recorded in a
range of 5-95(2Θ) with step = 0.03(2Θ). For illustrative purposes XRD spectrum
of the Apollo 16 sample is shown in Figure 2.
Tab. 2. XRF data. Proportions of major and trace elements in lunar soils.
Element Apollo 11
10084.2000
Apollo 12
12001.922
Apollo 16
64501.228
Na 0.18 % 0.29 % 0.21 %
Mg 4.40 % 4.00 % 2.00 %
Al 9.51 % 9.23 % 15.13 %
Si 19.12 % 22.04 % 19.10 %
K 0.21 % 0.22 % <787 ppm
Ca 9.85 % 8.95 % 11.84 %
Ti 5.11 % 2.12 % 0.31 %
Cr 0.21 % 0.29% 731ppm
Mn 0.14 % 0.16 % 445 ppm
Fe 10.55 % 10.91 % 2.83 %
Ni 214 ppm 137 ppm 211 ppm
Cu - - 36 ppm
Zn 42 ppm - 44 ppm
Sr 138 ppm 120 ppm 149 ppm
Y 82 ppm 94 ppm 29 ppm
Zr 247 ppm 404 ppm 132 ppm
Nb 11 ppm 23 ppm 8 ppm
Pb - - 39 ppm

Investigation of surface properties of lunar regolith – Part IV 151
20 30 40 50 600
10
20
30
40
50
60
70
80
90
100
Anorthite
Co
un
ts (
no
rma
lize
d)
2 Theta
20 30 40 50 600
10
20
30
40
50
60
70
80
90
100
Co
un
ts (
no
rma
lize
d)
2 Theta
Fig. 2. Record of X-ray diffraction (XRD) of the Apollo 16 sample. The XRD
diffractogram (lower picture) matches closely anorthite reference (upper library
diffractogram).

152 E. Robens et al.
6. RAMAN SPECTROSCOPY
Raman spectroscopy is a spectroscopic technique used in condensed matter
physics and chemistry to study vibrational. rotational. and other low-frequency
modes in a system [18]. When a laser produced monochromatic light of
ultraviolet. visible or infrared frequency illuminates a sample then a very small
proportion of the incident light (~10-6
) is scattered at new frequencies being
shifted up or down relative to the basic frequency. This wavelength difference
yields the so-called Raman shift. Unchanged frequencies (due to elastic Rayleigh
scattering) are filtered out and those in a certain spectral window away from the
laser line are dispersed onto a detector. Raman effect can only be observed if the
polarizability in molecule is changed during a normal vibration. If a phase
transition occurs. the Raman spectra. which ultimately depend on crystal and
molecular symmetries. will also change. Thus. Raman spectroscopy is a
powerful technique for phase analysis and elucidating crystal structures. Most
minerals have sharp and intensive spectral bands that allow phase identification
directly from raw spectra. Because this method is non-destructive. and generally
no sample preparation required. thus it is especially well suited for the study of
materials like lunar samples and Martian meteorites [19-21].
The micro-Raman spectroscopy was applied in this study to identify
mineralogical phases in lunar regolith. We used inVia Reflex Raman
spectrometer (Renishaw plc. UK). This instrument comprises an optical
microscope coupled to a single-grating spectrograph fitted with a CCD camera
detector. Such coupling allows to identifying the spot of the investigated sample
and making it visible by the means of false colours to distinguish between parts
of different chemical composition. Raman microscope allows constructing a
spectral map showing distribution of components on the analyzed surface.
Precise motorized and software controlled microscopic stage make the laser spot
to be placed and traveled along with a geometric grid in the X and Y directions.
The two lasers of 514 or 785 nm were used for spectra acquisition and area
mapping. Some examples of Raman analysis are shown in Figs 3a. b.

Investigation of surface properties of lunar regolith – Part IV 153
a)
b) b)
b)
Fig. 3. Raman spectrum (a) and distribution of an anorthite (grey area) on the Apollo 16
surface sample (b). Raman image at 450 x 450 µm2 scan size. Aquisition parameters: laser
514 nm; line focus mode: step: X = 18 µm. Y = 55.44 µm; objective: x20.

154 E. Robens et al.
7. SCANNING ELECTRON MICROSCOPY
All three lunar samples were inspected at UMCS. Warsaw University of
Technology and AGH-University of Science and Technology by means of
Scanning Electron Microscopy (SEM). In a typical SEM. electrons are
thermionically emitted from a tungsten or lanthanum hexaboride cathode and are
accelerated towards an anode. Another types of SEM microscopes are equipped
with cold field emission gun. Condenser lenses focus the electron beam into a
very fine spot. The beam passes scanning coils and is deflected there
horizontally and vertically so that it scans in a raster fashion over a rectangular
area of the sample surface [36.37]. Secondary electrons or backscattered
electrons from the sample surface are analysed. Depending on the instrument.
the resolution can fall somewhere between less than 1 nm and 20 nm. X-rays.
which are also produced by the interaction of electrons with the sample. may
also be detected in a SEM equipped with energy-dispersive (EDX) or
wavelength dispersive X-ray (WDX) probe.
Some SEM investigations were made at the AGH. Cracow. Backscattered
electron (BSE) and scattered electron (SE) observations were performed using
FEI Quanta 200 FEG scanning electron microscope equipped with EDS detector.
The system was operated in high – vacuum mode at 15 kV accelerating voltage.
In order to prevent the accumulation of electrostatic fields at the specimen
during imaging the target material of Apollo 16 was sputtered with an ultra thin
gold-palladium film. Such a coating improves in addition contrast and resolution
but may obscure the underlying fine detail. Coating is a destructive process
because it can not be removed without damaging the specimen. However. the
Apollo 11 and 12 samples were analysed with carbon shadowing. The
standardless method was used for elemental analysis. A typical records are
shown in Figure 4a-d.
At Warsaw Technical University SEM investigation were made under low
vacuum conditions. which allows for the observation of non-conducting
materials without covering. The dust samples we placed on carbon foil and
observed via the electron microscope (Hitachi S3500 N). A BSE detector of
Robinson type was used to collect the signals from the backscattered electrons.
The pictures of the dust topography were taken within the 150–2500
magnification ranges. Furthermore. energy dispersive x-ray (EDX) analysis was
made using a EDS detector at a 15 kV acceleration voltage. The mass analysis
was carried out using the standardless method. Some results are shown in
Figure 5.

Investigation of surface properties of lunar regolith – Part IV 155
Fig. 4. SEM images of Apollo samples: Apollo16 ( a. b). Apollo 12 (c) and Apollo11(d).
A very small microcraters are observed on surface of the Apollo16 particle (b) and the
glassy spherule of ~60 µm diameter (probably of pyroclastic origin) is seen at the centre
of d micrograph (FEI Quanta 200 FEG microscope. Cracow).
8. RESULTS AND DISCUSSION OF CHEMICAL
AND MINERALOGICAL ANALYSIS
The lunar regolith samples appeared as a dark grey to light grey. very fine
grained. clastic. loose material primarily derived from the mechanical
disintegration of anorthositing and basaltic rock. The mean grain size of analysed
soils averages between 60 and 80 µm. Individual regolith particles are mostly
glassy aggregates (agglutinates) and various rock and mineral fragments.
a b
c d

156 E. Robens et al.
Fig. 5. SEM micrographs of the Apollo 12 sample and corresponding EDS spectrum
(below) acquired from the crosshatch. (Hitachi S3500 N microscope. Warsaw).
Recent computer models indicate that the moon could have been formed from
the debris resulting from the Earth being struck a glancing blow by a planetary
body about the size of Mars [23-24]. We have learned that a crust formed on the
Moon 4.4 billion years ago. This crust formation. the intense meteorite
bombardment occurring afterward. and subsequent lava outpourings are recorded
in the rocks. Radiation spewed out by the Sun since the formation of the Moon's
crust. was trapped in the lunar soil as a permanent record of solar activity
throughout this time [25]. Though the material covering moon’s surface is
similar to that of earth its history is different. On account of lacking atmosphere
and water the treatment on Moon took place in a completely dry atmosphere and
in a strongly reducing environment [26.27]. Thus. its mineralogical composition
is relatively simple (see Table 3). Lunar rocks are divisible into three types:

Investigation of surface properties of lunar regolith – Part IV 157
basalts. anorthosites and breccias. Basalts mainly fill mare basins and
anorthosites form the highlands [27.29].
Tab. 3. Minerals forming lunar rocks according to NASA [28].
Name Formula Notes
Plagioclase NaAlSi3O8⋅CaAl2Si2O8 almost pure anorthite CaAlSi2O8
Pyroxene (Ca.Mg.Fe)2Si2O6
Olivine (Mg.Fe)2SiO4 Maj
or
ph
ases
Ilmenite FeTiO3
Iron Fe metallic iron grains with Co or Ni
Troilite FeS only sulfide
Silica SiO2
Chromite-ulvospinel FeCr2O4-Fe2TiO4 64–65% Cr2O3
Apatite Ca5(PO4)(F.Cl)
Merrillite Ca3(PO4)2
Ternary feldspar (Ca.Na.K)AlSi3O8
K-feldspar (K.Ba)AlSi3O8
Pleonaste (Fe.Mg)(Al.Cr)2O4
Zircon ZrO2
Rutile TiO2
Min
or
ph
ases
Zirkelite-zirkonolite (Ca.Fe)(Zr.Y.Ti)2O7
Armalcolite (Mg.Fe)(Ti.Zr)2O5 70% TiO2; pseudobrookite structure
Tranquillityite Fe8(Zr.Y)2Ti3Si3O24 hexagonal
Pyroxferroite CaFe6(SiO3)7 Fe-rich pyroxenoid
New
min
eral
s
Yttrobetafite (Ca.Y)2(Ti.Nb)2O7 unknown structure; high activity of U and
Th isotopes
Plagioclase. pyroxene and olivine are the main rock minerals of the lunar
surface. Plagioclase dominates in highlands. while pyroxene and olivine in mare
regions. As motioned above the Apollo 11 and Apollo12 missions landed inside
mare whereas the Apollo 16 landed in the highland region. Most of the Apollo
16 crystalline rock is rich in feldspar and depleted in the mafic minerals.
pyroxene and olivine. The Apollo 16 regolith also contains mafic components
that do not originate in the feldspathic highlands. A large proportion of the mafic
material occurs as a glass. mostly of meteoroid impacts origin. The most
abundant mafic material at the Apollo 16 zone is impact-melt breccia with high
abundance of ITEs (incompatible trace elements such as Th) that cannot fit into
a crystal structure. and thus were left behind. floating to the surface of the
magma. Moreover. the concentration of Mg and Fe in this material is
significantly greater in comparison to those of feldspathic lithologies. These
kinds of breccias are also common among non-mare materials of all other Apollo
sites. Another type of mafic material consists of products of mare volcanism.
Despite the Apollo landing being 220 km from the nearest mare. small fragments
of mare basalts and pyroclasic glass are founded in the Apollo16 regolith [30-

158 E. Robens et al.
33]. The regolith of highlands is characterised by low maturity and specific Fe
and Al abundance: the higher a soil maturity degree. the greater the iron and the
smaller the aluminium content. This was confirmed by the data of the samples
from the Apollo11. 12 and 16 missions. The Apollo basalts comprise tree class:
olivine basalt. pigeonite basalt. and ilmenite basalt [34]. All basalts contain
significant amounts of TiO2. Olivine basalts are lowest in TiO2 (2.86 to 3.0 %).
pigeonite are slightly higher (3.29 to 3.38%). and ilmenite basalts have the
highest level (4.8 to 5.16) [35]. In spite that Apollo 11 mission landed on Mare
Tranquillitis. a few millimetres in size fragment of rocks coming from highlands
were collected. These are mainly composed of plagioclase feldspar; some grains
were composed exclusively of anorthositic plagioclase. The identification of this
mineral rock led to bold hypothesis that a large portion of the moon was once
molten. and that the crust formed by fractional crystallisation of this magma
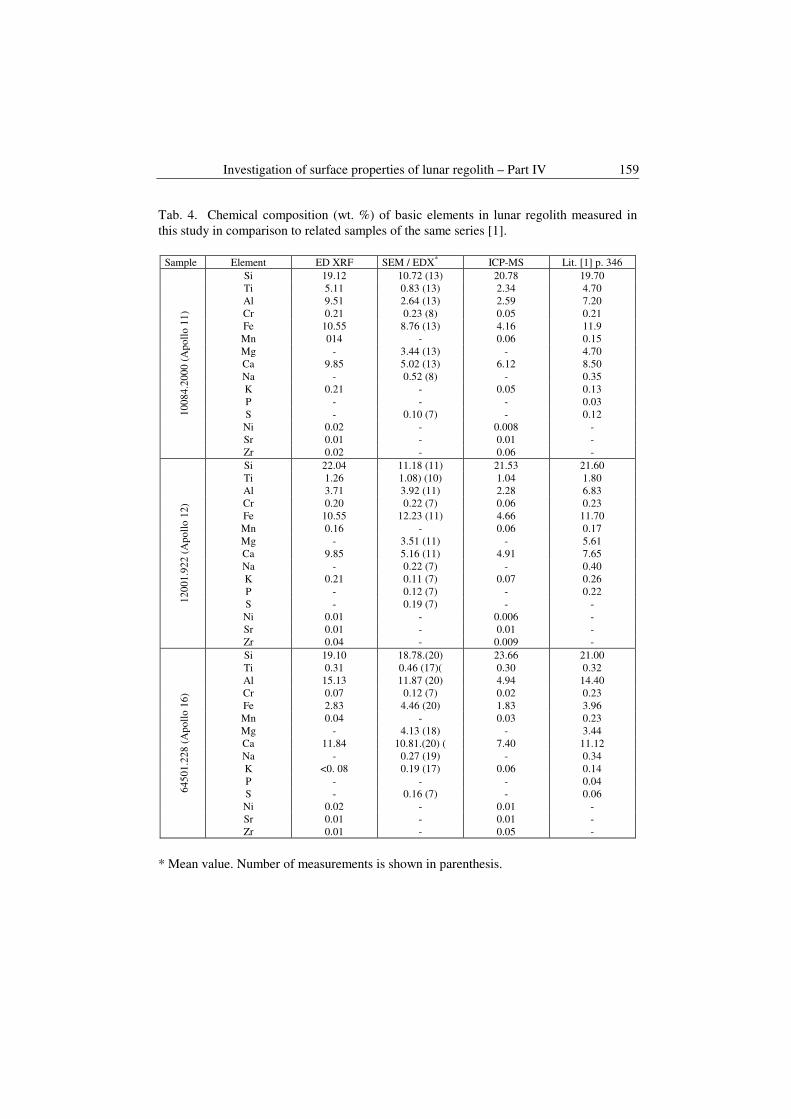
ocean. Table 4 presents the results of the chemical compositions in lunar regolith
obtained by XRF spectroscopy and other analytical methods.
9. FOURIER-TRANSFORM INFRARED / PHOTOACOUSTIC
MEASUREMENTS
With infrared spectroscopy a sample’s absorbance is analyzed in its infrared
spectrum (IR) with wavelength range of 780 – 1 nm. That absorbance spectrum
is then analyzed by means of the Fourier transform method: The signal is
dissolved with regard to the included frequencies and afterwards reconstructed
from the frequency spectrum (FT-IR). That. in turn. allows identification of the
chemical components of the sample by means of a spectrum pattern. In
conventional transmission spectroscopy the measurement of absorption is
transferred to a measurement of the radiation transmitted through the sample. In
photoacoustic spectroscopy (PAS) the absorption radiation is determined
directly via the heat released [22]. That short-time release heat produces pressure
waves in the surrounding gas. hence. sound and that sound is detected by means
of a microphone (FT-IR/PAS). This method is especially useful for dark and
The FT-IR/PAS were recorded by means of a Bio-Rad Excalibur 3000 MX
spectrometer equipped with a photoacoustic detector MTEC 300 (with helium
atmosphere in the detector) covering the 4000–400 cm-1
range at a resolution of
4 cm-1
and maximum source aperture. The spectra were normalized with
reference to MTEC carbon black standard. A stainless steel cup 10-mm in
diameter was filled with the dust sample (thickness < 6 mm). Before each data
collection the PA cell was purged with dry helium for 5 min. Interferograms of
1024 scans were averaged for each spectrum.
Investigation of surface properties of lunar regolith – Part IV 159
Tab. 4. Chemical composition (wt. %) of basic elements in lunar regolith measured in
this study in comparison to related samples of the same series [1].
Sample Element ED XRF SEM / EDX* ICP-MS Lit. [1] p. 346
Si 19.12 10.72 (13) 20.78 19.70
Ti 5.11 0.83 (13) 2.34 4.70
Al 9.51 2.64 (13) 2.59 7.20
Cr 0.21 0.23 (8) 0.05 0.21
Fe 10.55 8.76 (13) 4.16 11.9
Mn 014 - 0.06 0.15
Mg - 3.44 (13) - 4.70
Ca 9.85 5.02 (13) 6.12 8.50
Na - 0.52 (8) - 0.35
K 0.21 - 0.05 0.13
P - - - 0.03
S - 0.10 (7) - 0.12
Ni 0.02 - 0.008 -
Sr 0.01 - 0.01 -
10
08
4.2
00
0 (
Ap
oll
o 1
1)
Zr 0.02 - 0.06 -
Si 22.04 11.18 (11) 21.53 21.60
Ti 1.26 1.08) (10) 1.04 1.80
Al 3.71 3.92 (11) 2.28 6.83
Cr 0.20 0.22 (7) 0.06 0.23
Fe 10.55 12.23 (11) 4.66 11.70
Mn 0.16 - 0.06 0.17
Mg - 3.51 (11) - 5.61
Ca 9.85 5.16 (11) 4.91 7.65
Na - 0.22 (7) - 0.40
K 0.21 0.11 (7) 0.07 0.26
P - 0.12 (7) - 0.22
S - 0.19 (7) - -
Ni 0.01 - 0.006 -
Sr 0.01 - 0.01 -
12
00
1.9
22
(A
po
llo
12
)
Zr 0.04 - 0.009 -
Si 19.10 18.78.(20) 23.66 21.00
Ti 0.31 0.46 (17)( 0.30 0.32
Al 15.13 11.87 (20) 4.94 14.40
Cr 0.07 0.12 (7) 0.02 0.23
Fe 2.83 4.46 (20) 1.83 3.96
Mn 0.04 - 0.03 0.23
Mg - 4.13 (18) - 3.44
Ca 11.84 10.81.(20) ( 7.40 11.12
Na - 0.27 (19) - 0.34
K <0. 08 0.19 (17) 0.06 0.14
P - - - 0.04
S - 0.16 (7) - 0.06
Ni 0.02 - 0.01 -
Sr 0.01 - 0.01 -
64
50
1.2
28
(A
po
llo
16
)
Zr 0.01 - 0.05 -
* Mean value. Number of measurements is shown in parenthesis.

160 E. Robens et al.
Tab. 5. Results of FT-/PAS measurements. Wavenumbers of peaks in cm-1
.
Apollo 11 Apollo12 Apollo 16 Note
3432 3443 3451 ν -OH
2945 2957 vas -CH3
2915 2925 2929 vas -CH2-
2857 2853 vs -CH2 -
1739
1643 1637 1627 δ -OH
1384 1384 1385 δs -CH3. -CH2-
1046 1054 1057
929 912 916 γ -(CH2)n -
731 735
628
From the results presented in Table 1 one can stated that small amount of water
and organic hydrocarbons occur in the investigated samples. This is due to
possible sample contamination during measurement of the sorption isotherms of
water. heptane and octane that had already been carried out with those samples
[13.14].
10. ATOMIC FORCE MICROSCOPE
All samples were investigated using an atomic force microscope (NanoScope
III type. Digital Instruments. USA). a very high-resolution type of scanning
probe microscope. with demonstrated resolution of fractions of a nanometer far
below the resolution of SEM. The AFM consists of a microscale cantilever with
a sharp tip (probe) at its end that is used to scan the specimen surface. The
cantilever is typically silicon or silicon nitride with a tip radius of curvature on
the order of nanometer. When the tip is brought into proximity of a sample
surface. forces between the tip and the sample lead to a deflection of the
cantilever according to Hooke's law. Depending on the situation. forces that are
measured in AFM include mechanical contact force of different kind.
In the preceding investigation with SEM highly cleaved and porous particles
had been detected [13.14]. In the present investigation single and rather smooth
particles were found. AFM images reveal a rather flat and hardly structured
surface without pores of nanometer scale (Figures 6a. b). This is in accordance
with sorption measurements in which only few mesopores (pore width in the
range of 2 to 50 nm) and no micropores (pore width below 2 nm) are indicated.

Investigation of surface properties of lunar regolith – Part IV 161
a) b)
Fig. 6. Topography images of the Apollo 12 sample at 2 µm (left image) and 3 µm (right
image) scan sizes. Data obtained in tapping mode in air.
11. THERMOGRAVIMETRY AND DIFFERENTIAL THERMAL ANALYSIS
Thermogravimetry TGA and Differential thermal analysis DTA studies were
made in order to clear whether lunar material is able to ad- and absorb
significant amounts of water and to keep water molecules. A thermogravimetric
apparatus consists of a balance and a heating unit to adjust the sample
temperature at a constant value or to control the defined temperature increase
[38]. Measurements are made either in air. in an inert gas flow or in vacuum
[39.40]. To investigate the water content measurements are performed at low
temperatures. Up to 100°C physisorbed water and condensed pore water
vaporise mainly. At higher temperatures chemisorbed components and crystal
water are liberated.
We used a Setsys 16/18 apparatus (Setaram. France) [41]. Samples (5–8 mg)
were heated at temperatures of 30–900 °C with a heating rate of 5° min-1
in
flowing air (v =1 dm3 h
-1) or argon atmosphere (v =0.8 dm
3 h
-1). Samples were
heated in 100 µl ceramic or platinum crucibles.
We observed unexpected increase or decrease of the sample mass.
respectively in ceramic crucibles at temperature above 100°C both. in air and
argon atmosphere (Figure 7a, b). Obviously there was an interaction between
samples and the crucible material together with the atmosphere. Literature
reports [42.43] show that many metal oxides and inorganic salts (for example
fluorides, ferrites of alkaline and alkaline earth metals) melt and dissolve Al2O3

162 E. Robens et al.
or they form aluminates or double oxides. The TG curves obtained in air and
argon atmosphere differ significantly demonstrating different reactions of the
originated phase with the furnace’s atmosphere.
a) b)
Fig. 7. TG and DTA curves of Apollo 11 sample heated in ceramic crucible in air (a) and
argon(b).
Therefore we used exclusively platinum crucibles in the following
experiments. Thermal analysis in argon atmosphere demonstrated that despite
pretreatment by former experiments and the storage in air for some months
nothing was ad- or absorbed. At temperatures up to 350 °C the TG curves
remained practically on the zero level (Figure 8a). Likewise the DTA curves do
not indicate any reaction without mass change. However. the sensitivity of our
DTA thermocouple may be too low to reveal polymorphic transformations.
a) b)
Fig. 8. TG and DTA curves of Apollo 11sample heated in platinum crucible in argon (a)
and air atmosphere (b).

Investigation of surface properties of lunar regolith – Part IV 163
Above 350 °C by TG in air all lunar samples undergo slow oxidation
processes (Figure 8 b). Probably oxidation of free iron present in the lunar
material is oxidized or elements existing in low oxidation state are transformed
to higher ones (for example Fe2+
. Cr3+
). The increase of the sample mass is
connected with change of sample’s color: they become brownish-red. confirming
oxidation of free iron. The increases of mass are similar for Apollo 11 (1.40 %)
and Apollo 12 (1.41 %) but less for the Apollo 16 sample (0.43 %). This is in
accordance with the iron content of the samples (see Tables 2 and 4). Above
500 °C further increase of sample mass takes place. probably caused by
oxidation of other sample components.
Results of thermal analysis show that lunar material is not hygroscopic. In
contact with the atmosphere quantities adsorbed are below the detection limit of
thermal analysis methods.
In order to study the interaction of lunar material with water vapor the
samples were held 7 days inside of a Binder KBF 115 climatic chamber at a
temperature of 85 °C and relative humidity of 95 %. At those conditions water
should be physisorbed and probably chemisorbed. The high temperature required
for complete dehydration is a proof of chemical bonding of water molecules.
However. the quantity of bonded water is less than 1 % indicating that lunar
regolith is hydrophobic.
12. TEMPERATURE PROGRAMMED REDUCTION
AND OXIDATION (TPRO)
The Temperature Programmed Reduction and Oxidation is thermoanalytical
technique for characterising chemical interactions between solids and reacting
gases. Resulting data are commonly interpreted on a qualitative basis or by
utilising simple. approximate kinetic equations. However it is possible to
determine also quantity and strength of solid-oxygen. While a sample is heated at
linear increasing temperature. the decomposition products or bulk species, as
well as the consumption of reactive gases are monitored. Typically, a thermo-
conductive detector (TCD) or a mass spectrometer is used. The heat quantity
delivered to the sample induces breaking of bonds and thus the strength of
interaction is closely related to the temperature of the peak generation. The
surface area under the peak is related to the number of desorbed or consumed
molecules. TPRO techniques have been widely used in the field of catalysis and
material science for determination of the surface properties and the nature of
metallic or oxidic species. To our knowledge the temperature programmed
reduction-oxidation studies have not yet been applied for lunar samples.

164 E. Robens et al.
Three samples of Apollo series were investigated in these studies. Studies
were conducted on Altamira AMI-1 system (Zeton Altamira) equipped with
thermal conductivity detector (TCD) and coupled with mass spectrometer HAL
211RC (Hiden Analytical). The sample (0.0500 g) was placed in the tube of
10 mm diameter. High purity He and Ar and gaseous mixtures of 6.21 % H2 / Ar
and 5 % O2 / He were used in the experiments. Typical results are shown in
Figures 9a. b.
13. SORPTOMETRY
The measurement of nitrogen adsorption isotherms at 77 K is the standard
procedure to determine the specific surface are and the pore size distribution of
solid surfaces [44.45]. Usually the volumetric method is applied in which the
pressure decrease is measured of a determined amount of nitrogen introduced
into the calibrated sample container.
Nitrogen adsorption isotherms at 77 K have been measured using a
Quantachrome Autosorb-1CMS apparatus by which the volumetric method is
applied. From the isotherms the specific surface area SBET was calculated using
the two-parameter equation of Brunauer. Emmett and Teller [46]. Furthermore
the pore size distribution was established using the methods of Barrett. Joyner
and Halenda (BJH) [47] and Dollimore and Heal (DH) [48] and the specific
mesopores volume VBJH was determined. It should be recognised that the
volumetric measurement of nitrogen isotherms is at the limit of sensitivity of the
instrument for such that material of low surface area which has no pores in the
nanometer region. Therefore the result represented in Figure 10 and Table 6
should not be overestimated. In ref. [14] a comparison is made with results of
adsorption measurements using other adsorptives.
Tab. 6. Results of the evaluation of nitrogen adsorption isotherms at 77 K.
Sample
Specific surface
area SBET
m2 g-1
Specific mesopore
volume VBJH
cc g-1 ×10⁻³
Specific micropore
volume
cc g-1×10⁻³
Mean pore
diameter
nm
APOLLO 11 10084.2000
2.39 6.1 0 2.9
APOLLO 12 12001.922
1.77 6.3 0 3.6
APOLLO 16 64501.228
2.73 11.0 0 2.9

Investigation of surface properties of lunar regolith – Part IV 165
0 200 400 600 800
Temperature [oC]
0
100
200
300
400
Hyd
rog
en c
on
sum
ptio
n [a
.u.]
I TPR
II TPR
III TPR
IV TPR
Fig. 9a. TPR curves of the A11 sample.
0 200 400 600 800
Temperature [oC]
0
40
80
120
Oxygen c
onsum
ption
[a
.u]
I TPO
II TPO
III TPO
Fig. 9b. TPO curves of the A11 sample.

166 E. Robens et al.
Fig. 10. Adsorption/desorption isotherms of nitrogen at 77 K for the lunar regolith
samples.
14. CONCLUSIONS
Mineralogical and chemical analysis confirms results reported in the
literature but the modern methods with improved resolution gave a more detailed
view on composition and stracture of the samples. Sorption measurements.
thermal analysis and thermogravimetry confirmed low specific surface area. low
porosity and hydrophobicity of lunar regolith. So it cannot be expected that
usable amounts of water be bound in the material covering moon’s surface.
Acknowledgenment. The samples had been kindly placed for our disposal by
the NASA Lunar sample curator. Dr. Gary Lofgren. Houston. Texas.
15. REFERENCES
[1] G. H. Heiken, D. T. Vaniman, and B. M. French, eds., Lunar Sourcebook, 1991, Cambridge
University Press, Cambridge.
[2] D. A. Cadenhead, et al. Some surface characteristics and gas interactions of Apollo 14 fines
and rock fragments. in Proceedings of the Third Lunar Science Conference (Supplement 3.
Geochimica et Cosmochimica Acta). M.I.T. Press. p. 2243-2257. 1972.
[3] D. A. Cadenhead,. and R. S. Mikhail, Water vapour weathering of Taurus-Littrow orange
soil: A pore-structure analysis. in Proceedings of the 6th Lunar Science Conference. p. 3317-
3331, 1975.
[4] R. B. Gammage and H. F. Holmes, Blocking of the water-lunar fines reaction by air and
water concentration effects, in Proceedings of the 6th Lunar Science Conference, p. 3305-
3316, 1975.
[5] H. F. Holmes and R. B. Gammage, Interaction of gases with lunar materials: Revised results
for Apollo 11, in Proceedings of the 6th Lunar Science Conference, p. 3343-3350, 1975.

Investigation of surface properties of lunar regolith – Part IV 167
[6] E. L. Fuller Jr. and P. A. Agron, Sorption by low area materials. in Progress in Vacuum
Microbalance Techniques, C. Eyraud and M. Escoubes, Editors, Heyden: London, p. 71–82,
1975.
[7] P. Staszczuk, D. Sternik and G. W. Chadzynski, J. Therm. Anal. Cal. 71(1): p. 173–182
(2003).
[8] D. Sternik et al. J. Therm. Anal. Cal. 8 (2006).
[9] V. V. Kutarov, E. Robens and B. Kats, J. Therm. Anal. Cal. (2006).
[10] J. L. Josset and B. H. Foing, 2006: SPACE-X Space Exploration Institute and ESA SMART-1
Project.
[11] J. Allton, 25 Years of curating Moon rocks.
http://www-curator.jsc.nasa.gov/lunar/lnews/lnjul94/hist25.htm, 1994.
[12] D. Stöffler. A. Bischoff. et al.. J. Geophys. Res.. 1985(90): p. C449–C506.
[13] E. Robens et al. Appl. Surface Sci. 253, p. 5709–5714 (2007).
[14] E. Robens et al. Journal of Thermal Analysis and Calorimetry (2008).
[15] Kratos Analytical. www.kratos.com
[16] J. Wolton and N. Firley, J. Interface Anal. 38, p. 1230
[17] J. Wolton and N. Firley, J. Electron. Spectrosc. relat. Phenom. 150, pp. 15 (2006).
[18] D. J. Gardiner, Practical Raman spectroscopy, Heidelberg: Springer 1989.
[19] A. Wang et al. J. Geophys. Res. 100, pp. 21189–21199 (1995).
[20] L. A. Haskin et al. J. Geophys. Res. 102, pp. 19293–19306 (1997).
[21] A. Wang et al. J. Geophys. Res. 104, pp. 8509–8519 (1999).
[22] J. Ryczkowski, Catalysis Today, 124: pp. 11–20 (2007).
[23] M. Touboul et al. Nature 450, 1206–1209 (2007).
[24] R. A. Lovett. Earth-asteroid collision formed moon later than thought. National Geographic
News 2007(12).
[25] A. Brandon. Nature. 450. 1169-1170 (2007).
[26] C. Allen and N. S. Todd, Astromaterials curation - Rocks and soils from the Moon.
http://curator.jsc.nasa.gov/lunar/index.cfm. 2007, NASA.
[27] J. J. Papike et al. Rev. Geophys. Space Phys. 14, pp. 475 (1976).
[28] http://www.nasa.gov/mission¬_pages/apollo/index.html. NASA National Aeronautics and
Space Administration, 2007.
[29] L. R. Gaddis et al., Icarus, 161: p. 262 (2003).
[30] E. Dowty, Keil. K., Prinz. Lunar Planet. Sci. 5, 174–176 (1974).
[31] J. W. Delano, Proc. Lunar. Sci. 6, 15–47 (1975).
[32] D. T. Vaniman, J. J. Papike, E. L. Schweitzer, Proc. Lunar. Planet. Sci. Conf. 9, 1827–1860
(1978).
[33] S. B. Simon, J. J. Papike, Lunar Planet. Sci. 18, 922–923 (1987).
[34] Basaltic Volcanism Study Project 1981, Lunar Planet. Sci. XXXVI: p. 236–267 (2005).
[35] G. E. Snyder, C. R. Neal, L. A. Taylor and A. N. Halliday, Geochim. Cosmochim. Acta. 61,
2731–2747 (1997).
[36] M. von Ardenne, Zeitschrift für Physik, 108: p. 553–572 (1938).
[37] M. von Ardenne, Zeitschrift für Technische Physik, 108: p. 407-416 (1938).
[38] P. Staszczuk, Thermochimica Acta. 308: p. 147–147 (1998).
[39] G. Liptay, Atlas of Thermoanalytic Curves, 1971–1977, Budapest, London: Akadémiai Kiadó
and Heyden.
[40] K. Rübner, E. Robens and D. Balköse, J. Therm. Anal. Cal. 2008.
[41] M. Iwan et al. Analiza termiczna próbek gruntu księżycowego. (Thermal analysis of lunar
samples), in IX Krajowe Seminarium im. Prof. Stanislawa Bretsznajdera Seminary on
Thermal Analysis, 2007, Instytut Chemii, Politechnika Warszawska, Wydz. Mechaniki
i Petrochemii w Plocku: Płock, p. 164–168.

168 E. Robens et al.
[42] S. Cebulak et al. J. Therm. Anal. Cal. 72: p. 405 (2003).
[43] Crucibles for Thermal Analysis. http://glo.mt.com/mt/resources/productsBrochures.jsp, 2007.
Mettler Toledo.
[44] ISO ISO 9277: Determination of the specific surface area of solids by gas adsorption using
the BET method, 1995, Berlin: Beuth.
[45] DIN DIN 66134: Bestimmung der Porengrößenverteilung und der spezifischen Oberfläche
mesoporöser Feststoffe durch Stickstoffsorption. Verfahren nach Barrett. Joyner und Halenda
(BJH), 1998, Berlin: Beuth.
[46] S. Brunauer, P. H. Emmett and E. Teller, J. Am. Chem. Soc. 60: p. 309 (1938).
[47] E. P. Barrett L. G. Joyner and P. H. Halenda, J. Am. Chem. Soc. 73: p. 373–380 (1951).
[48] D. Dollimore, and G. R. Heal, J. Appl. Chem. 14: p. 109 (1964).