a one-piece lunar regolith bag garage prototype · nasa/tm—2007–215073 a one-piece lunar...
TRANSCRIPT

NASA/TM—2007–215073
A One-Piece Lunar Regolith Bag Garage PrototypeG.A. Smithers, M.K. Nehls, M.A. Hovater, S.W. EvansMarshall Space Flight Center, Marshall Space Flight Center, AL
J.S. MillerQualis Corporation, Huntsville, AL
R.M. Broughton, Jr., D. Beale, F. Kilinc-BalciAuburn University, Auburn, AL
September 2007
National Aeronautics andSpace AdministrationIS20George C. Marshall Space Flight CenterMarshall Space Flight Center, Alabama35812
https://ntrs.nasa.gov/search.jsp?R=20080000853 2018-05-27T14:49:42+00:00Z

The NASA STI Program…in Profile
Since its founding, NASA has been dedicated to the advancement of aeronautics and space science. The NASA Scientific and Technical Information (STI) Program Office plays a key part in helping NASA maintain this important role.
The NASA STI program operates under the auspices of the Agency Chief Information Officer. It collects, organizes, provides for archiving, and disseminates NASA’s STI. The NASA STI program provides access to the NASA Aeronautics and Space Database and its public interface, the NASA Technical Report Server, thus providing one of the largest collections of aeronautical and space science STI in the world. Results are published in both non-NASA channels and by NASA in the NASA STI Report Series, which includes the following report types:
• TECHNICAL PUBLICATION. Reports of completed research or a major significant phase of research that present the results of NASA programs and include extensive data or theoretical analysis. Includes compilations of significant scientific and technical data and information deemed to be of continuing reference value. NASA’s counterpart of peer-reviewed formal professional papers but has less stringent limitations on manuscript length and extent of graphic presentations.
• TECHNICAL MEMORANDUM. Scientific and technical findings that are preliminary or of specialized interest, e.g., quick release reports, working papers, and bibliographies that contain minimal annotation. Does not contain extensive analysis.
• CONTRACTOR REPORT. Scientific and technical findings by NASA-sponsored contractors and grantees.
• CONFERENCE PUBLICATION. Collected papers from scientific and technical conferences, symposia, seminars, or other meetings sponsored or cosponsored by NASA.
• SPECIAL PUBLICATION. Scientific, technical, or historical information from NASA programs, projects, and missions, often concerned with subjects having substantial public interest.
• TECHNICAL TRANSLATION. English-language translations of foreign scientific and technical material pertinent to NASA’s mission.
Specialized services also include creating custom thesauri, building customized databases, and organizing and publishing research results.
For more information about the NASA STI program, see the following:
• Access the NASA STI program home page at <http://www.sti.nasa.gov>
• E-mail your question via the Internet to <[email protected]>
• Fax your question to the NASA STI Help Desk at 301– 621–0134
• Phone the NASA STI Help Desk at 301– 621–0390
• Write to: NASA STI Help Desk NASA Center for AeroSpace Information 7115 Standard Drive Hanover, MD 21076–1320
�
NASA/TM—2007–215073
A One-Piece Lunar Regolith Bag Garage Prototype
September 2007
Nat�onal Aeronaut�cs andSpace Adm�n�strat�on
Marshall Space Fl�ght Center • MSFC, Alabama 35812
G.A. Smithers, M.K. Nehls, M.A. Hovater, S.W. EvansMarshall Space Flight Center, Marshall Space Flight Center, AL
J.S. MillerQualis Corporation, Huntsville, AL
R.M. Broughton, Jr., D. Beale, F. Kilinc-BalciAuburn University, Auburn, AL

��
Ava�lable from:
NASA Center for AeroSpace Informat�on7115 Standard Dr�ve
Hanover, MD 21076 –1320301– 621– 0390
Th�s report �s also ava�lable �n electron�c form at<https://www2.st�.nasa.gov>
Acknowledgments
In add�t�on to the authors, a number of other people contr�buted to th�s work. They �nclude Dav�d Hoppe, Don McQueen, Robert Hoffman, Kev�n Burk, Joe M�now, Charley Meyers, Mark Kearney, Dav�d Sm�therman, and Mark D’Agost�no,
NASA Marshall Space Fl�ght Center. Also contr�but�ng to th�s work were Steve Kennamer, Sh�rley Abercromb�e, and B�ll Major, Teledyne Brown Eng�neer�ng, W�ll�am Seymour, BD Systems, Chuck Semmel, Qual�s Corporat�on, and Max C�chon,
Dav�d Branscomb, Melody George, Hassan Kocer, Mandeep S�ngh, Manoj Rajagopalan, and Jeff Thompson, Auburn Un�vers�ty.
The “lunar garage team” extends s�ncere apprec�at�on to those who made th�s work poss�ble: the project managers and systems engineers (past and present) and the Contracting Officer and Contracting Officer’s Technical Representative who
manage the Cooperat�ve Agreement w�th Auburn Un�vers�ty. They are: Jul�e Bassler, Melan�e Bod�ford, Carole McLemore, Nathan Brown, Janet Strong, M�ke F�ske, Kev�n McCarley, Glen Alexander, and Jenenne Suttle.
The MSFC team, wh�ch �ncluded members from the Eng�neer�ng D�rectorate’s Instrument and Payload Systems Department, Spacecraft and Veh�cle Systems Department, and Mater�als and Processes Space Env�ronmental Effects Team, and Non-
metals Process Eng�neer�ng Team, partnered w�th Auburn Un�vers�ty’s Department of Polymer and F�ber Eng�neer�ng and Department of Mechan�cal Eng�neer�ng to conduct th�s work.
The authors gratefully acknowledge the suppl�ers who have b�d on projects, worked w�th us and/or suppl�ed fabr�c samples: ILC Dover, L�ncoln Text�les, Hexcel, W. L. Gore, Fabr�c Development Ltd., 3M, Kappler, Inc.,
Techsphere, American and Efird, and W. R. Grace.
TRADEMARKS
Trade names and trademarks are used in this report for identification only. This usage does not constitute an official endorsement, e�ther expressed or �mpl�ed, by the Nat�onal Aeronaut�cs and Space Adm�n�strat�on.

���
TABLE OF CONTENTS
1. BACKGROUND ............................................................................................................................ 1
2. MATERIALS TESTING PROGRAM ........................................................................................... 4
2.1 Determ�nat�on of Fabr�c Structural Propert�es ....................................................................... 4 2.2 Tens�le Test�ng ........................................................................................................................ 4 2.3 Fold Test�ng ............................................................................................................................ 17 2.4 Rad�at�on Exposure and Effects ............................................................................................. 21 2.5 Abras�on Test�ng ..................................................................................................................... 34 2.6 Hyperveloc�ty Impact ............................................................................................................. 44
3. DESIGN AND CONSTRUCTION OF GARAGE STRUCTURE ................................................ 51
3.1 Introduct�on to Connected Fabr�c Bag Arches and Analogy to Masonry Arches .................. 51 3.2 Proof-of-Concept Prel�m�nary Structures ............................................................................... 53 3.3 Full-Scale Prototype and Erect�ng at MSFC .......................................................................... 60 3.4 Berms and Blanket�ng ............................................................................................................ 70
4. CONCLUSIONS AND RECOMMENDATIONS ......................................................................... 73
APPENDIX ......................................................................................................................................... 77
REFERENCES ................................................................................................................................... 78

�v
LIST OF FIGURES
1. A concrete-filled, woven double cloth used for erosion control on stream banks .............. 3
2. Yarn counts of the samples ................................................................................................. 5
3. Number of warps and fillings of the samples ...................................................................... 5
4. Density of the fibers used in the fabric samples ................................................................. 6
5. Tens�le strength of warp yarns (kN) as compared to calculated values .............................. 7
6. Tensile strength of filling yarns (kN) as compared to calculated values ............................ 7
7. Tens�le strength of warp yarns (MPa) as compared to reported values .............................. 8
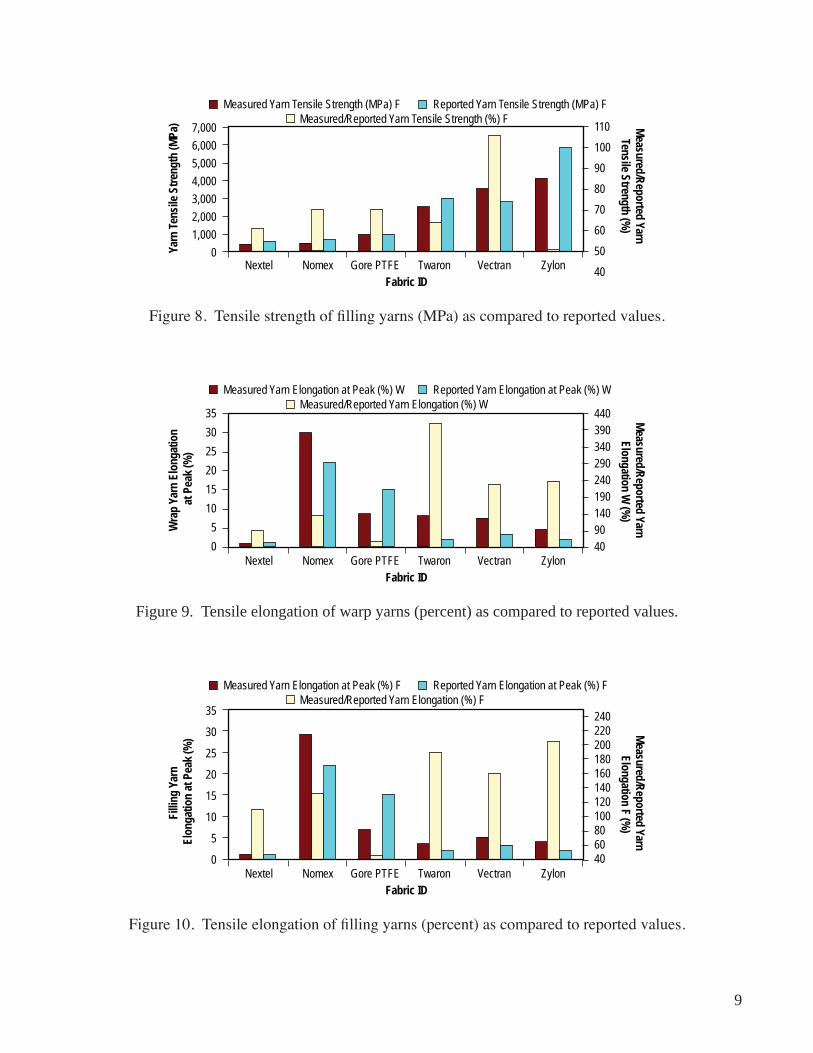
8. Tensile strength of filling yarns (MPa) as compared to reported values ............................ 9
9. Tens�le elongat�on of warp yarns (percent) as compared to reported values ...................... 9
10. Tensile elongation of filling yarns (percent) as compared to reported values .................... 9
11. Tens�le test samples ............................................................................................................ 10
12. Mount�ng the tens�le test samples �n the jaws .................................................................... 11
13. Tensile strength of fabrics in warp and filling direction (kN/inch) .................................... 12
14. Tensile strength of fabrics in warp and filling direction (MPa) .......................................... 13
15. Compar�son of measured tens�le strength of fabr�cs w�th reported values—warp d�rect�on. (Reported values are obta�ned from the producers.) ........................................... 13
16. Comparison of measured tensile strength of fabrics with reported values—filling d�rect�on. (Reported values are obta�ned from the producers.) ........................................... 13
17. Fabr�c elongat�on at peak (percent) �n warp d�rect�on ........................................................ 14
18. Fabric elongation at peak (percent) in filling direction ...................................................... 14
19. Fabr�c tens�le strength (kN/�nch) at d�fferent cond�t�ons—warp d�rect�on ......................... 15

v
LIST OF FIGURES (Continued)
20. Fabric tensile strength (kN/inch) at different conditions—filling direction ....................... 15
21. Fabr�c tens�le strength (MPa) at d�fferent cond�t�ons—warp d�rect�on .............................. 16
22. Fabric tensile strength (MPa) at different conditions—filling direction ............................ 16
23. Fabr�c tens�le elongat�on (percent) at d�fferent cond�t�ons—warp d�rect�on ...................... 17
24. Fabric tensile elongation (percent) at different conditions—filling direction .................... 17
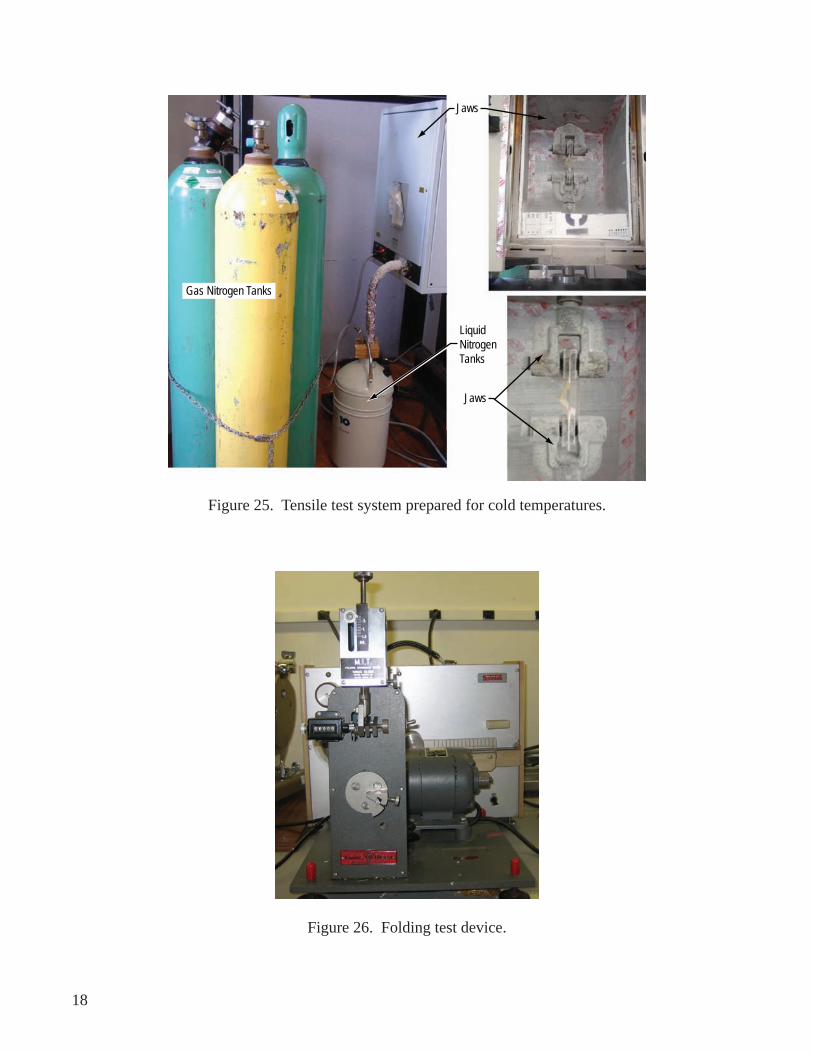
25. Tens�le test system prepared for cold temperatures ............................................................ 18
26. Fold�ng test dev�ce .............................................................................................................. 18
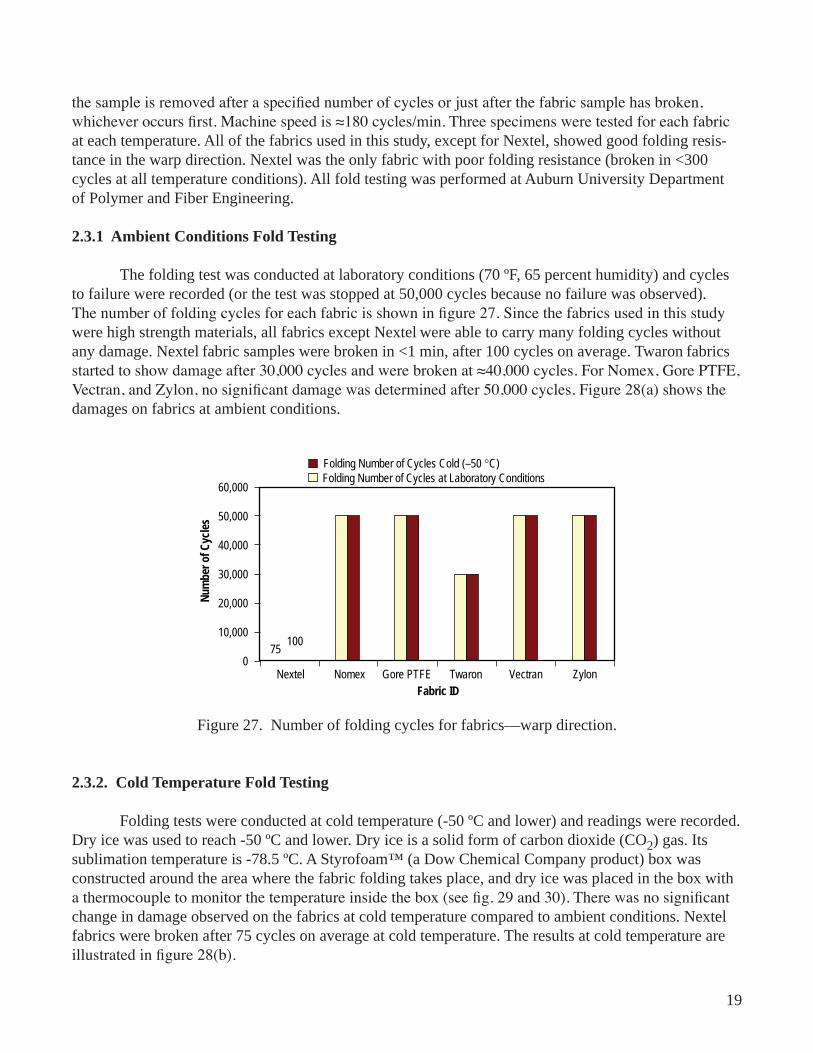
27. Number of fold�ng cycles for fabr�cs—warp d�rect�on ...................................................... 19
28. Photographs of fabr�cs after fold test�ng at (a) amb�ent cond�t�ons, (b) cold cond�t�ons, and (c) cryogen�c cond�t�ons ............................................................................ 20
29. Folding device test for cold temperatures (a) before modification and (b) after modification .......................................................................................................... 20
30. Fold�ng test system for cold temperatures .......................................................................... 21
31. Compar�son of �nd�v�dual components of the �on�z�ng rad�at�on env�ronment on the lunar surface w�th the pred�cted total bulk dose absorbed �n a sheet of Vectran fabr�c ................................................................................................................. 22
32. Calculated and s�mulated rad�at�on doses �n each of the three cand�date mater�als (Gore PTFE, Nextel, and Vectran) ...................................................................................... 23
33. NEC 7.5SH electron accelerator (left) and NEC 2SH pos�t�ve �on accelerator (r�ght) used to prov�de charged part�cle rad�at�on ............................................................... 24
34. Part�cle rad�at�on sample p�ctures for Gore PTFE and Nextel ........................................... 25
35. Part�cle rad�at�on sample p�ctures for Vectran .................................................................... 26
36. Compar�son of fabr�c tens�le strength (kN/�nch) before and after rad�at�on (charged part�cle)—warp d�rect�on ..................................................................................... 27

v�
LIST OF FIGURES (Continued)
37. Compar�son of fabr�c tens�le strength (MPa) before and after rad�at�on (charged part�cle)—warp d�rect�on ..................................................................................... 27
38. Compar�son of fabr�c elongat�on (percent) before and after rad�at�on (charged part�cle)—warp d�rect�on ..................................................................................... 28
39. Compar�son of fabr�c tens�le strength (kN/�nch) before and after rad�at�on (gamma)—warp and filling direction ................................................................................. 29
40. Compar�son of fabr�c tens�le strength (MPa) before and after rad�at�on (gamma)—warp and filling direction ................................................................................. 29
41. Compar�son of fabr�c elongat�on (percent) before and after rad�at�on (gamma)—warp d�rect�on ................................................................................................... 30
42. Compar�son of fabr�c elongat�on (percent) before and after rad�at�on (gamma)—filling direction ................................................................................................. 30
43. Relat�ve spectral �ntens�t�es for deuter�um lamp em�ss�ons from 110 to 180 Nm .................................................................................................................... 31
44. Sample photos ..................................................................................................................... 32
45. Compar�son of fabr�c tens�le strength (kN/�nch) before and after rad�at�on (VUV)—warp d�rect�on ...................................................................................................... 33
46. Compar�son of fabr�c tens�le strength (MPa) before and after rad�at�on (VUV)—warp d�rect�on ...................................................................................................... 33
47. Compar�son of fabr�c elongat�on (percent) before and after rad�at�on (VUV)—warp d�rect�on ...................................................................................................... 33
48. Compar�son of fabr�c tens�le strength (MPa) before and after rad�at�on (VUV)—warp d�rect�on ...................................................................................................... 34 49. Compar�son of fabr�c elongat�on (percent) before and after rad�at�on (VUV)—warp d�rect�on ...................................................................................................... 34
50. Damage on Nextel fabr�cs after var�ous numbers of abras�on cycles ................................. 35
51. Sandpaper used on Nextel fabr�cs for abras�on .................................................................. 36
v��
LIST OF FIGURES (Continued)
52. Damage on Nomex fabr�cs after var�ous numbers of abras�on cycles ............................... 36
53. Sandpaper used on Nomex fabr�cs for abras�on ................................................................. 37
54. Damage on Gore PTFE fabr�cs (1,000 cycles) and used sandpaper ................................... 37
55. Damage on Twaron fabr�c (1,000 cycles) and used sandpaper .......................................... 38
56. Damage on Vectran fabr�c (1,000 cycles) and used sandpaper .......................................... 38
57. Damage on Zylon fabr�cs at var�ous numbers of abras�on cycles ...................................... 39
58. Sandpaper used for Zylon abras�on .................................................................................... 39
59. Tumble testing: (a) tester, (b) bags filled with regolith, (c) bags ready for testing, and (d) just opened tester after tumbl�ng ............................................................................ 40
60. Bags �n tester w�th regol�th st�mulant after tumbl�ng ......................................................... 40
61. Damage to Nextel caused by sew�ng and tumbl�ng ............................................................ 41
62. Tumble abraded Vectran sample ......................................................................................... 41
63. Tumble abraded Gore PTFE sample ................................................................................... 42
64. Tumble abraded Nextel sample .......................................................................................... 42
65. Tumble abraded Nomex sample ......................................................................................... 43
66. Tumble abraded Twaron sample ......................................................................................... 43
67. Tumble abraded Zylon sample ........................................................................................... 44
68. Two-stage m�cro l�ght gas gun ............................................................................................ 45
69. Vectran �mpact test�ng: (a) pre-test, (b) post-test, and (c) post-test close up ...................... 46
70. Irrad�ated Vectran �mpact test�ng: (a) pre-test, (b) post-test, and (c) post-test close up ..... 47
71 Zylon �mpact test�ng: (a) pre-test, (b) post-test, and (c) post-test close up ........................ 47
72. Twaron �mpact test�ng: (a) pre-test, (b) post-test, and (c) post-test close up ...................... 48

v���
LIST OF FIGURES (Continued)
73. Gore PTFE �mpact test�ng: (a) pre-test, (b) post-test, and (c) post-test close up ................ 48
74. Nextel �mpact test�ng: (a) pre-test, (b) pre-test s�de seam spl�t, (c) post-test, and (d) post-test close up .................................................................................................... 49
75. Nomex �mpact test�ng: (a) pre-test, (b) post-test, and (c) post-test close up ...................... 49
76. Simulation of meteoroid striking Kevlar bag filled with lunar regolith: (a) pre-�mpact and (b) post-�mpact ..................................................................................... 50
77. Form and term�nology of a masonry arch .......................................................................... 51
78. Arch formed from connected fabric bags filled with soil-like material (lunar regol�th or verm�cul�te) ....................................................................................................... 51
79. Masonry arch loading and compressive force flow path (aka line of thrust or fun�cular polygon ................................................................................................................ 52
80. Masonry arches showing hinge formation where forces flow outside the arch boundary ............................................................................................................................. 53
81. Helical flexible screw conveyor system, with green hopper, black motor, and white tube, mounted on a jack stand for bag filling at different heights ...................................... 54
82. Opened rece�v�ng �nlet, show�ng the hel�x ......................................................................... 55
83. Small center-connected bag arch (base length equals 18 �nches, loaded w�th 150 lb) ....... 56
84. Funicular polygon of figure 83 ........................................................................................... 56
85. Small center-connected bag arch in “M-shaped configuration” (base length equals 20 �nches, loaded w�th 150 lb) ............................................................................................ 57
86. Funicular polygon of figure 85, predicting hinging ............................................................ 57
87. Center-connected bags geometry ........................................................................................ 58
88. Erect�ng b�g center-connected bag structure ....................................................................... 58
89. B�g center-connected bag arch w�th alum�num frame lowered pr�or to removal ............... 59
90. B�g center-connected bag arch w�th alum�num frame removed ......................................... 59
�x
LIST OF FIGURES (Continued)
91. CAD draw�ng of top-connected bag beam ....................................................................... 60
92. Cant�levered top-connected bag beam held at one end and support�ng �ts own we�ght .................................................................................................................... 60
93. Concept draw�ng of arch ................................................................................................... 61
94. Front d�mens�oned v�ew (d�mens�ons �n ft) ...................................................................... 62
95. Fun�cular polygon show�ng poss�ble h�ng�ng �n arch des�gn ........................................... 62
96. Another set of poss�ble h�nge locat�ons ............................................................................ 63
97. Taller des�gn (d�mens�ons �n ft) ........................................................................................ 64
98. Fun�cular polygon of the 60-bag taller, more stable structure .......................................... 64
99. CAD model template to gu�de erect�ng ............................................................................ 65
100. Air-filled 46-bag structure (five pipes guiding bag filling) ............................................... 65
101. Bag filling process ............................................................................................................ 67
102. Rectangular packed bags .................................................................................................. 67
103. Front v�ew (d�mens�ons: 106-�nch he�ght, 118-�nch external w�dth at base, 65-�nch �nternal w�dth at base, 66-�nch depth—front to back/z�pper s�de to non-z�pper s�de) ...... 68
104. Rear v�ew (note the z�ppers) ............................................................................................. 68
105. (a) Bags �n a stra�ght l�ne, dev�at�ng from canternary shape, (b) t�ghtly packed, bulging bag, (c) tightly packed 1-ft bags on the good side—it is difficult to insert a finger between the bags, and (d) loosely packed bags on the bad side—the finger is easily inserted between the bags ........................................................ 70
106. Rendered CAD conceptual�zat�on .................................................................................... 71
107. Berm configuration using 19 partially filled center-connected bags ................................ 72
108. Sample (fo�l over Vectran) prototype sect�on produced by Techsphere, Inc. ................... 74

x
LIST OF TABLES
1. Structural propert�es of fabr�c samples ............................................................................... 5
2. Tens�le propert�es of yarns .................................................................................................. 6
3. Yarn tens�le strength values (MPa) as compared to reported values .................................. 8
4. Elongation of warp and filling yarns (kN) as compared to reported values ....................... 8
5. Modifications applied to the fabrics ................................................................................... 11
6. Fabric tensile strength and elongations in warp and filling directions at ambient cond�t�ons ............................................................................................................................ 12
7. Fabr�c strength (kN/�nch) at d�fferent cond�t�ons ............................................................... 15
8. Fabr�c elongat�on (percent) �n d�fferent cond�t�ons ............................................................ 16
9. Fabr�c strength before and after rad�at�on (charged part�cle) ............................................. 26
10. Fabr�c elongat�on (percent) before and after charged part�cle rad�at�on ............................. 27
11. Fabr�c strength and elongat�on after gamma rad�at�on (10 Mrd) ......................................... 28
12. Fabr�c strength and elongat�on before and after rad�at�on (VUV) ....................................... 32
13. Raw data from �mpact test�ng of bag mater�als .................................................................. 46
14. Construct�on coord�nates of numbered po�nts (�nches) ...................................................... 66
15. Lunar Meteoro�d Env�ronment ........................................................................................... 77

x�
LIST OF ACRONYMS AND SYMBOLS
ASTM Amer�can Soc�ety for Test�ng and Mater�als
CAD computer-a�ded des�gn
CO2 carbon d�ox�de
60CO cobalt-60
CRE constant rate of extens�on
CSI Custom Scientific Instruments
CV coefficient of variation
EPR ethylene propylene rubber
F filling
fpi filling per inch
GN2 gaseous N�trogen
GCR galact�c cosm�c ray
ISFR In S�tu Fabr�cat�on and Repa�r
ITS Integrated T�ger Ser�es
JSC Johnson Space Center
LCP l�qu�d crystal polymer
LN2 l�qu�d N�trogen
MCP MSFC Call for Proposals
MIT Massachusetts Inst�tute of Technology
MLGG m�cro l�ght gas gun

x��
LIST OF ACRONYMS AND SYMBOLS (Continued)
MSFC Marshall Space Fl�ght Center
NEC Nat�onal Electron�cs Corporat�on
PBO poly (p-phenylene-2, 6-benzob�soxazole)
PPTA poly (p-phenylene terepthalam�de)
PTFE polytetrafluoroethylene
SEEF Space Env�ronmental Effects Fac�l�ty
SPE solar part�cle event
SPHC smooth part�cle hydrodynam�c code
SRIM stopp�ng range of �on matters
TEFC totally enclosed fan cooled
TPI threads per �nch
UHMW ultrah�gh molecular we�ght
UV ultrav�olet
VUV vacuum ultrav�olet
W warp
wp� warp per �nch
1
TECHNICAL MEMORANDUM
A ONE-PIECE LUNAR REGOLITh BAG GARAGE PROTOTYPE
1. BACKGROUND
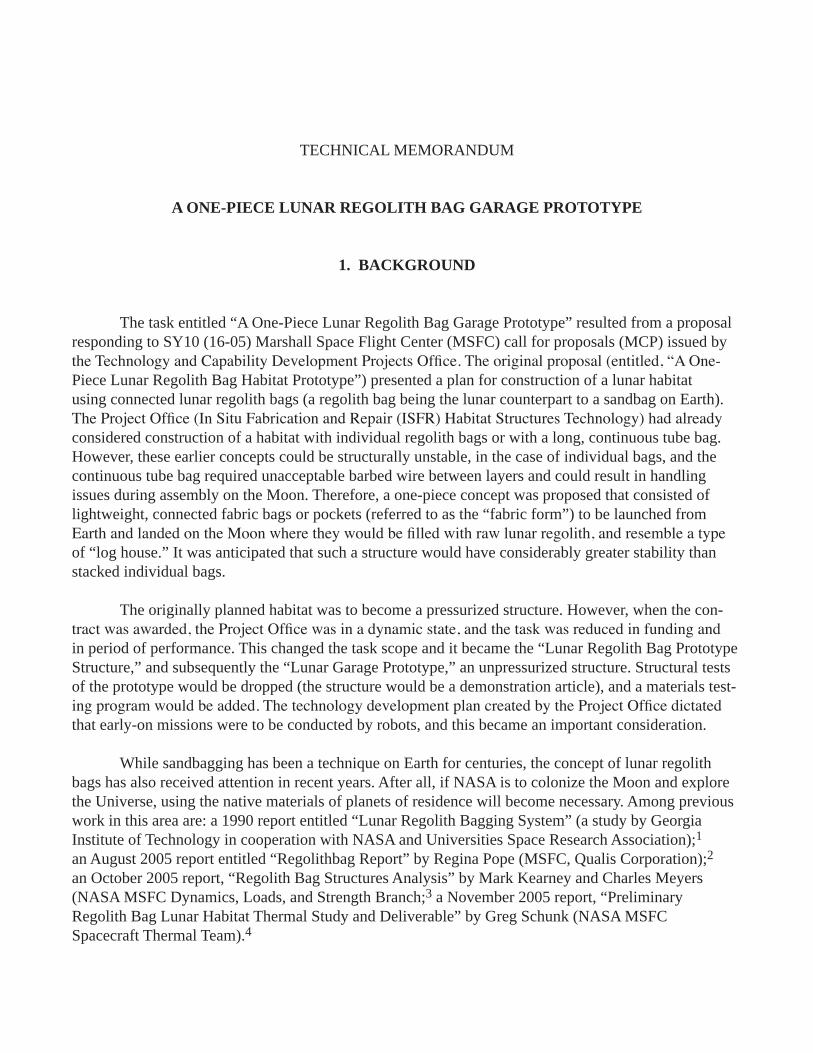
The task ent�tled “A One-P�ece Lunar Regol�th Bag Garage Prototype” resulted from a proposal respond�ng to SY10 (16-05) Marshall Space Fl�ght Center (MSFC) call for proposals (MCP) �ssued by the Technology and Capability Development Projects Office. The original proposal (entitled, “A One- P�ece Lunar Regol�th Bag Hab�tat Prototype”) presented a plan for construct�on of a lunar hab�tat us�ng connected lunar regol�th bags (a regol�th bag be�ng the lunar counterpart to a sandbag on Earth). The Project Office (In Situ Fabrication and Repair (ISFR) Habitat Structures Technology) had already cons�dered construct�on of a hab�tat w�th �nd�v�dual regol�th bags or w�th a long, cont�nuous tube bag. However, these earl�er concepts could be structurally unstable, �n the case of �nd�v�dual bags, and the cont�nuous tube bag requ�red unacceptable barbed w�re between layers and could result �n handl�ng �ssues dur�ng assembly on the Moon. Therefore, a one-p�ece concept was proposed that cons�sted of l�ghtwe�ght, connected fabr�c bags or pockets (referred to as the “fabr�c form”) to be launched from Earth and landed on the Moon where they would be filled with raw lunar regolith, and resemble a type of “log house.” It was ant�c�pated that such a structure would have cons�derably greater stab�l�ty than stacked �nd�v�dual bags.
The or�g�nally planned hab�tat was to become a pressur�zed structure. However, when the con-tract was awarded, the Project Office was in a dynamic state, and the task was reduced in funding and �n per�od of performance. Th�s changed the task scope and �t became the “Lunar Regol�th Bag Prototype Structure,” and subsequently the “Lunar Garage Prototype,” an unpressur�zed structure. Structural tests of the prototype would be dropped (the structure would be a demonstrat�on art�cle), and a mater�als test-ing program would be added. The technology development plan created by the Project Office dictated that early-on m�ss�ons were to be conducted by robots, and th�s became an �mportant cons�derat�on.
Wh�le sandbagg�ng has been a techn�que on Earth for centur�es, the concept of lunar regol�th bags has also rece�ved attent�on �n recent years. After all, �f NASA �s to colon�ze the Moon and explore the Un�verse, us�ng the nat�ve mater�als of planets of res�dence w�ll become necessary. Among prev�ous work �n th�s area are: a 1990 report ent�tled “Lunar Regol�th Bagg�ng System” (a study by Georg�a Inst�tute of Technology �n cooperat�on w�th NASA and Un�vers�t�es Space Research Assoc�at�on);1 an August 2005 report ent�tled “Regol�thbag Report” by Reg�na Pope (MSFC, Qual�s Corporat�on);2 an October 2005 report, “Regol�th Bag Structures Analys�s” by Mark Kearney and Charles Meyers (NASA MSFC Dynam�cs, Loads, and Strength Branch;3 a November 2005 report, “Prel�m�nary Regol�th Bag Lunar Hab�tat Thermal Study and Del�verable” by Greg Schunk (NASA MSFC Spacecraft Thermal Team).4

2
Pr�or to th�s task, Dr. Raj Kaul and Gweneth Sm�thers (NASA MSFC Nonmetals Eng�neer-�ng Branch) had conducted a l�terature rev�ew/trade study on mater�al cand�dates for lunar regol�th bag structures (“Bagg�ng Mater�al Trade Study for Lunar Sandbag Hab�tat,” June 2005).5 Th�s l�terature rev�ew concluded that a lunar regol�th bag structure would l�kely be constructed not from one type of fabric, but from a combination of fabrics, or a blended fiber, and would likely employ coated material(s).
At task initiation, it was stated that the proposing team understood that the Project Office expected the follow�ng: ultrav�olet rad�at�on, �on�z�ng rad�at�on, and hyperveloc�ty �mpact test�ng of Vectran™ (a Celanese Acetate product), Nextel™ (a 3M Company product), and Gore-Tex™
(a W. L. Gore and Assoc�ates product) fabr�cs; des�gn, construct�on, and del�very of a regol�th bag prototype structure; and a final report. However, the task team felt that, even though the task had been reduced from the or�g�nal scope and fund�ng, �t was �mportant to �nclude more than what was requ�red: the mater�als test�ng program should be expanded to �nclude not only rad�at�on and �mpact test�ng but also density and geometry, tensile strength, flex/fold endurance, abrasion resistance, and, wherever poss�ble, amb�ent, cold, and hot env�ronments. The l�st of mater�al cand�dates to be evaluated was also extended to �nclude Zylon™ (a Toyobo Company product), Kevlar™, and Nomex™ (both DuPont Company products).
The goals of the task were:
(1) To learn, through mater�als test�ng, wh�ch mater�als are su�table for use �n construct�on of a one-piece regolith bag form to be launched from Earth, landed on the Moon, filled with raw lunar rego-l�th, and used as a funct�onal structure (mater�als chosen from a prev�ous l�terature rev�ew to be tested in conjunction with official lunar regolith simulant).
(2) To successfully design, develop, and construct a large one-piece regolith bag form and fill it with sand (and perhaps, fill some sections with official lunar regolith simulant).
(3) To assess this first one-piece regolith bag prototype structure for structural integrity and manufacturab�l�ty.
The Project Office provided “Environmental Design Requirements and Assumptions” (see append�x). Attempts to s�mulate these cond�t�ons fell far short of lunar cond�t�on assumpt�ons. While the requirements and assumptions specified only cold temperatures, warmer than ambient condi-t�ons were �ncluded because of the uncerta�nty of future m�ss�on s�tes/cond�t�ons.
Before the Apollo m�ss�ons there were attempts to better understand the Moon. But after the Apollo m�ss�ons, cons�derable factual �nformat�on became ava�lable about lunar env�ronmental cond�-t�ons and the chem�cal and phys�cal character�zat�on of the lunar regol�th. M�now and Altstatt �n “Lunar Rad�at�on Env�ronments for Character�zat�on of ISFR/Hab�tat Structures Mater�als”6 state: “Hab�tat Structures goals are to prov�de an env�ronment safe from hazards of the lunar env�ronment �nclud�ng the lack of atmosphere, extremes of temperature, space rad�at�on effects, and m�cro-meteor�te �mpacts wh�le support�ng phys�olog�cal needs of the �nhab�tants. Select�on cr�ter�a for cand�date hab�tat mater�als �nclude the ab�l�ty of mater�al propert�es to meet des�gn requ�rements after long term exposure to space rad�at�on env�ronments and sh�eld�ng propert�es of the mater�als to protect the �nhab�tants from galact�c

3
cosm�c rays and solar energet�c part�cles.” Although the task’s or�g�nal pressur�zed hab�tat plan became an unpressur�zed garage plan, most of these concerns st�ll appl�ed, espec�ally s�nce �t �s poss�ble that the garage m�ght eventually evolve �nto a hab�tat. The “Lunar Sourcebook” ed�ted by He�ken, Van�man, and French)7 and the M�now and Altstatt document6 (for rad�at�on test�ng) were major sources that gu�ded cons�derat�on of mater�al cand�dates for the l�terature rev�ew, the mater�als test�ng program, and the pro-totype des�gn.
Fabrics constructed with intermittent “pockets” in them, much like the ones in figure 1, have been used as forms for concrete eros�on control structures on stream banks, and th�s concept served as �nsp�rat�on for the connected regol�th bag proposal; �t was hoped that the same concept could also pro-v�de stab�l�ty w�th�n the context of a lunar structure.
Figure 1. A concrete-filled, woven double cloth used for erosion control on stream banks.

4
2. MATERIALS TESTING PROGRAM
The follow�ng s�x cand�date fabr�c mater�als were selected for test�ng:
• Vectran – a polyester-based liquid crystal polymer, (LCP) fiber
• Nextel – a refractory aluminoborosilicate (ceramic) fiber
• Gore PTFE Fabric – an expanded polytetrafluoroethylene (PTFE) fiber
• Nomex – a meta-aramid or poly(metaphenyleneisophthalamide) fiber
• Twaron™ (a Teijin Group product) – a polyparaphenylene terepthalamide (PPTA) fiber (this was used �nstead of Kevlar, wh�ch has a s�m�lar chem�stry and propert�es)
• Zylon – a fiber consisting of rigid rod chain molecules of poly (p-phenylene-2, 6-benzobisoxazole) (PBO).
2.1 Determination of Fabric Structural Properties
Woven fabr�cs were selected from manufacturers based on s�m�lar�ty of construct�on parameters from among those mater�als that were read�ly ava�lable (w�thout custom manufactur�ng, wh�ch would have been proh�b�t�vely expens�ve �n terms of both money and t�me). S�m�lar�ty �n construct�on param-eters was necessary to enable a val�d “apples and apples” compar�son of d�fferent mater�als subjected to the same test�ng. The ma�n structural propert�es of cand�date fabr�cs are l�sted �n table 1 and �llustrated in figures 2 through 4. The construction was determined by examination of a magnified image of the fabr�cs. Fabr�c areal we�ght was determ�ned by cutt�ng a p�ece of fabr�c, measur�ng �ts d�mens�ons and weighing it. Nomex fabric has the finest yarns in the group, while Nextel fabric has the coarsest yarns. Zylon fabric has the lowest number of warp and filling yarns per inch, while Gore-PTFE has the t�ghtest structure. As expected, these measurements agreed w�th those prov�ded by the manufacturers. Mater�al densities of the fibers were obtained from the manufacturers8–13 and are shown �n table 1. One sample per fabr�c was exam�ned and determ�nat�on of all fabr�c structural propert�es was performed at Auburn Un�vers�ty Department of Polymer and F�ber Eng�neer�ng.
2.2 Tensile Testing
2.2.1 Yarn Tensile Testing
All tens�le tests were performed at Auburn Un�vers�ty Department of Polymer and F�ber Eng�-neer�ng. Tens�le propert�es of the yarns were obta�ned accord�ng to Amer�can Standard for Test�ng and Mater�als (ASTM) D-2256, “Standard Test Method for Tens�le Propert�es of Yarns by S�ngle-Strand

5
Table 1. Structural propert�es of fabr�c samples.
Fabric SourceType/ Style
Weave (Pattern)
Yarn Count Warp/Filling
(denier)TPI
(W/F)*Density (g/cm3)
Areal Density (oz/sq yd)
Thickness (mm)
Nextel 3 M 312-AF10 1/4 Satin 600/600 46/46 2.7 7.1 0.33
Nomex Fabric Development Inc.
503 Plain 200/200 54/54 1.38 2.9 0.19
Gore PTFE Fabric W.L. Gore VG0181 1/3 Satin 400/400 88/84 2.17 10.0 0.30
Twaron Lincoln Textiles
2040-3531 Plain 500/500 48/46 1.45 6.5 0.36
Vectran ILC Dover HS Plain 400/400 54/54 1.4 6.0 0.31
Zylon Hexcel 530 Plain 500/500 30/30 1.55 4.0 0.25*Threads per inch (TPI) Warp/filling (W/F)
Nextel Nomex Gore PTFE Twaron Vectran Zylon
700
600
500
400
300
200
100
0
Yarn
Cou
nt (D
enie
r)
Fabric ID
Yarn Count Warp (Denier) Yarn Count Filling (Denier)
F�gure 2. Yarn counts of the samples.
Nextel Nomex Gore PTFE Twaron Vectran Zylon
100908070605040302010
0
Num
ber o
f Yar
ns/In
ch
Fabric ID
Warps/InchFillings/Inch
Figure 3. Number of warps and fillings of the samples.

6
Nextel Nomex Gore PTFE Twaron Vectran Zylon
3
2.5
2
1.5
1
0.5
0
Den
sity
(g/c
m3 )
Fabric ID
Figure 4. Density of the fibers used in the fabric samples.
Method”14 at laboratory cond�t�ons (70 ºF and 65 percent hum�d�ty). In th�s test, the yarn sample �s clamped �n a tens�le test�ng mach�ne (Instron Model 1122) and a force �s appl�ed to the sample unt�l �t breaks. Values for the break�ng force and elongat�on of the samples are obta�ned from a computer �nter-faced w�th the test�ng mach�ne. Yarn samples (10 �n each d�rect�on) were removed from the cand�date fabr�cs to test for tens�le strength and elongat�on values. Calculated values were found by d�v�d�ng the fabr�c tens�le strength (also obta�ned by test�ng) by the number of yarns �n the tested area (see table 2). Conversion efficiency (in percent) is found by dividing the calculated yarn tensile strength by the meas-ured yarn tens�le strength and shows the compar�son of pulled-out yarn strength to yarn strength obta�ned from test�ng the fabr�c. Ten yarn samples of each fabr�c type were tested for yarn strength. The yarn strength values are not normal�zed for yarn s�ze and are reported �n kN/yarn �n table 2 and figures 5 and 6.
Table 2. Tens�le propert�es of yarns.
Fabric TM
Measured Yarn Tensile Strength
(kN) (W)
Calculated Yarn Strength (kN)
(Measured Fabric Strength/wpi)* (W)
Conversion Efficiency (%)
Calculated/ Measured (W)
Measured Yarn Tensile Strength
(kN) (F)
Calculated Yarn Strength (kN)
(Measured Fabric Strength/fpi)** (F)
Conversion Efficiency (%)
Calculated/Measured (F)
Nextel 0.0081 0.017 208 0.0109 0.017 152
Nomex 0.0094 0.0084 89 0.0083 0.0082 98
Gore PTFE 0.0165 0.015 92 0.015 0.016 109
Twaron 0.072 0.044 61 0.097 0.100 104
Vectran 0.084 0.042 50 0.112 0.080 72
Zylon 0.133 0.089 66 0.148 0.126 85 *warp per inch (wpi)**filling per inch (fpi)
F�gures 5 and 6 �llustrate the tens�le strength values obta�ned by the s�ngle strand method as com-pared to the calculated values for both warp and filling yarns. Zylon yarns exhibit the highest strength, wh�le Nextel and Nomex yarns exh�b�t the lowest strength values �n both d�rect�ons. The h�ghest conver-sion efficiency is obtained in Nextel yarns while the lowest efficiency is obtained in Vectran yarns.

7
Nextel Nomex Gore PTFE Twaron Vectran Zylon
0.160.140.12
0.10.080.060.040.02
0
Yarn
Str
engt
h (k
N) 205
180155130105805530
Conversion Efficiency (%
)C
alculated/Measured
Fabric ID
Calculated Yarn Strength (kN) WConversion Effieciency (%) W Calculated/Measured
Measured Yarn Tensile Strength (kN) W
F�gure 5. Tens�le strength of warp yarns (kN) as compared to calculated values.
Nextel Nomex Gore PTFE Twaron Vectran Zylon
0.16
0.14
0.12
0.1
0.08
0.06
0.04
0.02
0
Yarn
Str
engt
h (k
N)
16015014013012011010090807060
Conversion Efficiency (%
)C
alculated/Measured
Fabric ID
Calculated Yarn Strength (kN) WConversion Effieciency (%) W Calculated/Measured
Measured Yarn Tensile Strength (kN) W
Figure 6. Tensile strength of filling yarns (kN) as compared to calculated values.
It should be added here that, s�nce Nextel yarns are very br�ttle and the yarn structure �s very loose, when the yarns were being mounted for the tensile test, some of the fibers were already lost from the yarn structure. In add�t�on to that, dur�ng the yarn tens�le test of Nextel and Zylon yarns, many yarn breakages were observed �n the test�ng mach�ne jaw clamps—probably due to damage �n the clamps.
Measured values (from these tests) and values reported by manufacturers8–13 for tens�le strength (MPa) and elongation (percent) of the warp and filling yarns are listed in the tables 3 and 4 and are illus-trated in figures 7 through 10.
Tens�le strength values g�ven �n MPa �n table 3 are calculated by d�v�d�ng the tens�le values obta�ned by s�ngle strand method �n kN/�nch by the area.
σ MPaF kN inch
No of yarns inch Yarn Den( ) =×
×
( / )
/
103
iierDensity9 000
10 6
, ×
× −

8
Table 3. Yarn tens�le strength values (MPa) as compared to reported values.
Fabric TM
Measured Yarn Tensile Strength
(MPa) (W)
Reported Yarn Tensile Strength
(MPa) (W)
Measured/ Reported
Yarn Strength (%) (W)
Measured Yarn Tensile Strength
(MPa) (F)
Reported Yarn Tensile Strength
(MPa) (F)
Measured/ Reported Yarn
Tensile Strength (%) (F)
Nextel 324 450 72 446 550 81
Nomex 559 550 102 497 550 90
Gore PTFE 830 810 102 732 810 90
Twaron 1,879 3,000 63 2,532 3,000 84
Vectran 2,646 2,800 95 3,528 2,800 126
Zylon 2,483 5,800 43 4,129 5,800 71
Table 4. Elongation of warp and filling yarns (kN) as compared to reported values.
Fabric
Measured Yarn Elongation
(%) (W)
Reported Yarn Elongation
(%) (W)
Measured Yarn Elongation
(%) (F)
Reported Yarn Elongation
(%) (F )
Measured/ Reported Yarn
Elongation (%) (W)
Measured/ Reported Yarn
Elongation (%) (F)
Nextel 1.1 1.2 1.3 1.2 91.8 109.6
Nomex 29.8 22 29.1 22 135.4 132.2
Gore PTFE 8.6 15 6.9 15 57.2 45.8
Twaron 8.2 2 3.8 2 408.4 188.9
Vectran 7.6 3.3 5.3 3.3 228.97 159.8
Zylon 4.8 2 4.1 2 237.7 204.1
Nextel Nomex Gore PTFE Twaron Vectran Zylon
7,000
6,000
5,000
4,000
3,000
2,000
1,000
0
Yarn
Ten
sile
Str
engt
h (M
Pa) 110
100
90
80
70
60
50
40
Measured/R
eported YarnTensile Strength (%
)
Fabric ID
Reported Yarn Tensile Strength (MPa) WMeasured/Reported Yarn Tensile Strength (%) W
Measured Yarn Tensile Strength (MPa) W
F�gure 7. Tens�le strength of warp yarns (MPa) as compared to reported values.
F�gures 9 and 10 show that Nomex yarns have the h�ghest elongat�on values wh�le Nextel has the lowest. Except for Nextel and Gore PTFE fabr�cs, h�gher elongat�on values were obta�ned �n tens�le tests compared to the reported values �n both d�rect�ons.
9
Nextel Nomex Gore PTFE Twaron Vectran Zylon
7,000
6,000
5,000
4,000
3,000
2,000
1,000
0Yarn
Ten
sile
Str
engt
h (M
Pa) 110
100
90
80
70
60
50
40
Measured/R
eported YarnTensile Strength (%
)
Fabric ID
Reported Yarn Tensile Strength (MPa) FMeasured/Reported Yarn Tensile Strength (%) F
Measured Yarn Tensile Strength (MPa) F
Figure 8. Tensile strength of filling yarns (MPa) as compared to reported values.
Nextel Nomex Gore PTFE Twaron Vectran Zylon
35
30
25
20
15
10
5
0
Wra
p Ya
rn E
long
atio
n a
t Pea
k (%
)
4403903402902401901409040
Measured/R
eported Yarn Elongation W
(%)
Fabric ID
Reported Yarn Elongation at Peak (%) WMeasured/Reported Yarn Elongation (%) W
Measured Yarn Elongation at Peak (%) W
F�gure 9. Tens�le elongat�on of warp yarns (percent) as compared to reported values.
Nextel Nomex Gore PTFE Twaron Vectran Zylon
35
30
25
20
15
10
5
0
Filli
ng Y
arn
Elo
ngat
ion
at P
eak
(%)
240220200180160140120100806040
Measured/R
eported Yarn Elongation F (%
)
Fabric ID
Reported Yarn Elongation at Peak (%) FMeasured/Reported Yarn Elongation (%) F
Measured Yarn Elongation at Peak (%) F
Figure 10. Tensile elongation of filling yarns (percent) as compared to reported values.

10
2.2.2 Fabric Tensile Testing
2.2.2.1 General Procedures. Tens�le propert�es of the fabr�cs were obta�ned accord�ng to the ASTM D-503514 str�p test at amb�ent cond�t�ons. F�ve fabr�c samples of each fabr�c type were tested for tens�le strength. In th�s test, the fabr�c sample �s clamped �n a tens�le test�ng mach�ne (Instron-4505) and a force �s appl�ed to the sample unt�l �t breaks. Values for the break�ng force and elongat�on of the test sample are obta�ned from a computer �nterfaced w�th the test�ng mach�ne. S�nce the fabr�cs used in this study are high strength textile materials, special modifications were made to prevent the fabrics from sl�pp�ng �n the clamps or be�ng damaged as a result of be�ng gr�pped �n the jaws. Measurements employed a constant rate of extens�on (CRE) type mechan�sm. Each clamp face �s a 2-�nch square. Each sample was cut 2 inches wide and 14 inches long both in warp (machine) and filling (cross) direc-tion (see fig. 11). The machine was set at a 6-inch/min crosshead speed. To minimize slippage, manual clamps were used instead of automatic clamps. Pneumatic clamps are limited by the pressure of the fluid and have quest�onable performance at both h�gh and low temperatures.
Pins
TWARON
EpoxyAppliedAreas
2 In
ch3
Inch1 Inch
3/4
Inch
F�gure 11. Tens�le test samples.
Samples were mounted securely �n the clamps, and extra attent�on was g�ven to ensure that the samples were centrally located and that the long d�mens�on was as nearly parallel as poss�ble to the d�rect�on of force appl�cat�on. S�nce some of the samples cannot be sat�sfactor�ly held �n clamps, they were placed around the pins and between the jaws as illustrated in figure 12, and jaw padding was also used when necessary. Even though the clamps were t�ghtened just enough to avo�d sl�ppage but not too tight (to avoid breaks at the front), there were times when more modification (coating, padding, etc.) was requ�red.
As stated earl�er, fabr�c samples were cut 14 �nches long and 2 �nches w�de. S�nce the fabr�cs were not break�ng from the m�ddle and the yarns near the edges were not break�ng at the same t�me w�th the yarns in the middle, the samples were reduced 0.5 inch from each side (see fig. 11). Fabrics were marked across the samples at the front inner edge of each jaw to check for fabric slippage (fig. 11). Less than 0.05 percent pretension was applied to fabrics. This pretension was ≈2–3 N for Nextel, Nomex, and Gore PTFE and ≈8–10 N for Vectran, Twaron, and Zylon.

11
2-Inch Jaw
Bottom Jaw(Back)
Fabric Specimen(Side View)
Top Jaw(Front)
0.375- by 5-InchSteel Pin
3 Inch
F�gure 12. Mount�ng the tens�le test samples �n the jaws.14
2.2.2.2SpecialModifications.Fabr�cs clamped d�rectly �n the jaws produced problems w�th jaw breaks and yarn sl�ppage �n the fabr�c structure �n the clamped area. A var�ety of techn�ques was used to m�n�m�ze these problems �nclud�ng padd�ng, coat�ng, a fabr�c loop w�th p�ns located �n the fold, and a glued fabr�c loop w�th p�ns �n the fold. A cotton fabr�c used as a padd�ng �n the jaws proved suc-cessful for Nomex and Gore PTFE fabr�cs
A rubber coat�ng was appl�ed to several of the fabr�cs as an adhes�ve to pad the contact w�thappl�ed to several of the fabr�cs as an adhes�ve to pad the contact w�th to several of the fabr�cs as an adhes�ve to pad the contact w�th the jaws, �mprove the jaw gr�p, and prevent yarn sl�ppage �n the test. Th�s procedure worked well for the Nextel fabr�c and allowed compress�on �n the jaws w�thout the compress�on fracture caused by the brittleness of the fibers. The rubber coating also prevented yarn slippage in the jaws. Rubber (unvulcan-�zed ethylene propylene rubber (EPR)) d�ssolved �n hexane was pa�nted on the fabr�c and the hexane was allowed to evaporate leav�ng the rubber coat�ng on the Nextel fabr�c.
S�nce some of the yarns �n the tested area of the h�gh strength fabr�c samples (Twaron, Vectran, and Zylon) showed ev�dence of yarn sl�ppage, had excess�ve break�ng extens�on, and had lower than reported tensile strengths, an epoxy coating was applied to the clamped areas (see fig. 11). This treat-ment did not prevent yarn slippage, so pins were used in the manner depicted in figures 11 and 12. Even Even though the pins prevented the slippage, the results obtained were still significantly lower than reported values, so epoxy res�n was also appl�ed to the fabr�c samples just under the jaw area. As a result, for Twaron, Vectran, and Zylon fabr�c samples, p�ns and epoxy res�n were used at the same t�me. Epoxy was prepared by m�x�ng D.E.R.™ 331 (a Dow Chem�cal Company product) epoxy res�n w�th EPIKURE™ cur�ng agent (a M�ller-Stephenson Chem�cal Company product) and acetone was added for eas�er appl�-cation (14 g of curing agent, 100 g of epoxy resin, and 5 g of acetone). Modifications applied to the fabr�cs are l�sted �n table 5.
Table 5. Modifications applied to the fabrics.
Fabric Modification
Nextel Rubber coating and padding
Nomex Padding
Gore PTFE Padding
Twaron Epoxy resin and pins
Vectran Epoxy resin and pins
Zylon Epoxy resin and pins

12
2.2.2.3 Statistical Considerations. The coefficient of variations (CVs) of fabric tensile tests ranged from 2 to 6 percent for all tests at amb�ent cond�t�ons. Th�s �s �n l�ne w�th �ndustry expectat�ons. The results for hot and cold tests had �ncreased CVs rang�ng up to 10 percent probably because of d�f-ficulties of controlling temperature and working in the environmental chamber under those conditions.
2.2.2.4. Fabric Tensile Testing at Ambient Conditions. Tens�le tests of the fabr�cs were performed accord�ng to ASTM D-503514 (using five replicates of each fabric) at ambient conditions ≈22 °C, hum�d�ty uncontrolled). Tens�le strength and elongat�on results are l�sted �n table 6 and �llus-trated in figures 13 through 18.
Table 6. Fabric tensile strength and elongations in warp and filling directions at ambient conditions.
Fabric IDFabric Strength
(kN/Inch) (W)Fabric Strength
(kN/Inch) (F)Fabric Strength
(MPa) (W)Fabric Strength
(MPa) (F)Fabric Elongation
at Peak (%) (W)Fabric Elongation
at Peak (%) (F)
Nextel 0.804 0.745 679 673 2.6 2.3
Nomex 0.462 0.425 522 505 16.4 15.2
Gore PTFE 1.335 1.37 736 801 17.1 10.6
Twaron 2.063 4.519 1,160 2,589 14.1 6.62
Vectran 2.293 4.264 1,308 2,535 19.6 8.9
Zylon 2.662 3.773 2,509 3,553 8.0 6.4
As shown in figure 13, strength values of fabrics are higher in the filling direction than in the warp d�rect�on as expected. Twaron fabric has the highest tensile strength (kN/inch) in the filling direc-t�on wh�le Nomex has the lowest. Zylon fabr�c exh�b�ted the h�ghest strength �n the warp d�rect�on and Nomex exh�b�ted the lowest.
Nextel Nomex Gore PTFE Twaron Vectran Zylon
5
4
3
2
1
0Fabr
ic M
easu
red
Tens
ile
Stre
ngth
(kN
/Inch
)
Fabric ID
Measured Fabric Tensile Strength (kN/Inch) F (AMBIENT)Measured Fabric Tensile Strength (kN/Inch) W (AMBIENT)
Figure 13. Tensile strength of fabrics in warp and filling direction (kN/inch).
Tens�le strength values (MPa) obta�ned from the exper�ments �n th�s study are �llustrated �n figures 15 and 16 compared to yarn measurements and reported values that were obtained from the producers.8–13

13
Nextel Nomex Gore PTFE Twaron Vectran Zylon
3,900
3,400
2,900
2,400
1,900
1,400
900
400Fabr
ic T
ensi
le S
tren
gth
(MPa
)
Fabric ID
Fabric Tensile Strength (MPa) F (AMBIENT)Fabric Tensile Strength (MPa) W (AMBIENT)
Figure 14. Tensile strength of fabrics in warp and filling direction (MPa).
Nextel Nomex Gore PTFE Twaron Vectran Zylon
6,100
5,100
4,100
3,100
2,100
1,100
100Fabr
ic T
ensi
le S
tren
gth
(MPa
)
Fabric ID
Measured Yarn Tensile Strength (MPa) FFabric Tensile Strength (MPa) W Reported Yarn Tensile Strength (MPa) W
F�gure 15. Compar�son of measured tens�le strength of fabr�cs w�th reported values—warp d�rect�on. (Reported values were obta�ned from producers.)
Nextel Nomex Gore PTFE Twaron Vectran Zylon
6,100
5,100
4,100
3,100
2,100
1,100
100Fabr
ic T
ensi
le S
tren
gth
(MPa
)
Fabric ID
Measured Yarn Tensile Strength (MPa) FFabric Tensile Strength (MPa) F Reported Yarn Tensile Strength (MPa) F
F�gure 16. Compar�son of measured tens�le strength of fabr�cs w�th reported values —filling direction. (Reported values were obtained from producers.)

14
Nextel Nomex Gore PTFE Twaron Vectran Zylon
20
15
10
5
0Fabr
ic E
long
atio
n at
Pea
k (%
) W
Fabric ID
Reported Yarn Elongation at Peak (%) WMeasured Fabric Elongation at Peak (%) W
F�gure 17. Fabr�c elongat�on at peak (percent) �n warp d�rect�on.
Nextel Nomex Gore PTFE Twaron Vectran Zylon
25
20
15
10
5
0Fabr
ic E
long
atio
n at
Pea
k (%
)
Fabric ID
Reported Yarn Elongation at Peak (%) FMeasured Fabric Elongation at Peak (%) F
Figure 18. Fabric elongation at peak (percent) in filling direction.
Figures 17 and 18 show that elongation values of fabrics are generally lower in the filling direc-t�on.
2.2.2.5 Fabric Tensile Testing at Elevated Temperature. Tensile tests were performed on five samples of each fabr�c type accord�ng to ASTM D-503514 at elevated temperature. These tests were con-ducted �n an oven (Instron Env�ronmental Test Chamber Model 3119) that surrounds the test area. The sample was mounted on the tens�le test mach�ne, and oven heat�ng was begun. The oven temperature reached 100 ºC in ≈2 min and after an additional 2-min wait, the test was run at 100 oC. Tens�le strength results at elevated temperature as compared to amb�ent cond�t�ons are l�sted �n table 7 and �llustrated �n figures 19 through 22.
As shown in figures 21 and 22, the strength of fabrics (except Nextel) is decreased at elevated temperatures �n both d�rect�ons.
Tens�le elongat�on results at elevated temperature compared to the amb�ent cond�t�ons are l�sted in table 8 and are illustrated in figures 23 and 24.
2.2.2.6 Fabric Tensile Testing at Cold Temperature. Tensile tests were performed on five samples of each fabr�c type accord�ng to ASTM D-503514 at cold temperature. L�qu�d n�trogen (LN2)

15
Table 7. Fabr�c strength (kN/�nch) at d�fferent cond�t�ons.
Fabric ID
Fabric Strength (kN/Inch) (COLD)
(–100 °C) (W)
Fabric Strength (kN/Inch) (AMbIENT)
(W)
Fabric Strength (kN/Inch) (HOT)
(100 °C) (W)
Fabric Strength (kN/Inch) (COLD)
(–100 °C) (F)
Fabric Strength (kN/Inch) (AMbIENT)
(F)
Fabric Strength (kN/Inch) (HOT)
(100 °C) (F)
Nextel 1.09 0.804 0.80 1.08 0.745 0.75
Nomex 0.56 0.462 0.41 0.55 0.425 0.40
Gore PTFE 1.09 1.335 0.84 1.40 1.37 0.74
Twaron 2.13 2.063 1.67 3.56 4.519 3.85
Vectran 2.54 2.293 1.26 5.11 4.264 2.95
Zylon 3.02 2.662 2.40 3.74 3.773 3.38
Nextel Nomex Gore PTFE Twaron Vectran Zylon
3.53
2.52
1.51
0.50
Fabr
ic E
long
atio
n at
Pea
k (%
)
Fabric ID
Measured Fabric Tensile Strength (kN/Inch) W (HOT ) (100 C)Measured Fabric Tensile Strength (kN/Inch) W (AMBIENT)Measured Fabric Tensile Strength kN/Inch) W (COLD) (–100 C)
F�gure 19. Fabr�c tens�le strength (kN/�nch) at d�fferent cond�t�ons—warp d�rect�on.
Nextel Nomex Gore PTFE Twaron Vectran Zylon
6
5
4
3
2
1
0Tens
ile S
tren
gth
(kN
/Inch
)
Fabric ID
Fabric Measured Tensile Strength (kN/Inch) F (HOT ) (100 C)Measured Fabric Tensile Strength (kN/Inch) F (AMBIENT)Fabric Measured Tensile Strength kN/Inch) F (COLD) (–100 C)
Figure 20. Fabric tensile strength (kN/inch) at different conditions—filling direction.
was used to cool the test chamber (the same env�ronmental chamber used for elevated temperature test-�ng) and although the bo�l�ng po�nt �s approx�mately –195 ºC, reach�ng a temperature that low proved �mpract�cal. The temperature that could be ach�eved �n a reasonable t�me was approx�mately –100 ºC. A temperature control system was constructed as follows: A Dewar of LN2 �s fed by a submerged tube

16
Nextel Nomex Gore PTFE Twaron Vectran Zylon
3,0002,5002,0001,5001,000
5000
Tens
ile S
tren
gth
(MPa
)
Fabric ID
Fabric Tensile Strength (MPa) W (HOT ) (100 C)Fabric Tensile Strength (MPa) W (AMBIENT)Fabric Tensile Strength MPa) W (COLD) (–100 C)
F�gure 21. Fabr�c tens�le strength (MPa) at d�fferent cond�t�ons—warp d�rect�on.
Nextel Nomex Gore PTFE Twaron Vectran Zylon
4,0003,5003,0002,5002,0001,5001,000
5000
Tens
ile S
tren
gth
(MPa
)
Fabric ID
Fabric Tensile Strength (MPa) F (HOT ) (100 C)Fabric Tensile Strength (MPa) F (AMBIENT)Fabric Tensile Strength MPa) F (COLD) (–100 C)
Figure 22. Fabric tensile strength (MPa) at different conditions—filling direction.
Table 8. Fabr�c elongat�on (percent) �n d�fferent cond�t�ons.
Fabric
Fabric Elongation (%) (COLD)
(–100 °C) (W)
Fabric Elongation (%) (AMbIENT)
(W)
Fabric Elongation (%) (HOT)
(100 °C) (W)
Fabric Elongation (%) (COLD)
(–100 °C) (F)
Fabric Elongation (%) (AMbIENT)
(F)
Fabric Elongation (%) (HOT)
(100 °C) (F)
Nextel 4.2 2.6 2.7 3.8 2.3 3.2
Nomex 13.1 16.4 17.4 13.3 15.2 16.4
Gore PTFE 10.5 17.1 22.1 9.3 10.6 15.6
Twaron 10.96 14.1 15.3 5.3 6.6 8.03
Vectran 15.4 19.6 20.2 7.9 8.9 8.4
Zylon 9.4 8 8.9 7.9 6.4 7.5
p�p�ng dry gaseous n�trogen (GN2) at a constant rate (fig. 25). The GN2 was used to heat the LN2 and cause �t to bo�l. The cold vapor was then fed �nto the env�ronmental chamber to cool �t. At a constant flow rate, the chamber cooled to a constant cold temperature. The flow rate of the GN2 was adjusted to achieve a chamber temperature of approximately –100 ºC within a reasonable time (≈3 min).

17
Nextel Nomex Gore PTFE Twaron Vectran Zylon
25
20
15
10
5
0Elon
gatio
n at
Pea
k (%
)
Fabric ID
Measured Fabric Elongation at Peak (%) W (HOT ) (100 C)Measured Fabric Elongation at Peak (%) W (AMBIENT)Measured Fabric Elongation at Peak (%) W (COLD) (–100 C)
F�gure 23. Fabr�c tens�le elongat�on (percent) at d�fferent cond�t�ons—warp d�rect�on.
Nextel Nomex Gore PTFE Twaron Vectran Zylon
15
10
5
0
Elon
gatio
n at
Pea
k (%
)
Fabric ID
Measured Fabric Elongation at Peak (%) F (HOT ) (100 C)Measured Fabric Elongation at Peak (%) F (AMBIENT)Measured Fabric Elongation at Peak (%) F (COLD) (–100 C)
Figure 24. Fabric tensile elongation (percent) at different conditions—filling direction.
The equ�l�br�um temperature under these cond�t�ons was approx�mately –105 ºC. So, by beg�nn�ng a test ≈1 min after reaching –95 ºC, the sample was exposed and was equilibrated to a temperature within a narrow range of approx�mately –100 ºC at the t�me of test�ng. The procedure was to (a) load a sample, (b) close the chamber, (c) start the flow of nitrogen, (d) wait for the internal temperature to reach –95 ºC, (e) wa�t one add�t�onal m�nute, (f) test the sample, (g) open the door, (h) allow the �nter�or to warm up, (�) remove the sample, and (j) start another test. Typ�cal measured temperatures at the t�me of beg�nn�ng a test were –105 ºC. Tens�le results at cold temperature as compared to the amb�ent cond�t�ons as well as elevated temperature are listed in tables 7 and 8 and are illustrated in figures 19 through 24.
2.3 Fold Testing
2.3.1 General
Fold�ng endurance �s another measure of fabr�c strength and durab�l�ty. In use, the fabr�c form �s l�kely to rema�n folded for several weeks before be�ng unfolded at cryogen�c temperatures on the Moon and filled with regolith. The folding test was conducted using Massachusetts Institute of Technol-ogy (MIT) fold�ng endurance tester (T�n�us Olsen Test�ng Mach�nes). Fabr�cs were cut 0.5 �nch w�de by 5 inches long only in the warp direction, mounted on the machine (see fig. 26), and 1.5-kg tension was appl�ed. The fold�ng test �s performed w�th a dev�ce that folds the fabr�c samples at constant speed;
18
Jaws
LiquidNitrogenTanks
Jaws
Gas Nitrogen Tanks
F�gure 25. Tens�le test system prepared for cold temperatures.
F�gure 26. Fold�ng test dev�ce.
19
the sample is removed after a specified number of cycles or just after the fabric sample has broken, whichever occurs first. Machine speed is ≈180 cycles/min. Three specimens were tested for each fabric at each temperature. All of the fabr�cs used �n th�s study, except for Nextel, showed good fold�ng res�s-tance �n the warp d�rect�on. Nextel was the only fabr�c w�th poor fold�ng res�stance (broken �n <300 cycles at all temperature cond�t�ons). All fold test�ng was performed at Auburn Un�vers�ty Department of Polymer and F�ber Eng�neer�ng.
2.3.1 Ambient Conditions Fold Testing
The fold�ng test was conducted at laboratory cond�t�ons (70 ºF, 65 percent hum�d�ty) and cycles to fa�lure were recorded (or the test was stopped at 50,000 cycles because no fa�lure was observed). The number of folding cycles for each fabric is shown in figure 27. Since the fabrics used in this study were h�gh strength mater�als, all fabr�cs except Nextel were able to carry many fold�ng cycles w�thout any damage. Nextel fabr�c samples were broken �n <1 m�n, after 100 cycles on average. Twaron fabr�cs started to show damage after 30,000 cycles and were broken at ≈40,000 cycles. For Nomex, Gore PTFE, Vectran, and Zylon, no significant damage was determined after 50,000 cycles. Figure 28(a) shows the damages on fabr�cs at amb�ent cond�t�ons.
Nextel Nomex Gore PTFE Twaron Vectran Zylon
60,000
50,000
40,000
30,000
20,000
10,000
0
Num
ber o
f Cyc
les
Fabric ID
Folding Number of Cycles at Laboratory ConditionsFolding Number of Cycles Cold (–50 C)
75100
F�gure 27. Number of fold�ng cycles for fabr�cs—warp d�rect�on.
2.3.2. Cold Temperature Fold Testing
Fold�ng tests were conducted at cold temperature (-50 ºC and lower) and read�ngs were recorded. Dry �ce was used to reach -50 ºC and lower. Dry �ce �s a sol�d form of carbon d�ox�de (CO2) gas. Its subl�mat�on temperature �s -78.5 ºC. A Styrofoam™ (a Dow Chem�cal Company product) box was constructed around the area where the fabr�c fold�ng takes place, and dry �ce was placed �n the box w�th a thermocouple to monitor the temperature inside the box (see fig. 29 and 30). There was no significant change �n damage observed on the fabr�cs at cold temperature compared to amb�ent cond�t�ons. Nextel fabr�cs were broken after 75 cycles on average at cold temperature. The results at cold temperature are illustrated in figure 28(b).

20
(a)
(b)
(c) Nextel Nomex Gore PTFE Twaron Vectran Zylon
F�gure 28. Photographs of fabr�cs after fold test�ng at (a) amb�ent cond�t�ons, (b) cold cond�t�ons, and (c) cryogen�c cond�t�ons.
1.5 kg 1.5 kg
Fabric
Dry Ice Styrofoam Box
Fabric
(a) (b)
Figure 29. Folding device test for cold temperatures (a) before modification and (b) after modification.
2.3.3. Cryogenic Conditions Fold Testing
The Styrofoam box was aga�n used around the area where the fabr�c fold�ng takes place. LN2 was poured over the fabr�c and the fold�ng mechan�sm wh�le concurrently runn�ng the mach�ne. S�nce LN2 was being poured onto the fabric while testing, the time for testing was restricted to ≈1 min or ≈100 cycles. After ≈100 cycles, fabrics were examined under the microscope. Photographs were taken of the fold area of all samples and are shown in figure 28(c). The precise temperature of the fabric dur-�ng these fold�ng tests was not mon�tored, but the temperature of the LN2 �s approx�mately –195 °C, so a temperature close to that value �s expected.

21
F�gure 30. Fold�ng test system for cold temperatures.
It was observed that the Nextel fabr�cs had less damage under cryogen�c cond�t�ons than at amb�-ent conditions, with ≈250 cycles before complete failure. None of the other fabrics showed any signifi-cant sign of filament breakage after 100 cycles of folding at cryogenic temperatures.
2.4 Radiation Exposure and Effects
2.4.1 Overview
Mater�als used for explorat�on must be capable of w�thstand�ng all components of the natural and �nduced env�ronments to ensure surv�vab�l�ty of the m�ss�on, and ult�mately the surv�vab�l�ty of the explorers themselves. An �mportant component of any space env�ronment �s rad�at�on produced naturally �n our galaxy, or �nduced from sources such as nuclear power generators. As an �n�t�al look at mater�als that are potent�al cand�dates for use �n develop�ng structures on the lunar surface, a l�st of the pert�nent components of the natural �on�z�ng rad�at�on env�ronment was comp�led to deduce the l�kely rad�a-t�on dose caused by th�s env�ronment. Cand�date mater�als were subjected to env�ronments equ�valent to a 10-yr rad�at�on exposure on the Moon at the NASA MSFC Space Env�ronmental Effects Fac�l-�ty (SEEF). After exposure, the �rrad�ated mater�als were returned to Auburn Un�vers�ty for mater�al strength test�ng as �nd�cated �n the follow�ng sect�ons of th�s document. Add�t�onal test�ng �ncorporat�ng a cobalt-60 (60Co) gamma �rrad�at�on fac�l�ty was performed at Auburn Un�vers�ty. 2.4.1.1 Ionizing Radiation Environment. The major components of �on�z�ng rad�at�on �n the natural lunar env�ronment are from the solar w�nd, solar cosm�c rays from solar part�cle events (SPE), galact�c cosm�c rays (GCR), and electromagnet�c rad�at�on from the Sun.15 The solar w�nd �s composed predom�nantly of low to m�d energy (tens of keV/nucleon) protons, hel�um �ons, and electrons. Gener-ally, solar cosm�c rays from an SPE cons�st of protons w�th energ�es >10 MeV. The galact�c cosm�c ray

22
spectrum cons�sts of very h�gh energy (GeV/nucleon) �ons, and spans the range of nucle� up to about number 26 (�ron). Ion�z�ng solar electromagnet�c rad�at�on �s the ultrav�olet (UV) and vacuum UV (VUV) component of the solar spectrum, light that the atmosphere generally filters out on Earth. For the purposes of th�s �nvest�gat�on, the electromagnet�c and part�cle rad�at�on are treated separately, predom�-nantly due to d�ss�m�lar test accelerat�on factors ava�lable for the two env�ronmental components.
2.4.1.2 Radiation Transport Calculations. To pred�ct ant�c�pated rad�at�on dose levels �n the cand�date mater�als, rad�at�on transport calculat�ons were performed to determ�ne expected doses �mparted dur�ng a 10-yr exposure on the lunar surface us�ng ava�lable s�mulat�on programs. Electron transport calculat�ons were conducted us�ng the Integrated T�ger Ser�es (ITS) 3.0 su�te 2D TIGERP code,16 and �on transport s�mulat�ons us�ng the “Stopp�ng Range of Ions �n Matter—(SRIM) 2003.”17 The deta�ls of the compos�t�on and abundance of components of the lunar rad�at�on env�ronment can be found �n reference 15. Each component was analyzed separately for compar�son, and for �llustrat�on, they are presented as they relate to the Vectran candidate material in figure 31.
Dos
e (r
ad)
Depth ( m)
0 50 100 150 200 250 300
Solar Wind Ions (<600 eV)Solar Wind Ions (600–10,000 eV)Solar Wind Ions (>10,000 eV)Worst Week SPE + 10-yr GCRSolar Wind ElectronsCumulative Dose FitSimulated Dose
1 1014
1 1013
1 1012
1 1011
1 1010
1 109
1 108
1 107
1 106
1 105
1 104
1 103
F�gure 31. Compar�son of �nd�v�dual components of the �on�z�ng rad�at�on env�ronment on the lunar surface w�th the pred�cted total bulk dose absorbed �n a sheet of Vectran fabr�c.
The �on�z�ng part�cle components cons�st of solar w�nd �ons, solar w�nd electrons, and galact�c and solar cosm�c ray �ons. For analys�s, the solar w�nd �ons were grouped �nto the follow�ng energy ranges: <600 eV, 600–10,000 eV, and >10,000 eV. The solar wind electrons were modified using the parameters defined in reference 15. The GCR and SPE environments were combined for analysis, with the SPE environment being defined by a 180-hr recorded environment representing the highest radiation
23
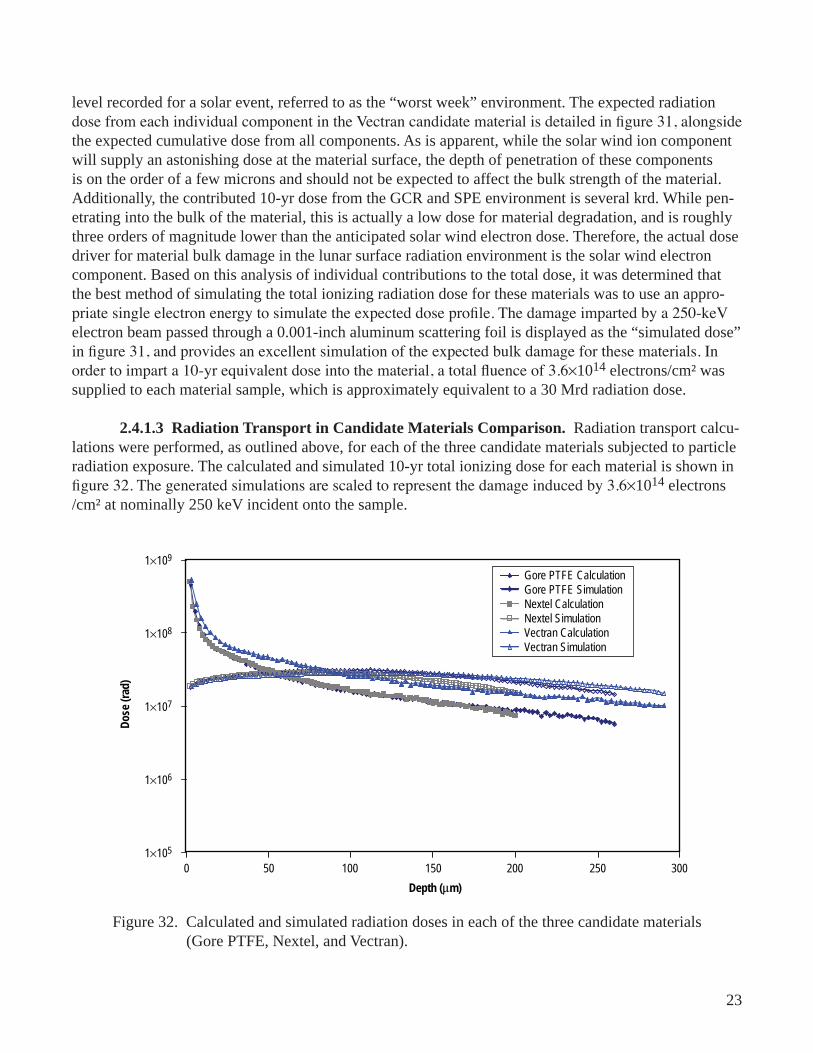
level recorded for a solar event, referred to as the “worst week” env�ronment. The expected rad�at�on dose from each individual component in the Vectran candidate material is detailed in figure 31, alongside the expected cumulat�ve dose from all components. As �s apparent, wh�le the solar w�nd �on component w�ll supply an aston�sh�ng dose at the mater�al surface, the depth of penetrat�on of these components �s on the order of a few m�crons and should not be expected to affect the bulk strength of the mater�al. Add�t�onally, the contr�buted 10-yr dose from the GCR and SPE env�ronment �s several krd. Wh�le pen-etrat�ng �nto the bulk of the mater�al, th�s �s actually a low dose for mater�al degradat�on, and �s roughly three orders of magn�tude lower than the ant�c�pated solar w�nd electron dose. Therefore, the actual dose dr�ver for mater�al bulk damage �n the lunar surface rad�at�on env�ronment �s the solar w�nd electron component. Based on th�s analys�s of �nd�v�dual contr�but�ons to the total dose, �t was determ�ned that the best method of s�mulat�ng the total �on�z�ng rad�at�on dose for these mater�als was to use an appro-priate single electron energy to simulate the expected dose profile. The damage imparted by a 250-keV electron beam passed through a 0.001-�nch alum�num scatter�ng fo�l �s d�splayed as the “s�mulated dose” in figure 31, and provides an excellent simulation of the expected bulk damage for these materials. In order to impart a 10-yr equivalent dose into the material, a total fluence of 3.6×10¹⁴ electrons/cm² was suppl�ed to each mater�al sample, wh�ch �s approx�mately equ�valent to a 30 Mrd rad�at�on dose.
2.4.1.3 Radiation Transport in Candidate Materials Comparison. Rad�at�on transport calcu-lat�ons were performed, as outl�ned above, for each of the three cand�date mater�als subjected to part�cle rad�at�on exposure. The calculated and s�mulated 10-yr total �on�z�ng dose for each mater�al �s shown �n figure 32. The generated simulations are scaled to represent the damage induced by 3.6×10¹⁴ electrons /cm² at nom�nally 250 keV �nc�dent onto the sample.
Dos
e (r
ad)
Depth ( m)
0 50 100 150 200 250 300
1 109
1 108
1 107
1 106
1 105
Gore PTFE CalculationGore PTFE SimulationNextel CalculationNextel SimulationVectran CalculationVectran Simulation
F�gure 32. Calculated and s�mulated rad�at�on doses �n each of the three cand�date mater�als (Gore PTFE, Nextel, and Vectran).

24
2.4.2 Charged Particle Exposure
The part�culate rad�at�on port�on of these tests was performed us�ng a Nat�onal Electrostat�cs Corporat�on (NEC) Model 7.5SH Pelletron® accelerator-based system located �n the MSFC SEEF. The accelerator produced the 250 keV electrons (fig.33). Electron beam currents were periodically monitored us�ng a Faraday cup near the accelerator. The �nc�dent beam was d�rected through a 0.001-�nch alum�-num scatter�ng fo�l, d�ffus�ng the beam over the des�red sample area. Th�s scatter�ng process lowered and broadened the energy d�str�but�on of the electron beam, wh�ch was accounted for �n the transport calculations. Particle flux at the samples was determined by calibrating with a Faraday cup at the sample locat�on pr�or to �ntroduct�on of the spec�men. The s�gnals from the Faraday cups were fed to an EG&G/ORTEC Model 439 d�g�tal current �ntegrator that generated an output pulse d�rectly proport�onal to the number of part�cles �nc�dent on the Faraday cup. These pulses were �n turn counted by an EG&G/ORTEC Model 999 counter/t�mer.
F�gure 33. NEC 7.5SH electron accelerator (left) and NEC 2SH pos�t�ve �on accelerator (r�ght) used to prov�de charged part�cle rad�at�on.
The sample holder and configuration for the total ionizing dose irradiation are presented photo-graphically in figures 34 and 35. Three candidate materials (Gore PTFE, Nextel, and Vectran) were sub-jected to electron �rrad�at�on, each represented by three repl�cate 2- by 10-�nch samples. Each spec�men was oriented such that it was directly irradiated at least 1 inch of the center of the width (fill direction), and at least 4 �nches of the length (warp d�rect�on). Follow�ng exposure, each spec�men was returned to Auburn

25
Pre-irradiation Gore PTFE Post-irradiation Gore PTFE
Pre-irradiation Nextel Post-irradiation Nextel
F�gure 34. Part�cle rad�at�on sample p�ctures for Gore PTFE and Nextel.
Un�vers�ty for mechan�cal strength test�ng. A fourth test was run on a bag constructed from Vectran. One s�de of the nom�nally cub�c bag was �rrad�ated and sent to the MSFC Impact Test Fac�l�ty where �t was filled with material selected to simulate properties of lunar regolith and subjected to impact testing d�rected at the �rrad�ated area of the bag. Deta�ls of the test are d�scussed �n sect�on 2.6.1.
Table 9 and figure 36 show the strength of fabrics before and after radiation exposure. Figure 37 shows the normalized strength before and after radiation exposure. Table 10 and figure 38 show the cor-respond�ng break�ng elongat�on.
As the figures show, while Nextel fabr�cs ga�ned a l�ttle strength after rad�at�on, the strength of Gore PTFE decreased dramat�cally, and the Vectran strength decreased sl�ghtly.
Elongat�on of Nextel fabr�cs was essent�ally unaffected by rad�at�on. The elongat�on of Gore PTFE
decreased dramat�cally, and Vectran’s decreased sl�ghtly.

26
Pre-irradiation Vectran Post-irradiation Vectran
Pre-irradiation Vectran Bag Sample Post-irradiation Vectran Bag Sample
F�gure 35. Part�cle rad�at�on sample p�ctures for Vectran.
Table 9. Fabr�c strength before and after rad�at�on (charged part�cle).
Fabric ID
Fabric Strength (kN/Inch) (before Rad.)
(W)
Fabric Strength (kN/Inch) (After Rad.) (Charged Particle) (W)
Fabric Strength (MPa) (before Rad.) (W)
Fabric Strength (MPa) (After Rad.)
(Charged Particle) (W)
Nextel 0.8 0.97 679 847
Gore PTFE 1.34 0.08 736 42
Vectran 2.3 2.1 1,308 1,222
2.4.3. Gamma Irradiation
Though not a major component of the natural space env�ronment, gamma �rrad�at�on do m�m�c some aspects of mater�al degradat�on due to rad�at�on exposure. Gamma �rrad�at�on causes �on�zat�on damage within a material, and has a significant depth of penetration compared to massive particles

27
Nextel Nomex Gore PTFE Twaron Vectran Zylon
3
2.5
2
1.5
1
0.5
0
Tens
ile S
tren
gth
(kN
/Inch
)
Fabric ID
Measured Fabric Tensile Strength (kN/Inch) W (AMBIENT)Radiated Fabric Measured Tensile Strength (kN/Inch) W (Charged Particle)
F�gure 36. Compar�son of fabr�c tens�le strength (kN/�nch) before and after rad�at�on (charged part�cle)—warp d�rect�on.
Nextel Nomex Gore PTFE Twaron Vectran Zylon
2,500
2,000
1,500
1,000
500
0
Fabr
ic T
ensi
le
Stre
ngth
(MPa
)
Fabric ID
Fabric Tensile Strength (MPa) W (AMBIENT)Radiated Fabric Measured Tensile Strength (MPa) W (Charged Particle)
F�gure 37. Compar�son of fabr�c tens�le strength (MPa) before and after rad�at�on (charged part�cle)—warp d�rect�on.
Table 10. Fabr�c elongat�on (percent) before and after charged part�cle rad�at�on.
Fabric IDFabric Elongation at Peak (%)
(before Rad.) (W)
Fabric Elongation (%) (After Rad.)
(Charged Particle) (W)
Nextel 2.6 2.7
Gore PTFE 17.1 3
Vectran 19.6 15.9
such as electrons and espec�ally solar w�nd �ons. Wh�le they do not carry a charge and, therefore, do not d�rectly s�mulate the part�cles respons�ble for the bulk mater�al dose �n the natural space rad�at�on env�-ronment, gamma test�ng �s a w�dely used techn�que due to cost and ava�lab�l�ty concerns compared to

28
Nextel Nomex Gore PTFE Twaron Vectran Zylon
25201510
50El
onga
tion
at P
eak
(%)
Fabric ID
Measured Fabric Elongation at Peak (%) W (AMBIENT)Radiated Fabric Measured Elongation (%) W (Charged Particle)
F�gure 38. Compar�son of fabr�c elongat�on (percent) before and after rad�at�on (charged part�cle)—warp d�rect�on.
charged part�cle exposure. For these reasons, th�s method was �ncluded �n the test reg�men to allow a significant increase in material evaluation.
F�ve samples from the s�x d�fferent fabr�cs were exposed to gamma rad�at�on �n a 60Co source to an est�mated absorbed dose of 10 Mrd at 8.558 rd/m�n for 193.4 hr. Tens�le strength propert�es were measured after exposure and results were compared to the un-�rrad�ated samples. Rad�at�on was per-formed �n the Auburn Un�vers�ty Leach Rad�at�on Fac�l�ty.
Table 11 shows the values obta�ned after fabr�cs were exposed to rad�at�on us�ng the same test-ing machine used to test the tensile properties at ambient conditions. Results are illustrated in figures 39 through 42.
Table 11. Fabr�c strength and elongat�on after gamma rad�at�on (10 Mrd).
Fabric ID Fabric Strength (kN/Inch) (W)
Fabric Strength (kN/Inch) (F)
Fabric Strength (MPa) (W)
Fabric Strength (MPa) (F)
Fabric Elongation (%) (W)
Fabric Elongation (%) (F)
Nextel 0.8 0.9 756 801 2.2 2.3
Nomex 0.4 0.4 500 488 16.4 16.8
Gore PTFE 0.2 0.2 95 114 6.3 4.5
Twaron 2.01 4.01 1,097 2,324 12.9 5.5
Vectran 2.2 4.1 1,274 2,415 17 7.2
Zylon 2.4 3.3 2,191 2,929 8.7 5.8
As shown in figures 39 and 40, the strength of all fabrics, except Nextel, is decreased after radiation both in warp and filling direction. As expected, Nextel was unaffected and perhaps had a sl�ght �ncrease �n strength. Clearly, Gore PTFE had the poorest rad�at�on res�stance by far. It suffered a dramat�c decrease �n break�ng strength after rad�at�on. Other fabr�cs e�ther �ncreased or decreased only sl�ghtly.
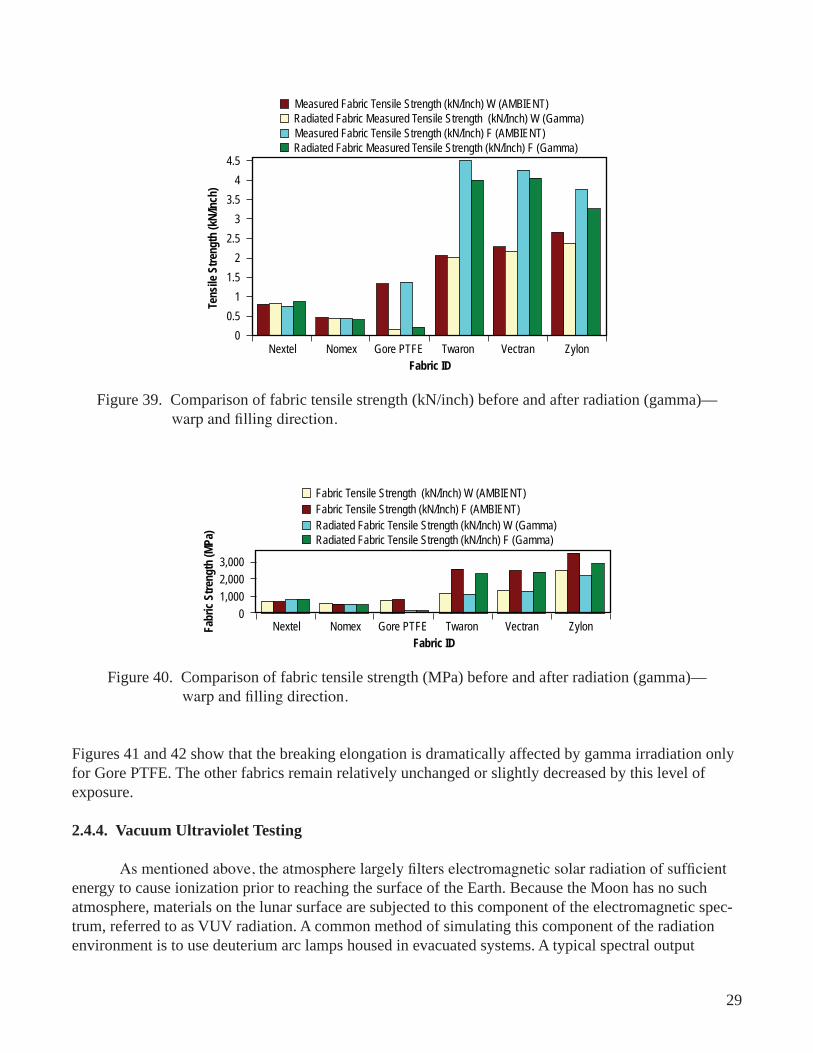
29
Nextel Nomex Gore PTFE Twaron Vectran Zylon
4.5
4
3.5
3
2.5
2
1.5
1
0.5
0
Tens
ile S
tren
gth
(kN
/Inch
)
Fabric ID
Radiated Fabric Measured Tensile Strength (kN/Inch) W (Gamma)Measured Fabric Tensile Strength (kN/Inch) W (AMBIENT)
Radiated Fabric Measured Tensile Strength (kN/Inch) F (Gamma)Measured Fabric Tensile Strength (kN/Inch) F (AMBIENT)
F�gure 39. Compar�son of fabr�c tens�le strength (kN/�nch) before and after rad�at�on (gamma)— warp and filling direction.
Nextel Nomex Gore PTFE Twaron Vectran Zylon
3,000
2,000
1,000
0
Fabr
ic S
tren
gth
(MPa
)
Fabric ID
Fabric Tensile Strength (kN/Inch) W (AMBIENT)Fabric Tensile Strength (kN/Inch) F (AMBIENT)
Radiated Fabric Tensile Strength (kN/Inch) F (Gamma)Radiated Fabric Tensile Strength (kN/Inch) W (Gamma)
F�gure 40. Compar�son of fabr�c tens�le strength (MPa) before and after rad�at�on (gamma)— warp and filling direction.
F�gures 41 and 42 show that the break�ng elongat�on �s dramat�cally affected by gamma �rrad�at�on only for Gore PTFE. The other fabr�cs rema�n relat�vely unchanged or sl�ghtly decreased by th�s level of exposure.
2.4.4. Vacuum Ultraviolet Testing
As mentioned above, the atmosphere largely filters electromagnetic solar radiation of sufficient energy to cause �on�zat�on pr�or to reach�ng the surface of the Earth. Because the Moon has no such atmosphere, mater�als on the lunar surface are subjected to th�s component of the electromagnet�c spec-trum, referred to as VUV rad�at�on. A common method of s�mulat�ng th�s component of the rad�at�on env�ronment �s to use deuter�um arc lamps housed �n evacuated systems. A typ�cal spectral output

30
Nextel Nomex Gore PTFE Twaron Vectran Zylon
25
20
15
10
05
0
Fabr
ic E
long
atio
n at
Pea
k (%
)
Fabric ID
Measured Fabric Elongation at Peak (%) W (AMBIENT)Radiated Fabric Measured Elongation at Peak (%) W (Gamma)
F�gure 41. Compar�son of fabr�c elongat�on (percent) before and after rad�at�on (gamma)— warp d�rect�on.
Nextel Nomex Gore PTFE Twaron Vectran Zylon
20
15
10
05
0
Fabr
ic E
long
atio
n at
Pea
k (%
)
Fabric ID
Measured Fabric Elongation at Peak (%) F (AMBIENT)Radiated Fabric Measured Elongation at Peak (%) F (Gamma)
F�gure 42. Compar�son of fabr�c elongat�on (percent) before and after rad�at�on (gamma)— filling direction.
of these sources as displayed in figure 43 spans the region from 110 to 170 Nm, correlating to ≈15 to 9.7 eV photon energies, respectively. These energies are sufficient to cause ionization damage in many mater�als, espec�ally organ�cs and polymers. Due to l�m�ted s�ze and substant�al costs assoc�ated w�th simulating this environment, the rate of accelerated testing of reasonably large sample areas is signifi-cantly lower than that of the ava�lable part�cle rad�at�on fac�l�t�es. It should be noted that solar elec-tromagnet�c accelerat�on factors are h�ghly dependent on the spectral reg�on used for �ntegrat�on and compar�son. Typ�cal methodolog�es �ntegrate over a broad spectral reg�on for compar�son to the solar spectrum, and when compared to these methods, deuter�um lamps d�splay relat�vely low accelerat�on factors. In the current configuration, for irradiation at 39 inches from the source, a value of 2.5× �s est�-mated as a m�n�mum accelerat�on factor us�ng a broad �ntegrat�on. However, �f the �ntegrat�on reg�on �s stopped at short wavelengths, the accelerat�on factor can be more than two orders of magn�tude greater than est�mated.17 Because the current effort �s a comparat�ve study, and all samples were subjected to the same VUV exposure, the actual accelerat�on factor �s not cr�t�cal. It �s est�mated that the accelerat�on �s at least 2.5×, and l�kely, substant�ally h�gher. Therefore, for s�mpl�c�ty, the actual durat�on of exposure �s stated as 1,246 hr of deuter�um �rrad�at�on us�ng a Hamamatsu L1835 deuter�um lamp system at a d�stance of 39 �nches under vacuum. Therefore, th�s �s equ�valent to at least 3,115 solar equ�valent hours of �rrad�at�on.

31
121.6
125.4
160.8100
80
60
40
20
0110 120 130 140 150 160 170 180
Rel
ativ
e O
utpu
t Int
ensi
ty (%
)
Wavelength (nm)
F�gure 43. Relat�ve spectral �ntens�t�es for deuter�um lamp em�ss�ons from 110 to 180 Nm.
The tens�le spec�mens for each of the s�x cand�date mater�als were mounted such that the warp d�rect�on of the spec�men was d�rected rad�ally outward from the center of the chamber. The 10-�nch-long samples were exposed to VUV radiation on a 1-inch (fill direction) by 2-inch (warp direction) area in the center of each specimen. An aluminum mask, as depicted in figure 44, shielded the remainder of each sample. To enable s�multaneous test�ng of repl�cate samples of each mater�al, two separate pa�rs of sample holders and deuter�um lamps (Hamamatsu model L1835) were used. On each sample holder, two sets of three repl�cate samples and one set of two repl�cate samples were mounted so that each lamp irradiated three candidate materials, and eight distinct specimens (fig. 44). Following irradiation, these samples were removed and returned to Auburn Un�vers�ty for mechan�cal strength test�ng.
Table 12 shows the tens�le test results obta�ned after fabr�cs were exposed to VUV rad�at�on (test�ng done on the Instron 4505) and propert�es were measured at amb�ent cond�t�ons. Results are �llus-trated in figures 45 through 47.
F�gures 45 and 46 show that Gore PTFE was the only fabr�c w�th a dramat�c decrease �n proper-t�es. Wh�le Nextel ga�ned a l�ttle �n strength, all others showed a sl�ght to moderate decrease after VUV exposure.
F�gure 47 shows that fabr�c elongat�on �n warp d�rect�on �ncreased sl�ghtly after VUV rad�at�on �n all fabr�cs except Gore PTFE.
F�gures 48 and 49 �llustrate the change �n fabr�c strength and elongat�on before and after fabr�cs are exposed to d�fferent rad�at�ons �n warp d�rect�on.

32
Plate 1 Pre-exposure Plate 2 Pre-exposure
Plate 1 Post-exposure Plate 2 Post-exposure
Plate 1 legend: G = Gore PTFE; V =Vectran; Z = Zylon
Plate 2 legend: T = Twaron; N = Nomex; X= Nextel
G1V1
G2
Z1V2
G3
V3
Z2T1
N1
X1
T2N2
X2
T3
N3
F�gure 44. Sample photos.
Table 12. Fabr�c strength and elongat�on before and after rad�at�on (VUV).
Fabric ID
Fabric Strength (kN/Inch)
(before Rad.) (W)
Fabric Strength (kN/Inch)
(After Rad.) (VUV) (W)
Fabric Elongation (%) (before Rad.) (W)
Fabric Elongation (%)
(After Rad.) (VUV) (W)
Fabric Strength (MPa) (before Rad (W)
Fabric Strength (MPa) (After Rad.)
(VUV) (W)
Nextel 0.80 0.92 2.6 3.37 679 851.77
Nomex 0.46 0.42 16.4 18.72 522 496.36
Gore PTFE 1.34 0.29 17.1 9.52 736 168.18
Twaron 2.06 2.03 14.1 16.90 1,160 1,133.07
Vectran 2.29 1.88 19.6 23.04 1,308 1,185.87
Zylon 2.66 2.10 8 9.85 2,509 1,948.82

33
Nextel Nomex Gore PTFE Twaron Vectran Zylon
3
2.5
2
1.5
1
0.5
0Tens
ile S
tren
gth
(kN
/Inch
)
Fabric ID
Measured Fabric Tensile Strength (kN/Inch) W (AMBIENT)Radiated Fabric Measured Tensile Strength (kN/Inch) W (VUV)
F�gure 45. Compar�son of fabr�c tens�le strength (kN/�nch) before and after rad�at�on (VUV)—warp d�rect�on.
Nextel Nomex Gore PTFE Twaron Vectran Zylon
2,5002,0001,5001,000
5000
Fabr
ic T
ensi
le
Stre
ngth
(MPa
)
Fabric ID
Fabric Tensile Strength (MPa) W (AMBIENT)Radiated Fabric Tensile Strength (MPa) W (VUV)
F�gure 46. Compar�son of fabr�c tens�le strength (MPa) before and after rad�at�on (VUV)—warp d�rect�on.
Nextel Nomex Gore PTFE Twaron Vectran Zylon
25201510
50
Fabr
ic E
long
atio
n at
Pea
k (%
)
Fabric ID
Measured Fabric Elongation at Peak (%) W (AMBIENT)Radiated Fabric Measured Elongation (%) W (VUV)
F�gure 47. Compar�son of fabr�c elongat�on (percent) before and after rad�at�on (VUV)— warp d�rect�on.

34
Nextel Nomex Gore PTFE Twaron Vectran Zylon
3,000
2,500
2,000
1,500
1,000
500
0
Tens
ile S
tren
gth
(kN
/Inch
)
Fabric ID
Radiated Fabric Measured Tensile Strength (MPa) W (Charged Particle)Fabric Tensile Strength (MPa) W (AMBIENT)
Radiated Fabric Measured Tensile Strength (MPa) W (VUV)Measured Fabric Tensile Strength (MPa) W (Gamma)
F�gure 48. Compar�son of fabr�c tens�le strength (MPa) before and after rad�at�on (VUV)—warp d�rect�on.
Nextel Nomex Gore PTFE Twaron Vectran Zylon
201816141210
86420
Fabr
ic E
long
atio
n (%
)
Fabric ID
Radiated Fabric Measured Elongation (%) W (Charged Particle)Measured Fabric Elongation (%) W (AMBIENT)
Radiated Fabric Measured Elongation (%) W (VUV)Radiated Fabric Measured Elongation at Peak (%) W (Gamma)
F�gure 49. Compar�son of fabr�c elongat�on (percent) before and after rad�at�on (VUV)—warp d�rect�on.
2.5 Abrasion Testing
2.5.1 Standard Abrasion
The resistance of fabrics was determined by a Custom Scientific Instruments (CSI) Stoll Quar-termaster un�versal wear tester accord�ng to the ASTM D-3885 standard test for abras�on res�stance of textile fabrics (flexing and abrasion method).14 The res�stance to abras�on �s affected by many factors, such as the inherent mechanical properties of the fibers, the dimensions of the fibers, the structure of the
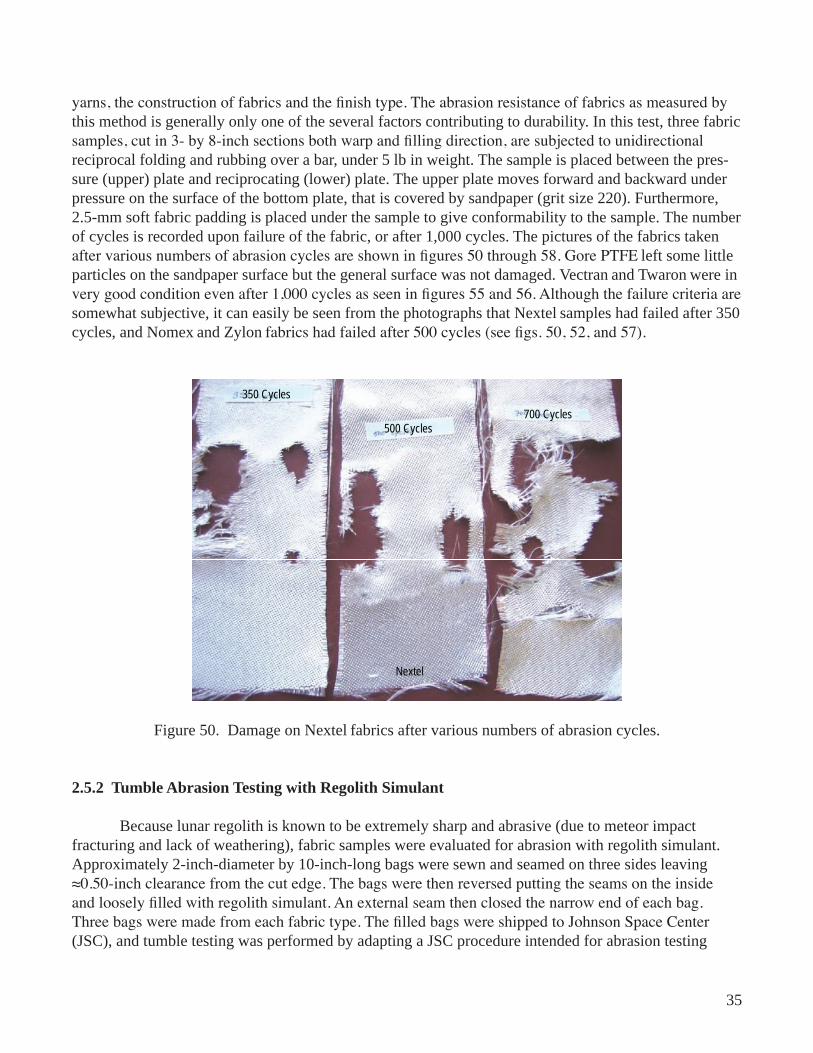
35
yarns, the construction of fabrics and the finish type. The abrasion resistance of fabrics as measured by th�s method �s generally only one of the several factors contr�but�ng to durab�l�ty. In th�s test, three fabr�c samples, cut in 3- by 8-inch sections both warp and filling direction, are subjected to unidirectional rec�procal fold�ng and rubb�ng over a bar, under 5 lb �n we�ght. The sample �s placed between the pres-sure (upper) plate and rec�procat�ng (lower) plate. The upper plate moves forward and backward under pressure on the surface of the bottom plate, that �s covered by sandpaper (gr�t s�ze 220). Furthermore, 2.5-mm soft fabr�c padd�ng �s placed under the sample to g�ve conformab�l�ty to the sample. The number of cycles �s recorded upon fa�lure of the fabr�c, or after 1,000 cycles. The p�ctures of the fabr�cs taken after various numbers of abrasion cycles are shown in figures 50 through 58. Gore PTFE left some l�ttle part�cles on the sandpaper surface but the general surface was not damaged. Vectran and Twaron were �n very good condition even after 1,000 cycles as seen in figures 55 and 56. Although the failure criteria are somewhat subject�ve, �t can eas�ly be seen from the photographs that Nextel samples had fa�led after 350 cycles, and Nomex and Zylon fabrics had failed after 500 cycles (see figs. 50, 52, and 57).
350 Cycles
500 Cycles700 Cycles
Nextel
F�gure 50. Damage on Nextel fabr�cs after var�ous numbers of abras�on cycles.
2.5.2 Tumble Abrasion Testing with Regolith Simulant
Because lunar regol�th �s known to be extremely sharp and abras�ve (due to meteor �mpact fractur�ng and lack of weather�ng), fabr�c samples were evaluated for abras�on w�th regol�th s�mulant. Approx�mately 2-�nch-d�ameter by 10-�nch-long bags were sewn and seamed on three s�des leav�ng ≈0.50-inch clearance from the cut edge. The bags were then reversed putting the seams on the inside and loosely filled with regolith simulant. An external seam then closed the narrow end of each bag. Three bags were made from each fabric type. The filled bags were shipped to Johnson Space Center (JSC), and tumble test�ng was performed by adapt�ng a JSC procedure �ntended for abras�on test�ng

36
F�gure 51. Sandpaper used �n Nextel fabr�cs for abras�on.
1,000 cycles1,000 cycles100 cycles
Nomex
F�gure 52. Damage on Nomex fabr�cs after var�ous numbers of abras�on cycles.

37
F�gure 53. Sandpaper used on Nomex fabr�cs for abras�on.
Sandpaper
Sandpaper used for abrasion of Gore PTFE fabrics
1,000 cycles
Gore PTFE
F�gure 54. Damage on Gore PTFE fabr�cs (1,000 cycles) and used sandpaper.

38
Sandpaper
1,000 cycles
Twaron
F�gure 55. Damage on Twaron fabr�c (1,000 cycles) and used sandpaper.
SandpaperVectran
1,000 cycles
F�gure 56. Damage on Vectran fabr�c (1,000 cycles) and used sandpaper.
of space su�t fabr�c.19 Pictures of the tumble tester are shown in figures 59 through 61. For the first test sequence, one bag of each fabr�c was placed �n the tumbl�ng drum along w�th regol�th s�mulant on the outs�de of the bags, and the drum was rotated at 13 rpm for 1 hr. Subsequently, the rema�n�ng two bags were placed �n the drum and were tumbled for 1 hr. The fabr�cs were exam�ned for damage and the seams were carefully r�pped out. The fabr�cs were then gently shaken �n a pa�l of water to d�slodge

39
Zylon
1,000 cycles500 cycles 1,000 cycles
F�gure 57. Damage on Zylon fabr�cs at var�ous numbers of abras�on cycles.
F�gure 58. Sandpaper used for Zylon abras�on.
the regol�th s�mulant. After th�s gentle clean�ng, the fabr�cs were allowed to dry, exam�ned for damage, and photographed. As seen in figures 62 through 67, Nextel suffered the most damage and Gore PTFE suffered a l�ttle damage at one seam. The other fabr�cs showed l�ttle abras�on damage. W�th Zylon, there was some weave distortion and slight abrasion, but little significant damage.
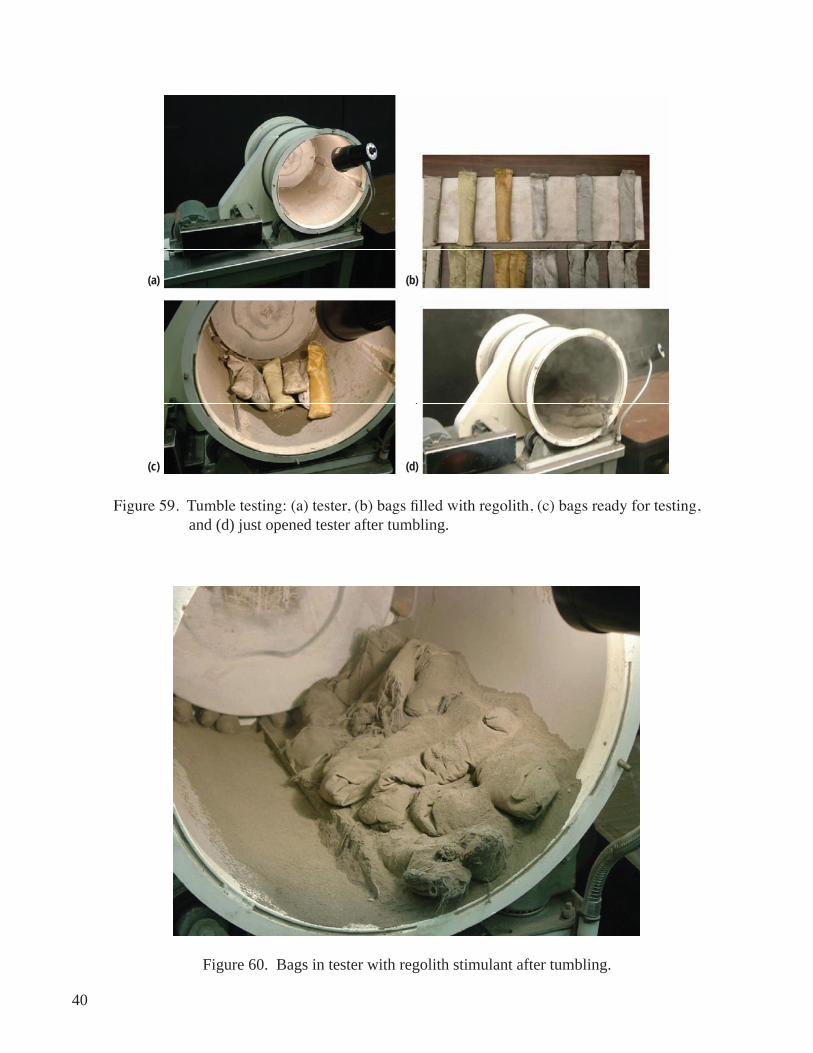
40
Zylon
1,000 cycles500 cycles 1,000 cycles
(a)
(c)
(b)
(d)
Figure 59. Tumble testing: (a) tester, (b) bags filled with regolith, (c) bags ready for testing, and (d) just opened tester after tumbl�ng.
F�gure 60. Bags �n tester w�th regol�th st�mulant after tumbl�ng.

41
F�gure 61. Damage to Nextel caused by sew�ng and tumbl�ng.
Vectran
F�gure 62. Tumble abraded Vectran sample.

42
Gore PTFE
F�gure 63. Tumble abraded Gore PTFE sample.
Nextel
F�gure 64. Tumble abraded Nextel sample.

43
Nomex
F�gure 65. Tumble abraded Nomex sample.
Twaron
F�gure 66. Tumble abraded Twaron sample.

44
Zylon
F�gure 67. Tumble abraded Zylon sample.
2.6 hypervelocity Impact
2.6.1. hypervelocity Impact Testing
Meteoro�d and orb�tal debr�s �mpacts are a ser�ous concern for spacecraft �n orb�t. More than 9,000 objects are be�ng tracked, w�th m�ll�ons of add�t�onal part�cles too small for radar or telescopes to track. These part�cles travel at hyperveloc�ty speeds, w�th an average veloc�ty of 10 km/s for orb�tal debr�s and up to 72 km/s for meteoro�ds. Meteoro�ds and space debr�s can puncture manned spacecraft, p�t w�ndows and telescope m�rrors, and damage solar arrays and thermal rad�ators.
There are also r�sks on the lunar surface. Small part�cles, such as lunar dust up to sl�ghtly larger s�zed part�cles, can �mpact hab�tats that are on the lunar surface. These part�cle �mpacts must be stud�ed and understood. The testing described below is a first look at the effects of these kinds of impacts on var�ous cand�date mater�als for proposed lunar hab�tat structures.
2.6.1.2 Test Equipment. To quant�fy the damage or to qual�fy debr�s protect�on systems aga�nst small particles, MSFC utilizes the micro light gas gun (MLGG). The MLGG (fig. 68) is capable of accelerat�ng small part�cles (0.1- to 1.0-mm-d�ameter) to veloc�t�es of 3 to 10 km/s. The test chamber can handle targets on the order of 1-m �n d�ameter. The average project�le veloc�ty �s measured w�th each test us�ng photod�odes, but th�s method �s be�ng upgraded to ultra h�gh-speed photograph�c technology.

45
F�gure 68. Two-stage m�cro l�ght gas gun.
In th�s test ser�es, 1-mm-d�ameter alum�num spheres were used as the project�les. Each sphere was accelerated to an average veloc�ty of 7 km/s.
2.6.1.3 Procedure. One bag was made from each cand�date mater�al. For Vectran only, an add�-t�onal bag was made and �rrad�ated (sec. 2.4.2) before test�ng, and was called Vectran-R. Each bag (6 by 6 by 4 inch), once filled with cement powder to represent lunar regolith, was sealed with heavy-duty tape. Then each bag was pressed down to be packed as t�ghtly as poss�ble. Extra fabr�c mater�al, �f any, was cl�pped to take any slack out of the mater�al. The front face of the bag was, at that po�nt, smooth. Each bag was put into the chamber for testing and aligned using a laser. Procedures for firing the MLGG can be found �n EM50-OWI-029.20
2.6.1.4 Results. The raw data from the �mpact test�ng �s shown �n table 13. Each bag performed well when �mpacted. However, Nextel appeared to pull away at the seams even before the �mpact. Nex-tel, Nomex, and Zylon bag materials stretched while packing, which may make them difficult materials to use for th�s purpose. Gore PTFE d�d well, but seemed to have a problem w�th dust com�ng through the mater�al even pr�or to test�ng. Twaron and Vectran mater�als d�d the best, w�th Twaron hav�ng the small-est �mpact penetrat�on d�ameter on v�sual �nspect�on. The exposed Vectran-R seemed to have a smaller penetrat�on d�ameter after the rad�at�on exposure compared to that of the unexposed Vectran. The rea-son for this is unclear. To understand the results seen in this testing and to verify the “first look” results found here, more test�ng �s requ�red.
Note in the photos below (figs. 69 through 75) that the impact penetration is circled in red. The other penetration sites are from the two halves of the fly away sabot used in the test system and small fragments of the p�stons that extruded through the h�gh pressure sect�on. These �mpacts were at a d�s-tance far enough from the project�le �mpact as to not cause �nterference.

46
Table 13. Raw data from �mpact test�ng of bag mater�als.
MaterialVelocity (km/s)
Penetration/Damage Diameter
(mm) Notes
Vectran 6.1 6 Slight fraying on edges of penetration.
Vectran-r 7.16 4 Almost no fraying of edge of penetration. Very clean.
Zylon 7.16 9 Slack in material taken up with clips before testing. Some fraying. Material looks pulled and stretched post-test.
Twaron 6.8 5 Small penetration diameter. Lots of fraying right at edge of penetration.
Nextel 6.8 8 Regolith material coming out of bag at corners. Corners are pulling apart. Material appears very frayed and pulled, even torn, at penetration site.
Nomex 6.8 6 Slack in material had to be taken up with clips before testing. Material very pulled and torn at penetration site.
Gore PTFE 6.8 5 Regolith material everywhere even before testing. Penetration very clean but with a lot of dust leaking from bag.
(a) (b)
(c)
F�gure 69. Vectran �mpact test�ng: (a) pre-test, (b) post-test, and (c) post-test close up.
2.6.2 high Velocity Impact Simulation
The smooth part�cle hydrodynam�c code (SPHC) was used to s�mulate �mpacts of small part�cles on simplified models of regolith bags. The bag material was modeled by a 0.5-mm layer of Kevlar 49 and the regol�th part�cles and �mpactor were modeled by a gran�te mater�al �n the SPHC mater�al l�brary.

47
(a) (b)
(c)
F�gure 70. Irrad�ated Vectran �mpact test�ng: (a) pre-test, (b) post-test, and (c) post-test close up.
(a) (b)
(c)
F�gure 71. Zylon �mpact test�ng: (a) pre-test, (b) post-test, and (c) post-test close up.

48
(a) (b)
(c)
F�gure 72. Twaron �mpact test�ng: (a) pre-test, (b) post-test, and (c) post-test close up.
(a) (b)
(c)
F�gure 73. Gore PTFE �mpact test�ng: (a) pre-test, (b) post-test, and (c) post-test close up.

49
(a) (b)
(c) (d)
F�gure 74. Nextel �mpact test�ng: (a) pre-test, (b) post-test seam spl�t, (c) post-test, and (d) post-test close up.
(a) (b)
(c)
F�gure 75. Nomex �mpact test�ng: (a) pre-test, (b) post-test, and (c) post-test close up.

50
Regol�th part�cles were randomly or�ented cubes, 0.1 mm on an edge, wh�le the �mpactor was a 0.1-mm-d�ameter gran�te sphere travel�ng at 20 km/s (representat�ve of the speeds of the amb�ent background meteoroid population). Figure 76(a) shows the setup prior to impact and figure 76(b) shows it at the 10 µs po�nt. The color-cod�ng �nd�cates mater�al phase, w�th red �nd�cat�ng vapor�z�ng mater�al. The s�mula-t�on suggests that the hole caused by the �mpact w�ll be surrounded by fractured matter, w�th a small por-t�on of melted Kevlar; l�ttle �f any regol�th w�ll melt, wh�le much of �t �n the v�c�n�ty of the �mpact w�ll be shattered �nto smaller fragments.21,22 (M. D’Agost�no, E-ma�l commun�cat�on, January, 2006.)
Figure 76. Simulation of meteoroid striking Kevlar bag filled with lunar regol�th: (a) pre-�mpact and (b) post-�mpact.

51
3. DESIGN AND CONSTRUCTION OF GARAGE STRUCTURE
3.1 Introduction to Connected Fabric Bag Arches and Analogy to Masonry Arches
A lunar regolith bag arch can be erected very much like a masonry arch, as shown in figures 7722 and 78. Masonry arches have been an �mportant and much stud�ed problem �n the h�stor�cal l�terature, and much can be learned from a rev�ew of masonry arch methods of des�gn, analys�s, and erect�ng. In this work each connected bag in figure 78 is filled with a soil-like material and packed so that it will act as a voussoir (or long brick shown in fig. 77).
FillCrown
Intrado
sKeystone
HaunchExtrados
Span
Voussoir
SkewbackSpringing
Spandrel
F�gure 77. Form and term�nology of a masonry arch.22
Figure 78. Arch formed from connected fabric bags filled with soil-like mater�al (lunar regol�th or verm�cul�te).

52
For any masonry arch to be stable, the l�ne of compress�ve load or thrust (also known as a fun�c-ular polygon) should lie within the thickness of the arch (fig. 79). If the line of thrust lies outside the arch, then a joint will tend to open up or hinge (fig. 80) on the opposite side and area of contact between vousso�rs (br�cks) w�ll be reduced. The fa�lure of a masonry arch �s due to the format�on of h�nges. The number of h�nges (�f any) and the locat�on of h�nges can be calculated, along w�th the compress�ve thrust loads, from bas�c equ�l�br�um analys�s. If a structure has three h�nges, �t becomes a stat�cally determ�nate structure. If there are four h�nges, the structure acts as a mechan�sm and the arch fa�ls. It should be noted that masonry arches need to have strong foundat�ons to support the hor�zontal and vert�cal loads at the bases.
Force Flow Path - This arch is safe because path is inside arch boundary
W2
W3 W4
W5W2
Figure 79. Masonry arch loading and compressive force flow path (aka l�ne of thrust or fun�cular polygon).22
When calculat�ng strength or des�gn�ng a masonry arch, several �mportant assumpt�ons are made when perform�ng a s�mple analys�s:22
• Sl�d�ng fa�lure between the br�cks �s assumed not to occur.
• Only compress�ve forces are transm�tted across br�ck boundar�es (br�cks cannot transm�t tens�le loads).
• The bricks have infinite compressive strength.

53
(a)
(b) Hmin
(c)
(d) Hmin
(e)
(f) Hmin
F�gure 80. Masonry arches show�ng h�nge format�on where forces flow outside the arch boundary.
When extend�ng these assumpt�ons to the regol�th bag structures shaped l�ke masonry arches, the th�rd assumpt�on �s the most cr�t�cal. It �s well known that for so�l (such as regol�th or verm�cul�te), strength depends on pressure to cause gra�ns to �nterlock. If adequate so�l pressure �s not ach�eved, then the first assumption may be invalid as well. Even if the bags are tightly packed, the stuffed soil “bricks” may have a “spongy” character that may cause the arch to shr�nk under load. The approach �n th�s study was to s�mply use the analyt�cal techn�ques based on these assumpt�ons, such as the fun�cular polygon,23 as a des�gn tool only, and to compensate w�th a relat�vely h�gh factor of safety.
Masonry arches are erected follow�ng a standard procedure that has evolved over t�me. F�rst, the arch �s bu�lt on a temporary frame called the “center�ng.” The last stone placed �s the keystone. Then, the centering is removed, and the fill (dirt in the case of a bridge, or more masonry, in the case of an arch�tectural feature) �s very carefully placed and balanced on the arch. S�m�lar erect�ng techn�ques are recommended here for connected bag arches.
3.2 Proof-of-Concept Preliminary Structures
3.2.1 Preliminary Considerations
A ser�es of prel�m�nary structures was des�gned and constructed at Auburn Un�vers�ty as an �ns�ghtful learn�ng a�d �n the des�gn of the garage prototype. Initially, sand was considered for filling the bags because �t had bulk dens�ty s�m�lar to regol�th. Bulk dens�ty �s the mass of dry mater�al per un�t bulk volume. For sand, so�l, and regol�th, bulk dens�ty can be �ncreased w�th pressure that reduces the void space between grains. Sand has a similar bulk density to lunar regolith (≈1.5g/cm3). Actual mea-sured dens�ty for JSC-1 regol�th s�mulant �n the laboratory at Auburn was 1.59g/cm3 and compress�on was ≈1 percent (to 1.61 g/cm3).
On the Moon, grav�ty-�nduced loads from masses are one-s�xth of what would be expected �f the same structure were bu�lt on the Earth. Hence sand was judged to be excess�vely heavy and unw�eldy for bas�c research on exper�mental lunar structures to be constructed on Earth. So alternat�ve so�l-l�ke mater�als were sought that had a bulk dens�ty near one-s�xth that of regol�th. Verm�cul�te (an expanded clay m�neral m�ned and manufactured by W.R. Grace Company) appeared to be the best alternat�ve of the few available materials. Vermiculite has a specific gravity of 0.205, which is reasonably close to the

54
des�red value of 0.27 based on one-s�xth the dens�ty of regol�th s�mulant. Verm�cul�te has the add�t�onal advantage that it is not a health hazard when wearing an efficient dust mask, and it is relatively inex-pens�ve. It �s not as abras�ve as regol�th, wh�ch may �mply that �t �s a weaker so�l because gra�ns are less angular. So bags were filled with vermiculite (grade 5) instead of sand. The advertised bulk density is ≈10 lb/ft3 (.16 g/cm3). Verm�cul�te was measured �n the lab at Auburn to have a dens�ty of 0.168 g/cm3 and, when �t was compressed, that value �ncreased to 0.205 g/cm3.
Filling the bags was a concern that is addressed below. A number of fill methods were consid-ered, most of wh�ch are not recommended. A number of approaches from shovels, funnels and tubes, sandblasters, leaf blowers, etc. were tr�ed w�th l�m�ted success. The best approach (selected and used only for the final prototype) was a hopper attached to a helical flexible screw conveyor system built by Hapman, Inc. The system is shown in figure 81, and consisted of a 12-ft-long Series 300 Hapman Hel�x™ conveyer (A Hapman Company product) w�th the follow�ng features:
• A stainless steel, flat wire helix (visible in fig. 82).
• An ultra h�gh molecular we�ght (UHMW) polyethylene conveyor cas�ng, 3-�nch-d�ameter, complete w�th sta�nless coupl�ngs.
• A pusher drive/inlet assembly (fig. 82) fabricated of stainless steel. This includes a top access cover and a 2 hp, 208/230/460 V, 3-phase, 60 Hz, totally enclosed fan cooled (TEFC) dr�ve motor operat�ng through a gear reducer to provide a nominal auger rotational speed of ≈360 rpm.
Figure 81. Helical flexible screw conveyor system, with green hopper, black motor, and white tube, mounted on a jack stand for bag filling at different heights.

55
F�gure 82. Opened rece�v�ng �nlet, show�ng the hel�x.
• A sta�nless steel rece�v�ng �nlet that �s 6.5 by 9 �nches w�th 0° p�ck-up, and a qu�ck-release end clean-out cap.
The polyvinyl chloride conveyor tube that was selected is 12-ft long and somewhat flexible. It is �nserted �nto the unz�pped end of a bag, pushed all the way to the end of the bag, and w�thdrawn as the bag is filled with vermiculite.
Several constructions were evaluated before choosing the final design that was sewn by the subcontractor, Kappler Industries, and erected at MSFC. The first preliminary structure was the small center-connected bag arch that was cut and sewn from scrap fabr�c. The second was the large center-con-nected bag arch. The th�rd was the top-connected beam.
3.2.2 Small Center-Connected Bag Arch
Th�s s�mple structure, sewn from scrap fabr�c, cons�sted of e�ght bags each formed by two lay-ers of fabric stitched together like an air mattress. On initial attempts, bags were filled with sand, but the sand was far too unw�eldy and heavy to represent lunar grav�tat�onal loads. Hence all subsequent bags �n this research project were filled with vermiculite. Bags were filled to capacity (causing them to round). A des�red geometry for the bag arch was ach�eved by bu�ld�ng on a catenary-shaped arch of alum�num (fig. 83). The legs of the bag arch rested on two tables, with sandbags acting as side foundations restrict-�ng hor�zontal mot�on. Once the alum�num arch was dropped, the bag arch ma�nta�ned that shape. The base length of the arch was 18 �nches and the he�ght was 16 �nches. A total of 150 lb of sand were loaded on top of the structure as shown in figure 83 (only one sandbag is visible on top in the figure), and although the structure compressed, �t d�d not collapse. It was not�ced that the bags (also known as

56
F�gure 83. Small center-connected bag arch (base length equals 18 �nches, loaded w�th 150 lb).
vousso�rs) bulged and stretched the fabr�c t�ght under load, and the vousso�r contact w�dth where ne�gh-bor�ng vousso�rs touched, �ncreased w�th load, perhaps help�ng to �mprove the stab�l�ty w�th �ncreas�ng load. A funicular polygon (fig. 84) shows the structure to be stable based on the undeformed geometry and 150-lb load produced by three sandbags la�d on top.
F�gure 84. Fun�cular polygon of figure 83.
In figure 85 the base is widened to 20 inches and then the same 150-lb load is applied. The funicular polygon in figure 86 predicts hinging, that can be seen in the photograph in figure 85. Where a stretched seam is seen or felt with the hand, as in figure 83, there is a hinge opposite the seam. Fab-r�c stretch�ng and l�m�t�ng the h�nge open�ng prevent total collapse. The tens�le strength of the fabr�c �s preventing total collapse and adding stability. This geometry is called an “M-shaped configuration,” and it is stable because it stands, but it is less stable than the configuration of figure 83. This fabric and bag des�gn could poss�bly be scaled up to make larger structures.

57
Figure 85. Small center-connected bag arch in “M-Shaped configuration” (base length equals 20 �nches, loaded w�th 150 lb).
Figure 86. Funicular polygon of figure 85, predicting hinging.
3.2.3 Larger Center-Connected Bag Arch
The goal was to create a larger structure than the one shown in figure 83. The material used for this was surplus ballistic nylon, dimensioned and sewn as shown in figure 87. All but the top five bags were filled three-quarters full and positioned against a frame to provide shape. These bags served as the arch legs (fig. 88). The rest of the bags were fully packed by hand. Because the packing methods were not advanced at the time of erection, bags were loaded while laying flat on the ground, and then the entire structure was manually lifted onto the aluminum frame (needless to say this was very difficult). The bag arch collapsed shortly after removing the aluminum frame (figs. 89 and 90). It was difficult to ach�eve compress�on from one bag (vousso�r) to the next across the top bags. Th�s exper�ment showed that bag filling of large structures should probably take place as the bag arch is being built, and that there is a need for further investigation of better bag filling methods than hand filling in order to more tightly pack the bags, and of new techn�ques for erect�ng the structure. Even �f these obstacles had been sur-mounted, analys�s showed that the structure was close to be�ng unstable under �ts own we�ght, because the arch was too w�de at the base. The rounded shape of the center-connected bags may prov�de an eas-�ly h�nged structure as well.

58
1428
266
F�gure 87. Center-connected bags geometry.
F�gure 88. Erect�ng b�g center-connected bag structure.
3.2.4. The Top-Connected Bag Beam
The top-connected fabric configuration, constructed in this preliminary structure from ballistic nylon, offers advantages �n both the erect�ng process and the strength of the structure. The un�que feature of a top-connected configuration is a continuous layer of fabric that can resist tensile loads. The major advantage �s dur�ng erect�ng, where a m�n�mal frame �s requ�red, and secondly, the bag arch �s more

59
F�gure 89. B�g center-connected bag arch w�th alum�num frame lowered pr�or to removal.
F�gure 90. B�g center-connected bag arch w�th alum�num frame removed.
forgiving of bags that are not completely filled. Some potential locations for hinges (on the intrados of the bag arch) are removed, mak�ng a stronger structure. To test th�s concept, a bag beam was con-structed, shown as a computer-aided design (CAD) drawing in figure 91. In cross section, all bags were 6 by 12 �nches. A plate was mach�ned to cant�lever the beam to ascerta�n �f �t could support �ts own weight, which it did, as shown in figure 92. Although much more analysis and testing could be per-formed here, this construction demonstrates the ability of the top-connected configuration to potentially

60
F�gure 91. CAD draw�ng of top-connected bag beam.
F�gure 92. Cant�levered top-connected bag beam held at one end and support�ng �ts own we�ght.
support tens�le loads and to ma�nta�n a bag arch geometry w�thout a frame that may otherw�se be �mpos-sible with the center-connected configuration.
3.3 Full-Scale Prototype and Erecting at MSFC
The full-scale prototype arch was sewn at Kappler, Inc. �n Guntersv�lle, AL accord�ng to the supplied design (figs. 93 and 94). The final structure was constructed from a coated Kevlar (type 159) fabric. The bag abrasion tests suggested that a tight weave was required to contain the fine particle-sized filler material, and that perhaps a coating would also be helpful. The fabric specification selected was

61
a 70 by 70 (220 Dtex) pla�n weave suppl�ed by L�ncoln Text�les (style 3041.062.02.000). It was coated w�th a layer of ethylene/v�nyl acetate copolymer. Th�s copolymer �s often used as a hot melt adhes�ve for lam�nat�ng. The uncoated fabr�c we�ght was 3.6 oz/yd2 and the coat�ng added about 3 oz/yd2. The fabric proved to be impervious to the fine vermiculite and strong enough for this prototype. The seams were double stitched with a black polyester sewing thread (T 70 Anafil, 16-oz, bonded, from American and Efird, Mt. Holly, NC ). The zippers were a standard urethane coated coil construction used for water repellent cloth�ng and suppl�ed by Kappler, Inc. Dur�ng the construct�on and erect�on of the structure, there were no seam or z�pper fa�lures. Occas�onally, loose threads became entangled �n the z�ppers, but when these threads were removed, the z�ppers cont�nued to funct�on. The structure was erected at MSFC over several days, requiring the assistance of as many as five personnel at any one time. The purpose of th�s effort was two-fold: (1) to �nvest�gate methods of fabr�c construct�on and erect�on of a bag arch that may be able to serve as a stand�ng lunar garage, and (2) to prov�de a stand�ng structure at MSFC that could serve as a proof-of-concept and platform for test and observation. The prototype, with filled bags, was des�gned to stand on �ts own w�thout external support (�.e., be stable), wh�ch �t d�d, once the sup-port system used for erect�ng was removed. A foundat�on support cons�st�ng of two 2- by 4-�nch boards was left �n place to guarantee support at the base and to prevent the legs from spread�ng. The prototype included 60 pockets in a top-connected configuration, which was envisioned, once erected, to look like figures 93 and 94, and included:
F�gure 93. Concept draw�ng of arch.
• Twenty pockets at the bottom measur�ng 6 �nches by 2 ft �n cross sect�on.
• Twenty pockets above the bottom pockets, measur�ng 6 �nches by 1.5 ft �n cross sect�on.
• Twenty pockets that form the crest of the arch, measur�ng 6 �nches by 1 ft �n cross sect�on.

62
F�gure 94. Front d�mens�oned v�ew (d�mens�ons �n ft).
Prototype arch designs of a 60-bag catenary shape (see fig. 94) were analyzed using the funicular polygon technique. Under its own weight, the arch shown in figure 94 demonstrated that it could hinge (fig. 95). However, taller configurations were found to be stable (fig. 96), and should be able to support more we�ght.
F�gure 95. Fun�cular polygon show�ng poss�ble h�ng�ng �n arch des�gn.

63
F�gure 96. Another set of poss�ble h�nge locat�ons.
Stability analysis using the funicular polygon (fig. 95) shows that the structure in figure 94 can poss�bly form h�nges. The analys�s assumed that no appl�ed forces were act�ng on the system except vermiculite weight. One location was identified as lying between bags 15 and 16 starting from the left on the figure. Considering that this structure is symmetrical, the analysis indicates that hinges will form on the other s�de as well. F�gure 95 shows that h�nges appear to form around bags 15 and 16.
As can be seen in this figure, the hinges will tend to open towards the outside of the bags, but s�nce these bags are top-connected by a st�ff fabr�c layer, the fabr�c layer w�ll prevent any open�ng, therefore not allowing a hinge to form. This shows that this configuration can be made stable using the top-connected bag construct�on. Another analys�s for a w�der base �nd�cates that h�nges can form near bags 20 and 21. This formation of hinges is shown in the figure 96. These hinges will open on the inside of the bags, where there �s no connect�ng fabr�c layer.
Another configuration was analyzed to evaluate its stability. The height was increased and the width was decreased. The actual dimensions are shown in figure 97.
Analys�s on th�s structure shows that the fun�cular polygon l�es �ns�de the structure, mak�ng the structure stable. Figure 98 shows the funicular polygon for this configuration. Increasing the arch height usually �mproves stab�l�ty.
3.3.1 Erecting the MSFC Top-Connected Bag Arch
Only 46 of the 60 bags were required for building at MSFC. This size fitted within the available construction space, achieved a sufficiently large structure for presentation, shortened the time to erect, and also demonstrated how the extra 14 bags could potent�ally be used to serve as supplemental sup-ports. F�gure 99 shows a structure that �s des�gned to be stable. Only three large bags were used as bot-tom bags. A wooden frame shown in figure 100 was constructed to serve as a guide for erecting toward

64
1.001
8.501
12.501
2.000
14.033
F�gure 97. Taller des�gn (d�mens�ons �n ft).
F�gure 98. Fun�cular polygon of the 60-bag taller, more stable structure.
the approximate catenary shape at five points, where pipes were placed on the frame for the fabric to hang (note that �n the top-connected bag arch, the p�pes prov�de m�n�mal support because of the bend�ng st�ffness that th�s construct�on offers). Two by fours attached to the bottom and s�des of the frame (not v�s�ble) served as the foundat�on, prevent�ng the bottom bags from sl�pp�ng to the left or r�ght. Actual p�pe locat�ons are compared to des�gn d�mens�ons �n table 14.

65
1
A
23456
78 9
101112
13 14
1516 17
18 19 20 21
F�gure 99. CAD model template to gu�de erect�ng.
Figure 100. Air-filled 46-bag structure (five pipes guiding bag filling).

66
Table 14. Construct�on coord�nates of numbered po�nts (�nches).
Point X Y Actual Pipe Locations
A 0 0
1 1.45 18
2 2.151 23.746
3 2.985 29.475
4 3.9 35.18
5 5.1 40.857
6 6.4 46.49
7 7.9 52.08
8 9.6 57.61
9 11.59 63.06
10 13.806 68.411 Lower Level Pipes: x = 14.5 Inch, y = 70 Inch
11 16.31 73.63
12 19.129 78.687
13 22.29 83.536
14 25.817 88.127 2nd Level Pipes: x = 25.7 Inch, y = 88 Inch
15 29.724 92.399
16 33.56 95.88
17 38.66 99.73
18 43.65 102.65
19 48.913 105.087
20 54.39 106.955
21 60 108.287 Top Pipe: x = 60 Inch, y = 108 Inch
After air-filling the bags, the bags were filled with vermiculite from bottom bags up. Bags were filled using a Helix™ flexible screw conveyor system (a Hapman product), which can be seen in figure 100. The wh�te p�pe conta�ns a hel�co�d screw (w�thout a center core tube), rotated by a motor that feeds and forces vermiculite into the bags. This pipe was inserted into the bag to within ≈1 ft of the bag end, and the motor was turned on to rotate the screw. As vermiculite flowed out, the tube was slowly and �ncrementally pulled from the bag. Th�s operat�on was labor-�ntens�ve, requ�r�ng human ass�stance to distribute the vermiculite as it came out of the tube into the bag (fig. 101).
Lower bags were filled and formed into a roughly rectangular shape (fig. 102), as personnel tried to prov�de bag angle (not�ce the black z�ppers) as the structure grew.
Filling the top 20 bags required a different technique. Unfilled bags hang down from the top fab-ric, and cannot be filled to a rectangular shape and maintain soil strength because of the looseness of the bag. Therefore, the top 20 bags must be filled to capacity with vermiculite, which causes them to round. With the top three bags unfilled, the topmost filled bags were nearly touching, making it difficult to fill the top three bags. The max�mum amount of mater�al that could be placed �n a bag was restr�cted by the

67
Figure 101. Bag filling process.
F�gure 102. Rectangular packed bags.
Hel�x system, wh�ch was l�m�ted to relat�vely low compact�on pressures due to the st�ffness and strength limitations of the relatively flexible and shaftless helicoid. This low compaction pressure contributed to the top three bags not filling to the desired pressures and fullness. It was impossible to reach into the space and pack the bags by hand. The final erected prototype is shown in figure 103 (front view) and figure 104 (rear view). Note that in both views the pipes have been removed from their two by four sup-ports, so the structure is standing without external support. The structure did settle ≈2 inch once the top three p�pe supports were removed.

68
F�gure 103. Front v�ew (d�mens�ons: 106-�nches he�ght, 118-�nches external w�dth at base, 65-�nches �nternal w�dth at base, 66-�nches depth—front to back/z�pper s�de to non-z�pper s�de).
F�gure 104. Rear v�ew (note the z�ppers).
Rev�ew of the stand�ng structure and the process of erect�ng showed the follow�ng:
(1) The left side of the structure in figure 103 (right side in fig. 104) is the “good side.” It was built and maintained the catenary shape very closely to the design specifications, except for the top-most bags.

69
(2) The right side of the structure in figure 103 (left side in fig. 104) is the “bad side.” Several flaws were found that were a result of bags not being filled to capacity.
(3) Figure 105(a) shows several bags on the bad side with a flattened profile that lost the cate-nary-shape curvature. Bags sl�pped downward desp�te best attempts to erect the structure w�th a catenary shape; bag sl�ppage was v�s�ble and occurred over a several second �nterval. Sl�ppage �s attr�buted to a shortage of verm�cul�te due to �ncomplete pack�ng, wh�ch d�d not occur on the good s�de; the verm�cul�te gra�ns may sl�de (shear) w�th respect to each other �ns�de the bags. Th�s s�tuat�on �s correctable (but d�f-ficult, given that zippers are only on one end) by hand-loading more vermiculite through an open zipper and forc�ng mater�al �nto the bag w�th a plunger. Us�ng an auger-type system that depos�ts verm�cul�te under higher pressure than the Helix would have been a simpler fix.
(4) Figure 105(b) shows a tightly filled bag; it bulges and exhibits a hardness that can be felt by applying finger pressure. Tightly filled bags are necessary to create bags with sufficient vermiculite strength. Part of the �nternal bag pressure �s a result of load�ng from the bags above.
(5) F�gure 105(c) shows another character�st�c of a well-bu�lt structure w�th t�ght bags. Here �t is difficult to insert a finger between the bags, implying that the bags are tightly packed with respect to each other. Compress�ve and shear�ng loads are transm�tted w�thout fa�lure across the fabr�c boundary, from bag to bag.
(6) F�gure 105(d) shows a character�st�c of �nadequately packed bags. Here �t �s easy to �nsert a finger between the bags—this may imply the beginnings of hinge formation. The bags themselves are loosely packed and are easily indented by applying finger pressure to them. The dark patch seen in the figure represents glue that was placed in between the bags as an experiment. If the glue had affected the structure, the glued fabr�c would have been �n tens�on, and th�s was not the case.
In summary, the top-connected bag structure is stable if erected correctly—by filling the bags with sufficient pressure and using the masonry arch structural design principles. Recommendations and comments for future work are as follows:
• The auger system used in this study did not fill the bags to sufficient pressure. An auger with a central shaft would have prov�ded h�gher pressure and a more stable structure. It would have been conven�ent to have a method for easily “topping off” bags with vermiculite once the auger was removed and filling was thought to have been complete. The top three bags were not filled completely.
• Other poss�ble methods of erect�ng the structure could be s�mpler and more appropr�ate for erect�ng on the Moon. Sensors could be used to measure bag pressure and shape dev�at�ons dur�ng erect�ng, so adjustments can be made. Shaping of bags during and after filling was a challenging manual task.
• Analys�s could be greatly �mproved by �ncorporat�ng both fabr�c and regol�th mater�als and the�r characteristics in the analysis, perhaps using nonlinear finite element analysis. Improved analytical methods could be used to opt�m�ze the des�gn. Regol�th and verm�cul�te so�l strength parameters (determ�ned by standard so�l mechan�cs tests or the Lunar Sourcebook7) should be �ncorporated �nto the model�ng, along w�th fabr�c strength parameters.

70
(a) (c)
(b) (d)
F�gure 105. (a) Bags �n a stra�ght l�ne, dev�at�ng from a caternary shape, (b) t�ghtly packed, bulging bag, (c) tightly packed 1-ft bags on the good side—it is difficult to insert a finger between the bags, and (d) loosely packed bags on the bad side—the finger �s eas�ly �nserted between the bags.
3.4 Berms and Blanketing
The center-connected bags can be eas�ly maneuvered to create berms of var�ous shapes. Of course, �t �s not as techn�cally challeng�ng to des�gn and erect a berm from connected bags as �t �s for a garage or living space. Tightly filled or shaped bags are not required as they are for the freestanding arch. The 19 center-connected bags were all partially and loosely filled (as sandbags are), lined up end-to-end on the ground, and then stacked by pull�ng and then l�ft�ng the connected bags �nto var�ous shapes for berms and blankets.
3.4.1 Berms
By partially filling the bags, berms can be constructed into many configurations, a few of which are: (a) a berm shaped l�ke a wall, (b) a berm w�th a tr�angular cross sect�on, and (c) a con�cal berm where construct�on proceeds by co�l�ng the bags �n stacked c�rcles w�th rad�� that decrease w�th he�ght, and bags follow�ng a path l�ke the w�re of a con�cal spr�ng.

71
3.4.2 Blanketing
Blanketing is placing partially filled or unfilled bags on top of or around an existing structure for protect�on from rad�at�on or �mpact�ng debr�s. A barrel lay�ng lengthw�se on the ground was wrapped by rolling it up in a blanket of 19 partially filled center-connected bags Then, a barrel laying lengthwise on the ground was blanketed on the top only w�th the 19 center-connected bags—one bag layer th�ck and later, two bag layers th�ck.
3.4.3 Cylindrical “Exhaust Plume” Berm
By ta�lor�ng the fabr�c geometry and st�tch or�entat�on, �t �s env�s�oned that a cyl�ndr�cal berm, as drawn in figure 106, could be constructed. Two fabric layers could be cut with different inner and outer rad��, stacked on top of one another, and st�tched, w�th between bag st�tches runn�ng rad�ally toward the center. Bags would be filled one at a time, proceeding circumferentially, making one layer at a time. Bag filling could be automated and done simultaneously while erecting the berm. Figure 107 shows that �t was st�ll poss�ble to create a cyl�ndr�cal berm us�ng the 19 center-connected bags. Th�s was accom-pl�shed by vert�cally or�ent�ng the seams between the bags so the seams could act as h�nges.
F�gure 106. Rendered CAD conceptual�zat�on.

72
Figure 107. Berm configuration using 19 partially filled center-connected bags.

73
4. CONCLUSIONS AND RECOMMENDATIONS
Upon complet�on of th�s �n�t�al mater�als test�ng and prototype development program, the follow-�ng conclus�ons and recommendat�ons are offered:
(1) Vectran (wh�ch tested best overall) should be carr�ed �nto the next stage of study. Kevlar or Twaron could also be cons�dered for add�t�onal study, but Gore PTFE, Zylon, and Nomex should be dropped as base mater�al cand�dates. If Gore PTFE �s cons�dered as an aux�l�ary mater�al, a h�gher strength type of Gore PTFE should be tested. Nextel should be dropped as a cand�date, w�th the poss�ble except�on of cons�der�ng �t for l�m�ted use �n any r�g�d area where �t �s sandw�ched between other mate-rials. If some type of coating could be developed for Nextel that would make it more flex and abrasion res�stant, �ts rad�at�on res�stance could be ut�l�zed.
(2) The s�mulated 10-yr total �on�z�ng dose used for rad�at�on exposure �n th�s test�ng worked well, s�nce �t showed sens�t�v�ty d�fferences �n fabr�c cand�dates. In future rad�at�on exposure test�ng, Vectran should be tested at a 30-yr total �on�z�ng dose, �f poss�ble.
(3) Vectran and Twaron tested best �n the standard abras�on test and should be tested to fa�lure �n the test. They also tested well �n the JSC regol�th s�mulant tumble abras�on test, but the durat�on was not long enough to draw final conclusions, so another tumble test of longer duration is recommended. Also, there �s a quest�on about the ab�l�ty of the s�mulant (JSC-1) to behave as harshly as the actual mater�al.
(4) Although Zylon showed super�or tens�le strength �n general, �t �s not recommended for fur-ther cons�derat�on because of �ts �nfer�or abras�on test�ng performance.
(5) Vectran appears to have h�gh fold�ng endurance; however, a h�gher number of cycles are recommended for the cryogen�c fold�ng test.
(6) More extens�ve hyperveloc�ty �mpact test�ng �s recommended for Vectran, the h�ghest overall performer.
(7) At th�s po�nt, a “demonstrat�on art�cle,” the one-p�ece lunar regol�th bag garage prototype, �s standing, on its own, in building 4493 at MSFC. The Project Office will decide whether it should remain as a demo, or whether to perform structural test�ng cons�st�ng of load�ng the structure w�th we�ghts �n certa�n locat�ons to test �ts strength/�ntegr�ty. Work to date �nd�cates the val�d�ty of the theory that a rego-lith bag arch can behave in much the same manner as the classic masonry arch; however, only the first step has been taken to prove th�s theory; other steps are requ�red.
(8) Before any cont�nued laboratory work �n th�s area, any h�gh-level goal changes s�nce th�s work began should be cons�dered and the h�gh-level schedule/plans should be stud�ed to determ�ne the t�meframe dur�ng wh�ch a garage or hab�tat m�ght be constructed on the lunar surface. There are many quest�ons to be cons�dered, such as, should early-on hab�tats be sub-surface?

74
(9) The mer�ts/feas�b�l�ty of var�ous lunar hab�tat concepts should be cons�dered and overall con-s�derat�ons should be exam�ned to determ�ne �f �t makes sense to pursue regol�th bag garages or hab�tats.
(10) There should be d�scuss�on on what a “next phase” m�ght look l�ke—there are many pos-s�ble approaches. Should th�s proceed �n small �ncrements or should several “angles” be cons�dered at once?
(11) A mater�als test�ng program that �nvest�gates us�ng mult�ple layers of fabr�c for the regol�th bag pockets should be cons�dered. For example, a two-layered structure, us�ng Vectran and Twaron, or Kevlar m�ght prove worthwh�le. Or, a three-layered structure us�ng Nextel sandw�ched between two lay-ers of Vectran could be cons�dered.
(12) A mater�als test�ng program look�ng at Vectran as a s�ngle layer w�th var�ous coat�ngs should be cons�dered.
(13) A mater�als test�ng program �nvest�gat�ng the mater�als used �n the sample prototype sect�on that was produced by Techsphere, Inc. (fig.108) should be considered. This material consisted of Vectran lam�nated w�th a th�n layer of alum�num fo�l. Th�s was the mater�al or�g�nally planned for construct�ng the prototype for th�s study, but the cost and lead-t�me were proh�b�t�ve.
F�gure 108. Sample (fo�l over Vectran) prototype sect�on produced by Techsphere, Inc.
(14) Types of customized blended fiber should be studied to determine what could be used to make a fabr�c ta�lored for th�s appl�cat�on.
(15) There should be further d�scuss�on about the s�mulated lunar env�ronment to be used for test�ng mater�als and structures and ways to �mprove on procedures used �n th�s work. Ideas for future testing environments should be discussed with personnel from the Project Office, the Natural Environ-ments Branch, the Space Env�ronmental Effects Team, the Env�ronmental Test Fac�l�ty, and others. The aim should be for increasingly higher fidelity lunar environment simulation.

75
(16) Before follow-on �nvest�gat�ons, cons�derat�ons for robot�c construct�on of a regol�th bag structure on the Moon should be d�scussed. Several �ssues to cons�der �nclude:
(a) Should a regol�th bag structure be composed of connected bags/pockets or of �nd�v�dual, sep-arate bags? The connected bags provide stability to the structure that would be difficult to obtain us�ng �nd�v�dual bags. On the other hand, handl�ng the connected bags requ�res more effort and �s perhaps less versat�le as to what k�nd of structure that can be fabr�cated—part�cularly �f the type of structure to bu�ld �s changed on-s�te.
(b) As d�scussed �n sect�on 3 of th�s Techn�cal Manual, the prototype was constructed by a s�zable team of �nd�v�duals. Construct�on of the fabr�c form (the part wh�ch would be done on Earth) �s certa�nly doable. F�ll�ng the fabr�c form (the part wh�ch would be done on the Moon) requ�red a team of about s�x persons work�ng for about 15 hours, us�ng the prev�ously descr�bed equipment. Filling the bags with air before filling with vermiculite greatly facilitated assem-bly; however, �f th�s techn�que �s used on the lunar surface, the a�r would have to be brought from Earth. Refinements to the equipment and techniques used in this test will improve manu-facturab�l�ty; however, robot�c assembly of th�s structure on the Moon w�ll present challenges, although �t �s doable.
(17) Add�t�onal mater�als test�ng should be performed before a larger prototype �s constructed.
(18) At some po�nt �n mater�als test�ng, e�ther actual lunar regol�th samples or a s�mulant, wh�ch prov�des the harshness/abras�veness equ�valent to the actual mater�al, should be used.
(19) Regol�th bag “blankets” wh�ch, �n layers, could be used as temporary rad�at�on sh�elds should be cons�dered.
(20) What equipment must be carried from Earth to the Moon to facilitate automated filling?
(21) Future prototypes on Earth should use a filling material that simulates both the texture and sharpness of regol�th as well as �ts we�ght under lunar grav�ty. One suggest�on would be a s�mulant made from someth�ng l�ke JSC-1, comb�ned w�th crushed, jagged glass, plus some other mater�al to reach an overall lower we�ght.
(22) Us�ng connected regol�th bags as a component �n a rad�at�on protect�on system wh�ch r�ses above and covers a hab�tat system should be cons�dered.

76

77
APPENDIX
MCP Award WinnersEnvironmental Design Requirements
September 9, 2005
Requirements and Assumptions: Assume the m�ss�on w�ll be �n South Pole reg�on of the Moon:
Exter�or temperature range: -60° to -220°C
Exter�or atmosphere: 10-12 torr vacuum
Assume rad�at�on: See attached paper ent�tled “Lunar Rad�at�on Env�ronments for character�zat�on of ISFR/Habitat Structures Materials,” by J. I. Minow and R.L. Altstatt for further definition of radiation env�ronment.
1. Ultrav�olet2. Ion�z�ng rad�at�on
L�fet�me of hab�tat: 30 years
Table 15. Lunar Meteoro�d Env�ronment.
Diameter (cm)***
Mass (g)* Flux (#/m2*hr)**
0.01 5.24E-07 0.000150685
0.03 1.41E-05 5.70776E-06
0.05 6.55E-05 9.80251E-07
0.07 1.80E-04 2.90297E-07
0.1 5.24E-04 7.70548E-08
0.3 0.014 1.11621E-09
0.5 0.065 1.48973E-10
0.7 0.18 3.92237E-11
1 0.524 9.47831E-12
3 14.137 1.17009E-13
5 65.45 1.50799E-14
7 179.594 3.90639E-15*Masses are computed assuming a meteoroid density of 1 g/cm3
**Average velocity = 20 km/sec***It should also be noted that even though the fluxes of the larger particles are quite small, many of them strike the lunar surface over the course of a year. For example, there are over 1200 lunar impacts by 7 cm diameter meteoroids each year.

78
REFERENCES
1. Brown, Sebr�na; Kundberg, K�mberly; et al.: “Lunar Regol�th Bagg�ng System,” NASA—CR–86652; Georg�a Inst�tute of Technology and Un�vers�t�es Space Research Assoc�at�on; Atlanta, GA, March 1990.
2. Pope, Reg�na: “Regol�thbag Report,” Qual�s Corporat�on, Huntsv�lle, AL, August 2005.
3. Kearney, Mark; and Meyers, Charles: “Regol�th Bag Structures Analys�s,” NASA Marshall Space-Fl�ght Center Dynam�cs, Loads, and Strength Branch, Marshall Space Fl�ght Center, AL, October 2005.
4. Schunk, Greg: “Prel�m�nary Regol�th Bag Lunar Hab�tat Thermal Study and Del�verable,” NASA Marshall Space Fl�ght Center Spacecraft Thermal Team, Marshall Space Fl�ght Center, November 2005.
5. Kaul, Raj; and Sm�thers, Gweneth: “Bagg�ng Mater�al Trade Study for Lunar Sandbag Hab�tat,” NASA Marshall Space Fl�ght Center Nonmetals Eng�neer�ng Branch, Marshall Space Fl�ght Center, AL, June 2005.
6. M�now, J.I.; and Alstatt, R.L.; “Lunar Rad�at�on Env�ronments for Character�zat�on of ISFR/Hab�t Structures Mater�als,” Unpubl�shed Manuscr�pt, 2005.
7. He�ken, G.H.; Van�man, D.T.; and French, B.M. (eds.): The Lunar Sourcebook: A User’s Guide to the Moon, Cambr�dge Un�vers�ty Press, Cambr�dge, England, 1991.
8. “3M Nextel Ceram�c Text�les Techn�cal Notebook.” <http://www.3m.com/ceram�cs/pdfs/Nextel_Tech_Notebook_11.04.pdf>, May, 2006.
9. Goodfellow Corporat�on Onl�ne Catalog. <http://www.goodfellow.com/csp/act�ve/STATIC/A/Polyaram�d_.HTML>, May, 2006.
10. W.L. Gore and Assoc�ates Onl�ne Catalog. <http://www.gore.com/MungoBlobs/rastex_weave_data-sheet.pdf>, May, 2006.
11. Azom.com, “The A to Z of Mater�als Suppl�er Data,” <http://www.azom.com/deta�ls.asp?Art�cle ID=1992%20#_Background>, May, 2006.
12. “Vectra A®–L�qu�d Crystal Polyester,” <http://www.goodfellow.com/csp/act�ve/gfMater�alInfo.csp?MATID=ES31#>, May, 2006.

79
13. Toyobo Company, LTD. Product Techn�cal Informat�on,” <http://www.toyobo.co.jp/e/se�h�n/kc/pbo/techn�cal.pdf>, May, 2006.
14. 1998 Annual Book of ASTM Standards: Section 7: Textiles, Amer�can Soc�ety for Test�ng and Mate-r�als, Ph�ladelph�a, PA, 1998.
15. M�now, J.L.; Altstatt, R.L.; Blackwell, W.C., Jr.; and Har�ne, K.J.: “Rad�at�on Env�ronments for Lunar Programs,” Sc�ence and Technology Appl�cat�ons Forum 2007, Albuquerque, NM, February 11–15, 2007.
16. Halble�b, J.A.; Kensek, R.P.; Valdez, G.D.; et al.: “ITS Vers�on 3.0: The Integrated TIGER Ser�es of Coupled Electron/Photon Monte Carlo Transport Codes,” Techn�cal Report SAND91–1634, Sand�a Nat�onal Laborator�es, Albuquerque, NM, August 1993.
17. Ze�gler, J.F.; et al.: “Stopp�ng Range of Ions �n Matter–SRIM 2003, <http://www.sr�m.org/#SRIM>,
May, 2006.
18. F�nckenor, M.M.; Edwards, D.L.; Vaughn, J.A.; et al.: “Test and Analys�s Capab�l�t�es of the Space Env�ronment Effects Team at Marshall Space Fl�ght Center,” NASA—TP–2002–212076, Marshall Space Fl�ght Center, AL, November 2002.
19. Kosmo, J.J.: “Res�stance Screen�ng of Cand�date Mater�als by Tumbler Test,” NASA, Johnson
Space Center, Houston, TX, July 2005.
20. Hovater, M.: “M�cro L�ght Gas Gun,” NASA-SOP-EM50-OWI-029, Marshall Space Fl�ght Center, AL, February 2005.
21. Stell�ngwerf, R.F.: “SPHC Smooth Part�cle Hydrodynam�cs Code–Vers�on 7.64: Problem Setup Gu�de: Input F�le Setup,” Stell�ngwerf Consult�ng–Complex Systems Analys�s, Huntsv�lle, AL, October 2005.
22. Stell�ngwerf, R.F.: “SPHC Smooth Part�cle Hydrodynam�cs Code–Vers�on 7.64: User Gu�de,” Stel-
l�ngwerf Consult�ng–Complex Systems Analys�s, Huntsv�lle, AL, November 2005.
23 Heyman, J.: The Masonry Arch, 118 pp., Halsted Press, New York, NY, 1982.

80
REPORT DOCUMENTATION PAGE Form ApprovedOMB No. 0704-0188
Public reporting burden for this collection of information is estimated to average 1 hour per response, including the time for reviewing instructions, searching existing data sources, gathering and maintain-ing the data needed, and completing and reviewing the collection of information. Send comments regarding this burden estimate or any other aspect of this collection of information, including suggestions for reducing this burden, to Washington Headquarters Services, Directorate for Information Operation and Reports, 1215 Jefferson Davis Highway, Suite 1204, Arlington, VA 22202-4302, and to the Office of Management and Budget, Paperwork Reduction Project (0704-0188), Washington, DC 20503
1. AGENCY USE ONLY (Leave Blank) 2. REPORT DATE 3. REPORT TYPE AND DATES COVERED
4. TITLE AND SUBTITLE 5. FUNDING NUMBERS
6. AUTHORS
7. PERFORMING ORGANIZATION NAME(S) AND ADDRESS(ES) 8. PERFORMING ORGANIZATION REPORT NUMBER
9. SPONSORING/MONITORING AGENCY NAME(S) AND ADDRESS(ES) 10. SPONSORING/MONITORING AGENCY REPORT NUMBER
11. SUPPLEMENTARY NOTES
12a. DISTRIBUTION/AVAILABILITY STATEMENT 12b. DISTRIBUTION CODE
13. ABSTRACT (Maximum 200 words)
14. SUBJECT TERMS 15. NUMBER OF PAGES
16. PRICE CODE
17. SECURITY CLASSIFICATION OF REPORT
18. SECURITY CLASSIFICATION OF THIS PAGE
19. SECURITY CLASSIFICATION OF ABSTRACT
20. LIMITATION OF ABSTRACT
NSN 7540-01-280-5500 Standard Form 298 (rev. 2-89)Prescribed by ANSI Std. 239-18298-102
Unclassified Unclassified Unclassified Unl�m�ted
A One-P�ece Lunar Regol�th Bag Garage Prototype
G.A. Sm�thers, M.K. Nehls, M.A. Hovater, S.W. Evans, *J.S. M�ller, **R.M. Broughton, Jr., **D. Beale, and **F. K�l�nc-Balc�
George C. Marshall Space Fl�ght CenterMarshall Space Fl�ght Center, AL 35812
Nat�onal Aeronaut�cs and Space Adm�n�strat�onWash�ngton, DC 20546–0001
Prepared by the Mater�als and Processes Laboratory, *Qual�s Corporat�on, Huntsv�lle, AL, and **Auburn Un�vers�ty, Auburn, AL
Unclassified-UnlimitedSubject Category 14Ava�lab�l�ty: NASA CASI 301–621–0390
Shelter structures on the moon, even �n early phases of explorat�on, should �ncorporate lunar mater�als as much as poss�ble. Th�s Techn�cal Memorandum deta�ls the des�gn and construct�on of a prototype for a one-p�ece regol�th bag unpressur�zed garage concept and a mater�als test�ng program to �nvest�gate s�x cand�date fabr�cs to learn how they m�ght perform �n the lunar env�ronment. The conceptual�zat�on was that a l�ghtwe�ght fabr�c form be launched from Earth and landed on the lunar surface to be robotically filled with raw lunar regolith. Regolith bag fabric candidates included: VectranTM, NextelTM, Gore PTFE Fabr�cTM, ZylonTM, TwaronTM, and NomexTM. Tens�le (�nclud�ng post rad�at�on exposure), fold, abras�on, and hyperveloc�ty �mpact test�ng were performed under amb�ent cond�t�ons, and also performed under cold and elevated temperatures. In some cases, Johnson Space Center lunar s�mulant (JSC-1) was used �n conjunct�on w�th test�ng.
A series of preliminary structures was constructed during final prototype design based on the principles of the classic masonry arch. The prototype was constructed of KevlarTM and filled with vermiculite. The structure is free-standing, but has not yet been load tested. Future plans would be to construct higher fidelity prototyes and to conduct appropriate tests of the structure.
92
M–1199
Techn�cal MemoradumSeptember 2007
NASA/TM—2007–215073
lunar structures/construct�on, lunar regol�th ut�l�zat�on, mater�als res�stance to lunar env�ronment, �n s�tu mater�als for lunar base construct�on, regol�th bags, lunar sand bags, mater�als test�ng for the lunar env�ronment, lunar garage prototype

The NASA STI Program…in Profile
Since its founding, NASA has been dedicated to the advancement of aeronautics and space science. The NASA Scientific and Technical Information (STI) Program Office plays a key part in helping NASA maintain this important role.
The NASA STI program operates under the auspices of the Agency Chief Information Officer. It collects, organizes, provides for archiving, and disseminates NASA’s STI. The NASA STI program provides access to the NASA Aeronautics and Space Database and its public interface, the NASA Technical Report Server, thus providing one of the largest collections of aeronautical and space science STI in the world. Results are published in both non-NASA channels and by NASA in the NASA STI Report Series, which includes the following report types:
• TECHNICAL PUBLICATION. Reports of completed research or a major significant phase of research that present the results of NASA programs and include extensive data or theoretical analysis. Includes compilations of significant scientific and technical data and information deemed to be of continuing reference value. NASA’s counterpart of peer-reviewed formal professional papers but has less stringent limitations on manuscript length and extent of graphic presentations.
• TECHNICAL MEMORANDUM. Scientific and technical findings that are preliminary or of specialized interest, e.g., quick release reports, working papers, and bibliographies that contain minimal annotation. Does not contain extensive analysis.
• CONTRACTOR REPORT. Scientific and technical findings by NASA-sponsored contractors and grantees.
• CONFERENCE PUBLICATION. Collected papers from scientific and technical conferences, symposia, seminars, or other meetings sponsored or cosponsored by NASA.
• SPECIAL PUBLICATION. Scientific, technical, or historical information from NASA programs, projects, and missions, often concerned with subjects having substantial public interest.
• TECHNICAL TRANSLATION. English-language translations of foreign scientific and technical material pertinent to NASA’s mission.
Specialized services also include creating custom thesauri, building customized databases, and organizing and publishing research results.
For more information about the NASA STI program, see the following:
• Access the NASA STI program home page at <http://www.sti.nasa.gov>
• E-mail your question via the Internet to <[email protected]>
• Fax your question to the NASA STI Help Desk at 301– 621–0134
• Phone the NASA STI Help Desk at 301– 621–0390
• Write to: NASA STI Help Desk NASA Center for AeroSpace Information 7115 Standard Drive Hanover, MD 21076–1320

NASA/TM—2007–215073
A One-Piece Lunar Regolith Bag Garage PrototypeG.A. Smithers, M.K. Nehls, M.A. Hovater, S.W. EvansMarshall Space Flight Center, Marshall Space Flight Center, AL
J.S. MillerQualis Corporation, Huntsville, AL
R.M. Broughton, Jr., D. Beale, F. Kilinc-BalciAuburn University, Auburn, AL
September 2007
National Aeronautics andSpace AdministrationIS20George C. Marshall Space Flight CenterMarshall Space Flight Center, Alabama35812