investigation of radiation dose estimates and image
TRANSCRIPT
ARTICLE IN PRESS
Original Investigation
Investigation of Radiation DoseEstimates and Image Quality BetweenCommercially Available Interventional
Fluoroscopy Systems forFluoroscopically Guided
Interventional Procedures
Lukas M. Trunz, MD, David J. Eschelman, MD, Carin F. Gonsalves, MD, Robert D. Adamo, MD,Jaydev K. Dave, PhD, DABR, MS
A
FrSare-
©Aht
Rationale and Objectives: To investigate differences in radiation dose and image quality for single-plane flat-panel-detector based inter-ventional fluoroscopy systems from two vendors using phantom study and clinical procedures.
Materials and Methods: AlluraClarityIQ (Philips) and Artis Q (Siemens-Healthineers) interventional fluoroscopy systems were evaluated.Phantom study included comparison of system-reported air-kerma rates (AKR) for clinical protocols with simulated patient thicknesses(20�40 cm). Differences in system-reported radiation dose estimates, cumulative-air-kerma (CAK) and kerma-area-product (KAP), for dif-ferent clinical procedures were investigated. Subset analysis investigated differences in CAK, KAP and other factors affecting radiationdose when the same patients underwent repeat embolization procedures performed by the same physician on the two different fluoros-copy systems. Two blinded interventional radiologists reviewed image-quality for these procedures using a five-point scale (1�5; 5-best)for five parameters.
Results: Phantom study revealed that air-kerma rates was significantly higher for Artis Q system for 30�40cm of simulated patient thick-nesses (p < 0.05). Overall data analysis from 4381 clinical cases revealed significant differences in CAK and KAP for certain procedures (p< 0.05); with significantly lower values for AlluraClarityIQ systems (median CAK lower by: 29%�58%). Subset analysis with 40 patientsundergoing repeat embolization procedures on both systems revealed that median CAK and KAP were significantly lower for AlluraClari-tyIQ systems (p < 0.02) by 45% and 31%, respectively. Image quality scores for AlluraClarityIQ systems were significantly greater (meandifference range for five parameters: 1.3�1.6; p < 0.005).
Conclusion: Radiation dose and image quality differences were observed between AlluraClarityIQ and Artis Q systems. AlluraClarityIQsystems showed lower radiation utilization and an increase in subjective perception of image quality.
Key Words: Radiation dose; Image quality, Fluoroscopically guided interventional procedures; Embolization; Angiography.
© 2020 The Association of University Radiologists. Published by Elsevier Inc. All rights reserved.
Abbreviations: AKR air kerma rate, CAK cumulative air kerma, DSA darea product
igital subtraction angiography, FPS frames per second, KAP kerma-
cad Radiol 2020;&:1–11
om the Department of Radiology, Thomas Jefferson University, 132 S 10thtreet, Philadelphia, PA 19107. Received December 16, 2019; revised Febru-y 12, 2020; accepted February 23, 2020. Address correspondence to: J.K.D.mail: [email protected]
2020 The Association of University Radiologists. Published by Elsevier Inc.ll rights reserved.tps://doi.org/10.1016/j.acra.2020.02.024
INTRODUCTION
F luoroscopy accounts for about 18% of the medicalexposure related radiation, but it has the potential toimpart some of the largest tissue doses to individual
patients (1,2). The estimated range of doses from complexinterventional fluoroscopy procedures is at least an order ofmagnitude higher relative to other diagnostic x-ray basedexaminations (1,2). Further, the number of fluoroscopically
1
ARTICLE IN PRESSTRUNZ ET AL Academic Radiology, Vol&, No&&,&& 2020
guided interventional procedures are increasing with approxi-mately 9 million procedures performed annually in theUnited States (2). There have been several investigations intotissue reactions following interventional fluoroscopy proce-dures and into occupational exposure effects (3�7). Conse-quently, there have been many guidelines and regulationsestablished to control radiation exposure during fluoroscopicprocedures, both to the patient and to the staff members(2,7�12). These guidelines/regulations require the manufac-turers of the interventional fluoroscopy system to indicateradiation dose estimates i.e., air kerma rate (AKR) and cumu-lative air kerma (CAK) at an interventional reference pointand kerma-area product (KAP) (2,7). These dose indicatorsprovide an indirect estimate of the incident skin dose to thepatient. Threshold levels have been suggested for CAK andKAP such that values in excess of the threshold levels mayelicit tissue reactions and thus, patient follow-up and counsel-ing is considered prudent in such cases (2). There have beenrecent reports tracking these dose estimates for typical inter-ventional fluoroscopy procedures (13,14).
In addition to the recommended guidelines and regulationsto reduce radiation exposure to patients undergoing fluoro-scopically guided interventional procedures and to members ofstaff, there have been technological advancements that haveshown potential to reduce radiation utilization during theseprocedures. These advancements include adoption of flat-panel based image receptors, dynamic beam filtration, proto-col-specific automatic dose rate regulation, and signal andimage processing applications in real-time (15�19). Vendor-specific approaches for optimizing radiation dose during fluo-roscopy procedures aim to maintain clinical task based imagequality at acceptable noise levels (quantum mottle) with opti-mized radiation dose rates. There have been some investiga-tions into comparing such vendor-specific dose optimizationapproaches, but these studies are limited to either in vitro evalu-ations (using phantoms) or comparisons between features andupgrades for a specific vendor (15,18,20). Radiation dose andimage quality comparisons between interventional fluoroscopysystems from different vendors are rare. Such inter-vendorcomparisons may highlight differences and provide a pathwayfor standardization in terms of radiation dose utilization andacceptable image quality for similar procedures (21).
Therefore, the purpose of this study was multifold: tocompare system-reported AKR between interventional fluo-roscopy systems from two vendors using phantoms, to com-pare radiation dose estimates from clinical proceduresperformed using these systems � including a subset analysiscomparing radiation utilization for the same patients under-going the same procedures performed by the same physicianusing these systems, and to investigate image quality in clini-cal cases performed using these systems.
MATERIAL ANDMETHODS
Data for this study were acquired from four commerciallyavailable single-plane flat-panel-detector based interventional
2
fluoroscopy systems manufactured by two manufacturers:Allura Xper FD20 with ClarityIQ and AlluraClarityIQ sys-tems from Philips Healthcare (together referred to as Allura-ClarityIQ systems in this manuscript), and Artis Q systemwith Pure and Clear from Siemens Healthineers. One PhilipsAllura Xper FD20 system was manufactured in October-2009, installed in December-2009 and upgraded to ClarityIQin December-2014. Other Philips Allura Xper FD20 systemwas manufactured in January-2011, installed in April-2011and upgraded to ClarityIQ in December-2013. Philips Allur-aClarityIQ system was manufactured in July-2014 andinstalled in September-2014. Siemens Artis Q system wasmanufactured in September-2015 and installed in Novem-ber-2015. The software versions for Allura Xper FD20 sys-tems upgraded to ClarityIQ were 8.1.17.2 and 8.2.17, forAlluraClarityIQ system was 8.2.25 and for Artis Q systemwas VD11C 161025. Note, ClarityIQ (from Philips) andPure and Clear (from Siemens Healthineers) are a portfolio ofimage processing/dose optimization vendor-specific featuresprovided with interventional fluoroscopy systems. Additionaldetails about these vendor-specific features and systems areprovided elsewhere (15,18,20) � specifically the details withrespect to technology available on these fluoroscopy systemsand how the kVp and mA modulation along with copper fil-tration changes work as per the systems’ automatic exposurerate control logic for radiation dose optimization. In therespective sub-sections of this manuscript we have providedinformation about protocol selection and respective parame-ter settings.
Phantom Study
The purpose of this phantom study was to compare the radia-tion dose output of fluoroscopy systems under standardizedconditions before comparing radiation dose estimates fromclinical procedures. Two clinically used protocols were usedfor the phantom study � for the Artis Q system the protocolused was ‘DSA Abdomen: 3 FPS’ (FPS: frames per second)whereas for AlluraClarityIQ systems the protocol used was‘Abdomen 3 FPS’; both these protocols were configured tooperate at 15 pulses per second (for the phantom study), byselecting this option from the available options for differentpulse rates. We selected these specific protocols because in asubset analysis of the clinical study we compare radiation uti-lization in clinical cases performed using these protocols.
First, accuracy of the system-reported AKR at the inter-ventional reference point (in mGy/min) was evaluated usinga solid-state detector (AGMS-D detector with AGDM dig-itizer, Radcal Corporation, Monrovia, CA) for each inter-ventional fluoroscopy system using standardized method (22).Then, acrylic sheets (30 cm x 30 cm x 0.5 cm) were used tosimulate three levels of patient thicknesses: 20 cm, 30 cm and40 cm. Acrylic sheets were placed on the patient table alongwith the table pad mimicking a clinical setup. Initially,source-to-image distance was set to a standard value of100 cm (with 30 cm of acrylic thickness) and then adjusted
ARTICLE IN PRESSAcademic Radiology, Vol&, No&&,&& 2020 INVESTIGATION OF RADIATION DOSE
with varying phantom thickness. For each level of simulatedthickness, system-reported AKR was noted in the vendor-configured ‘Low-Dose’ and ‘Normal-Dose’ modes. Thesemeasurements were performed for similar magnificationmodes for both types of systems (AlluraClarityIQ: 48 cm,43 cm, 33 cm, 20 cm and 15 cm; Artis Q: 48 cm, 42 cm,32 cm, 22 cm and 16 cm). For comparisons between systems,the system-reported AKR values for the Artis Q system wereadjusted using an inverse square law correction factor toaccount for differences in the interventional reference pointand in the floor-to-focal spot distance between the systems(20). AlluraClarityIQ system utilizes static beam filtering andthe filter combinations used in ‘Low-Dose’ and ‘Normal-Dose’ modes are ‘0.4 mm Copper with 1.0 mm Aluminum’
and ‘0.1 mm Copper and 1.0 mm Aluminum’, respectively.Artis Q system utilizes dynamic filtering approach and the fil-tration changes depending on attenuation in the x-ray beam’spath even for the same protocol. For reference, we also mea-sured the half-value layer (indicating an x-ray beam’s penetra-bility; in units of mm of Aluminum) for the ‘Normal DoseMode’. These measurements were performed for all the mag-nification modes considered in this study, using the AGMS-Dsolid-state detector along with the table and the table-pad inthe x-ray beam’s path.
Clinical Study
Institutional Review Board approved this retrospective reviewof radiation dose data from clinical cases with waived informedconsent requirement. The clinical study was divided into threeparts: an overall comparison of radiation utilization across dif-ferent types of procedures, a controlled comparison of radia-tion utilization using the same patients treated using bothsystems, and an image quality comparison. For all three parts ofthe clinical study, clinical cases performed over a 16-monthperiod were reviewed (December 2015 till March 2017). Nochanges were made to the protocols configured on the fluoros-copy systems during this study period.Clinical Study � Overall Radiation Utilization Comparison:
All interventional cases performed using the AlluraClarityIQand Artis Q systems were extracted from Centricity RIS (GEHeathcare) and Dosemetrix (Primordial Design). All casesperformed outside the interventional radiology suites at ouracademic medical center (e.g., an affiliated community hospi-tal, vascular surgery operating room, etc.) were excluded.These cases were grouped by procedure codes. All procedurecodes with greater than 30 cases (for statistical comparisons)performed on each type of system were included in the analy-sis. For the included cases, system-reported CAK (in units ofmGy) at the interventional reference point, KAP (in units ofmGy.cm2), and total fluoroscopy time were extracted. Thesevalues were reviewed and any typographical deletions/errorswere corrected before comparison (these values were verifiedexplicitly with the values displayed on the dose-capturescreen report after completion of a procedure). Similar to thecorrection for the phantom study, CAK values reported by
the Artis Q systems were adjusted using an inverse square lawcorrection factor to account for inter-system differences.
Clinical Study � Radiation Utilization Comparison in a Con-trolled Subset: A subset analysis was performed for a controlledcomparison of clinical radiation dose utilization. Patients withmetastatic uveal melanoma receiving repeat chemo/immuno-embolization of the same liver lobe performed inthe same manner by the same physician (DJE, CFG, RDA)on AlluraClarityIQ and Artis Q systems were identified.These patients generally undergo repeated monthly treatmentand on the day of treatment get randomly assigned to aninterventional suite depending on clinical workflow. Thiswas a source of randomization, such that in some cases thefirst treatment was performed on an Artis Q system and inother cases the first treatment was performed on an Allura-ClarityIQ system. Embolization procedures are potentiallyhigh-radiation dose procedures (2) and therefore identifyingradiation dose differences for such a procedure may have radi-ation safety implications. In this subset, along with CAK,KAP and fluoroscopy time, factors that may account for dif-ferences in radiation dose utilization were also extracted fromradiation dose structured reports using DoseMetrix (Primor-dial) and CareAnalytics (Siemens Healthineers). These factorswere source to detector distance, tube kilo-voltage, numberof digital acquisition sequences, total number of images in thedigital acquisition sequences, tube angulations (primary andsecondary angles) and longitudinal table positions. Addition-ally, two interventional radiologists (DJE and RDA) alsoreviewed the acquisition series and any 3D rotational acquisi-tions or additional acquisition sequences (attributable to con-trast injection failure, etc.) were excluded (i.e., correspondingradiation dose values were subtracted from CAK and KAP)to reflect similar workflow on repeat procedures. This wasdone because radiation dose rates and dose contributiontoward CAK is relatively high during digital acquisitionsequences (as compared to routine fluoroscopy) and any addi-tional sequences (either on AlluraClarityIQ or Artis Q sys-tem) would have biased the dose values. This ensured acontrolled identical workflow on both the systems availablefor comparison on a case-by-case basis.
Clinical Study � Image Quality Review: Two experiencedinterventional radiologists (DJE and CFG; with 26 and20 years of experience) performed a blinded image qualityreview (i.e., no identifying information of the system produc-ing these images). The arteriogram sequences from Allura-ClarityIQ and Artis Q systems covering the same anatomywith the same projection were presented to the interven-tional radiologists for scoring of the following features on afive-point scale ranging from 1 (very poor) to 5 (excellent):visualization of blood vessels, distinction of blood vessels,visualization of tumor vasculature, noise texture (affectingimage interpretation), and overall image quality. These fivefeatures were selected based on previous studies (15,18). Eachinterventional radiologist reviewed all the cases that wereincluded in the controlled subset analysis for radiation utiliza-tion comparison for image quality, independently.
3
ARTICLE IN PRESSTRUNZ ET AL Academic Radiology, Vol&, No&&,&& 2020
Statistical Analysis
For the phantom study, accuracy of system-reported AKRvalues was evaluated with reference to the acceptable toler-ance level of §35% (7). Pairwise comparisons of AKRbetween AlluraClarityIQ and Artis Q systems were per-formed for different dose modes and acrylic phantom thick-nesses, with Bonferroni corrections for multiple comparisons.To compare overall radiation dose utilization in clinical cases,tests of normality were performed for CAK, KAP and totalfluoroscopy time parameters. If there was no statistically sig-nificant difference from normality then Unpaired T-testswere used or else Mann-Whitney U tests were used to com-pare these three parameters between different interventionalsystems for each type of procedure code (with Bonferronicorrections for multiple comparisons). Even for the compari-son of all parameters in the subset study, similar statisticalmethodology and tests were used with the exception that allparameters (e.g., source to detector distance, kV, etc.) werecompared. For the image quality review, an interclass correla-tion coefficient (ICC) was computed to assess reliabilitybetween measurements performed by the two readers. Imagequality review scores averaged over two readers were com-pared by using pairwise comparisons for each image qualityparameter. IBM’s SPSS statistics (version 24) was used foranalysis. Results with p-values less than 0.05 were consideredstatistically significant.
RESULTS
Phantom Study
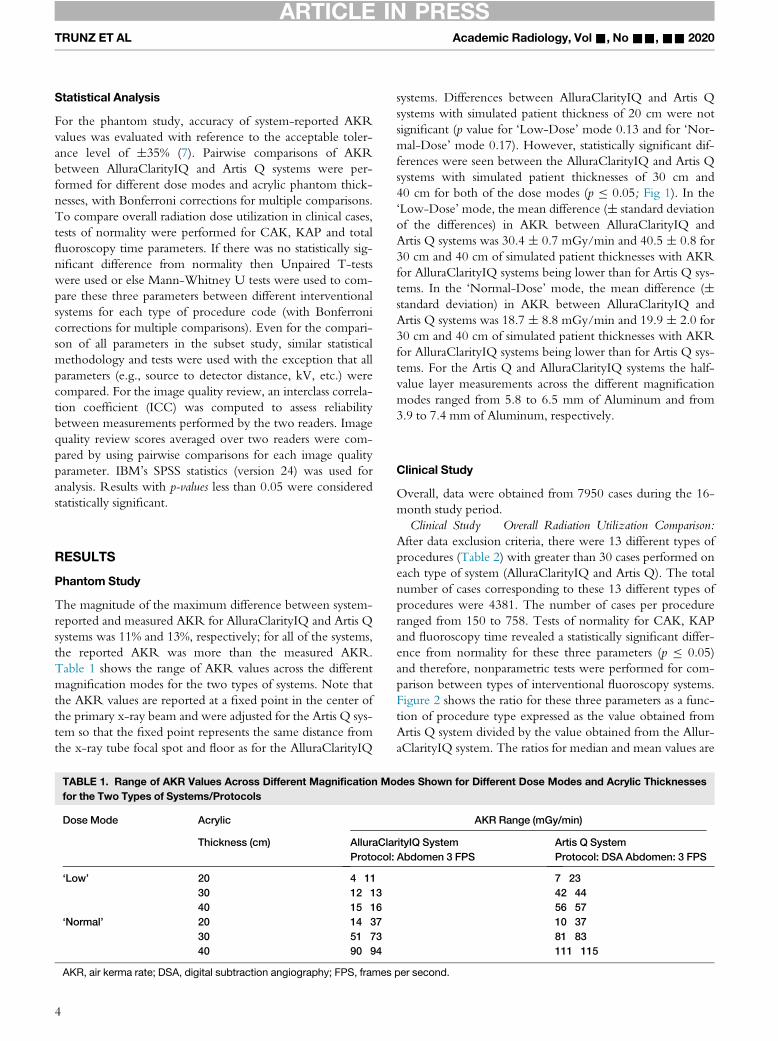
The magnitude of the maximum difference between system-reported and measured AKR for AlluraClarityIQ and Artis Qsystems was 11% and 13%, respectively; for all of the systems,the reported AKR was more than the measured AKR.Table 1 shows the range of AKR values across the differentmagnification modes for the two types of systems. Note thatthe AKR values are reported at a fixed point in the center ofthe primary x-ray beam and were adjusted for the Artis Q sys-tem so that the fixed point represents the same distance fromthe x-ray tube focal spot and floor as for the AlluraClarityIQ
TABLE 1. Range of AKR Values Across Different Magnification Mofor the Two Types of Systems/Protocols
Dose Mode Acrylic
AlluraClaThickness (cm)Protocol:
‘Low’ 20 4�1130 12�1340 15�16
‘Normal’ 20 14�3730 51�7340 90�94
AKR, air kerma rate; DSA, digital subtraction angiography; FPS, frames
4
systems. Differences between AlluraClarityIQ and Artis Qsystems with simulated patient thickness of 20 cm were notsignificant (p value for ‘Low-Dose’ mode 0.13 and for ‘Nor-mal-Dose’ mode 0.17). However, statistically significant dif-ferences were seen between the AlluraClarityIQ and Artis Qsystems with simulated patient thicknesses of 30 cm and40 cm for both of the dose modes (p � 0.05; Fig 1). In the‘Low-Dose’mode, the mean difference (§ standard deviationof the differences) in AKR between AlluraClarityIQ andArtis Q systems was 30.4 § 0.7 mGy/min and 40.5 § 0.8 for30 cm and 40 cm of simulated patient thicknesses with AKRfor AlluraClarityIQ systems being lower than for Artis Q sys-tems. In the ‘Normal-Dose’ mode, the mean difference (§standard deviation) in AKR between AlluraClarityIQ andArtis Q systems was 18.7 § 8.8 mGy/min and 19.9 § 2.0 for30 cm and 40 cm of simulated patient thicknesses with AKRfor AlluraClarityIQ systems being lower than for Artis Q sys-tems. For the Artis Q and AlluraClarityIQ systems the half-value layer measurements across the different magnificationmodes ranged from 5.8 to 6.5 mm of Aluminum and from3.9 to 7.4 mm of Aluminum, respectively.
Clinical Study
Overall, data were obtained from 7950 cases during the 16-month study period.
Clinical Study � Overall Radiation Utilization Comparison:After data exclusion criteria, there were 13 different types ofprocedures (Table 2) with greater than 30 cases performed oneach type of system (AlluraClarityIQ and Artis Q). The totalnumber of cases corresponding to these 13 different types ofprocedures were 4381. The number of cases per procedureranged from 150 to 758. Tests of normality for CAK, KAPand fluoroscopy time revealed a statistically significant differ-ence from normality for these three parameters (p � 0.05)and therefore, nonparametric tests were performed for com-parison between types of interventional fluoroscopy systems.Figure 2 shows the ratio for these three parameters as a func-tion of procedure type expressed as the value obtained fromArtis Q system divided by the value obtained from the Allur-aClarityIQ system. The ratios for median and mean values are
des Shown for Different Dose Modes and Acrylic Thicknesses
AKR Range (mGy/min)
rityIQ System Artis Q SystemAbdomen 3 FPS Protocol: DSA Abdomen: 3 FPS
7�2342�4456�5710�3781�83111�115
per second.
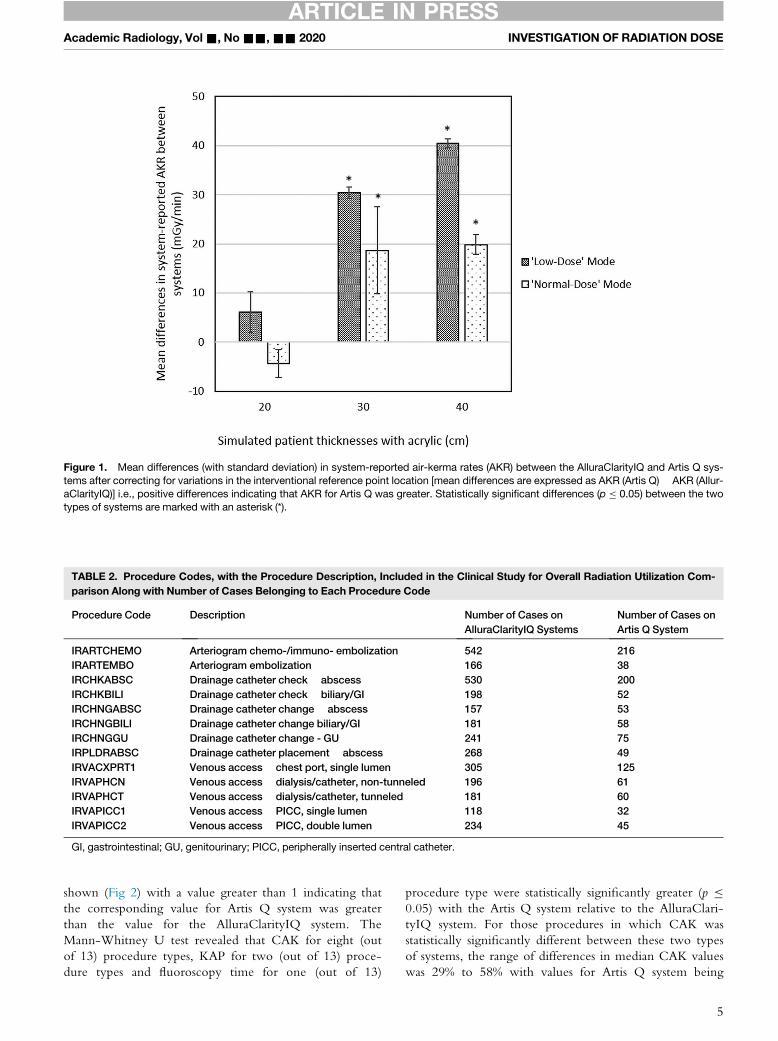
Figure 1. Mean differences (with standard deviation) in system-reported air-kerma rates (AKR) between the AlluraClarityIQ and Artis Q sys-tems after correcting for variations in the interventional reference point location [mean differences are expressed as AKR (Artis Q) � AKR (Allur-aClarityIQ)] i.e., positive differences indicating that AKR for Artis Q was greater. Statistically significant differences (p � 0.05) between the twotypes of systems are marked with an asterisk (*).
TABLE 2. Procedure Codes, with the Procedure Description, Included in the Clinical Study for Overall Radiation Utilization Com-parison Along with Number of Cases Belonging to Each Procedure Code
Procedure Code Description Number of Cases onAlluraClarityIQ Systems
Number of Cases onArtis Q System
IRARTCHEMO Arteriogram chemo-/immuno- embolization 542 216IRARTEMBO Arteriogram embolization 166 38IRCHKABSC Drainage catheter check � abscess 530 200IRCHKBILI Drainage catheter check � biliary/GI 198 52IRCHNGABSC Drainage catheter change � abscess 157 53IRCHNGBILI Drainage catheter change biliary/GI 181 58IRCHNGGU Drainage catheter change - GU 241 75IRPLDRABSC Drainage catheter placement � abscess 268 49IRVACXPRT1 Venous access � chest port, single lumen 305 125IRVAPHCN Venous access � dialysis/catheter, non-tunneled 196 61IRVAPHCT Venous access � dialysis/catheter, tunneled 181 60IRVAPICC1 Venous access � PICC, single lumen 118 32IRVAPICC2 Venous access � PICC, double lumen 234 45
GI, gastrointestinal; GU, genitourinary; PICC, peripherally inserted central catheter.
ARTICLE IN PRESSAcademic Radiology, Vol&, No&&,&& 2020 INVESTIGATION OF RADIATION DOSE
shown (Fig 2) with a value greater than 1 indicating thatthe corresponding value for Artis Q system was greaterthan the value for the AlluraClarityIQ system. TheMann-Whitney U test revealed that CAK for eight (outof 13) procedure types, KAP for two (out of 13) proce-dure types and fluoroscopy time for one (out of 13)
procedure type were statistically significantly greater (p �0.05) with the Artis Q system relative to the AlluraClari-tyIQ system. For those procedures in which CAK wasstatistically significantly different between these two typesof systems, the range of differences in median CAK valueswas 29% to 58% with values for Artis Q system being
5
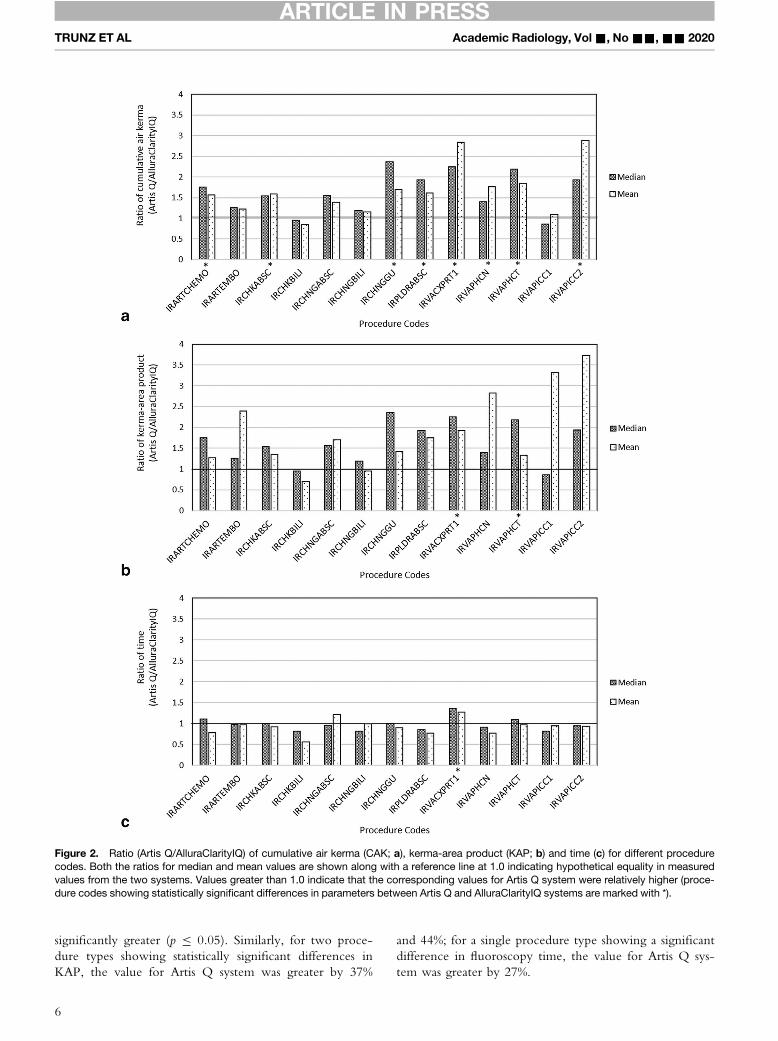
Figure 2. Ratio (Artis Q/AlluraClarityIQ) of cumulative air kerma (CAK; a), kerma-area product (KAP; b) and time (c) for different procedurecodes. Both the ratios for median and mean values are shown along with a reference line at 1.0 indicating hypothetical equality in measuredvalues from the two systems. Values greater than 1.0 indicate that the corresponding values for Artis Q system were relatively higher (proce-dure codes showing statistically significant differences in parameters between Artis Q and AlluraClarityIQ systems are marked with *).
ARTICLE IN PRESSTRUNZ ET AL Academic Radiology, Vol&, No&&,&& 2020
significantly greater (p � 0.05). Similarly, for two proce-dure types showing statistically significant differences inKAP, the value for Artis Q system was greater by 37%
6
and 44%; for a single procedure type showing a significantdifference in fluoroscopy time, the value for Artis Q sys-tem was greater by 27%.
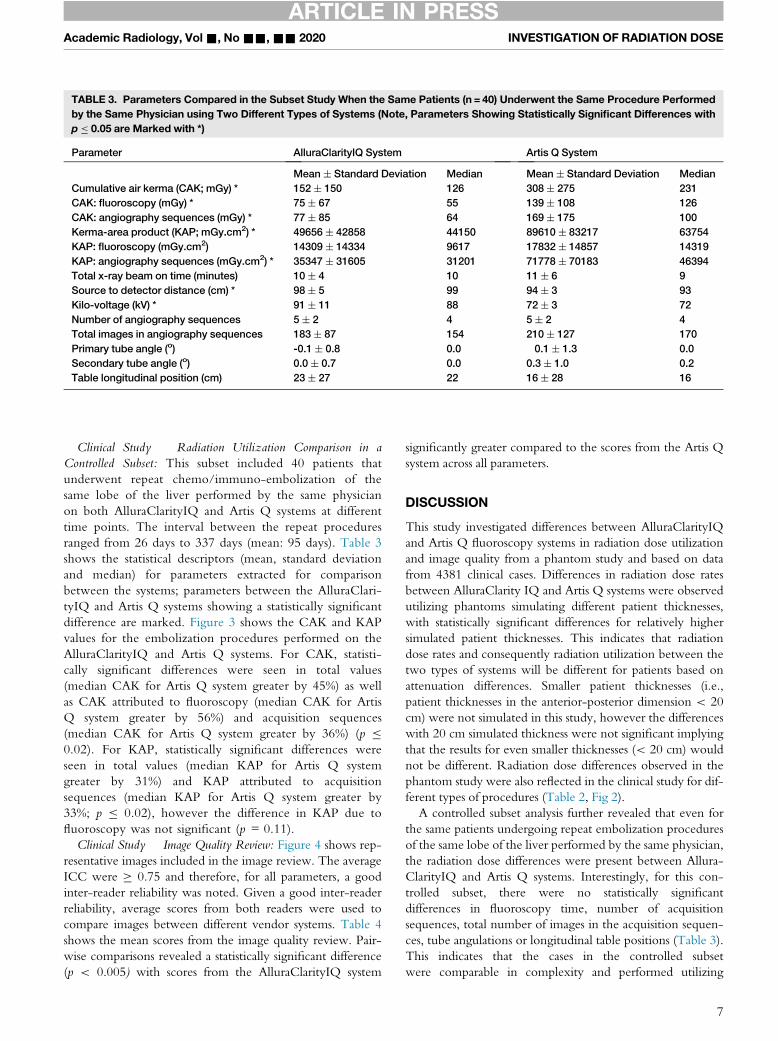
TABLE 3. Parameters Compared in the Subset Study When the Same Patients (n = 40) Underwent the Same Procedure Performedby the Same Physician using Two Different Types of Systems (Note, Parameters Showing Statistically Significant Differences withp � 0.05 are Marked with *)
Parameter AlluraClarityIQ System Artis Q System
Mean § Standard Deviation Median Mean § Standard Deviation MedianCumulative air kerma (CAK; mGy) * 152 § 150 126 308 § 275 231CAK: fluoroscopy (mGy) * 75 § 67 55 139 § 108 126CAK: angiography sequences (mGy) * 77 § 85 64 169 § 175 100Kerma-area product (KAP; mGy.cm2) * 49656 § 42858 44150 89610 § 83217 63754KAP: fluoroscopy (mGy.cm2) 14309 § 14334 9617 17832 § 14857 14319KAP: angiography sequences (mGy.cm2) * 35347 § 31605 31201 71778 § 70183 46394Total x-ray beam on time (minutes) 10 § 4 10 11 § 6 9Source to detector distance (cm) * 98 § 5 99 94 § 3 93Kilo-voltage (kV) * 91 § 11 88 72 § 3 72Number of angiography sequences 5 § 2 4 5 § 2 4Total images in angiography sequences 183 § 87 154 210 § 127 170Primary tube angle (o) -0.1 § 0.8 0.0 �0.1 § 1.3 0.0Secondary tube angle (o) 0.0 § 0.7 0.0 0.3 § 1.0 0.2Table longitudinal position (cm) 23 § 27 22 16 § 28 16
ARTICLE IN PRESSAcademic Radiology, Vol&, No&&,&& 2020 INVESTIGATION OF RADIATION DOSE
Clinical Study � Radiation Utilization Comparison in aControlled Subset: This subset included 40 patients thatunderwent repeat chemo/immuno-embolization of thesame lobe of the liver performed by the same physicianon both AlluraClarityIQ and Artis Q systems at differenttime points. The interval between the repeat proceduresranged from 26 days to 337 days (mean: 95 days). Table 3shows the statistical descriptors (mean, standard deviationand median) for parameters extracted for comparisonbetween the systems; parameters between the AlluraClari-tyIQ and Artis Q systems showing a statistically significantdifference are marked. Figure 3 shows the CAK and KAPvalues for the embolization procedures performed on theAlluraClarityIQ and Artis Q systems. For CAK, statisti-cally significant differences were seen in total values(median CAK for Artis Q system greater by 45%) as wellas CAK attributed to fluoroscopy (median CAK for ArtisQ system greater by 56%) and acquisition sequences(median CAK for Artis Q system greater by 36%) (p �0.02). For KAP, statistically significant differences wereseen in total values (median KAP for Artis Q systemgreater by 31%) and KAP attributed to acquisitionsequences (median KAP for Artis Q system greater by33%; p � 0.02), however the difference in KAP due tofluoroscopy was not significant (p = 0.11).Clinical Study � Image Quality Review: Figure 4 shows rep-
resentative images included in the image review. The averageICC were � 0.75 and therefore, for all parameters, a goodinter-reader reliability was noted. Given a good inter-readerreliability, average scores from both readers were used tocompare images between different vendor systems. Table 4shows the mean scores from the image quality review. Pair-wise comparisons revealed a statistically significant difference(p < 0.005) with scores from the AlluraClarityIQ system
significantly greater compared to the scores from the Artis Qsystem across all parameters.
DISCUSSION
This study investigated differences between AlluraClarityIQand Artis Q fluoroscopy systems in radiation dose utilizationand image quality from a phantom study and based on datafrom 4381 clinical cases. Differences in radiation dose ratesbetween AlluraClarity IQ and Artis Q systems were observedutilizing phantoms simulating different patient thicknesses,with statistically significant differences for relatively highersimulated patient thicknesses. This indicates that radiationdose rates and consequently radiation utilization between thetwo types of systems will be different for patients based onattenuation differences. Smaller patient thicknesses (i.e.,patient thicknesses in the anterior-posterior dimension < 20cm) were not simulated in this study, however the differenceswith 20 cm simulated thickness were not significant implyingthat the results for even smaller thicknesses (< 20 cm) wouldnot be different. Radiation dose differences observed in thephantom study were also reflected in the clinical study for dif-ferent types of procedures (Table 2, Fig 2).
A controlled subset analysis further revealed that even forthe same patients undergoing repeat embolization proceduresof the same lobe of the liver performed by the same physician,the radiation dose differences were present between Allura-ClarityIQ and Artis Q systems. Interestingly, for this con-trolled subset, there were no statistically significantdifferences in fluoroscopy time, number of acquisitionsequences, total number of images in the acquisition sequen-ces, tube angulations or longitudinal table positions (Table 3).This indicates that the cases in the controlled subsetwere comparable in complexity and performed utilizing
7
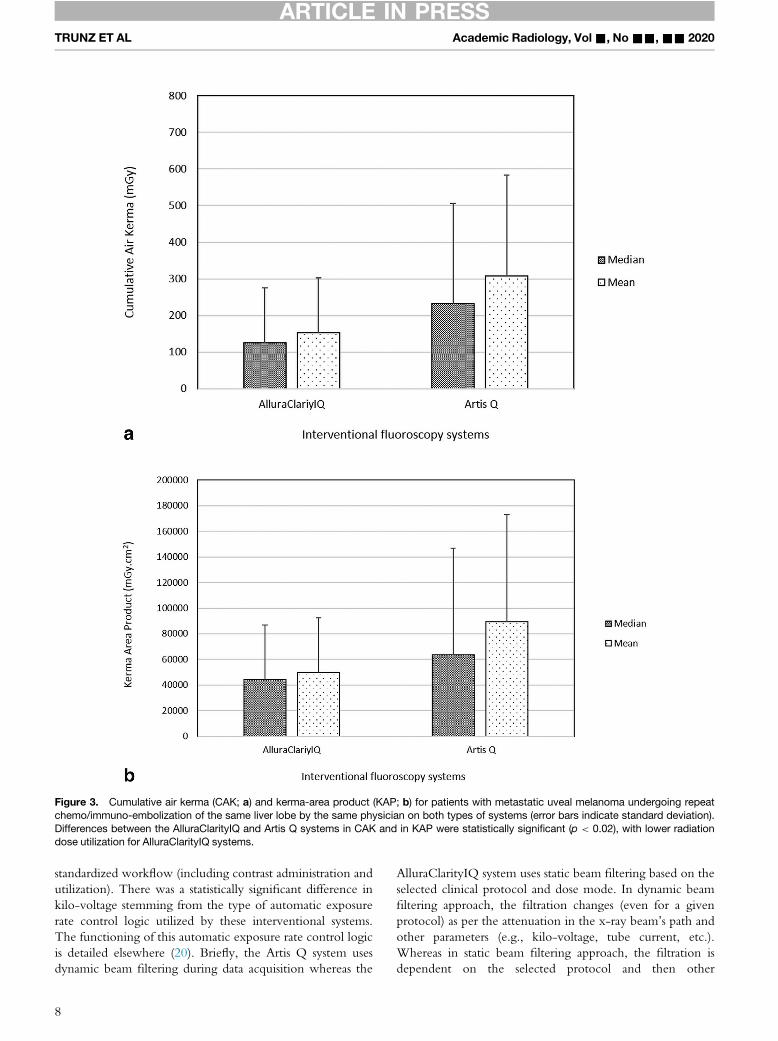
Figure 3. Cumulative air kerma (CAK; a) and kerma-area product (KAP; b) for patients with metastatic uveal melanoma undergoing repeatchemo/immuno-embolization of the same liver lobe by the same physician on both types of systems (error bars indicate standard deviation).Differences between the AlluraClarityIQ and Artis Q systems in CAK and in KAP were statistically significant (p < 0.02), with lower radiationdose utilization for AlluraClarityIQ systems.
ARTICLE IN PRESSTRUNZ ET AL Academic Radiology, Vol&, No&&,&& 2020
standardized workflow (including contrast administration andutilization). There was a statistically significant difference inkilo-voltage stemming from the type of automatic exposurerate control logic utilized by these interventional systems.The functioning of this automatic exposure rate control logicis detailed elsewhere (20). Briefly, the Artis Q system usesdynamic beam filtering during data acquisition whereas the
8
AlluraClarityIQ system uses static beam filtering based on theselected clinical protocol and dose mode. In dynamic beamfiltering approach, the filtration changes (even for a givenprotocol) as per the attenuation in the x-ray beam’s path andother parameters (e.g., kilo-voltage, tube current, etc.).Whereas in static beam filtering approach, the filtration isdependent on the selected protocol and then other
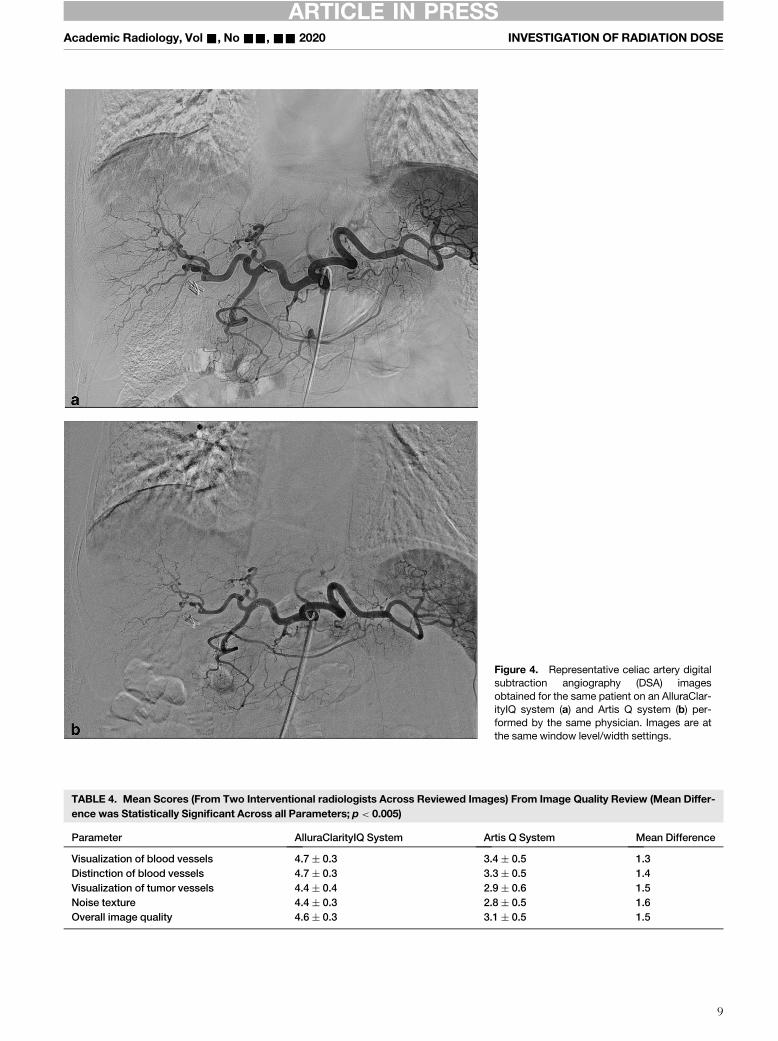
Figure 4. Representative celiac artery digitalsubtraction angiography (DSA) imagesobtained for the same patient on an AlluraClar-ityIQ system (a) and Artis Q system (b) per-formed by the same physician. Images are atthe same window level/width settings.
TABLE 4. Mean Scores (From Two Interventional radiologists Across Reviewed Images) From Image Quality Review (Mean Differ-ence was Statistically Significant Across all Parameters; p < 0.005)
Parameter AlluraClarityIQ System Artis Q System Mean Difference
Visualization of blood vessels 4.7 § 0.3 3.4 § 0.5 1.3Distinction of blood vessels 4.7 § 0.3 3.3 § 0.5 1.4Visualization of tumor vessels 4.4 § 0.4 2.9 § 0.6 1.5Noise texture 4.4 § 0.3 2.8 § 0.5 1.6Overall image quality 4.6 § 0.3 3.1 § 0.5 1.5
ARTICLE IN PRESSAcademic Radiology, Vol&, No&&,&& 2020 INVESTIGATION OF RADIATION DOSE
9
1 Forsberg MA, Talreja P, Eschelman DJ and Dave JK. Do quantitative met-rics derived from standard fluoroscopy phantoms used for quality controlassess vendor-specific advancements in interventional fluoroscopy systems?Proc. SPIE 10136, Medical Imaging 2017: Image Perception, Observer Perfor-mance, and Technology Assessment, 1013619; (DOI: http://dx.doi.org/10.1117/12.2254561).
ARTICLE IN PRESSTRUNZ ET AL Academic Radiology, Vol&, No&&,&& 2020
parameters (e.g., kilo-voltage, tube current, etc.) change asper the automatic exposure rate control logic. There was alsoa statistically significant difference in the source to detectordistance with the median distance for all cases being 99 cmfor AlluraClarityIQ system and 93 for Artis Q system. Whilethis indicates a slightly different setup on each type of system,the difference in the median values may only account for afactor of 1.1 in radiation dose differences (based on inversesquare law). Overall, median CAK and KAP were 45% and31% greater for Artis Q relative to AlluraClarityIQ systems.Subjective perception of image quality (by two interventionalradiologists) revealed significantly better scores for imagesobtained with AlluraClarityIQ systems.
There are several studies published regarding radiation dosesfor interventional fluoroscopy systems (2,3,13�15,18,20). Someof these studies have looked at patient monitoring and follow-up after potentially-high radiation dose procedures (3,14), whilesome studies have looked at cumulative radiation dose utilizationbased on all interventional fluoroscopy systems at a particular site(2,13). There are other studies that have looked at the impact ofvendor-specific product upgrades on radiation dose and imagequality (15,18); however these studies are limited to comparisonsof radiation dose and image quality for fluoroscopy systems fromthe same vendor (before and after upgrades). Another studycomparing radiation dose utilization between fluoroscopy sys-tems from different vendors was performed, but it was limitedto investigations utilizing phantoms only (20). The present studyis different from the above-mentioned studies because it incor-porates multi-vendor fluoroscopy systems for several commoninterventional procedures, including the same patients whowere treated for the same clinical condition by the same physi-cian on systems from different vendors. Such single-site multi-vendor comparisons are needed to identify differences betweenfluoroscopy systems from different vendors. Identification ofthese differences may pave a path for standardization betweendifferent fluoroscopy systems in terms of radiation dose utiliza-tion and acceptable image quality for similar procedures. Withthe growing trend of mergers and acquisitions in the healthcareindustry (23), multi-vendor sites are not uncommon and thus,standardization of protocols, procedures and workflows aredesired. Overall, investigation of radiation dose utilization forfluoroscopically guided interventional procedures between sys-tems from different vendors performed in this study revealed dif-ferences in radiation dose (and image quality) levels, that mayhave implications for radiation dose management.
Limitations of this study include comparison of multi-ven-dor systems at a single site, no calculation of peak skin dose tothe patient, subjective image quality assessment, retrospectivestudy design, and lack of proprietary information about thedose modulation and image processing features on Allura-ClarityIQ and Artis Q systems (that contributed to thereported differences in radiation dose and image quality).Peak skin dose calculation is based on CAK values reportedby the system taking into account other factors like source todetector distance (24), but these methods have been shownto have uncertainty as high as 50% (25). In the present study,
10
impact of differences in source to detector distances (a factorof 1.1) was less than the observed differences in median CAKvalues (45%) for the subset study. Thus, the calculated peakskin doses (based on CAK) would still be higher for Artis Qsystems relative to AlluraClarityIQ systems for these cases.The retrospective design prevented any potential bias by per-forming physician towards any type of interventional fluoros-copy system. Additionally, for the subset study, some of thepatients underwent the embolization procedure for the firsttime on the Artis Q system while other patients underwentthe embolization procedure for the first time on the Allura-ClarityIQ system. Therefore, there was randomization interms of the type of system used during the first embolizationprocedure which mitigates any bias originating from a physi-cian’s prior knowledge of patient anatomy. Variability in theoverall comparison of 4381 clinical cases (segregated by proce-dure type) may be substantial and attributed to confoundersincluding but not limited to operator ability, anatomy, patientbody habitus, equipment setting, study type, etc. But, the con-trolled subset analysis of 40 patients that underwent repeatchemo/immuno-embolization of the same lobe of the liver per-formed by the same physician on different systems substantiatesthe inference from the overall comparison of 4381 cases in refer-ence to radiation utilization between the two types of fluoros-copy systems. While interventional fluoroscopy systems fromlimited vendors (all vendors at the current site) were comparedin this study, such an analysis including systems from other ven-dors and different sites may highlight implications for radiationdose management. Given there were more AlluraClarityIQ sys-tems, the relative time spent by an interventional radiologist inan interventional radiology suite with ClarityIQ system is morethan it is with the Artis Q system, and that this may have con-tributed to the subjective evaluation of image quality. Lastly,subjective evaluation of image quality was performed in thisstudy for comparing different systems; objective evaluationsusing test phantoms would have been useful for image qualitycomparisons except that quantitative metrics derived from stan-dard fluoroscopy phantoms have been shown to lack the dis-criminatory ability to assess vendor-specific advancements ininterventional fluoroscopy systems1.
CONCLUSIONS
In conclusion, radiation dose and image quality differenceswere observed between AlluraClarityIQ and Artis Q systemsin phantom and clinical studies even for same patients treatedon both types of systems. When the differences were signifi-cant, AlluraClarityIQ systems showed lower radiation utiliza-tion and an increase in subjective perception of imagequality.
ARTICLE IN PRESSAcademic Radiology, Vol&, No&&,&& 2020 INVESTIGATION OF RADIATION DOSE
FUNDING
Research partially funded by a grant from Philips Healthcare(PIs: JKD and DJE). Only authors listed on the manuscripthad access to the data and reported results.
ACKNOWLEDGMENTS
We acknowledge the partial funding support provided byPhilips Healthcare towards this research study. The fundingsource did not have any role in data collection, data analysis,interpretation of data, and writing of this manuscript.
REFERENCES
1. National Research Council. Health Risks from Exposure to Low Levels ofIonizing Radiation: BEIR VII Phase 2. Washington DC: The NationalAcademies Press, 2006.
2. National Council on Radiation Protection and Measurements. Report168: Radiation dose management for fluoroscopically guided interven-tional procedures, Report 168, 325; 2010. In. Bethesda, MDRadiationdose management for fluoroscopically guided interventional proce-dures..
3. Balter S, Hopewell JW, Miller DL, et al. Fluoroscopically guided interven-tional procedures: a review of radiation effects on patients' skin and hair.Radiology 2010; 254(2):326–341.
4. Kim KP, Miller DL, Berrington de Gonzalez A, et al. Occupational radia-tion doses to operators performing fluoroscopically-guided procedures.Health Phys 2012; 103(1):80–99.
5. Struelens L, Bacher K, Bosmans H, et al. Establishment of trigger levelsto steer the follow-up of radiation effects in patients undergoing fluoro-scopically-guided interventional procedures in Belgium. Phys Med 2014;30(8):934–940.
6. Ukisu R, Kushihashi T, Soh I. Skin injuries caused by fluoroscopicallyguided interventional procedures: case-based review and self-assess-ment module. AJR Am J Roentgenol 2009; 193(6 Suppl):S59–S69.
7. Electronic Code of Federal Regulations. In: Title 21: Office of the FederalRegister, 2005
8. Bartal G, Vano E, Paulo G, et al. Management of patient and staff radia-tion dose in interventional radiology: current concepts. Cardiovasc Inter-vent Radiol 2014; 37(2):289–298.
9. Miller DL, Balter S, Dixon RG, et al. Quality improvement guidelines forrecording patient radiation dose in the medical record for fluoroscopi-cally guided procedures. J Vasc Interv Radiol 2012; 23(1):11–18.
10. Miller DL, Balter S, Schueler BA, et al. Clinical radiation management forfluoroscopically guided interventional procedures. Radiology 2010; 257(2):321–332.
11. International Atomic Energy Agency. IAEA-TECDOC-1641: Patient DoseOptimization in Fluoroscopically Guided Interventional Procedures.2010:110
12. Justinvil GN, Leidholdt Jr. EM, Balter S, et al. Preventing Harm FromFluoroscopically Guided Interventional Procedures With a Risk-BasedAnalysis Approach. J Am Coll Radiol 2019; 16:1144–1152.
13. Liu B, Hirsch JA, Li X, et al. Radiation dose monitoring for fluoroscopi-cally guided interventional procedures: effect on patient radiation expo-sure. Radiology 2019; 290(3):744–749.
14. Perry BC, Ingraham CR, Stewart BK, et al. Monitoring and follow-up ofhigh radiation dose cases in interventional radiology. Acad Radiol 2019;26(2):163–169.
15. Dave JK, Eschelman DJ, Wasserman JR, et al. A phantom study and aretrospective clinical analysis to investigate the impact of a new imageprocessing technology on radiation dose and image quality duringhepatic embolization. J Vasc Interv Radiol 2016; 27(4):593–600.
16. Nickoloff EL. AAPM/RSNA physics tutorial for residents: physics of flat-panel fluoroscopy systems: Survey of modern fluoroscopy imaging: flat-panel detectors versus image intensifiers and more. Radiographics2011; 31(2):591–602.
17. Seibert JA. Flat-panel detectors: how much better are they? PediatrRadiol 2006; 36(Suppl 2):173–181.
18. Soderman M, Holmin S, Andersson T, et al. Image noise reduction algo-rithm for digital subtraction angiography: clinical results. Radiology2013; 269(2):553–560.
19. Radvany MG, Mahesh M. Last series hold: a feature on fluoroscopy sys-tems with the potential to reduce patient and operator dose. J Am CollRadiol 2015; 12(8):860–861.
20. Wunderle KA, Rakowski JT, Dong FF. Approaches to interventional fluo-roscopic dose curves. J Appl Clin Med Phys 2016; 17(1):342–352.
21. Balter S. Reducing unnecessary radiation in fluoroscopically guidedinterventional procedures: vigilance and feedback are needed. Radiology2019; 290(3):750–751.
22. Lin PJ, Schueler BA, Balter S, et al. Accuracy and calibration of inte-grated radiation output indicators in diagnostic radiology: A report of theAAPM Imaging Physics Committee Task Group 190. Med Phys 2015; 42(12):6815–6829.
23. Bruno MA, Mosher TJ, Armah KO, et al. Playing well with others: thechallenge of academic and community radiology practice integration.AJR Am J Roentgenol 2019: 1–5.
24. Jones AK, Pasciak AS. Calculating the peak skin dose resulting fromfluoroscopically-guided interventions. Part II: case studies. J Appl ClinMed Phys. 2012; 13(1):3693.
25. Jones AK, Ensor JE, Pasciak AS. How accurately can the peak skin dosein fluoroscopy be determined using indirect dose metrics? Med Phys2014; 41:071913.
11