investigation of fundamental relationships to ... - unit load · ii investigation of fundamental...
TRANSCRIPT

Investigation of Fundamental Relationships to Improve the
Sustainability of Unit Loads
Jonghun Park
Dissertation submitted to the faculty of the Virginia Polytechnic Institute and State University in
partial fulfillment of the requirements for the degree of
Doctor of Philosophy
In
Forest Products
Laszlo Horvath, Chair
Robert J. Bush, Co-chair
Marshall S. White
Young Teck Kim
May 1, 2015
Blacksburg, Virginia
Keywords: Sustainability, Packaging, Pallet, Stretch wrap, Unit load, Containment force,
Compressive stress distribution, Unit load interaction, Pallet repair, Automation, Life cycle assessment,
Life cycle inventory

ii
Investigation of Fundamental Relationships to Improve the
Sustainability of Unit Loads
Jonghun Park
ABSTRACT
Sustainability is one of the most critical issues in today’s packaging and supply chain industries.
With the increase of environmental concerns, there has been a tremendous effort to improve packaging
sustainability. However, most of these works have focused on individual packaging components rather
than an integrated unit load. In global supply chains, three levels of packaging components (primary,
secondary, and tertiary) are commonly assembled in the unit load form to facilitate efficient and
economical storage and transport of goods to customers. Unit loads is important to improved, packaging
sustainability.
This study developed the fundamental information that facilitates understanding and enhanced
sustainability of unit loads from two different perspectives: physical interactions and end-of-life options
of unit load components. From the physical interaction perspective, the effects of various characteristics
of secondary and tertiary packaging components on load-bridging within unit loads are investigated..
Packaging component characteristics investigated included the flute type and size of corrugated
paperboard boxes, stretch wrap containment force, and pallet stiffness. From the end-of-life option
perspective, process methods and environmental impacts of wood pallet repair in the United States are
analyzed to provide fundamental information for accurate life cycle assessment of pallets.
The experimental results of this study demonstrate that the size of corrugated paperboard boxes
and stretch wrap containment force significantly affected the bridging of loads on pallets. The results
regarding load-bridging, verified in this study, provides essential knowledge regarding factors influencing
unit load deflection. Pallet design procedure should include the load-bridging effect. For simulated pallets
which was comparable to a stringer class wood pallet spanning the width of a storage rack, average
deflection in the unit load decreased by 70% when package size increased to 20 in. x 10 in. x 10 in. from

iii
5 in. x 10 in. x 10 in. In addition, average deflection in the unit load consisting of 5 in. x 10 in. x 10 in.
packages decreased by 50% when stretch wrap containment force increased to 30 lbs. from zero pounds.
Updated design methods that consider the effect of packaging characteristics on unit load deflection can
help to reduce the amount of raw materials required to build pallets using current pallet design
methodologies.
The life cycle inventory analysis results of this study determined that pallet repair is an
environmentally beneficial end-of-life option for 48 by 40- inch stringer class wood pallets in terms of
greenhouse gas generation. Most wood pallet repair firms in the United States utilized high levels of
manual labor with non-automated machinery support. The life cycle inventory results from this study can
be a useful resource for researchers as an input to the life cycle assessment.

iv
Dedicated to my family

v
ACKNOWLEDGEMENTS
This dissertation could not have been completed without the support, patience and guidance of
others.
I am deeply grateful to my advisor, Dr. Laszlo Horvath. I have been amazingly fortunate to have
someone who offered me opportunities to explore on my own and provided valuable guidance and
consistent encouragement. With wisdom and grace, he helped me overcome many frustrations and
challenges along the way.
My co-advisor, Dr. Robert J. Bush, has offered steadfast support, listening and providing advice
when I needed it. I would like to thank him for carefully reading and critiquing countless manuscript
revisions.
Dr. Marshall S. White’s insightful comments and constructive criticism at all stages of my
research and writing were thought-provoking and helped me focus my ideas. I also am grateful to him for
guiding me through the world of system-based unit load design research and for being a role model as a
successful packaging researcher.
I also would like to thank Dr. Young Teck Kim for offering continuous encouragement and
support despite his many other academic and professional commitments. He made a difference to this
work.
Thank you, too, to the following former and current members of The Center for Packaging and
Unit Load Design at Virginia Tech for their support during my studies: Matt Baker, Samantha
Phanthanousy, Erica Roesel, Steven Brown, Joe Dietrich, Michael Fortunato, Trey Good, Cyrus Adibpour,
Page Clayton, and Megan Stallings.
I also would like to express appreciation to the entire faculty, staff, and students of the
Department of Sustainable Biomaterials. Special thanks go to Philip Araman for his professional support;
Rick Caudill and David Jones for helping me prepare my testing arrangements and materials; and Angela

vi
Riegel for her administrative support. Many thanks also go to my colleagues Adrienn Andersch and Edgar
Arias for their help, advice and friendship.
The USDA Forest Service, Ongweoweh Corporation, and advisory members of the Center for
Packaging and Unit Load Design at Virginia Tech are gratefully acknowledged for providing financial
support for the research projects in this dissertation.
The National Wooden Pallet and Container Association (NWPCA), World Steel Association,
Packaging Corporation of America (PCA), Pallet Enterprise, Highlight Industries, and Berry Plastics also
were instrumental in supporting necessary research materials. Their contributions are greatly appreciated.
I would like to express my heartfelt gratitude to my teachers and mentors, Dr. Diana Twede, Dr.
Myunghoon Lee, Dr. Suil Park, and Dr. Yangjai Shin for encouraging me to pursue my interest in
Packaging Science research.
Most important, none of this would have been possible without the love, patience and support of
my family.

vii
Table of Contents
Chapter 1: Introduction .................................................................................................................... 1
Chapter 2: Literature Review ........................................................................................................... 6
2.1. Wood Pallets ........................................................................................................................ 6
2.1.1. Introduction of Wood Pallets ....................................................................................... 6
2.1.2. Wood Pallet Design ................................................................................................... 14
2.1.3. Testing Methods for Wood Pallets ............................................................................ 18
2.1.4. Refurbishment of Wood Pallets ................................................................................. 20
2.2. Corrugated Paperboard Box .............................................................................................. 24
2.2.1. Introduction of Corrugated Paperboard boxes ........................................................... 24
2.2.2. Compression Strength of Corrugated Paperboard Boxes .......................................... 26
2.2.3. Testing Methods for Corrugated Paperboard Boxes ................................................. 28
2.3. Stretch Wrapping of Unit Loads ........................................................................................ 31
2.3.1. Introduction of Stretch Film ...................................................................................... 31
2.3.2. Load Containment Force of Stretch Wrapping .......................................................... 33
2.3.3. Testing Methods for Evaluating Load Containment Force ....................................... 37
2.4. The Effect of Load-Bridging on Unit Load Design ........................................................... 38
2.5. Life Cycle Inventory Analysis for Wood Pallets ............................................................... 41
2.5.1. Introduction of Life Cycle Assessment (LCA) .......................................................... 41
2.5.2. Life Cycle Analysis Studies of Wood Pallets ............................................................ 43
2.5.3. Life Cycle Inventory Analysis ................................................................................... 47
Chapter 3: The Influence of Size and Flute Type of Corrugated Paperboard Boxes on Load-
Bridging in Unit Loads .................................................................................................................. 57
3.1. Abstract .............................................................................................................................. 57
3.2. Introduction ....................................................................................................................... 57
3.3. Materials and Methods ...................................................................................................... 59
3.3.1. Materials .................................................................................................................... 59
3.3.2. Testing Methods ........................................................................................................ 62
3.4. Results and Discussion ...................................................................................................... 64
3.5. Conclusion ......................................................................................................................... 70
3.6. Limitation .......................................................................................................................... 71
3.7. Acknowledgment ............................................................................................................... 71
References ................................................................................................................................ 71
Chapter 4: The Influence of Stretch Wrap Containment Force on Load-Bridging in Unit Loads . 73

viii
4.1. Abstract .............................................................................................................................. 73
4.2. Introduction ....................................................................................................................... 73
4.3. Materials and Methods ...................................................................................................... 74
4.3.1. Materials .................................................................................................................... 74
4.3.2. Testing Methods ........................................................................................................ 78
4.4. Results and Discussion ...................................................................................................... 82
4.5. Conclusion ......................................................................................................................... 91
4.6. Acknowledgements............................................................................................................ 92
References ................................................................................................................................ 93
Chapter 5: Process Methods and Levels of Automation of Wood Pallet Refurbishment in the
United States .................................................................................................................................. 95
5.1. Abstract .............................................................................................................................. 95
5.2. Introduction ....................................................................................................................... 95
5.3. Research Methods .............................................................................................................. 98
5.4. Results and Discussion ...................................................................................................... 99
5.4.1. Respondent Characteristics ....................................................................................... 99
5.4.2. Process Types, Equipment, and Pallet Repair Procedure ........................................ 104
5.4.3. Overall Automation Level of the Pallet Repair Firms ............................................. 108
5.5. Limitation ........................................................................................................................ 110
5.6. Conclusion ....................................................................................................................... 110
5.7. Acknowledgments ........................................................................................................... 111
References .............................................................................................................................. 111
Chapter 6: Life Cycle Inventory Analysis of Refurbishment Process for 48- By 40- Inch Stringer
Class Wood Pallet in the United States ........................................................................................ 114
6.1. Abstract ............................................................................................................................ 114
6.2. Introduction ..................................................................................................................... 114
6.3. Research Methods ............................................................................................................ 117
6.3.1. Unit Process and System Boundary......................................................................... 117
6.3.2. Data Sources ............................................................................................................ 120
6.3.3. Assumption and limitation ...................................................................................... 121
6.4. Results and Discussion .................................................................................................... 123
6.4.1. Material flow ........................................................................................................... 123
6.4.2. Greenhouse Gas (GHG) Emissions ......................................................................... 127
6.5. Conclusion ....................................................................................................................... 129

ix
6.6. Acknowledgements.......................................................................................................... 130
References .............................................................................................................................. 130
Chapter 7: Trials and Tribulations ............................................................................................... 133
7.1. Investigation of Influence of the Number of Packaging Layers on the Load-bridging. .. 133
7.2. Investigation of Influence of Handling Cycles on the Load-bridging. ............................ 135
Chapter 8: Summary, Conclusions, and Recommendations for Future Study ............................. 138
8.1. Conclusions ..................................................................................................................... 138
8.2. Limitations of Research ................................................................................................... 144
8.3. Recommendations for Future Study ................................................................................ 146
References .................................................................................................................................... 148
Appendix A: Results of statistical analysis for analyzing the influences of packaging size and
flute type on the unit load deflections .......................................................................................... 161
Appendix B: Results of the factorial ANOVA analyses to investigate the effects of the stretch
wrap containment force, the packaging size, and the stiffness of simulated pallet...................... 163
Appendix C: Three-Dimensional Diagrams for Pressure Data based on Assumed Symmetric
Response ...................................................................................................................................... 166
Appendix D: Schematic diagrams showing for averaged pressure values across the width of the
sensed area along the length of the simulated pallet .................................................................... 175

x
List of Figures
Figure 1. Triple bottom lines for sustainability (Elkington 1997). ................................................. 1
Figure 2. Typical design of stringer class wood pallet.................................................................... 8
Figure 3. Typical design of block class wood pallet. ...................................................................... 9
Figure 4. Typical regional wood species used for manufacturing pallets in the United States
(adapted from White 2012). ........................................................................................................... 11
Figure 5. Typical manufacturing process of a wood pallet (White and Hamner 2004). ............... 12
Figure 6. Example of International Standard for Phytosanitary Measures (ISPM) 15 Certification
stamp (IPPC 2009). ........................................................................................................................ 14
Figure 7. Example of pallet support modes (stringer class pallet shown)..................................... 16
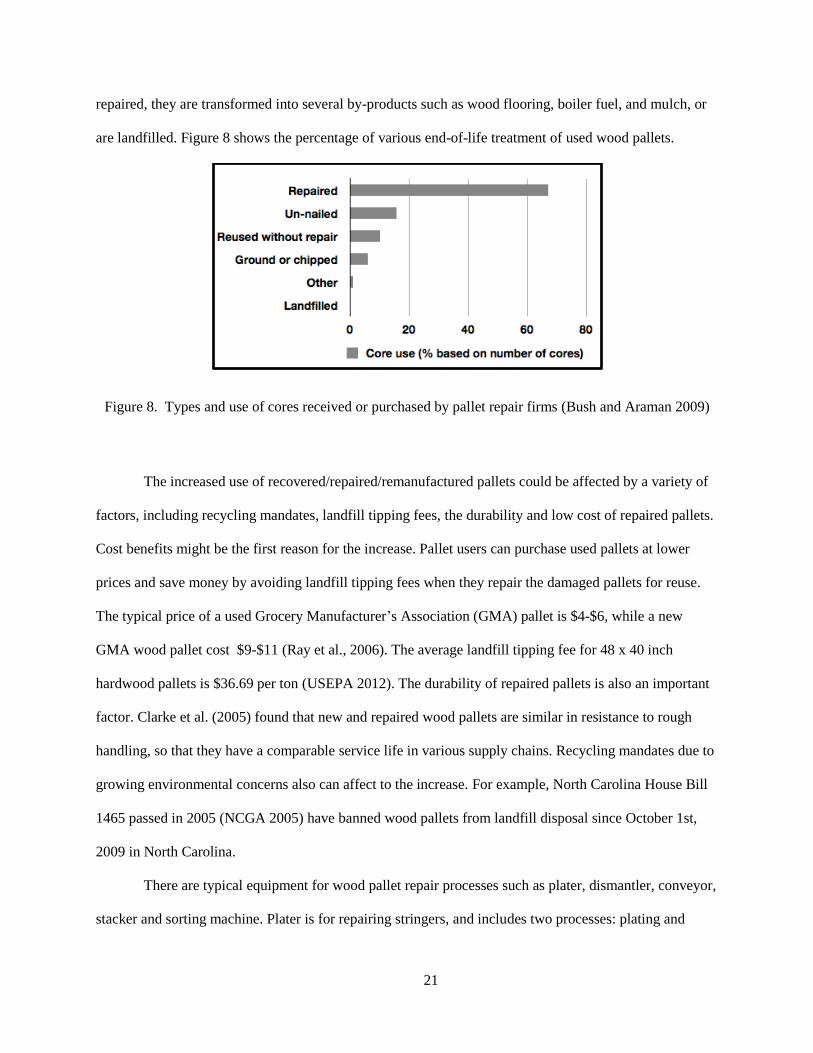
Figure 8. Types and use of cores received or purchased by pallet repair firms (Bush and Araman
2009) .............................................................................................................................................. 21
Figure 9. Typical wood pallet repair process in the United States. ............................................... 23
Figure 10. Types of corrugated paperboard. ................................................................................. 25
Figure 11. Orientation of corrugated paperboard. ......................................................................... 29
Figure 12. Critical stress/strain points and regions of stretch film (Bisha 2012). ......................... 34
Figure 13. Framework of LCA (ISO 1998). ................................................................................. 42
Figure 14. Procedures for life cycle inventory analysis (ISO 1998) ............................................. 48
Figure 15. Representative pallet samples used in this study: Stringer class wood pallet made of
Southern Yellow Pine (top-left), Block class wood pallet made of mixed hardwoods (top-right),
Single-use plastic pallet made of recycled polypropylene (bottom-left), and Multiple-use plastic
pallet made of polypropylene (bottom-right). ................................................................................ 60
Figure 16. Experimental set-up for unit load bending tests with the pressure pad. ...................... 64
Figure 17. Relative changes in the unit load deflection as a function of the flute type, packaging
size, and stiffness of simulated pallet............................................................................................. 67
Figure 18. Compression stress distribution between the packages and the simulated pallet
segments using different sizes of packages (The left side of the image shows the middle section of
the simulated pallet segment and the right side of the image shows the end of the simulated pallet
segment supported by a rack). ....................................................................................................... 68
Figure 19. Compression stress distribution between the packages and the simulated pallet
segments using corrugated boxes with different flute types (The left side of the image shows the
middle section of the simulated pallet segment and the right side of the image shows the end of
the simulated pallet segment supported by a rack). ....................................................................... 69
Figure 20. Structure of a unit load sample and experimental set-up used in this study. ............... 75
xi
Figure 21. Experimental set-up of the unit load bending test. ...................................................... 79
Figure 22. Experimental set-up of the simulated pallet bending test with rack support condition
using a flexible airbag to represent a non-bridged payload on top of the pallet. ........................... 81
Figure 23. Relative changes in the unit load deflections as a function of the containment force of
stretch wrapping, packaging size, and stiffness of simulated pallet. ............................................. 87
Figure 24. Changes in the stress distributions on the top of one quarter of the high stiffness
simulated pallets. ........................................................................................................................... 89
Figure 25. Changes in the stress distributions on the top of one quarter of the low stiffness
simulated pallets. ........................................................................................................................... 90
Figure 26. Wood pallet repair process investigated in this study. ................................................ 96
Figure 27. Geographical Regions used in this Study. ................................................................. 100
Figure 28. Distribution of Pallet Sizes Received by Responding Firms in 2012. ....................... 102
Figure 29. Process methods and equipment types ssed by United States pallet repair firms. ..... 106
Figure 30. Distribution of the automation scores of responded pallet repair firms. ................... 108
Figure 31. Flow diagram for the wood pallet repair process. ..................................................... 118
Figure 32. Greenhouse gas emissions generated during a repair process of a 48 by 40- inch
(1,219 by 1,016- mm) stringer class wood pallet. The results included the emissions embodied in
the feedstocks of all inputs. The credits due to the co-products (reported with negative values)
were considered in the results. ..................................................................................................... 128
Figure 33. The changes of unit load deflections due to the handling cycles on the low stiffness
simulated pallet. ........................................................................................................................... 136
Figure 34. The changes of unit load deflections due to the handling cycles on the high stiffness
simulated pallet. ........................................................................................................................... 137
xii
List of Tables
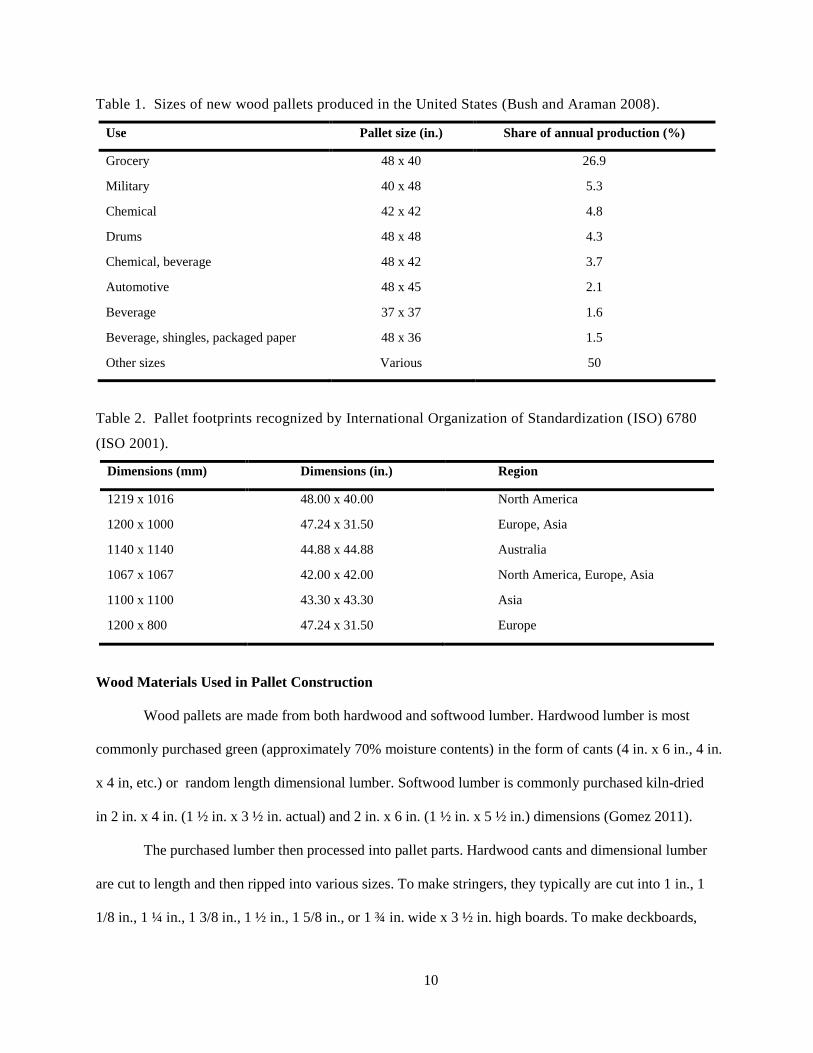
Table 1. Sizes of new wood pallets produced in the United States (Bush and Araman 2008). .... 10
Table 2. Pallet footprints recognized by International Organization of Standardization (ISO)
6780 (ISO 2001). ........................................................................................................................... 10
Table 3. Pallet testing protocols in International Organization of Standardization (ISO) 8611. .. 19
Table 4. Characteristics of corrugated paperboard flute type (adapted from Twede and Selke
2005). ............................................................................................................................................. 25
Table 5. Commonly used basis weight for liner and medium of corrugated paperboards (adopted
from Steadman 2002). .................................................................................................................... 26
Table 6. Three theoretical load-bridging cases (adapted from Collie 1984). ................................ 39
Table 7. Life cycle assessment software tools .............................................................................. 42
Table 8. Pedigree matrix for the data quality (adapted from Weidema and Wesnæ s 1996) ......... 54
Table 9. Default uncertainty factors (contributing to the square of the geometric standard
deviation) applied together with the pedigree matrix. ................................................................... 55
Table 10. Basic uncertainty factors applied for inputs and outputs; c: combustion emissions; p:
process emissions; a: agricultural emissions. ................................................................................. 56
Table 11. Description of pallets and simulated pallet segments investigated in this study. ......... 60
Table 12. Description of corrugated paperboard boxes used in the load-bridging tests as dummy
loads. .............................................................................................................................................. 61
Table 13. Experimental design to investigate the effect of size and flute type of corrugated
containers on unit load deflection. ................................................................................................. 62
Table 14. Average unit load deflection results as a function of different packaging sizes, flute
types, and pallet stiffness. .............................................................................................................. 66
Table 15. Description of pallets and simulated pallets investigated in this study. ........................ 75
Table 16. Description of unit load components used in this study. .............................................. 77
Table 17. Experimental design of the unit load bending test on simulated pallets. ...................... 78
Table 18. Average unit load deflections as a function of stretch wrap containment force,
packaging size, and stiffness of simulated pallet with Tukey’s HSD results to determine the
differences among containment force groups for each packaging size level and simulated pallet.
....................................................................................................................................................... 83
Table 19. Average unit load deflections as a function of stretch wrap containment force,
packaging size, and stiffness of simulated pallet with Tukey’s HSD results to determine the
differences among packaging size groups for each containment force level and simulated pallet.
....................................................................................................................................................... 84

xiii
Table 20. Results of Pearson Chi-Square analysis to investigate the associations between the
travel distance to collect cores and respondent characteristics (at the significance level 0.5). .... 103
Table 21. Type and source of background data used in this study. ............................................ 121
Table 22. Overall gate-to-gate LCI inputs associated with the repair process of a 48 by 40- inch
(1,219 by 1,016- mm) stringer class wood pallet in the United States. 4 ..................................... 124
Table 23. Overall gate-to-gate LCI outputs associated with the repair process of a 48 by 40- inch
(1,219 by 1,016- mm) stringer class wood pallet in the United States. ....................................... 126
Table 24. Selected cumulative atmospheric emissions generated during a repair process of a 48
by 40- inch (1,219 by 1,016- mm) stringer class wood pallet...................................................... 127
Table 25. ANOVA results for effects of the number of packaging layers on load-bridging. ..... 133
Table 26. Summary table of pallet deflection result for a unit load containing different number of
layers. ........................................................................................................................................... 134

xiv
ATTRIBUTION
This dissertation includes four original unpublished manuscripts. The ideas, development and
write ups of all the manuscripts in the dissertation were the principal responsibility of myself, Jonghun
Park, working within the Center for Packaging and Unit Load Design of Virginia Tech under the
supervision of Dr. Laszlo Horvath and Dr. Robert J. Bush. While the candidate was the primary
contributor to all chapters in this dissertation, the inclusion of co-authors reflects the fact that the work
came from active collaboration between researchers, and acknowledges input into team-based research.
Researchers who contributed to each chapter in this dissertation include the following:
Chapter 3: Jonghun Park, Laszlo Horvath, Marshall S. White, Philip A. Araman, and Robert J.
Bush.
Chapter 4: Jonghun Park, Laszlo Horvath, Marshall S. White, Philip A. Araman, and Robert J.
Bush.
Chapter 5: Jonghun Park, Laszlo Horvath, and Robert J. Bush.
Chapter 6: Jonghun Park, Laszlo Horvath, and Robert J. Bush.

1
Chapter 1: Introduction
Sustainability is one of the most critical issues in today’s packaging industry (Lewis 2005). The
term “sustainability” originates from silviculture, which means, that in the long run, only as much wood is
removed from the forests as grows (WCED 1987). The practice of silviculture gained renown and was
recognized in the The Brundtland Report, published by the World Commission on Environment and
Development (WCED) of the United Nations (WCED 1987). The report defined sustainable development
as “development to meet the needs of the present without compromising the ability of future generations
to meet their own needs” (WCED 1987). In 1994, John Elkington coined the phrase “triple bottom lines
(Figure 1) to advance sustainability in business practices, comprising three components: environmental,
economic, and social aspects (Elkington 1997)”. The concept of triple bottom lines (Figure 1) has been
considered to be the primary criterion for accessing the sustainability of a product or service (Hutchins
and Sutherland 2008). The three aspects should be balanced in order to achieve and improve the
sustainability of a product or service. The integration of economic, social, and environmental performance
to achieve sustainable packaging has been recognized as a major business challenge for the 21st century
(Verghese and Lewis 2007).
Figure 1. Triple bottom lines for sustainability (Elkington 1997).

2
Traditionally, packaging can be categorized into three levels according to function: primary,
secondary, and tertiary packaging (Saphire 1994, Johnsson 1998, Rushton 2010). Primary packaging,
such as food and beverage packaging, contains products, directly. Secondary packaging, such as
corrugated paperboard boxes and rigid plastic crates, houses the primary packaging. Tertiary packaging,
such as pallets, cushioning materials, and load stabilizers, provides additional functionality to primary and
secondary packaging, allowing for the effective handling, storage, and transportation of products. The
composition of the packaging system varies depending on supply chains and distribution channels (Chan
et al. 2006).
At some point in the supply chain, the three levels of packaging components are assembled in
unit load form to efficiently and economically store and transport goods to customers (White and Hamner
2005, Rushton 2010). The definition of the unit load is “a single item, a number of items, or bulk
materials which is arranged and restrained so that the load can be stored, picked up, and moved between
two locations as a single mass” (White and Hamner 2005). The concept of the unit load was developed
from the realization of the high costs and inefficiency involved in the storage and movement of individual
products (Rushton 2010). Approximately two billion unit loads are distributed daily throughout the
United States (White and Hamner 2005). The most frequently used unit loads in the U.S. are corrugated
paperboard boxes containing products stacked on a wood pallet with stretch wrapping (Twede and Harte
2003, White and Hamner 2005, Rushton 2010, Yoo 2011).
In terms of the triple bottom lines of packaging sustainability, the optimized design of unit loads
is significant. Overdesign of unit loads would certainly harm the environmental and economic aspects of
the packaging sustainability by increasing the mass and volume of the packaging materials and fuel
consumption for unit load transportation. Unit load components consume approximately 70 million dry
tons of wood fiber and generate 34 percent of the total greenhouse gas emissions emitted from municipal
solid waste in the United States (White and Hamner 2005). Designing unit loads with insufficient
materials and incorrect design methods is also harmful to all aspects of packaging sustainability by
causing unit load failures. Unit load failures can result in severe product damages and human injuries.

3
Incorrect packaging design causes an estimated $10 to $30 million per year in damages during unit load
distribution. Approximately one quarter of all occupational workplace injuries occur during material
handling processes and over half of the injuries are related to unit load failures (White et al. 2006).
Therefore, optimized unit load design provides a tremendous opportunity for conserving natural resources,
reducing total costs, and improving human health and safety.
In order to design optimized unit loads, it is critical to understandthe concept of system-based
design as developed by Marshall White at Virginia Tech (White and Hamner 2005). White emphasizes
that the key to developing a system-based unit load design approach is understanding how the various
packaging components mechanically interact with each other, material handling equipment, and
warehousing systems. This is important because the unit load is subjected to different static and dynamic
forces depending on the distribution environment. Therefore, investigating physical interactions between
the various packaging components of the unit load in different distribution environments is necessary to
enhance overall packaging sustainability.
Another factor that strongly influences the sustainability of unit loads is end-of-life options such
as recycling, reuse, refurbishment, or landfill disposal. The environmental impacts of the available end-
of-life options should be understood based on detailed and accurate analysis. Life cycle assessment (LCA)
is the most commonly used method to quantitatively evaluate the environmental impacts of a product
from raw material extraction to the end of its life. Life cycle inventory, which contains all input and
output values, is one of the most critical elements of the LCA. Incorrect or inappropriate life cycle
inventory data may result in biased or inaccurate LCA results and consequently restrict the choice for an
environmentally beneficial end-of-life option of a product (Reap et al. 2008). Reliable life cycle inventory
data, which has well-matched temporal, geographical, and technological scopes, is an essential resource
for selecting the appropriate end-of-life option and evaluating the overall sustainability of the packaging
components of unit loads.

4
Problem Statements
(1). Understanding of physical interactions of unit load components, which enables optimized
unit load design, is needed to enhance overall packaging sustainability as noted above. However, there is
a lack of knowledge regarding how the different components of unit loads mechanically interact with
each other. In particular, little information is available regarding the physical interactions between load
stabilizing methods and the performance of pallets. Information regarding the physical interactions
between characteristics of corrugated paperboard boxes and the performance of pallets has also not been
investigated.
(2). Although many studies have investigated packaging and pallet sustainability by life cycle
assessment, the end-of-life cycle disposition of the wood pallet is often ignored or assumed due to a lack
of detailed information regarding current technology and environmental impacts. In particular, incorrect
or inappropriate life cycle inventory data may result in biased or inaccurate life cycle assessment results
and consequently restrict the choice for an environmentally beneficial end-of-life option of a product.

5
Objectives
The purpose of this research is to provide the fundamental knowledge to improve the
sustainability of unit loads. The sustainability of unit loads is approached from two different perspectives:
1) physical interactions between unit load components, and 2) end-of-life option of unit load components.
The physical interactions between the secondary and tertiary packaging components of the unit load are
investigated to provide essential information for optimized unit load design, with a focus of load bridging.
The process methods and environmental impacts of wood pallet repair in the United States are analyzed to
provide important information on accurate life cycle assessment of pallets. The following specific
objectives are addressed:
Objective 1: Investigate influences of size and flute type of corrugated paperboard boxes on load
bridging within unit loads.
Objective 2: Investigate the effects of stretch wrap containment force on load bridging in unit loads.
Objective 3: Document the current status of wood pallet repair in the United States by identifying the
process methods and equipment usage in repair operation from an automation perspective.
Objective 4: Examine the environmental impacts of the wood pallet repair process in the United
States through life cycle inventory analysis.

6
Chapter 2: Literature Review
This chapter consists of five sections. The first three sections of this chapter provide fundamental
information on three primary packaging components of a unit load such as pallets (Chapter 2.1),
corrugated paperboard boxes (Chapter 2.2) and stretch wrap (Chapter 2.3). Chapter 2.4 examines
information regarding load-bridging in unit loads. Chapter 2.5 focuses on a discussion of life-cycle
inventory analysis of wood pallets.
2.1. Wood Pallets
2.1.1. Introduction of Wood Pallets
A pallet, the most common unit load platform, facilitates the transportation and storage of goods
in an efficient way (Bilbao et al. 2011). It has been a widely used component of material handling systems
since World War II (Guzman-Siller 2009). Palletized loads using shipping pallets could be transported by
air, ship and rail, due to the introduction of forklifts during the war. The U.S. Army and Navy used
approximately 75,000 forklifts, which is three times more than had been utilized in the entire U.S. before
the war. The efficient use of forklifts and pallets in material handling became important factors to the
success of the war (LeBlanc and Richardson 2003) and pallets are still widely used in today’s logistics
system.
While 2 billion shipping pallets made from several materials, including metal, paper, rigid
plastics, and composites are in circulation in the U.S., wood is estimated to account for more than 90
percent of the U.S. pallet market (Trebilcock 2013). Approximately 441 million new wood pallets are
manufactured each year in the United States (Bush and Araman 2008). The main advantage of wood
pallet is its high strength and stiffness compared to its weight , good durability, versatile functionality,
and low purchase price (Clarke 2004). Strength is the load carrying capacity throughout the shipping and
storage environments. Stiffness is the pallet resistance to deformation under load. Durability is the ability
to withstand damage and shock from the shipping and handling environments. Functionality is the pallet’s

7
compatibility with packaging and material handling equipment. The wood pallet price lower than pallets
made from other materials ($4-$25) (Kumar 2010), is often the most important factor for selecting pallet
types (Clarke 2004). Wood pallets also have some disadvantages. They can harbor pests, have splinters,
give off moisture, and fasteners that are used to assemble the components together can damage products
(Clarke 2004). Despite these weak points, the wood pallet is still a supply chain’s common dominator in
North America (Twede et al. 2007).
Two Classes of Wood Pallets
There are two main classes of wood pallet designs: stringer class pallets and block class pallets.
Stringer class pallets (Figure 2) are constructed from at least two stringers, multiple deckboards, and
fasteners. They are the most frequently used pallet in North America. Grocery Manufacture’s
Association’s pallet, which is the most commonly used pallet type, has the stringer class pallet style
(Clarke 2004). When their stringers do not have notches, the stinger class pallets limit either access on the
stinger sides for both pallet jacks and forklifts. If their stringers have notches, the pallets limit access on
the stringer sides for pallet jacks. Stringer class wood pallets generally cost less to manufacture than the
equivalent strength block class wood pallets.

8
Figure 2. Typical design of stringer class wood pallet.
Block class wood pallets (Figure 3) are constructed from rectangular blocks, multiple deckboards,
and fasteners. They allow full access on all four sides for both forklifts and pallet jacks. The full 4-way
accessibility is the main advantage of block class wood pallets. Due to the advantage in accessibility, the
nation’s most powerful retailers, Wal-Mart and Costco, demonstrated that they prefer block class pallets
(FPInnovations 2009). Wood pallet pooling companies such as CHEP (Commonwealth Handling
Equipment Pool) and European Pallet Pool mainly use the block class style. However, block class wood
pallets tend to require more material and more expensive than stringer class pallets.

9
Figure 3. Typical design of block class wood pallet.
Sizes of Wood Pallets
Various pallet sizes are manufactured and consumed depending on the application and geographic
region. For example, 48 in. x 40 in. pallets are mainly used in the grocery industry, while 42 in. x 42 in.
pallets are popular in the chemical industry (Table 1). The 1,100 mm x 1,100 mm and 1,200 mm x 1,000
mm pallets are the common sizes of pallets used in Asia and Europe, respectively, while the 48 in. x 40 in.
pallet is the most commonly used pallet in the United States (Table 2). Because standardized dimensions
allow for efficient production/transportation and cost reduction, the growth of domestic and international
trade has encouraged many industries and countries to standardize their pallet sizes for more efficient
shipment (ISO 2001). The standardization of pallet sizes, however, is not a simple issue, since there are
many infrastructures of supply chains and different regulations around the world.
10
Table 1. Sizes of new wood pallets produced in the United States (Bush and Araman 2008).
Use Pallet size (in.) Share of annual production (%)
Grocery 48 x 40 26.9
Military 40 x 48 5.3
Chemical 42 x 42 4.8
Drums 48 x 48 4.3
Chemical, beverage 48 x 42 3.7
Automotive 48 x 45 2.1
Beverage 37 x 37 1.6
Beverage, shingles, packaged paper 48 x 36 1.5
Other sizes Various 50
Table 2. Pallet footprints recognized by International Organization of Standardization (ISO) 6780
(ISO 2001).
Dimensions (mm) Dimensions (in.) Region
1219 x 1016 48.00 x 40.00 North America
1200 x 1000 47.24 x 31.50 Europe, Asia
1140 x 1140 44.88 x 44.88 Australia
1067 x 1067 42.00 x 42.00 North America, Europe, Asia
1100 x 1100 43.30 x 43.30 Asia
1200 x 800 47.24 x 31.50 Europe
Wood Materials Used in Pallet Construction
Wood pallets are made from both hardwood and softwood lumber. Hardwood lumber is most
commonly purchased green (approximately 70% moisture contents) in the form of cants (4 in. x 6 in., 4 in.
x 4 in, etc.) or random length dimensional lumber. Softwood lumber is commonly purchased kiln-dried
in 2 in. x 4 in. (1 ½ in. x 3 ½ in. actual) and 2 in. x 6 in. (1 ½ in. x 5 ½ in.) dimensions (Gomez 2011).
The purchased lumber then processed into pallet parts. Hardwood cants and dimensional lumber
are cut to length and then ripped into various sizes. To make stringers, they typically are cut into 1 in., 1
1/8 in., 1 ¼ in., 1 3/8 in., 1 ½ in., 1 5/8 in., or 1 ¾ in. wide x 3 ½ in. high boards. To make deckboards,

11
they are commonly cut into 3/8 in., 7/16 in., ½ in., 9/16 in., 5/8 in., 11/16 in., ¾ in., or 13/16 in. thick x 3
½ in. or 5 ½ in. wide boards. For softwood lumber, 2 in. x 4 in. boards are cut to length to make stringers
without an additional processing, while 2 in. x 4 in. and 2 in. x 6 in. boards are cut to length and then split
down the middle into 11/16 in. x 3 ½ in. or 5 ½ in. deckboards (White 2012).
Various hardwood and softwood species are used to make pallets in the United States. The typical
species growing in the U.S. are Oak, Spruce, Pine, Fir, Hemlock Fir, Douglas Fir, Yellow Poplar,
Southern Yellow Pine, and Ash (MH1 2005). The choice of species used for pallets depends on the firms’
availability in the particular regions (Figure 4), especially for recovered pallet manufacturing.
Figure 4. Typical regional wood species used for manufacturing pallets in the United States (adapted
from White 2012).

12
Manufacturing Process of Wood Pallets
A manufacturing process of wood pallets includes component dimensioning, notching (for
stringer class pallets only), and assembling (Figure 5); however, the wood pallet manufacturing processes
could differ, depending on the types of pallets and the equipment of the manufacturing facilities (Carrano
et al. 2014).
Leising (2003) stated that typically there are three types of manufacturing processes used in the
pallet manufacturing facilities based on the equipment type and their automation levels: manual process,
push pull semi-automatic process, and fully automatic manufacturing process. The manual processes,
table with hand held tools, are used by small facilities, and the processes can manufacture 100-150 pallets
per day with two workers. Push pull semi-automatic processes can make 400-500 pallets per day with one
worker. Fully automatic manufacturing processes, which use computer-aid systems, make approximately
1500 pallets per day with one worker (Leising 2003). Another study (Carrano et al. 2014) reported that
the manual process, semi-automatic process, and fully automatic process took average assembly times of
approximately 2 min per pallet, 1.5 min per pallet, and 0.5 to 1.0 min per pallet, respectively.
Figure 5. Typical manufacturing process of a wood pallet (White and Hamner 2004).
Notching stringers (Stringer pallets)
Ripping lumber into pallet parts
Cutting lumber to length
Sorting cants
Cutting cants
Assembling deckboards and stringers

13
There are some differences between the manufacturing processes used to make stringer class
pallets and block class pallets. The nailing pattern used to construct block and stringer pallets is different
since the assembly of a block class pallet requires different nail sizes and more complicated nailing
patterns than stringer class pallets due to its’ nine block structure. In addition, the stringer class pallet
typically has notching process for its’ stringers, while the block class pallet does not. Most pallet
manufacturing facilities are built around stringer pallet constructions in the United States; therefore, block
pallet manufacturing is a challenge to many pallet manufacturing facilities (Brindley 2008).
Phytosanitary Treatments of Wood Pallets
The uncontrolled global movement of some pests can cause their uncontrolled spread which
could adversely affect natural systems and human health. Due to their biological nature, freshly cut
lumber could harbor pasts thus all wood pallets intend to be used internationally need to undergo
phytosanitary treatment regulated by International Standard for Phytosanitary Measures (ISPM) 15 (IPPC,
2009). ISPM 15 is an UN treaty established in the International Plant Protection Convention (IPPC)
which is administered by Food and Agriculture Organization of the United Nations (FAO). All countries
agreed to IPPC should follow the requirements of ISPM 15, and establish their own National Plant
Protection Organization (NPPO) to manage and implement the regulation. ISPM 15 regulates not only
wood pallets but other types of wood packaging materials such as crates, boxes and dunnage.
There are two conventional treatment methods for phytosanitation of wood pallets: heat treatment
and methyl bromide treatment. Besides of the two methods, alternative treatment methods, which are not
standard methods, are under consideration.
During heat treatment, the core of wood pallets should be heated to a minimum temperature of 56
℃ for a minimum duration of 30 minutes (IPPC, 2009). The other method is the fumigation of wood
pallets using methyl bromide. According to ISPM 15, wood pallets should be fumigated with methyl
bromide at a minimum temperature of 10 ℃ and the minimum duration of 24 hours. Wood pallets treated
using heat treatment or methyl bromide fumigation are marked with a stamp (Figure 6) containing the

14
country code, identification of the treating company, and the type of treatment (HT for heat treatment MB
for methyl bromide treatment). Currently, the use of methyl bromide fumigation, however, is discouraged
to use because of its suspected toxicity by North American Plant Protection Organization (NAPPO).
Figure 6. Example of International Standard for Phytosanitary Measures (ISPM) 15 Certification stamp
(IPPC 2009).
2.1.2. Wood Pallet Design
To design pallets effectively, it is important to understand how various factors such as properties
of pallet materials, pallet support conditions, stiffness of nailed joints, and types of loads affect the
performance of the pallet.
Material properties of the lumber used in pallet construction should be verified to determine and
understand the mechanical behavior of a wood pallet. Since wood is a biological material, the quality of
lumber could be variable according to the presence of sound knots, unsound knots, loose knots, holes, and
splits (Heebink 1959).
Stiffness of deckboards is one of the most important material properties for estimating the overall
mechanical performance of pallets (Loferski 1985). The stiffness of pallet deckboards indicates the

15
serviceability limitations of pallets, since excessively deflected pallet deckboards prevent access of
material handling equipment. According to ISO 8611, the deflection limit of a pallet, which can determine
the load carrying capacity of the pallet, is 6% of the span in the pallet compression test with rack support
conditions. The top and bottom deckboards are assumed to be simply supported beams in designing
pallets; therefore, the overall pallet deflection is strongly associated with modulus of elasticity (MOE) or
stiffness of each of the pallet deckboards (Yoo 2011).
Pallets are subjected to different stresses depending on various storage and handling conditions.
Since pallets respond to load stresses based on various distribution conditions in different ways,
characterizing the distribution environment can be the initial step in designing safe and economical pallets
(Collie 1984). In warehouse storage, there are typically three support modes for the pallet (Figure 7): floor
stacked, racked across length support (RAL), and racked across width support (RAW). The floor stacking
mode is a common support condition in both transportation and storage, and palletized loads are often
stacked on the top of one another in this mode. The two rack support conditions generally are used in
warehouse storage to enhance mobility and space efficiency. According to Goehring and Wallin (1981),
the floor stacking condition is the most widely used supporting mode for pallets (69 percent of pallets),
followed by RAL (21 percent of pallets) and RAW support modes (10 percent of pallets). During
handling, pallets also experience various handling equipment such as forklifts, pallet jacks, and conveyors.

16
Figure 7. Example of pallet support modes (stringer class pallet shown).

17
The performance of pallets is directly affected by the compression stress of loads on the pallet
structure (Yoo 2011). Therefore, it is significantly important to examine how compression stress
distribution changes for each condition in order to understand the pallet performance for the different
support conditions.
In the floor stacking condition, some load is directly transferred to the stringers, while the
remaining load distributed over the top deckboards is transferred to the stringers as bending reaction. The
stress distributions across the pallet deckboards are mainly dependent on the number of stringers,
stringers spacing (span), and deckboard stiffness in this support mode (Loferski 1985). Collie (1984)
finds that more load stress was directly transferred to the floor through the stringers as the number of unit
load stacks increased. Therefore, the load distributed on the pallet deckboards decreased as the number of
unit load stacks increased when the pallets were dead piled in a stack.
In both rack support conditions (RAL and RAW), span between the rack supports and the widths
of the racked supports can be the most crucial factor to determine the pallet design (Fegan 1982). In the
RAL support condition, stringers of pallets are stressed as a simple beam or series of beams. Collie (1984)
states that beam equations could be suitable for determining the maximum load carrying capacity, pallet
deflections, and span of storage rack supports in the RAL support condition. The study also found that
adjustments should be required to estimate these values when the stringers had notches due to the stress
concentration on the notches. In the RAW support condition, top and bottom deckboards of pallets act as
a composite structure. (Collie 1984) mentions that higher stresses were concentrated on bottom
deckboards due to the loads transmitted through the center stringer and the smaller surface area of the
bottom deckboards in the RAW support mode.
Pallet joints typically are fastened with nails. Once loads are stacked on a pallet, the nailed pallet
joints have semi-rigid and nonlinear stiffness, and characteristics of the joints affect the structural
performance of the pallet with high variability (Yoo 2011). Several studies (Wilkinson 1983; Loferski
1985; Samarasinghe 1987; Colclough 1987) investigated and predicted the pallet joint behavior based on
different characteristics of fasteners and wood. These studies concluded that rotation modulus, which are

18
defined as the ratio of the applied moment to the angular rotation (Kyokong 1979), are the most critical
factor affecting the response of a pallet to stable loads.
The overall pallet performance also is influenced by various characteristics of loads on the pallet.
Detail information regarding the effects of load types on the pallet behavior is discussed in Chapter 2.4.
There are some computer-aided pallet design programs that enable wood pallet design, such as
Pallet Design System (PDS TM
) (NWPCA 1984) and Best Pallet TM
(White and Company 2011). These
programs assist in analyzing and improving pallet design based on performance and cost. Pallet Design
System (PDS TM
) was developed in cooperation with the Pallet and Container Research Laboratory at
Virginia Tech, the National Wood Pallet and Container Association (NWPCA), and the U.S Forest
Service. It is a computer-aided program to design pallets based on load type and support conditions using
structural analysis of wood pallets to optimize their performance and cost (Loferski 1985). Best Pallet TM
was developed by White and Company to design pallets and unit load modeling interactions between the
pallet, the packaging and the shipment to reduce costly time and testing of actual loads in a laboratory
setting (White and Company 2011).
2.1.3. Testing Methods for Wood Pallets
Two standardized testing methods typically are used to evaluate the physical performance of
pallets, such as ISO 8611 and ASTM D1185.
ISO 8611: Pallets for materials handling - Flat pallets includes various testing protocols to
evaluate nominal load, maximum working load, and durability of pallets. Both nominal load testing and
maximum working load testing contain test setups simulating different support conditions. The nominal
load means lowest safe load value for specified load support conditions without consideration of load
types; therefore, the nominal load testing was developed to compare pallet designs. The maximum
working load means the highest payload that a pallet is allowed to carry in a particular load support
condition; therefore, the maximum working load testing was developed to determine the load carrying
capacity of the pallet for a specific loading condition. It should be noted that the testing results of the

19
nominal load testing does not represent a payload and cannot be verified by field testing, while the results
of maximum working load can be verified for a particular payload by field testing. The durability tests
include static shear test, corner drop test, shear impact test, top deck edge impact test, block impact test,
static coefficient of friction test, and slip angle test. Table 3 shows the detailed testing types included in
ISO 8611.
Table 3. Pallet testing protocols in International Organization of Standardization (ISO) 8611.
Testing type Test measurement Handling activity or purpose of testing
Nominal load
Bending test Racking
Forklifting test Lifting with forklift/pallet jack
Compression tests for blocks or stringers Activity that compresses blocks/stringers
Stacking tests Stacking
Bottom deck bending tests Twin track conveyors
Wing pallet bending tests Lifting with slings
Maximum
working load
Bending test Racking
Airbag bending test Racking
Forklifting test Lifting with forklift/pallet jack
Stacking test Stacking
Bottom deck bending tests Twin track conveyors/narrow span racking
Wing pallet bending tests Lifting with slings
Durability test
Stack shear test Distortion resistance
Corner drop test Resistance to impacts
Shear impact test Distortion resistance
Top deck edge impact test Resistance to fork arms
Block impact test Resistance to fork tip
Static coefficient of friction test Slip resistance on fork arms
Slip angle test Slip resistance of loads

20
ASTM D1185: Standard Test Methods for Pallets and Related Structures Employed in Materials
Handling and Shipping also have testing protocols to measure the relative resistance of pallets. This
standard consists of a static compression and bending test section and a dynamic test section. The static
compression and bending test section guides pallet deformation measurement methods based on three
different load support conditions: fork-tine support (under the top deckboards or in the stringer notches in
stringer pallets), rack support (under the bottom deckboards), and sling support (under the top
deckboards). The dynamic test section of this standard includes testing protocols to determine the stability
of the pallet and unit load on the pallet in material handling environments: free-fall drop tests on pallet
corners and edges along pallet ends and sides, incline impact tests on pallet deck edges, blocks or posts,
and stringers, and vibration tests on loaded pallets.
Aside from these two standards above, there are other standards providing information for pallets
and related structures such as ANSI MHI: Pallets, Slip Sheets, and Other Bases for Unit Loads and AIAG
RC9: Returnable Container Performance Test Guideline. ANSI MHI covers a wide variety of
information regarding pallets and unit loads. Specifically, this standard includes testing methods to
evaluate not only pallet structures but also quality of fasteners used for assembling pallets. The AIAG
standard focuses on testing methods for containers and pallets used in the automotive industry.
2.1.4. Refurbishment of Wood Pallets
Recycling and remanufacturing used wood pallets is a growing trend in the U.S (REF). Newly
manufactured wood pallets are supplied to pallet users such as product manufacturers, retailers, and pallet
pooling companies. When pallets are broken or damaged while circulating through the supply chains, the
pallets are sent to pallet recycling facilities. After the damaged pallets are repaired, they can be resupplied
to the pallet users from the repair firms. According to a survey (Bush and Araman, 2009), repair for reuse
was the most frequent end-of-life option for used pallets received by repair firms. Therefore,
recovered/repaired/remanufactured pallet production has more than doubled (124%) from 1995 to 2006,
while new pallet production grew slightly (7%) during the same period. If damaged pallets cannot be
21
repaired, they are transformed into several by-products such as wood flooring, boiler fuel, and mulch, or
are landfilled. Figure 8 shows the percentage of various end-of-life treatment of used wood pallets.
Figure 8. Types and use of cores received or purchased by pallet repair firms (Bush and Araman 2009)
The increased use of recovered/repaired/remanufactured pallets could be affected by a variety of
factors, including recycling mandates, landfill tipping fees, the durability and low cost of repaired pallets.
Cost benefits might be the first reason for the increase. Pallet users can purchase used pallets at lower
prices and save money by avoiding landfill tipping fees when they repair the damaged pallets for reuse.
The typical price of a used Grocery Manufacturer’s Association (GMA) pallet is $4-$6, while a new
GMA wood pallet cost $9-$11 (Ray et al., 2006). The average landfill tipping fee for 48 x 40 inch
hardwood pallets is $36.69 per ton (USEPA 2012). The durability of repaired pallets is also an important
factor. Clarke et al. (2005) found that new and repaired wood pallets are similar in resistance to rough
handling, so that they have a comparable service life in various supply chains. Recycling mandates due to
growing environmental concerns also can affect to the increase. For example, North Carolina House Bill
1465 passed in 2005 (NCGA 2005) have banned wood pallets from landfill disposal since October 1st,
2009 in North Carolina.
There are typical equipment for wood pallet repair processes such as plater, dismantler, conveyor,
stacker and sorting machine. Plater is for repairing stringers, and includes two processes: plating and

22
corrugating. In the plating process, stringers are repaired taking two pieces of steel, and then clamping
them on the runner over a crack or bad spot. In the corrugating process, stringers are repaired shooting a
small piece of steel sideways into the crack on the runner. There are two types of dismantlers: pressure
type and band saw type. Pressure type means the dismantling pallet process with snapping the board off
the runner. Band saw type is more expensive than pressure type, but it can produce clean wood (Leising,
2003).
The equipment settings and types can be different depending on the business conditions of the
pallet repair facilities, which means that there is no standardized process for repairing wood pallets. The
most commonly used equipment could be classified as manually operated, semi-automatically operated
and fully automatically operated. The damaged wood pallets are typically repaired by adding additional
components such as companion stringers or metal plates to cracked stringers or replacing sound
deckboards to broken deckboards. The process types and equipment settings vary; however, since pallet
repair firms use different repair systems depending on their business conditions. Manual repair methods
using hand-held equipment such as hammer and saw still exist, while robotics system for pallet repair that
require minimal has recently been introduced to the industry. Standardization of repair methods can
improve the physical performance of repaired wood pallets (Clarke et al., 2005). Figure 9 describes the
typical wood pallet repair process.

23
Figure 9. Typical wood pallet repair process in the United States.
According to Leising (2003), three types of repair systems are generally used in the industry
based on specific repair systems: straight line system, over and under system and build on the fly system
The straight-line system is a conveyor belt system, using a slider bed conveyor with a completely flat top,
with a 42” belt and a 48” bed. Daily production rate of the conveyor belt system is 300-400 pallets by a
builder. The advantages of this system are compatibility of various pallet sizes and 100 percent of the
scrap wood contained by the conveyor preventing losing scraps. Over and under system uses roller-type
conveyor, a dead conveyor, and a scrap conveyor set up above the roller conveyor. CHEP, which is the
largest pallet pooling company, uses this system. Daily production rate is high, which is 500 pallets per a
builder. However, this system requires 4-6 builders on a line, and operates only one size a time. It also
needs high maintenance costs. Build on the fly system is combination of the two systems; therefore it is
the fastest process. However, this system requires expensive equipment, and pallet quality can be poor
(Leising, 2003).
Used pallets are dismantled to create spare parts for the pallet repair, if they are unfit for repair
Unload used pallets
Inspect/Grade used pallets
Sort/Stack used pallets
Repair used pallets(Nailing, Replacing, Plating)
Sort/Stack repaired pallets
Paint/Mark repaired pallets
Dismantle used pallets
Trim boards(optional)
Notch stringers(optional)
Load repaired pallets
Grind wood scraps

24
2.2. Corrugated Paperboard Box
2.2.1. Introduction of Corrugated Paperboard boxes
A corrugated paperboard box, also called a corrugated fiberboard box, is the most widely used
secondary packaging material in the world. In the United States, about 80% of paper packaging is used
for corrugated paperboard boxes (Twede and Selke 2005). It is typically used to contain, store, protect,
and transport goods as a secondary packaging.
The corrugated paperboard was first patented in the 1870s (Maltenfort 1996). In 1894, Tomas and
Norris developed the first double-faced corrugated board and the regular slotted container (RSC)-type
corrugated paperboard box. In early 1900s, the RSC box-making equipment was also developed (Twede
and Selke 2005). The Interstate Commerce Commission (ICC)’s Pridham Decision in 1914 opened up the
market for corrugated paperboard as a substitute for wood crates, while broadening motor freight and rail
carrier classifications to include the corrugated paperboard box (Frank 2014).
There are various styles of corrugated paperboard boxes depending on the design structure, such
as regular slotted container (RSC), half slotted container (HSC), full overlap (FOL), etc. The box styles
are defined by the European Federation of Corrugated Box Manufacturers (FEFCO) with 4-digit codes.
Among the various box styles, the RSC is the most common corrugated paperboard box (Twede and
Selke 2005). Except for the popular styles described above, there are a lot of customized corrugated
paperboard box styles used in the industry.
Corrugated paperboard, the primary resource of a corrugated paperboard box, consists of multiple
liners (flat sheet of paper) and mediums (corrugated sheet of paper). The design of the corrugated
paperboard is determined by the number of liners and the flute (medium) sizes. The overall thickness of
the corrugated paperboard, including both liners and flutes, is called the caliper. The caliper is often used
as a crucial factor affecting box compression strength. Depending on the number of liners and flutes, the
corrugated paperboard can be single-face (one liner), single-wall (two liners), double-wall (three liners),
and triple-wall (four liners). The single-face has one medium glued to a liner. The single-wall includes
one medium contained between two liners. The double-wall and triple-wall have two mediums between

25
three liners and three mediums between four liners, respectively. Figure 10 shows the structure of
different corrugated paperboard types.
Figure 10. Types of corrugated paperboard.
There are generally four types of flute sizes manufactured in the corrugated paperboard industry
such as A, C, B, and E, from the largest thickness to the smallest thickness. The strength of the corrugated
paperboard is related to the various combinations of the liners and flutes (McKee et al. 1963). Table 4
shows the characteristics of each flute type of the corrugated paperboards.
Table 4. Characteristics of corrugated paperboard flute type (adapted from Twede and Selke 2005).
Flute type Flute height (in) Combined board thickness (in) Flutes/feet
A 0.157-0.193 3/16-1/4 33 ± 3
B 0.087-0.118 1/8 47 ± 3
C 0.137-0.145 5/32 39 ± 3
E 0.039-0.071 1/16 90 ± 4
Each of the liners and mediums has a particular basis weight, which indicates the amount of fiber
by weight in a given area. It is measured in pounds per thousand square feet as well as grams per square
meter. The basis weight is one of the important parameters to predict the mechanical properties of the

26
corrugated and to control the quality of the corrugated paperboard. The combination of basis weight of
each liner and medium of corrugated paperboard typically is indicated as outside liner/medium/inside
liner, such as 38/33/38. Table 5 shows commonly used basis weight for liner and medium of corrugated
paperboards.
Table 5. Commonly used basis weight for liner and medium of corrugated paperboards (adopted
from Steadman 2002).
Linerboards Mediums
Pounds/1,000 ft2 Grams/1,000 m
2 Pounds/1,000 ft
2 Grams/1,000 m
2
26
33
38
42
47
69
125
150
175
200
225
330
26
28
30
36
40
42
125
140
150
160
200
200
2.2.2. Compression Strength of Corrugated Paperboard Boxes
Corrugated paperboard boxes are exposed to various static and dynamic compression hazards
during distribution. The corrugated paperboard boxes should have enough compression strength to protect
their products. From the 1940’s, many studies have tried to investigate factors that affect the box
compression strength, and provide predictive models for the box compression strength without
performing actual production and testing of corrugated paperboard boxes (Kellicutt and Landt 1958,
McKee and Gander 1957, McKee et al. 1962, McKee et al. 2963, Maltenfort 1963, Buchanan et al. 1964,
Koning and Moody 1971, Kawanishi 1989, Johnson et al. 1979, Johnson et al. 1980, Urbanik and Frank
2006, Beldie et al. 2001, Biancolini and Brutti 2003, Haj-Ali et al. 2009, Navaranjan and Jones 2010,
Viguie et al. 2011).
Among them, a formula published in McKee et al. (1963) (Equation 1), commonly called the
McKee equation, still is the most popular industry method to predict the box compression strength at

27
standard condition (73F, 50% RH). This predictive model particularly emphasized edgewise compression
strength values of boards as one of the most important factors that governs the overall compression
strength of corrugated paperboard boxes (McKee et al. 1963).
𝑃 = 5.87 𝑃𝑚 √ℎ√𝑍 [Equation 1]
Where:
𝑃 = Total box load, lb
𝑃𝑚 = Edgewise compression strength of combined board, lb/in.
ℎ = Combined board caliper, in.
𝑍 = Perimeter of box, in.
Other than the factors described in the McKee equation, there are numerous factors related to the
compression strength of corrugated paperboard boxes investigated by previous studies.
The various material properties of corrugated paperboard that significantly affect the compression
strength of corrugated paperboard boxes are: basis weight (Kellicutt and Landt 1958), flute size (McKee
et al. 1963), bonding quality (Koning and Moody 1969, Schaepe 2000), adhesive application (Frank 2014,
Popil et al. 2006, Whitsitt and McKee 1972), printing process (Kawanishi 1989), and amount of recycled
contents (Kirwan 2005, Almanza et al. 1993, Zhao 1993).
Design and manufacturing methods are important factors that affect the compression strength of
corrugated paperboard boxes. The factors include manufacturer’s joint (Kellicutt and Landt 1951, Singh
et al. 2009), presence and types of flaps (Kellicutt and Landt 1958, Kutt and Mithel 1969, Maltenfort
1980, Peterson and Schimmelpfenning 1982, Urbanik and Frank 2006, Gaur 2007), scoring profile (Frank
2014, McKinlay 1960, Kutt and Mithel 1969), sealing method (Maltenfort 1980, Maltenfort 1989, Koning
1995, Eriksson et al. 2001), holes (Jinkarn et al. 2006, Han and Park 2007, Kwak 2010), and inserts
(Surber and Catlin 1982, Maltenfort 1996).
Environmental conditions in a supply chain significantly affect the compression strength of the
corrugated paperboard boxes. The environmental conditions include time under load (Kellicutt and Landt
28
1958, Maltenfort 1996, Association 2005, Skidmore 1962), humidity (Kellicutt and Landt 1958, Whitsitt
and McKee 1972, Kawanishi 1989, Coffin 2005), and transportation and handling conditions (Godshall
1968, Urbanik and Saliklis 2003, Marcondes 1992).
2.2.3. Testing Methods for Corrugated Paperboard Boxes
There are various standardized testing methods to measure the properties of corrugated
paperboard such as the flat crush test, edge crush test, burst test, flexural stiffness test, and puncture test.
The Technical Association of the Pulp and Paper Industry (TAPPI) has widely used standardized testing
methods for evaluating the properties of corrugated paperboard. In most cases, test specimens and
atmosphere are preconditioned or conditioned according to TAPPI T402 before or during the tests.
Flat crush testing (FCT) (TAPPI T808) measures the corrugated medium’s ability to maintain
sinusoidal structure by compressing facing liners until the medium is crushed. The FCT result is
significant in determining the cushioning ability and durability of the corrugated paperboard. There are
various factors that affect the FCT values such as the size, shape, and basis weight of the flutes. The FCT
is performed by placing a flat sheet of corrugated paper under a compression tester and applying loads (25
lbs/sec) until the corrugated medium is crushed.
Edge crush testing measures the compression strength of a corrugated paperboard in the machine
direction or cross machine direction. ECT values have been recognized as one of the most important
factors that governs the overall compression strength of corrugated paperboard boxes (McKee et al. 1963).
There are various standardized methods to evaluate the ECT values such as the ring crush test (TAPPI
T818 and T822), Concora liner edge crush test (TAPPI UM801), Concora fluted edge crush test (TAPPI
UM811), short span test (TAPPI T826), edgewise compressive strength of corrugated board – short
column test (TAPPI T811), and edgewise compressive strength of corrugated fiberboard using the clamp
method (TAPPI T839). Among them, TAPPI T811 edge crush testing is the most widely used method for
measuring the ECT values today. It measures the corrugated paperboard sample (rectangular shape or

29
necked down shape) by applying loads parallel to the flutes. In order to prevent damage to the edge of the
testing samples, the samples are dipped in paraffin before the test.
The flexural stiffness test (TAPPI T820) measures the flexural bending stiffness of the corrugated
paperboard. The flexural stiffness of the corrugate paperboard is one of the key factors in predicting the
compression strength of the corrugate paperboard box (McKee et al. 1963, Buchanan et al. 1964,
Maltenfort 1989). This flexural stiffness test is performed by applying loads in four-points bending test
set-up. There have been various bending stiffness test methods using different testing set-ups such as two-
points bending test set-up, three-points bending test set-up, and four-points bending test set-up. Among
them, the four-point bending test according to the TAPPI T820 is preferred to other testing set-ups, since
it minimizes sheer stress in the tested area (Lee and Park 2004). This flexural stiffness test can be
conducted in both the MD and CD direction (Figure 11).
Figure 11. Orientation of corrugated paperboard.
Bursting strength test (TAPPI T807) measures toughness of the corrugated paperboard. This test
is conducted by clamping a specimen between two platens with circular openings, and applying hydronic
pressure until the specimen bursts. The testing results are useful in determining the resistance of the
corrugated paperboard to shipping damage (Maltenfort 1989).
MD: Machine DirectionCD: Cross-machine DirectionZD: Thickness Direction
MD
CD
ZD

30
Puncture testing (TAPPI T803) evaluates impact energy to puncture the corrugated paperboard by
using a pyramidal point connected to a pendulum arm. The puncture testing result indicates resistance of
the corrugated paperboard box to internal and external point pressure forces during handling.
There are two standardized methods used for evaluating the compression strength of the
corrugated paperboard box in laboratory conditions such as ASTM D642 and TAPPI T804. In both
methods, a corrugated paperboard box is placed between the platens of compression tester, and typically
the top platen moves down at a rate of 0.5 in. per minute to apply load to the box. Before starting the
compression test, a preload should be determined. Typical preload levels for single-wall boxes and
double-wall boxes are 50 lbs and 100 lbs, respectively (Urbanik and Frank 2006). Applying a proper
preload is significantly important in performing consistent measurements, since it can be an initial point
of measurement that is based on the height lost by the box (Surber and Catlin 1982). Once starting the test,
the load increases until a specified force is reached, or until box failure. The box compression test is
stopped at a failure point when there is noticeable buckling or structural damage. The first peak point at a
load-deflection curve is typically regarded as the point of failure (Frank 2014).
Two different approaches are used to perform a box compression test, depending on platen types
such as fixed platens or floating platens (Singh et al. 1992, Maltenfort 1996). While the platens uniformly
apply a load across the box in the fixed platen method, the floating platen method uses the top surface
mounted on a swivel to distribute the load itself across the surface of the box so that the weakest part of
the box makes the box fail. In the fixed platen method, maintaining parallelism at a certain level is
important in order to avoid the effect of uneven loading (Frank 2014). The platen type used for the box
compression test is one of the most critical issues in the corrugated paperboard box industry, since the two
methods can generate different results (Stone 2011).

31
2.3. Stretch Wrapping of Unit Loads
2.3.1. Introduction of Stretch Film
There are various types of load stabilizers, such as stretch wrap, stretch hoods, shrink wrap and
strapping to prevent packaging and unit load failures and increase load stabilization. Employing the
optimum unit load stabilization technique is of significant importance in reducing tertiary packaging costs
and product damage and preventing worker injuries. Among the load stabilizers, stretch wrapping using
stretch film is a commonly used method (Rogers 2011). Stretch film is an elastic polymer film that can be
wrapped around unit load to stabilize it during handling. The stretch film is typically made from linear
low-density polyethylene (LLDPE) due to its great elastic properties, puncture resistance, and market
acceptance.
Manufacturing Process
There are two different types of stretch films depending on the manufacturing process, such as
blown film and cast film. Each type of the stretch films has benefits and disadvantages due to different
material characteristics (Bisha 2012).
In the blown film manufacturing process, a polymer melt is extruded through an annular die. The
molten web is drawn upward by a take-up device. Air is supplied at the bottom of the annular die for
inflating the tube to form a bubble and control the pressure inside the bubble. The bubble is rapidly
cooled down and solidified using an air ring located above the die exit. The solidified bubble is flattened
by passing through nip rolls, which provide the axial tension required to pull the film upward to form an
air-tight seal (Han and Park 1975). The blown film is generally bi-actually oriented so that is preferred in
both the machine and cross machine direction. It has greater load retention and load coverage per foot of
film than the cast film (Cernokus 2012). The blown film is typically used as a hand wrap film (Bisha
2012).
In the cast film process, a polymer melt is produced by means of extrusion through a flat die. The
molten web pinned against chill rolls is stretched in air and cooled down, and then the film is slit

32
(Degroot et al. 1994). The cast film is generally used only in the machine direction, since typically it can
be uni-axially oriented. The cast process is preferred when the film needs to have multiple layers and
precise quality control (Bisha 2012). It also has better visual clarity than blown film; it has increased
reading and scanning ability, and creates less noise during the stretch wrapping (Cernokus 2012).
Application Methods of Stretch Wrapping
There are typically three stretch wrapping methods based on automation levels, such as manual,
semi-automatic, and fully-automatic (Singh et al. 2014). Manual stretch wrap application is performed by
a hand stretch wrapper. The roll width of the hand wrapping rolls can be between 5 in. and 20 in. (Bisha
2012). In the slow and labor-intensive wrapping process it is difficult to obtain consistent wraps that
tightly contain the load. Semi-automatic stretch wrapping machines apply the film mechanically, but still
require manual labor to move and set up the loads. Fully-automatic stretch wrapping machines do not
require any physical labor. The load is moved via conveyor, detected by photoelectric eyes, and wrapped
automatically by the stretch wrapping machine in the fully-automatic system. Stretch films for semi-
automatic and fully-automatic stretch wrapping machines are typically supplied on a 20-inch roll (Bisha
2012).
There are various types of stretch wrapping machines, such as turntable style, rotary arm style,
and orbital style. A turntable stretch wrapping system uses a rotating base to spin the load as a film
carriage applies the stretch wrap. The film carriage ascends and descends about a fixed mast. The
turntable system is at least expensive and slowest, wrapping 40 to 50 loads per hour (Rogers 2011). A
rotary arm stretch wrapping system applies stretch wrap with a film carriage that rotates horizontally
around a fixed load. This system is better suited for loads that are fragile, unstable, or too heavy for
turntable systems. It is also faster than turntable style, wrapping 100 to 120 loads per hour (Rogers 2011).
The orbital stretch wrapping systems apply stretch wrap with a film carriage that rotates vertically around
a fixed load. The load passes through the system horizontally.

33
2.3.2. Load Containment Force of Stretch Wrapping
Containment force is an inward force to keep a load together. The containment force is measured
in pounds or Newtons. Too much containment force can damage the products, while too little
containment force leads to load failure (Rogers 2011). A load can be securely held in place and safely
transported when proper containment force of stretch wrapping is applied (Cernokus 2012). There are
various factors that affect the load containment force such as the film properties, unit load type, wrapping
configuration, and temperature.
Elastic Properties of Stretch Film
Elasticity, particularly elastic recovery, is the most significant material property that makes
stretch film useful for unit load containment. Elasticity of a stretch film can be defined as an ability to
elongate when a pulling force is applied and relaxed.
Stretch film performs its function when the film is elongated and applied under tension. There are
several regions and points where the behavior of the stretch film changes as the film is stretched. The
region before the proportional limit is known as the linear elastic region. Once the stress reaches the yield
stress points, the film experiences permanent deformation with the continuous application of elongation.
There is no additional stress increase from this point. Strain hardening and necking occur between the
yield point and the breaking point (Peacock 2000). The strain hardening is where the percentage of
crystallinity of the film increases as the film is elongated. The necking means that the realignment of the
molecules causes the film to decrease in width. The increase of the crystallinity of the film beyond the
yield point makes the film stiffer (Hernandez et al. 2000). Figure 12 shows the critical points and regions
of stress/strain curves of stretch film.

34
Figure 12. Critical stress/strain points and regions of stretch film (Bisha 2012).
Due to the changes in material properties and behavior of the film when stretching the film, the
containment force of the film also changes over time (Bisha 2012). When the stretch film is elongated in
an elastic region, it tries to return back to its lowest energy state due to elastic recovery. Thicker film
leads to higher elastic recovery than thin film in the same condition. Higher elastic recovery causes a
higher containment force.
Bisha (2012) conducted experiments to establish a link between the applied stiffness and
containment force of stretch film and tensile stiffness properties. He attempted to create a model that
would predict the stiffness and containment force of stretch film on the unit load application using
stiffness and initial force determined during tensile testing. The correlation of the stiffness of stretch film
measured by tensile testing, the stiffness applied to the unit load and the containment force yielded
statistically significant results; however, the hypothesized simple linear model explained less than 50
percent of the total observed variations. The initial force of the stretch film stiffness measured by the

35
laboratory tensile testing might be better applied as part of a data set used to predict the behavior of
stretch film over time rather than the containment force of stretch film.
Unit Load Profiles
The unit load profile affects the containment force of the stretch wrap. There are three types of
load profiles, such as A-profile Load, B-profile Load, and C-profile Load. The A-profile load is a unit
load that is uniform in shape without protrusions or puncture hazards. This type of unit load is easy to
wrap and stabilize. The B-profile load is a unit load that has puncture hazards fewer than 3 inches. This
type of unit load is more difficult to wrap and stabilize than the A-profile load, since it is less uniform
stacking pattern than the A-profile load. The C-profile load means a unit load that has puncture hazards
over 3 inches. This load type is the most difficult to wrap and stabilize, since its shape is very irregular on
each face of the load. The containment force of A-profile load can be easier to measure and more
consistent than those of B- and C-profile loads due to its uniform shape during handling (Singh et al.
2014).
Wrapping configuration
Wrapping configuration of stretch wrapping machine, such as the number of layers, wrapping
pattern, and levels of pre-/post-stretch, significantly affects the containment force of a stretch film when it
is applied to a unit load.
The number of layers of the stretch film applied is the easiest way to change the containment
force of stretch wrap. More layers always provide stronger containment force.
The wrapping pattern of stretch wrap varies depending on wrapping sequence and overwrap
pattern. The stretch film can be applied from the bottom to top of the unit load and vice versa. It can be
applied with a consistent overlap ratio to a unit load, while it is possible to be overwrapped multiple times
top and bottom section of the unit load only. The typical amount of overlap between spirals is 40% to 80%
(Bisha 2012). The overlap pattern can be determined by changing speed of turntable and carriage of a

36
stretch wrapping machine. The containment force of the unit load can be changeable depending on the
variable wrapping patterns, even if the amount of stretch film applied is the same (Singh et al. 2014).
Pre-stretch is a process that stretches a film before it wraps a unit load. The level of the pre-
stretch can be controlled by changing the feeding speed of two rollers inside a film carriage of a stretch-
wrapping machine. This is an important process when the stretch film is applied to the unit load, since it
prevents the packaged units from being pulled from the load. Most stretch films can reach up to 400% of
pre-stretch (Cernokus 2012). While the level of pre-stretch had been considered a significant factor that
affects the containment force (Bisha 2008, Bisha 2012), a recent study (Singh et al. 2014) showed that
there was no strong correlation between the level of pre-stretch and the containment force. This study
recommended that applying a maximum pre-stretch level of stretch film might be the best choice to
reduce the amount of film used in the stretch wrapping of a unit load, even though there was no particular
relation between pre-stretch and containment force.
The post-stretch of stretch film is produced by creating tension between the load and the film
carriage. The tension-to-load increases when the stretch film is pulled out of the carriage due to the speed
of the turntable being higher than the speed of the feeding roller (Bisha 2012). The higher post-stretch
level leads to higher containment force in the elastic region of the stretch film when the stretched film
tries to return back to its initial form. The post-stretch level can be controlled by changing the speed of the
dace bar arm (Cernokus 2012).
Temperature
The tensile properties of stretch film are dependent on temperature. The polymer chains become
more fluid as temperature increases, while the chains become more rigid as the temperature decreases
(Bisha 2012). The temperature of the distribution environment should be checked before determining the
containment force, since the containment force varies depending on the temperature dependent tensile
properties of the stretch film.

37
2.3.3. Testing Methods for Evaluating Load Containment Force
There are various methods of evaluating the load containment force of stretch wrap. There are
standardized methods, while various force measurement devices and methods also exist in the packaging
industry.
ASTM D 4649-03, Standard Guide for Selection and Use of Stretch Wrap Films, describes the
terminology and testing methods used in the stretch wrapping process. In the standard, there are two
containment force measurement methods, such as a pull-plate method and a bathroom scale/strain gauge
method. Using the pull-plate method, the containment force of stretch wrap (pounds) is measured at a
hole located 10 inches from the top of the unit load and 18 inches from the side of the unit load using a 6-
inch diameter plate. Once the plate is pulled out from the unit load four inches, the operator can observe
the containment force. The bathroom scale/strain gauge method measures the containment force (pounds)
by locating the center of scale or gauge at 10 inches from the top and 18 inches from the side of the unit
load.
Lantech (2011) developed a patented tool for evaluating the containment force of stretch wrap.
This tool starts measuring the containment force by placing a thin measurement chain at the corner of the
unit load and positioning the hand held scale lever at the opposite end of the chain. A 10-inch piercing
finger is inserted behind the stretch film from the top edge of the unit load, while a fulcrum finger is left
outside of the stretch film. The device is rotated to touch the film until the indicator line is perpendicular
to the edge of the unit load (Bisha 2012). The containment force is then recorded by the hand-held scale.
Highlight Industries (2011) developed a portable containment force measurement system. The
device measures the containment force using load cells electrically connected to a wireless transmitter.
One, two, or three load cells can be used to measure the containment force at the top, middle, and bottom
of the unit load. The load cells are attached to each other with straps, while they are balanced by the
counterweights. Once the stretch film is applied over the load cells, the transmitter wirelessly sends the
data recorded by the load cells to a computer.

38
2.4. The Effect of Load-Bridging on Unit Load Design
An accurate load-support model with realistic characterization of load types, support conditions,
and structural members is essential in the unit load design process to provide safe, economical, and
serviceable products. Depending on the various load and support types, load distribution on a pallet can
be uniformly distributed, non-uniformly distributed, or concentrated at some particular parts. An
unrealistic load-support model only leads to incorrect results for the unit load design. At the same time,
developing the realistic load-support model can be a difficult process, since unit loads can have a wide
variety of product types, configurations, and material handling methods during transportation and storage
(Fegan 1982).
Due to the complexity of developing a model with the actual unit load conditions, it is generally
assumed that a common load is flexible and uniformly distributed on a pallet in designing a unit load. The
model based on the uniformly distributed load can be the most convenient way to design unit loads;
however, it can lead to significant errors in predicting actual results. In many cases packages do not
uniformly transmit load stress over a pallet, since most packages on the pallet are comprised of a series of
discrete loads that have inherent stiffness. The physical interaction between the packages adds stiffness to
the payload and causes the payload to bridge each other. This load-bridging can affect the deflection of
the unit load by leading to redistribution of loads from the center of the pallet to the support; therefore, the
structural behavior of the pallet is deviated from the uniform load model. The load-bridging could
potentially influence the load carrying capacity of the pallet by decreasing the maximum bending moment.
Packages located on the pallet sections that have concentrated load stress can be damaged if the packages
are designed based on the uniformly distributed condition. The load-bridging effect only occurs when the
pallet deflects; therefore, the effects of load-bridging on the pallet behavior is particularly evident when
the unit load is stored in racks (Collie 1984).
Table 6 shows examples of hypothetical levels of load-bridging. A load analog on a simple
supported beam and corresponding moment diagram are described for each loading case. The first
loading case represents the minimum load-bridging case, in which most of the small boxes remain

39
uniformly in contact with the pallet. The pallet members deform relative to their moduli of elasticity and
joint stiffnesses in this loading case. The second and third loading cases show medium and high load-
bridging cases, in which the points of load application shift towards the edge of packages. In all loading
cases the load stress distribution on the pallet can deviate more from the uniform load distribution as the
friction force between packages increases, since more friction force restricts the up and down slippage of
the packages. The load analog, which affects the pallet performance, is changed as the load redistributes
(Collie 1984).
Table 6. Three theoretical load-bridging cases (adapted from Collie 1984).
Expected bridging Load description Load analog Moment diagram
Small
Medium
High
There are various potential factors that affect the load-bridging force of a unit load: containment
force through the application of load stabilizers, packaging geometry, packaging stiffness, stacking
patterns, number of layers of a unit load, and friction between layers. Three studies (Fegan 1982; Colie
1984; White 1999) represent the first attempts to define the load-bridging effects of a unit load. The
studies helped to confirm that there is a certain deviation from the assumption of load uniformity due to

40
load bridging of some unit load components, such as packaging types, stacking patterns, pallet stiffness,
and load stabilizers.
Fegan (1982) conducted laboratory experiments to determine the impact of load bridging of a unit
load on pallet responses using four load types, each having different load-bridging levels, and six pallets,
each having different moduli of elasticity (MOE). The four load types – air bag (uniform loading without
load bridging), column-stacked boxes (small amount of load bridging), interlocked stacked boxes
(medium amount of load bridging) and platen-type loading (extreme load bridging) – were tested on a
uniform load pallet tester. The author measured the pallet deformation at three locations of the pallet: the
center and two sides. He found that based upon loading type, there was a statistically significant effect on
center deflection, while pallet sides were not significantly affected by loading type. This study contributed
to the finding that there is a relationship between load bridging and load characteristics.
Collie (1984) also performed laboratory experiments to determine the load-bridging effects based
upon different levels of pallet stiffness. He tested the load-bridging effects using five load treatments –
large boxed goods (extreme amount of load bridging), interlocked stacked boxed goods (medium amount
of load bridging), column stacked boxed goods (medium amount of load bridging), bagged goods (small
amount of load bridging) and air bag (uniform loading without load-bridging) – with three different
pallets, each having a different level of stiffness (low, medium, and high). He found that load bridging
occurs predominantly in pallets of low stiffness that are racked across the deckboards. He also
emphasized that use of the uniform load analog in designing a pallet can lead to overestimations of
deflection and maximum strength if the unit load has a high stiffness level and the pallet has a relatively
low stiffness level.
The effect of existence of unit load containment on the load bridging effect of unit load has been
investigated by White (1999). The initial findings were also published in ISO 8611-3 (ISO, 2011) as a
guideline. The study found that packaging rigidity and containment force of load stabilizers of unit loads
influenced pallet deflections. However, the levels of packaging rigidity and load containment force of the
load stabilizers were not quantitatively measured and controlled in the study. This lack of specificity in

41
guidance has limited packaging engineers’ ability to calculate the appropriate maximum capacity of a unit
load.
2.5. Life Cycle Inventory Analysis for Wood Pallets
2.5.1. Introduction of Life Cycle Assessment (LCA)
Within the increasing concerns about sustainable packaging, various quantitative and qualitative
methods have been developed to support decision making around environmental strategies of packaging
development. The primary quantitative methods include Life Cycle Assessment (LCA), Cumulative
Energy Requirement Analysis (CERA), and Environmental Risk Assessment (ERA) (Wrisberg, 2004).
The qualitative methods typically use a scorecard type tool for the sustainability evaluation, such as Wal-
Mart packaging scorecard and Osmalts and Dominic scorecard.
Among them, LCA is mostly used in the packaging industry as a technique that quantifies the
environmental impacts of a product or system through its’ entire life cycle. LCA is defined as ‘a
systematic method to analyze environmental implications associated with products, processes, and
services through the different stages of their life cycle’ (ISO 1998). Starting from materials and energy
acquisition, it covers transportation, manufacturing, construction, use, operation maintenance, repair, and
end-of-life treatment (reuse, recycling, incineration, landfilling) (Curran 1996).
There are four stages of life cycle analysis in a framework of LCA: goal and scope, life cycle
Inventory analysis, life cycle impact analysis and interpretation (ISO 1997). First, the goal and scope of
the study defines the objectives, the system boundaries to be considered, the functional unit, data choices,
and the environmental impact categories (ISO 1998). The life cycle inventory analysis of the study
collates and compiles the inputs and outputs of the system (ISO 1998). The life cycle impact assessment
of the study takes these inputs and outputs and presents their impact against the chosen environmental
impact categories (ISO 2000). Last, Interpretation of the study is the process used to interpret and
compare results from options (ISO 2000). Figure 13 shows the ISO framework of LCA.

42
Figure 13. Framework of LCA (ISO 1998).
LCA software tools assist to approach complex processes and analyze collected data in a clear
way. There is a large variety of software tools for conducting LCA. Among them, SimaPro (Pre
Consultant 2012), GaBi (PE International 2011), BEES (NIST 2010) and Umberto (Hamburg 2011) are
the most commonly used LCA software for various fields. Besides them, there are LCA tools focusing on
particular industries, such as EcoCalculater (ATHENA 2011) for building construction industry and
COMPASS (GreenBlue 2012) for packaging industry. They have similar concepts in that they are along
with ISO standards, but each program has own characteristics based on purposes or treatment ways of
impact factors. Table 7 shows the LCA software tools generally used.
Table 7. Life cycle assessment software tools
Software Developed by Target industry
SimaPro 7.3 (Pre Consultants, 2012) General
GaBi 5 (PE International, 2011), General
BEES 4.0 (NIST 2010) General
Umberto (Hamburg, 2011) General
CMLCA (Leiden University, 2012) General
Quantis Suite 2.0 (Quantis 2009) General
IDEMAT (TU Delft, 2012) Industrial Design Engineering
TEAM (Ecobilan 2011) General
EcoCalculater (ATHENA 2011) Building construction
COMPASS (GreenBlue 2012) Packaging

43
LCA is used in various industries due to its’ holistic and systematic approach for evaluating
environmental impacts. At the same time, there are various limitations and problems in LCA
methodology. Reap et al. (2008) assessed the issues of LCA using survey to LCA practitioners. Fifteen
major problems were revealed, and they are grouped into the four stages of ISO LCA framework. At the
goal and scope definition stage, decisions about inclusion and exclusion for defining the system boundary
were the main issue. Suh et al. (2004) also emphasized the practical problems for drawing the system
boundary: “The subjectivity of system boundary selection allowed by the ISO standards is one of the key
aspects of a lack of confidence in LCAs (Suh, 2004, pg. 658)”.
At the inventory analysis stage, allocation problem, which results from the need to accurately
associate flows from a multifunctional process to each related unit processes, was the main issue. The
lake of generic databases and the ignorance of local technical uniqueness were reported as another serious
issues at the inventory analysis stage.
Truncations and assumptions about global homogeneity and steady-state conditions were the
major problems in the impact analysis stage. Weighting and valuation problems, which include
subjectivity, were the most serious issue at the interpretation stage. The inadequate weighing and
valuation can completely change the results that have been carefully collected through the former stages
(Reap et al. 2008).
Another weakness of LCA is that the results can be interpreted as practitioners’ intention. LCA
conducted or commissioned by industry sectors particularly can generate biased conclusions.
2.5.2. Life Cycle Analysis Studies of Wood Pallets
In pallet industry, like other packaging sectors, there have been various attempts to investigate the
environmental impacts of pallets using the LCA.
Franklin Associates (2007) conducted research for CHEP America, Life cycle inventory of wood
pallet systems, to provide life cycle inventories for three different types of pallet systems: CHEP pallets,
Grocery Manufacturers Association “one-way” pallets, which have two lifetime trips per a pallet, and

44
GMA multiple-use pallets, which have six lifetime trips per a pallet. This study used data provided by
CHEP for 2006 operations. Also, it based its analysis on information from the U.S. LCI Database, which
was developed by the National Renewable Energy Laboratory, a research division of the U.S. Department
of Energy. The data used were reuse and repair rates, material usage for pallet repairs, disposition of
CHEP pallets and pallet materials removed from service. For one-way pallets, the study used NWPCA
data on reuse, repair, recycling, and disposal rates collected from pallet recyclers in 1999 (updated in
2006). The functional unit for comparison is 100,000 pallet loads of product delivered.
The research does not include the pallet repair stage and energy for pallet dismantling at the end
of their useful life, while it covers most life cycle stages of products’ life cycle from raw materials to end-
of-life. It states that the amount of energy requirements for pallet repair will not affect study conclusions
since it might be minimal, and it assumes dismantling process is from manual labor, which does not
generate energy demand or have an environmental impact since there is no energy data for the process.
Environment Resource Management (ERM, 2008) conducted a life cycle analysis project for
Intelligent Global Pooling Systems (iGPS) Company LLC, to compare HDPE plastic pooling pallets,
multi-use wood pallets and single use wood pallets. The functional unit for comparison was 100,000 trips.
This report included the entire life cycle of pallets from raw material to end-of-life in its’ system
boundaries of the multi-use wood pallet life cycle analysis scenario. However, the project states that data
of specific energy consumption for pallet assembly, water use, water waste, solid waste and air emission
for the manufacturing process were assumed, since these data were not available for pallet manufacturing.
Also, the location of manufacturing, inspection, and repair facilities were estimated based on publicly
available information because the data were not able to be obtained from pooled wood pallet suppliers.
Gasol et al. (2008) performed a life cycle analysis study in Spain for comparison among different
reuse intensities for industrial wood containers. The study compared environmental impacts of four
scenarios: high-reuse pallet, low-reuse pallet, low-reuse spool and null-reuse spool. The functional unit
for the pallet systems was to satisfy the transport necessity for 1000 tons by road of a product whose
density was 1 t/m3 with wood pallets. The pallet case studies data were provided by CHEP, and the spool

45
case studies data were from FACEL (Spanish Association of Cable, Electric conductors and Fiber optic
manufacturers). The system boundaries of the study included raw material extraction, process chain, use,
maintenance and final disposal. This study had the life cycle inventory for the wood pallet maintenance
stage. The maintenance stage was carried out manually on those pallets that were easily reparable and
consisted of nail and nut readjustment, board substitution or both. This study states that paying attention
to the maintenance stage, which was the lowest impact stage, could significantly reduce the impact of the
remaining stages.
Lee and Xu (2005) conducted a streamlined life cycle analysis in New Zealand of a conventional
wood pallet system and a plastic bulk transit packaging system. The functional unit was one unit of the
wood pallet and the plastic packaging system each. The system boundary of this study included raw
material extraction to disposal, but did not include the wood pallet repair data at the recycling stage.
TNO (1994) conducted a life cycle analysis in the Netherlands of multiple use wood pallets and
multiple use synthetic pallets for the Netherlands Packaging and Pallet Industry Association. The
functional unit of the analysis was the use of a multiple wood pallet and a multiple high-density
polyethylene pallet for 1,000 times. The analysis performed entailed the extraction of raw materials all the
way through to the processing of residues. The wood pallet repair stage was included in the system
boundary.
Walker (1995) performed a life cycle analysis of eight types of nestable plastic and wood pallets.
They investigated the quantification of economic costs through the total cost for material acquisition,
manufacturing, and disposal. The study focused on modeling pallets’ life cycle in terms of durability than
environmentally oriented life cycle analysis, which is ISO 14040 life cycle analysis method. The authors
developed a systematic evaluation tool to be used for the durability of pallets to define the pallets’ life
cycle.
Philip (2010) discussed each of the life cycle stages of wood pallets and plastic pallets. The main
objective of the study was to compare environmental and economic impacts of three phytosanitary
treatment methods for wood pallets such as heat treatment, methyl bromide fumigation and radio

46
frequency. The study covered wood pallets’ entire life cycle in its system boundaries, a company in the
Northeastern part of the United States collected the inventory data. However, specific inventory data for
wood pallet repair was not listed and stated in this study.
Ali (2011) conducted a life cycle impact comparison throughout Europe of three types of pallets
such as plastic, corrugated fiberboard and hybrid pallets made of wood and plastic. The functional unit for
comparison was 1,000 pallet loads of product delivered. This study assumed energy and emission data at
the recycling process of pallets.
Carrano et al. (2014) measured the global warming potential of wood pallets using life cycle
assessment. The study investigated three different types of stinger class wood pallets such as expandable,
single-use, and multiple-use stringer class wood pallets. The study collected inputs and outputs from
dozen of pallet manufacturing companies in the United States (East and South regions) by direct
observations. Direct observation may be the best method to collect input and output data for new pallet
manufacturing due to the relatively standardized manufacturing process; however, the data collection
method might not cover variability in the pallet repair process. For example, there is variability in
material consumption during repair, since each damaged pallet has different pallet failure modes and
damage severity. In order to consider the variability of inputs for each damaged pallet, collecting data
based on the annual bill of materials for the pallet repair facility could be more accurate for data
collection than by observing the pallet repair process. Moreover, specific inventory data for the pallet
repair process were not listed in the study.
After a review of past LCA literature, it can be seen that the researchers excluded or assumed
pallet repair systems in the system boundaries due to a lack of life cycle inventory data regarding the
repair process. Even if a study includes the pallet repair process in its system boundary, specific
information about life cycle inventory data was not indicated. This insufficient information restricts to
analyze the end-of-life option in future LCA study.

47
2.5.3. Life Cycle Inventory Analysis
Life cycle inventory (LCI) analysis is a process of accounting raw material and energy
requirements, air, water and land emissions, pollutant releases, solid wastes for the whole life cycle of a
product, process, or activity. All relevant data including indirect changes in other systems are reported in
the life cycle inventory phase of an LCA. Therefore, the accuracy level of the LCI results affect
throughout all LCA stages (EPA 2006). The insufficient availability of generic databases in LCI is often
the largest barrier for conducting LCA. LCI is the most time-consuming phase of an LCA if readily
available data such as national and global databases are not available (Guinée and Heijungs 2000).
In the United States, the Department of Energy (DOE) and the U.S. Department of Agriculture
(USDA) have developed LCI databases from the government side. In 1993, The LCAD database, which is
no more available, was first conceived at DOE. In 1999, Argonne National Laboratory released the
Greenhouse Gases, Regulated Emissions, and Energy Use in Transportation (GREET) model. The
GREET data has been updated focusing on alternative fuel sectors. Due to the increasing demand of LCI
database, the National Renewable Energy Laboratory (NREL) of the U.S. Department of Energy initiated
the U.S. Life Cycle Inventory Database project (NREL 2012) in 2001. The database includes 593 U.S.
data sets representing limited industry sectors. In 2009, NREL announced the development of a database
roadmap (DOE 2009) and updated data submission requirements. More recently, the U.S. Department of
Agriculture (USDA) created the LCA Digital Commons (USDA 2012), which is scheduled to release 667
field crop data sets with specific geographic and time information (Cooper, 2012).
From the academic side, two universities in the U.S. developed different approaches for LCI.
Researchers at Carnegie Mellon University first developed the economical input-output methods
(EIOLCA) in 1995, and Dr. Sangwon Suh, a professor of University of California-Santa Barbara released
Comprehensive Environmental Data Archive (CEDA) (Suh 2010) in 2004 (Cooper, 2007). The unit
process life cycle inventory (UPLCI) methodology, which was begun by Society of Mechanical Engineers
in 1995, are also still updated focusing on several manufacturing unit processes such as drilling and
injection molding (Overcash, 2012).

48
Ecoinvent data sets (2010), which is the most commonly used LCI database around the world,
also includes some data sets for U.S. operation conditions. Since the public databases for the U.S.
operation is lake, the Ecoinvent data sets are often indirectly adapted. These public LCI databases above
are actively used in various software programs.
2.5.3.1. Procedure of Life Cycle Inventory Analysis
Life cycle inventory analysis is based on the unit process. Depending on the system boundary of
an LCA, either the entire operation can be considered a unit process or the operation is divided into
multiple sub-processes (Guinée and Heijungs 2000). Figure 14 describes the procedures for life cycle
inventory analysis from ISO 14041 (ISO 1998).
Figure 14. Procedures for life cycle inventory analysis (ISO 1998)

49
According to EPA documents (EPA 1993;1995;2006), there are four steps to LCI analysis:
developing a flow diagram, determining an LCA data collection plan, collecting data, and
evaluating/documenting the results.
Developing a flow diagram
A flow diagram is a mapping tool for organizing various inputs and outputs within the system
boundaries of a study. An efficient way to gather data is to consider the system as a series of subsystems
that are individual processes. If there is no specific data for an individual process, then some processes
can be grouped into a subsystem. Particularly, if the processes all occur within the same facility, then the
process data may not need to be broken down for each individual step (EPA 2006). Input types (e.g.,
materials and energy) and output types (e.g., environmental emissions, solid wastes, and co-products) are
described for each unit process in the flow diagram. Developing an accurate and systematic flow diagram
increases the efficiency of the following steps.
Developing an LCI data collection plan
Based on the developed flow diagram, a specific LCI data collection plan is required to select
appropriate data sources. The collection plan includes the definition of data quality goals, identification of
data sources/types, identification of data quality indicators, and development of a data collection
worksheet and checklist (EPA 2006).
Data quality goals should be defined for managing time and source availability to achieve the
required data quality. Because there are no pre-defined requirements for data quality goals, the necessary
level of data quality depends on the required accuracy and practitioners’ preference. In particular, if parts
of the data were obtained from secondary sources, then quality criteria would be required to ensure the
accuracy and validity of the data (Babbitt, 2005).
Prior to data collection, known data sources and types should be listed to prevent wasting time
and resources, and to ensure the accuracy and quality of the data. Data sources can be variable, e.g., meter

50
readings from equipment, public databases, industry databases, laboratory test results, reference papers,
previous LCI studies, LCA software programs, etc.
Depending on the level of aggregation, data can fall into one of several categories. For example,
individual process data are only from a certain operation/facility. Composite process data are from the
same operation combined across different locations. Aggregated data are from more than one process
operation. Industry-average data are from a representative sample of locations that have demonstrated
statistical performance. Finally, generic data are information that is qualitatively descriptive of an
operation without proving its representativeness (EPA 2006).
The last step to developing the data collection plan is to create a data collection spreadsheet that
includes specific guidance. An electronic spreadsheet, such as an Ecospold (Ecoinvent 2012), is a useful
recording tool for collecting data accurately and consistently. A well-organized computational
spreadsheet that determines the relationships of subsystems in the production of a final product can
prevent omissions and double counting during data collection.
Data collection spreadsheets include all the required inputs regarding the unit processes. A unit
process is the basic unit of a product system for which data are collected when developing an LCI. There
are two sparse matrices for connecting unit processes using inputs and outputs: the technosphere
(economic) matrix and the biosphere (nature/environment) matrix. The technosphere matrix contains
exchanges within the economic system, such as the purchase of intermediate goods (e.g., machinery,
materials and ancillaries) or services (e.g., waste treatment, transportation). On the other hand, the
biosphere link pertains to the relations of direct resource extraction and direct emissions to air, water, and
soil (Frischknecht, 2005).

51
Data collection
Input and output data are collected on spreadsheets following the chosen data collection plan.
Within the determined system boundaries, LCI measures all raw material and energy inputs and outputs,
such as environmental emissions on a per-unit process basis (Bergman and Taylor 2011).
Input data include raw materials, energy, and water consumption with their respective feedstocks
for the unit processes. Material inputs are generally reported in units of mass (kg) or volume (m3).
Electricity consumption is measured in units of kwh, and natural gas is measured in units of m3 (or L for
liquidized gas).
The source of energy and efficiency for the generator system and the delivery system are also
characterized in LCI analysis. In most cases, the electricity supplied to companies is from mixed energy
sources, for example, the power utility selling electricity to the companies interconnected with
neighboring utilities (EPA 2006). National average database models of electricity developed by the DOE
in the U.S. LCI database can be used to estimate the mixed fuel source grid.
Net water consumption is also required to be measured. Net water consumption as an LCI input is
defined as the fraction of total water withdrawn from surface or groundwater sources that is incorporated
into the product, co-product, and wastes, or is evaporated.
Output data include environmental emissions (e.g., atmospheric and waterborne emissions), solid
waste, co-products, and products. Indirect emissions from the production of energy/material feedstocks
are also cumulatively accounted for using the corresponding secondary data.
Air emissions, which include all substances regarded as pollutants per unit of product output, are
reported in units of weight (kg) to LCI. There is no standard list for which emissions should be included
in the LCI. Specific emissions reported for any processes vary depending on the scope of the study. Air
emissions generated from the production process, combustion of fuels and transportation. General
selected air emissions include carbon dioxide (CO2), carbon monoxide (CO), sulfur oxides (SOX), nitrous
oxides (NOX), particulates/dust, lead, methane (CH4), hydrocarbons (CxHy), and volatile organic
compounds (VOC). Those emissions were referred to by EPA criteria as air indicators. Among them,

52
chemical reactions between emissions of volatile organic compounds (VOC) and nitrous oxides (NOx) in
sunlight affect ozone, instead of direct emission into the air. As potential contributors to ozone,
unspecified VOC and non-methane hydrocarbons, which can include VOC, are generally reported
(Franklin Associates, 2007).
Water wastes are reported in units of weight and include all pollutant substances. Typically
reported types of water wastes are biological oxygen demand (BOD), chemical oxygen demand (COD),
suspended solids, dissolved solids, oil and grease, sulfides, iron, chromium, tin, metal ions, cyanide,
fluorides, phenol, phosphates, and ammonia. Like air emission measurements, there is no standard list of
the waste types that should be included in the LCI (EPA 2006). If necessary, they can be calculated from
the information given for individual water pollutants. For that purpose the stoichiometric oxygen demand
for the oxidation is calculated to quantify the COD and BOD (Ecoinvent, 2007).
Solid wastes, every solid materials disposed from the entire system, are reported by weight. There
are two types of solid wastes, such as industrial solid wastes and post-consumer solid wastes, depending
on disposal ways/stages. Industrial solid waste means the solid waste generated during the production of a
product such as process solid waste and fuel-related solid waste. Process solid waste means the waste
generated in the actual process such as trim and non-recyclable waste. Fuel-related waste is the waste
generated from the production and combustion of fuels for manufacturing processes and transportation.
Post-consumer solid waste means the waste disposed after intended use by consumers, which is generally
regarded as the municipal solid waste (EPA 2006).
Evaluation and documentation of results
The outcome of the LCI analysis is tabulated and documented while including the amount of
energy and materials consumed and the quantities of pollutants released to the environment. The specific
methods and assumptions used in the LCI analysis are clearly reported in the final results. Depending on
the purpose of the study, the collected data results can be presented either as a summary of the entire
system or grouped by stages and parameters.

53
2.5.3.2. Data Quality and Uncertainty of Life Cycle Inventory
As noted previously, one of the most critical limits in the application of the methodology of life
cycle assessment (LCA) is the quality of the inventory data. The various natural uncertainty found in
inventory data, such as the variability of the measurements in industrial plants and the discrepancy
between foreground and background data, can restrict the reliability of the final results of the LCA
(Coulon et al. 1997).
Among the various methods used for dealing with the uncertainty of the life cycle inventory data, a
pedigree matrix proposed by Weidema and Wesnæ s (1996) for evaluating the data quality and
uncertainty is one of traditional methods utilized to evaluate data quality. The pedigree matrix
expresses the data quality by means of a matrix, whose columns are six primary aspects of the data
quality and whose rows are five levels of qualitative degree of the corresponding data quality. The
indicators include reliability, completeness, temporal correlation, geographical correlation, further
technological correlation, and the sample size of measurement/estimated data. The range of levels of
qualitative degree (score) is from one to five. In generic LCI databases, the scores of the six
indicators are typically noted together in a parenthesis (e.g. (1.1.2.3.2.1)). Table 8 shows the pedigree
matrix used to assess the quality of data.

54
Table 8. Pedigree matrix for the data quality (adapted from Weidema and Wesnæ s 1996)
Indicators 1 2 3 4 5
Reliability Valid data based
on measurements
Verified data
partly based on
assumptions, or
non-verified data
based on
measurements
Non-verified
data partly based
on qualified
estimates
Qualified
estimate (e.g.
industrial expert)
Non-qualified
estimate
Completeness Representative
data all sites
relevant for the
market
considered over
an adequate
period to even out
normal
fluctuations
Representative
data from >50%
of the market
considered over
an adequate
period to even
out normal
fluctuations
Representative
data from only
some sites
(<50%) for the
market
considered, or
>50% of sites
but from shorter
periods
Representative
data from only
one site for the
market
considered, or
some sites but
shorter periods
Representativen
ess unknown, or
data from a
small number of
sites and from
shorter periods
Temporal
correlation
Less than 3 years
of difference to
the time period of
the dataset
Less than 6
years of
difference to the
time period of
the dataset
Less than 10
years of
difference to the
time period of
the dataset
Less than 15
years of
difference to the
time period of
the dataset
Age of data
unknown, or
more than 15
years of
difference to the
time period of
the dataset
Geographical
correlation
Data from area
under study
Average data
from larger area
in which under
study is included
Data from area
with similar
production
condition
Data from area
with slightly
similar
production
condition
Data from
unknown or,
distinctly
different area
(e.g. North
America instead
of Middle-East)
Further
technological
correlation
Data from
enterprises and
materials under
study
Data from
processes and
materials under
study (identical
technology) but
from different
enterprises
Data from
processes and
materials under
study but from
different
technology
Data on related
processes or
materials
Data on related
processes on
laboratory scale
or from different
technology
Sample size >100 >20 >10 >=3 Unknown

55
The data quality assessed by the pedigree matrix is commonly used to estimate the uncertainty of
data. The uncertainty of data is expressed in the square of the geometric standard deviation and is
calculated with Equation 2:
SDg95 = 𝜎g2 = 𝑒𝑥𝑝√[ln(𝑈1)]2+[ln(𝑈2)]2+[ln(𝑈3)]2+[ln(𝑈4)]2+[ln(𝑈5)]2+[ln(𝑈6)]2+[ln(𝑈𝑏)]2
[Equation 2]
Where:
𝑈1 = Uncertainty of reliability
𝑈2 = Uncertainty of completeness
𝑈3 = Uncertainty of temporal correlation
𝑈4 = Uncertainty of geographical correlation
𝑈5 = Uncertainty of other technological correlation
𝑈6 = Uncertainty of sample size
𝑈𝑏 = Basic uncertainty factor
In Equation 2, the uncertainty of each data quality indicator is calculated by applying uncertainty
factors (Table 9) to the corresponding data quality scores assessed by the pedigree matrix. The uncertainty
factors indicate how the indicators of the pedigree matrix contribute to the square of the geometric
standard deviation. The basic uncertainty factor (𝑈𝑏) (Table 10) is also applied to the data uncertainty
calculation. Different basic uncertainty factors are chosen based on the characteristics of each input and
output data. The calculated uncertainty value is often noted with the final results of the LCA.
Table 9. Default uncertainty factors (contributing to the square of the geometric standard deviation)
applied together with the pedigree matrix.
Indicator score 1 2 3 4 5
Reliability 1.00 1.05 1.10 1.20 1.50
Completeness 1.00 1.02 1.05 1.10 1.20
Temporal correlation 1.00 1.03 1.10 1.20 1.50
Geographical correlation 1.00 1.01 1.02 1.10
Further technological correlation 1.00 1.20 1.50 2.00
Sample size 1.00 1.02 1.05 1.10 1.20
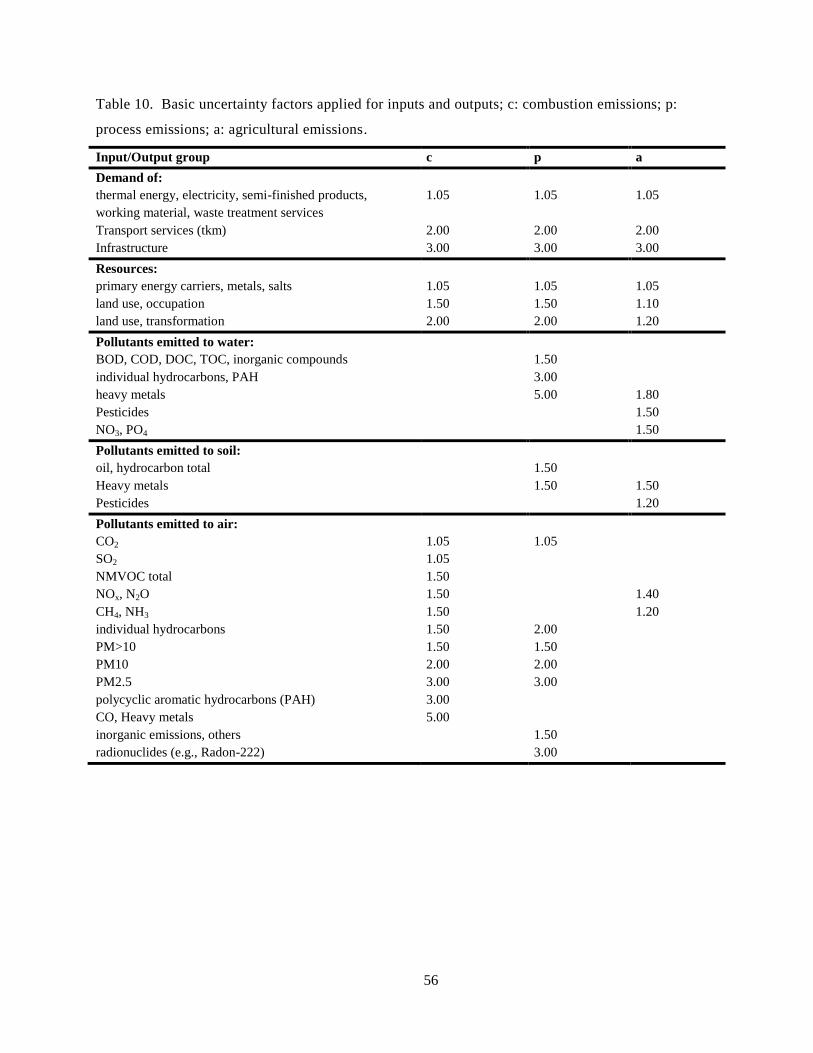
56
Table 10. Basic uncertainty factors applied for inputs and outputs; c: combustion emissions; p:
process emissions; a: agricultural emissions.
Input/Output group c p a
Demand of:
thermal energy, electricity, semi-finished products,
working material, waste treatment services
1.05 1.05 1.05
Transport services (tkm) 2.00 2.00 2.00
Infrastructure 3.00 3.00 3.00
Resources:
primary energy carriers, metals, salts 1.05 1.05 1.05
land use, occupation 1.50 1.50 1.10
land use, transformation 2.00 2.00 1.20
Pollutants emitted to water:
BOD, COD, DOC, TOC, inorganic compounds 1.50
individual hydrocarbons, PAH 3.00
heavy metals 5.00 1.80
Pesticides 1.50
NO3, PO4 1.50
Pollutants emitted to soil:
oil, hydrocarbon total 1.50
Heavy metals 1.50 1.50
Pesticides 1.20
Pollutants emitted to air:
CO2 1.05 1.05
SO2 1.05
NMVOC total 1.50
NOx, N2O 1.50 1.40
CH4, NH3 1.50 1.20
individual hydrocarbons 1.50 2.00
PM>10 1.50 1.50
PM10 2.00 2.00
PM2.5 3.00 3.00
polycyclic aromatic hydrocarbons (PAH) 3.00
CO, Heavy metals 5.00
inorganic emissions, others 1.50
radionuclides (e.g., Radon-222) 3.00
57
Chapter 3: The Influence of Size and Flute Type of Corrugated Paperboard
Boxes on Load-Bridging in Unit Loads
3.1. Abstract
A pallet is an essential component to move goods in a unit load form. Pallets are designed with
the assumption that the payload carried by the pallet is flexible and uniformly distributed on the pallet
surface. However, packages on the pallet act as a series of discrete loads where the physical interaction
between the packages adds stiffness to the payload and causes the payload to be variously suspended
across the pallet deckboard. The term “load-bridging” has been used to describe this characteristic of
loads on a pallet. Load-bridging can affect the deflection of the unit load by leading to redistribution of
loads from the center of the pallet to the support; therefore, it could potentially influence the load carrying
capacity of the pallet by decreasing the maximum bending moment. The purpose of this study was to
investigate the influence of packaging size and flute type of corrugated paperboard boxes on the
deflection of unit loads and the redistribution of loads on the pallet during a warehouse racking condition.
The experimental results demonstrate that increases in the packaging size reduce unit load deflection by
as much as 76%. Also, changing the corrugated paperboard box flute type from B-flute or BC-flute to E-
flute reduces unit load deflection by as much as 23%. The study also revealed that the effect of packaging
size and corrugated board flute type on unit load deflection is the greatest for low stiffness pallets.
3.2. Introduction
The international container trade industry moved 151 million TEUs (20-foot equivalent unit),
equivalent to around 1.2 billion tons of dry goods in 2011 (UNCTAD 2012). The goods are generally
transported and stored in a unit load form at some point in the supply chain. The unit load is defined as ‘a
single item, a number of items, or bulk material which is arranged and restrained so that the load can be
stored, picked up, and moved between two locations as a single mass (White 2005)’. A unit load consists
of loads (packages containing products) on a pallet with appropriate load stabilizers. The pallet, the most

58
common unit load platform, facilitates the transportation and storage of goods in an efficient way. While
shipping pallets can be made from several materials, including metal, paper, and various plastics, wood is
estimated to account for more than 90 percent of the U.S. pallet market (Trebilcock 2013). In 2011,
approximately 416 million new wood pallets were manufactured in the United States (Araman and Bush
2015). Among the various load types of the unit load, corrugated paperboard boxes are the most widely
used packaging form for transporting goods in the United States (Twede and Selke, 2005).
In designing the pallet, it was generally assumed that the payload is flexible and uniformly
distributed on top of the pallet. However, packages on the pallet are acting as a series of discrete loads
where the physical interaction between the packages adds stiffness to the payload and causes the payload
to bridge across supports. This load-bridging can affect the deflection of the unit load by leading to
redistribution of loads from the center of the pallet to the support; therefore, it could potentially influence
the load carrying capacity of the pallet by decreasing the maximum bending moment.
Two early studies (Fegan 1982; Colie 1984) examined the influences of various unit load
characteristics on the load-bridging, and found that stacking patterns and pallet stiffness significantly
affected unit load deflection due to the load-bridging. White (1999) also confirmed that the load carrying
capacity of pallets was highly dependent on the types of packages (e.g. corrugated paperboard box, sacks,
and drums), stacking patterns, and load stabilizers (e.g. stretch wrap and strap) that are applied to the
pallet.
Although, there has been acknowledgements of load-bridging and its general effects, we still have
limited understanding of the interactions between the pallet and the types of payload including the effect
of packaging sizes, flute type of corrugated paperboard boxes, and containment force of load stabilizers
on pallet deflection. Due to the lack of existing knowledge on load-bridging, commercial pallet design
software programs only use a highly conservative adjustment for the different types of loads carried by
the pallet.

59
The objective of the study was to investigate the influence of size and flute type of corrugated
paperboard boxes on deflection of unit loads and the redistribution of loads on the pallet during a
warehouse racking condition.
3.3. Materials and Methods
3.3.1. Materials
3.3.1.1. Simulated Pallet Segments
Four types of pallets were used to determine the stiffness range of typical pallets used: 48 in. x 40
in. (1,209 mm x 1,016 mm) GMA class wood stringer pallet made of Southern Yellow Pine, 48 in. x 40 in.
(1,209 mm x 1,016 mm) block class perimeter based wood pallet made of mixed hardwoods, 48 in. x 40
in. (1,209 mm x 1,016 mm) multiple use polypropylene plastic block class pallet, 44.5 in. x 38.5 in.
(1,130 mm x 978 mm) single use recycled polypropylene plastic block class pallet (Figure 15). The
bending stiffnesses of the four pallets were measured by a three-point bending test using a fixed platen
compression tester (Tinius Olsen). The pallets were racked across their width on two circular beams with
2 in. (51 mm) diameter spaced 36 in. (914 mm) apart with a 2 in. (51 mm) underhang on each side. An
additional circular load beam was centered on the top of the pallet and was loaded by the top platen of the
compression tester. The deflection of the pallet was measured by a string potentiometer (UnitMeasure,
Model P510-5-S3) at the center of the pallet. The bending stiffness of the pallets were adjusted to
represent the stiffness of a 40 in. x 10 in. (1,016 mm x 254 mm) segment of the pallet (Table 11).
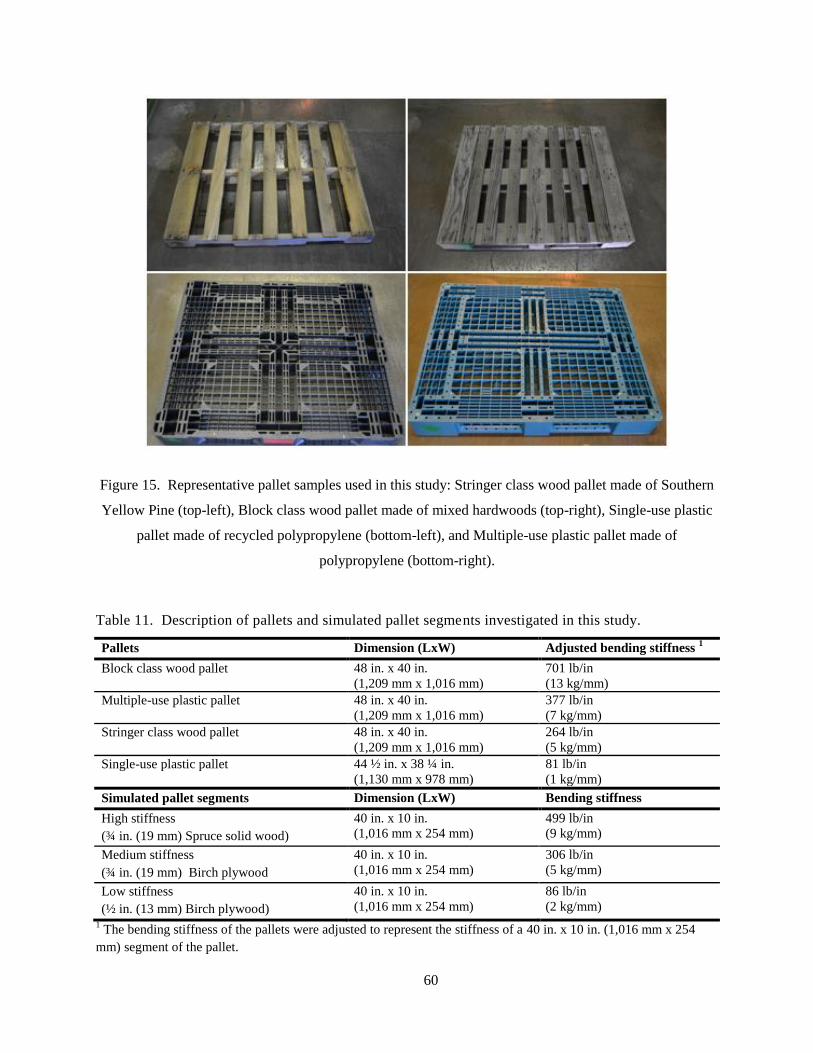
60
Figure 15. Representative pallet samples used in this study: Stringer class wood pallet made of Southern
Yellow Pine (top-left), Block class wood pallet made of mixed hardwoods (top-right), Single-use plastic
pallet made of recycled polypropylene (bottom-left), and Multiple-use plastic pallet made of
polypropylene (bottom-right).
Table 11. Description of pallets and simulated pallet segments investigated in this study.
Pallets Dimension (LxW) Adjusted bending stiffness 1
Block class wood pallet 48 in. x 40 in.
(1,209 mm x 1,016 mm)
701 lb/in
(13 kg/mm)
Multiple-use plastic pallet 48 in. x 40 in.
(1,209 mm x 1,016 mm)
377 lb/in
(7 kg/mm)
Stringer class wood pallet 48 in. x 40 in.
(1,209 mm x 1,016 mm)
264 lb/in
(5 kg/mm)
Single-use plastic pallet 44 ½ in. x 38 ¼ in.
(1,130 mm x 978 mm)
81 lb/in
(1 kg/mm)
Simulated pallet segments Dimension (LxW) Bending stiffness
High stiffness
(¾ in. (19 mm) Spruce solid wood)
40 in. x 10 in.
(1,016 mm x 254 mm)
499 lb/in
(9 kg/mm)
Medium stiffness
(¾ in. (19 mm) Birch plywood
40 in. x 10 in.
(1,016 mm x 254 mm)
306 lb/in
(5 kg/mm)
Low stiffness
(½ in. (13 mm) Birch plywood)
40 in. x 10 in.
(1,016 mm x 254 mm)
86 lb/in
(2 kg/mm)
1 The bending stiffness of the pallets were adjusted to represent the stiffness of a 40 in. x 10 in. (1,016 mm x 254
mm) segment of the pallet.

61
3.3.1.2. Corrugated Paperboard Boxes
Three different sizes (20 in. x 10 in. x 10 in. (504 mm x 254 mm x 254 mm), 10 in. x 10 in. x 10
in. (254 mm x 254 mm x 254 mm), 5 in. x 10 in. x 10 in. (127 mm x 254 mm x 254 mm)) and flute types
(E, B, and BC) of regular slotted container (RSC) type corrugated paperboard boxes were used for this
study. The boxes were manufactured and shipped flat by Packaging Corporation of America, Roanoke,
Virginia, USA. Flat crush test according to TAPPI 825 was conducted to measure the strength and
calculate the stiffness perpendicular to the surface of each flute type used for this study. Table 12 shows
the physical properties of the corrugated paperboard boxes.
Table 12. Description of corrugated paperboard boxes used in the load-bridging tests as dummy
loads.
Box Size
(L x W x H)
Weight
per box
Flute
type
Flat Crush Test Edge Crush
Test (nominal) Average strength
(COV, %)
Average stiffness
(COV, %)
5 in. x 10 in. x 10 in.
(127 mm x 254 mm x
254 mm)
10 lb
(4.5 kg)
E
B
BC
805 lb (6.55)
(365 kg)
293 lb (23.98)
(133 kg)
210 lb (6.01)
(95 kg)
108,763 lb/in (9.48)
(1942 kg/mm)
46,048 lb/in (20.31)
(822 kg/mm)
4,746 lb/in (28.45)
(85 kg/mm)
32 lb/in2
(2.3 kg/cm2)
32 lb/in2
(2.3 kg/cm2)
48 lb/in2
(3.4 kg/cm2)
10 in. x 10 in. x 10 in.
(254 mm x 254 mm x
254 mm)
20 lb
(9 kg)
B
293 lb (23.98)
(133 kg)
46,048 lb/in (20.31)
(822 kg/mm)
32 lb/in2
(2.3 kg/cm2)
20 in. x 10 in. x 10 in.
(508 mm x 254 mm x
254 mm)
40 lb
(18 kg)
B
293 lb (23.98)
(133 kg)
46,048 lb/in (20.31)
(822 kg/mm)
32 lb/in2
(2.3 kg/cm2)
The boxes were erected using a custom jig to ensure that each of the edges had a 90° angle. Rigid
oriented strand board (OSB) boxes manufactured using 0.5 in. (13 mm) thick OSB board to the exact
inside dimensions of the corrugated paperboard box were placed inside of the corrugated paperboard box.
The OSB boxes were filled with weights and a lid was secured to the top to seal the OSB box. The flaps
of the corrugated paperboard box were sealed with using hot glue on each of the flaps. The assembled

62
boxes were conditioned at 73 °F (23 °C) and 50% relative humidity for at least 72 hours according to
ASTM D 4332.
3.3.2. Testing Methods
The experimental design to analyze the effect of package geometry and flute type on unit load
deflection is presented in Table 13. All size-flute combinations were analyzed using 3 replicates and using
three different stiffness of simulated pallet segments.
Table 13. Experimental design to investigate the effect of size and flute type of corrugated
containers on unit load deflection.
Simulated pallet
segments Box Size E-flute B-flute BC-flute
High stiffness
5 in. x 10 in. x 10 in.
(127 mm x 254 mm x 254 mm) 3 replicates 3 replicates 3 replicates
10 in. x 10 in. x 10 in.
(254 mm x 254 mm x 254 mm) - 3 replicates -
20 in. x 10 in. x 10 in.
(508 mm x 254 mm x 254 mm) - 3 replicates -
Medium stiffness
5 in. x 10 in. x 10 in.
(127 mm x 254 mm x 254 mm) 3 replicates 3 replicates 3 replicates
10 in. x 10 in. x 10 in.
(254 mm x 254 mm x 254 mm) - 3 replicates -
20 in. x 10 in. x 10 in.
(508 mm x 254 mm x 254 mm) - 3 replicates -
Low stiffness
5 in. x 10 in. x 10 in.
(127 mm x 254 mm x 254 mm) 3 replicates 3 replicates 3 replicates
10 in. x 10 in. x 10 in.
(254 mm x 254 mm x 254 mm) - 3 replicates -
20 in. x 10 in. x 10 in.
(508 mm x 254 mm x 254 mm) - 3 replicates -
Two separate two-way Analysis of Variance (ANOVA) tests were conducted to analyze the
effects of packaging size and flute type on the unit load deflection using different stiffness of simulated
pallet segments. Simple Main Effects tests were conducted to investigate the interactions between
packaging size and simulated pallet segment stiffness and between flute type and simulated pallet
segment stiffness. Post-hoc analysis was conducted using Tukey’s HSD to check the level of difference
among levels of variables. A statistics software, SAS JMP® , was used for conducting the statistical
analysis.

63
3.3.2.1. Unit load Bending Tests using Loaded Corrugated Paperboard Boxes
The overall weight of a unit load for the unit load bending tests was 240 pounds (109 kg). The 40
in. x 10 in. (1,016 mm x 254 mm) simulated pallet segment was supported using two 4 in. x 4 in. (102
mm x 102 mm) I-beams leaving 36 in. (914 mm) free span between the beams. To measure the deflection
of unit loads, two Linear Variable Differential Transformers (LVDTs) were secured to two custom yokes,
and were placed on both sides of the simulated pallet segment centrally. Three layers of corrugated
paperboard boxes were placed on the simulated pallet segment. One floor jack was positioned under the
center of the simulated pallet segment and was used to prevent the deflection of the simulated pallet
segment during loading of the corrugated paperboard boxes. A dial gauge was placed 2 inches (51 mm)
from the center on the simulated pallet segment to ensure the simulated pallet segment was level.
Following the loading of the corrugated paperboard boxes, the floor jack was slowly removed to simulate
the rack support condition. After initiating data collection, the deflection of the unit load was recorded
after one minute using LabView software and the two LVDTs. The experiments were conducted with
three replicates inside of the environmental chamber at (73 °F (23 °C)) and 50% relative humidity for all
tests performed.
3.3.2.2 Pressure Distribution Mapping
A Tekscan pressure measurement system including a pressure mat (Model 5315) was used to
measure the pressure distribution of the packages on the simulated pallet segments during the bending
test. The pressure mat was equilibrated and calibrated using a Tekscan equilibrator (Model PB100F). The
pressure mat was calibrated using a two-point calibration from 1 psi (7 kpa) to 3 psi (21 kpa). The
pressure mat system was connected to an I-Scan® data acquisition software program that recorded the
pressure obtained from each pressure sensors (sensel) of the mat between 0-5psi (0-34 kpa) in real-time.
For the bending test, the pressure mat was placed between the simulated pallet segment and the
corrugated paperboard boxes. It covered one side of the simulated pallet segment, from outer edge to
center. Two images were taken during the bending test, one image of the pressure distribution at the

64
beginning of the test and a second image after the floor jack was removed. Figure 16 shows the detailed
experimental set-up.
Figure 16. Experimental set-up for unit load bending tests with the pressure pad.
3.4. Results and Discussion
Table 14 shows the average unit load deflections as a function of different types of packaging
sizes and box flutes for the three simulated pallet segments. Figure 5 shows the fractional changes in the
unit load deflections as a function of the flute type, packaging size, and stiffness of simulated pallet
segments. To analyze how the measured unit load deflection results for different conditions deviate from
the uniform load condition, all measured experimental values were compared to the deflection values for
the uniform load condition (calculated using Equation 3).

65
𝛿 = 5𝑊4
384𝐸𝐼
[Equation 3]
Where:
𝛿 is maximum deflection (in, mm), W is uniform load per length unit (6 lb/in (107 g/mm), E is modulus of
elasticity, MOE (Low stiffness simulated pallet segment: 1010880 psi (6969772 kpa), Medium stiffness
simulated pallet segment: 849806 psi (5856468 kpa), High stiffness simulated pallet segment: 1385794
psi (9554713 kpa)), I is area moment of inertia (Low stiffness simulated pallet segment: 4.8 in4 (200 cm
4),
Medium and High stiffness simulated pallet segments: 16.8 in4 (699 cm
4))
Statistically, both packaging size and box flute had significant effects on the unit load deflection
(p-value<0.0001). Statistical differences among the packaging sizes and flute types for each simulated
pallet segments are denoted with capital letter(s) in Table 14. Appendix A shows detailed results of the
statistical analysis using ANOVA.
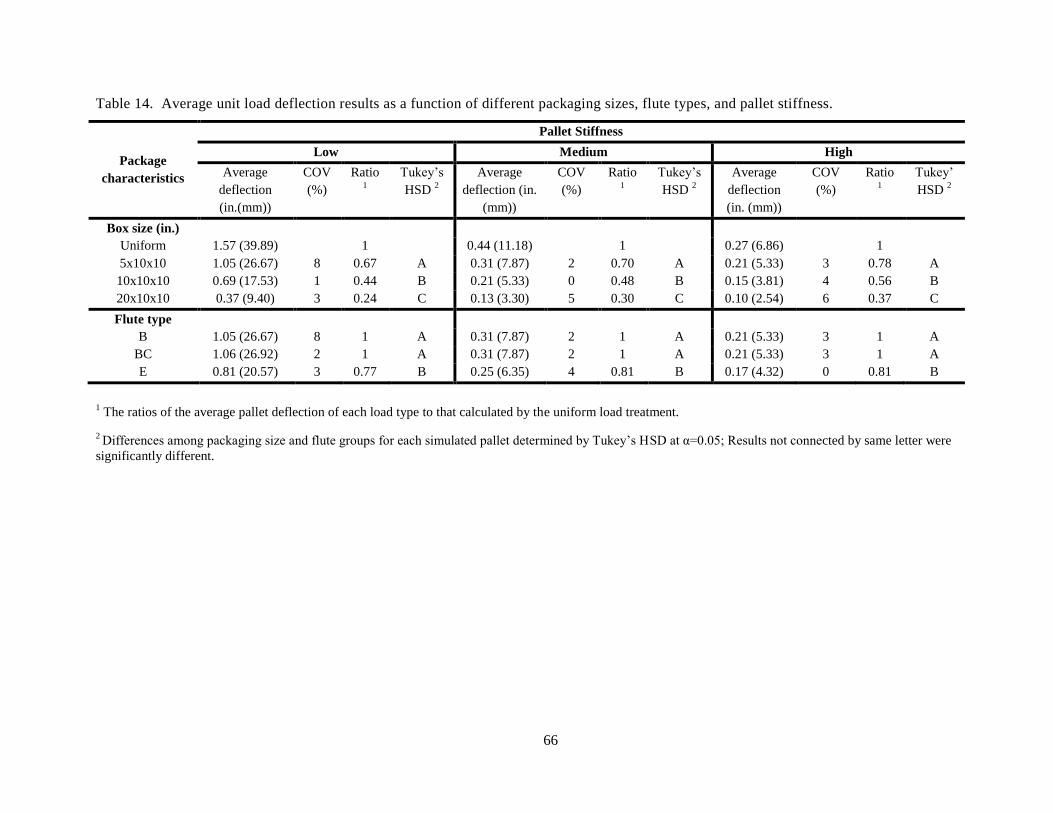
66
Table 14. Average unit load deflection results as a function of different packaging sizes, flute types, and pallet stiffness.
Package
characteristics
Pallet Stiffness
Low Medium High
Average
deflection
(in.(mm))
COV
(%)
Ratio 1
Tukey’s
HSD 2
Average
deflection (in.
(mm))
COV
(%)
Ratio 1
Tukey’s
HSD 2
Average
deflection
(in. (mm))
COV
(%)
Ratio 1
Tukey’
HSD 2
Box size (in.)
Uniform 1.57 (39.89) 1 0.44 (11.18) 1 0.27 (6.86) 1
5x10x10 1.05 (26.67) 8 0.67 A 0.31 (7.87) 2 0.70 A 0.21 (5.33) 3 0.78 A
10x10x10 0.69 (17.53) 1 0.44 B 0.21 (5.33) 0 0.48 B 0.15 (3.81) 4 0.56 B
20x10x10 0.37 (9.40) 3 0.24 C 0.13 (3.30) 5 0.30 C 0.10 (2.54) 6 0.37 C
Flute type
B 1.05 (26.67) 8 1 A 0.31 (7.87) 2 1 A 0.21 (5.33) 3 1 A
BC 1.06 (26.92) 2 1 A 0.31 (7.87) 2 1 A 0.21 (5.33) 3 1 A
E 0.81 (20.57) 3 0.77 B 0.25 (6.35) 4 0.81 B 0.17 (4.32) 0 0.81 B
1 The ratios of the average pallet deflection of each load type to that calculated by the uniform load treatment.
2 Differences among packaging size and flute groups for each simulated pallet determined by Tukey’s HSD at α=0.05; Results not connected by same letter were
significantly different.

67
1 Uniform: Calculated deflection values for the uniform loading condition.
2 The flute type effect tests used only the smallest box size (5 in. x 10 in. x 10 in. (127 mm x 254 mm x 254 mm)
Figure 17. Relative changes in the unit load deflection as a function of the flute type, packaging size, and
stiffness of simulated pallet.
As the size of the packaging increased, there was a significant reduction in the deflection of the unit
load. For the low stiffness simulated pallet segment, the deflection of the unit load was reduced by 33%, 56%,
and 76% compared to the uniform loading condition when 5 in. x 10 in. x 10 in. (127 mm x 254 mm x 254 mm),
10 in. x 10 in. x 10 in. (254 mm x 254 mm x 254 mm), and 20 in. x 10 in. x 10 in. (508 mm x 254 mm x 254
mm) boxes were used, respectively. Similar trend was observed for the medium (30%, 52%, and 70%) and high
stiffness (30%, 52%, and 70%) simulated pallet segments. The results also indicated that as the stiffness of
the simulated pallet segment decreases, the effect of packaging size is more prominent on the deflection
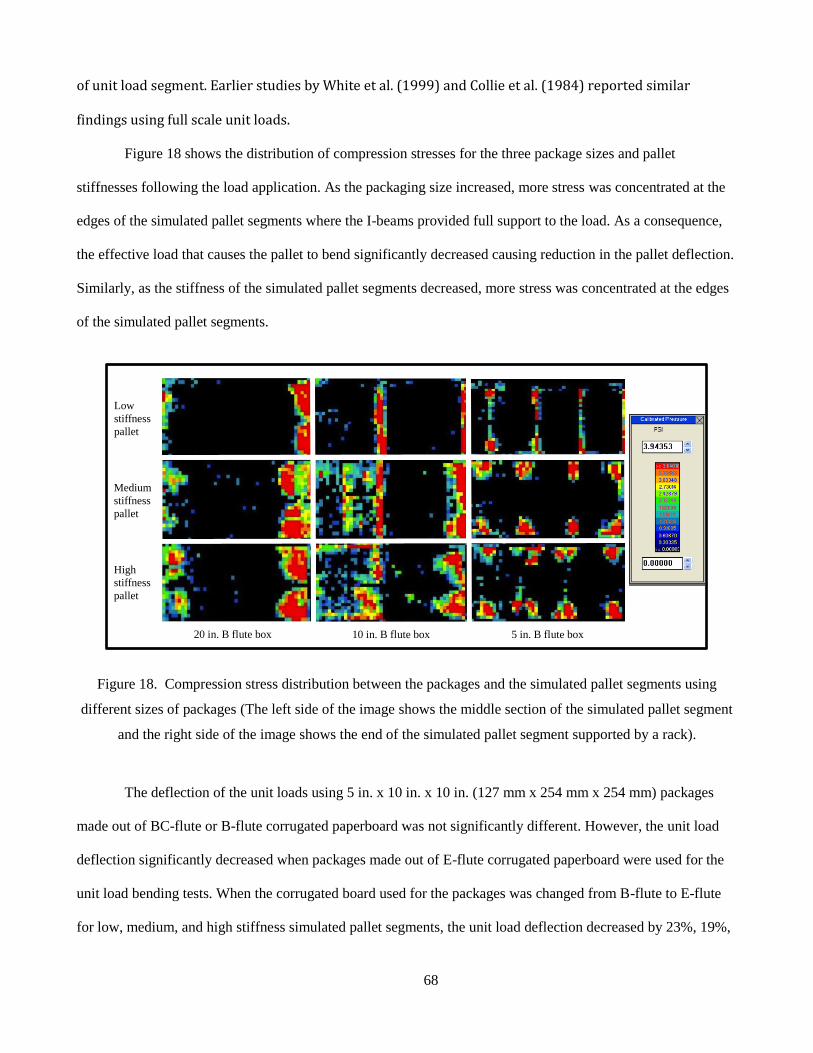
68
of unit load segment. Earlier studies by White et al. (1999) and Collie et al. (1984) reported similar
findings using full scale unit loads.
Figure 18 shows the distribution of compression stresses for the three package sizes and pallet
stiffnesses following the load application. As the packaging size increased, more stress was concentrated at the
edges of the simulated pallet segments where the I-beams provided full support to the load. As a consequence,
the effective load that causes the pallet to bend significantly decreased causing reduction in the pallet deflection.
Similarly, as the stiffness of the simulated pallet segments decreased, more stress was concentrated at the edges
of the simulated pallet segments.
Figure 18. Compression stress distribution between the packages and the simulated pallet segments using
different sizes of packages (The left side of the image shows the middle section of the simulated pallet segment
and the right side of the image shows the end of the simulated pallet segment supported by a rack).
The deflection of the unit loads using 5 in. x 10 in. x 10 in. (127 mm x 254 mm x 254 mm) packages
made out of BC-flute or B-flute corrugated paperboard was not significantly different. However, the unit load
deflection significantly decreased when packages made out of E-flute corrugated paperboard were used for the
unit load bending tests. When the corrugated board used for the packages was changed from B-flute to E-flute
for low, medium, and high stiffness simulated pallet segments, the unit load deflection decreased by 23%, 19%,
Low
stiffness
pallet
20 in. B flute box 10 in. B flute box 5 in. B flute box
Medium
stiffness
pallet
High
stiffness
pallet

69
and 19%, respectively. The observed trend was similar to the one observed during the investigation of the effect
of package size where the greatest change occurred for low stiffness pallet segments.
Figure 19 shows the distribution of compression stresses for packages made of the three different flutes
of corrugated paperboard and supported by the three different pallet stiffnesses following the load application.
As the stiffness of the simulated pallet segments decreased, more stress was concentrated at the edges of the
simulated pallet sections and packages. However, no consistent visual change was observed due to the changing
flute type. Rather than the compression of bottoms of the corrugated paperboard boxes, it is the some
compression stiffness of the medium in the side walls between boxes that each to the difference in bridging
between B-flute/BC-flute and E-flute. different compression behaviors between their sidewalls could lead to the
reduction of unit load deflection results from B-flute and BC-flutes boxes to E-flute boxes.
Figure 19. Compression stress distribution between the packages and the simulated pallet segments using
corrugated boxes with different flute types (The left side of the image shows the middle section of the simulated
pallet segment and the right side of the image shows the end of the simulated pallet segment supported by a
rack).
To determine the load carrying capacity of a pallet design, ISO 8611 testing standard defines the failure
of the pallet as the physical failure of the full pallet or its components or as the deflection of the pallet exceeds
6% of the free span between the supports. Therefore, the load carrying capacity of high stiffness pallets mainly
5 in. E flute box 5 in. B flute box 5 in. BC flute box
Low
stiffness
pallet
Medium
stiffness
pallet
High
stiffness
pallet

70
depends on their strength while the load carrying capacity of low stiffness pallets mainly depends on their
stiffness. Although the study showed that both package size and flute type had a significant effect on the
deflection of the pallet segment, it is not possible to formulate a clear conclusion yet on the change in the load-
carrying capacity of all pallets. To advance the theory of system based unit load design further, future studies
need to quantify the effect of these factors on strength of pallet segments.
3.5. Conclusion
(1). Increasing the size of packages led to increased load-bridging and a significant decrease in unit load
deflection. The packaging size effect on unit load deflection was the greatest for the simulated pallet segment
with low stiffness. For the medium stiffness simulated pallet segment, which was comparable to the stringer
class wood pallet spanning the width of a storage rack, average deflection in the unit load decreased by 30%,
52%, and 70%, when package size increased to 5 in. x 10 in. x 10 in., 10 in. x 10 in. x 10 in., and 20 in. x 10 in.
x 10 in., respectively. Designing and utilizing larger packaging is highly recommended to take advantage of the
benefit that comes from load-bridging unit-loads to reduce unit load deflection.
(2). Unit load deflection decreased when the flute type of corrugated paperboard boxes changed from B-
flute and BC-flute to E-flute for simulated pallet segments of all stiffness levels. For the medium stiffness
simulated pallet segment, which was comparable to the stringer class wood pallet spanning the width of a
storage rack, unit load deflection decreased by 19%, when B-flute or BC-flute corrugated boxes were changed to
the E-flute boxes. However, there was no difference between the B-flute and BC-flute in terms of unit load
deflection.
(3). The pressure decreased at the center of the simulated pallet segment and increased at the end of the
simulated pallet segment as the package size increased and the simulated pallet segment stiffness decreased.
This redistribution of compression stresses towards the ends of the simulated pallet segments represented the
reduction in bending moment and explained the lower simulated pallet segment deflections observed when the
package size increased. In order to avoid damaging the packaging during storage in rack systems, packaging
engineers must consider the effects of changes in the pallet and packaging characteristics on the stress
concentration at the pallets’ edges.

71
(4). Updated design methods that consider the packaging size effect on the unit loads deflection can help
to reduce the amount of raw materials required to build pallets using current pallet design methodologies.
3.6. Limitation
There was a limitation in pressure sensor ranges (0-3 psi). Time-dependent characteristics of the tested
materials, such as creep properties, were not investigated in this study. A clear conclusion on the change in the
load-carrying capacity of all pallets could not be formulated, since this study only measured deflections of
simulated pallets.
3.7. Acknowledgment
USDA Forest Service, Ongweoweh Corporation, and the members of the Center for Packaging and Unit
Load Design at Virginia Tech are gratefully acknowledged for their financial support for this research project.
Packaging Corporation of America (PCA) is also acknowledged for the testing material support for this research
project.
References
Araman P.A. and Bush R.J. (2015). “New and Used Pallet Information Plus Other Topics.” Presentation at
Western Pallet Association Annual Meeting, Rancho Mirage, CA, USA.
Collie S. (1984). “Laboratory verification of pallet design procedures.” M.S. Thesis, Department of Wood
Science and Forest Products, Virginia Tech, Blacksburg, VA, USA.
Fegan B. (1982). “Load-Support Conditions And Computerized Test Apparatus for Wood Pallets.” Department
of Wood Science and Forest Products, Virginia Tech, Blacksburg, VA, USA.
ISO. (2011). “ISO 8611:Pallets for materials handling -- Flat pallets.” International Organization for
Standardization (ISO): Geneva, Switzerland
Trebilcock B. (2013). “Talking pallets with modern readers.” Modern Materials Handling 68: 26-34. Peerless
Media, LLC: Framingham, MA, USA
Twede D. and Selke S. (2004). “Cartons, Crates and Corrugated Board Handbook of Wood and Paper
Packaging.” DEStech Publications, Inc. Lancaster, PA, USA

72
UNCTAD. (2012). “Review of Maritime Transport. United Nations conference on trade and development
(UNCTAD).” United Nations Publication: Geneva, Switzerland
White M.S. and Hamner P. (2005). “Pallets move the world: the case for developing system-based designs for
unit loads.” Forest product journal 55:8-16.
White M.S., Dibling W., and Rupert R., McLeod J. (1999). “Determination of pallet maximum working loads
from nominal load measurements.” Center for Unit Load Design, Virginia Tech, Blacksburg, VA, USA.

73
Chapter 4: The Influence of Stretch Wrap Containment Force on Load-Bridging
in Unit Loads
4.1. Abstract
Current pallet design practices assume that the weight of the packages is uniformly distributed on the
pallet’s surface. However, there are factors, including packaging size, packaging stiffness, and the containment
force of load stabilizers, which can affect the weight distribution. The effect of these factors on the weight
distribution is commonly referred to as load-bridging and can affect the unit load deflection. This potentially
influences the load carrying capacity of the pallet. The purpose of this study was to investigate the influence of
stretch wrap containment force and packaging size on load-bridging in unit loads under typical warehouse rack
storage conditions. The study found that increasing the stretch wrap containment force from 0 lb (0 kg, no
stretch wrap) to 60 lb (27.2 kg) reduced the unit load deflection as much as 81%. Increasing the packaging size
from 5 in. x 10 in. x 10 in. (127 mm x 254 mm x 254 mm) to 20 in. x 10 in. x 10 in. (504 mm x 254 mm x 254
mm) reduced the unit load deflection as much as 91%.
4.2. Introduction
Current pallet design practices assume that the payload is flexible and uniformly distributed on the
pallet. In reality, most loads are not uniformly distributed because the packages act as a series of discrete loads.
Physical interaction between the packages and between the packages and load stabilizers creates additional
stiffness in the payload. This leads to the payload bridging across warehouse rack supports. When compared to
an actual flexible uniform load on the pallet, this bridging will reduce the bending moment in which the pallet is
exposed. Bridging will reduce unit load deformation and increase the capacity of the pallet.
The amount of the load-bridging can be affected by various characteristics of the unit load such as
packaging size, packaging stiffness, stacking patterns, containment force of load stabilizers, coefficient of
friction between boxes, the number of packaging layers, and the pallet stiffness in a unit load. Fegan (1982) and
Colie (1984) were the first to quantify the effects of load-bridging of the unit load. The amount of the load-
bridging was characterized by measuring unit load deflections. They found that the deflection of the pallet
changes for different package stacking patterns and pallet stiffness. White (1999) investigated the changes in

74
unit load deflections depending on different packaging, stacking patterns, and load stabilization methods. These
findings were later proposed in ISO 8611-3: Pallets for materials handling -- Flat pallets -- Part 3: Maximum
working loads (ISO 2011) as a guideline.
There is a lack of knowledge regarding the influence of stretch wrap containment force on the bridging
of loads on pallets. Containment force is defined as an inward force of the stretch wrap to keep a load together in
ASTM D4649 (ASTM 2009). ASTM D4649-03: Standard Guide for Selection and Use of Stretch Wrap Films
(ASTM 2009) describes a measurement procedure for the stretch wrap containment force. The containment
force can be affected during stretch wrapping applications by film properties (Bisha 2012) and wrapping
configuration (Singh et al 2014). For example, heavier gauge film wrapped at higher tension to loads with more
weight increases the containment force and leads to more compression and compaction of the load on top of the
pallet.
The objective of the research was to determine the effect of containment force on the level of bridging.
The difference in deformation of a simulated pallet will be used to assess the effect.
4.3. Materials and Methods
4.3.1. Materials
The unit load sample used in this study (Figure 20) consisted of a simulated pallet, three layers of
packages, and stretch wrap. In addition, 64 metal blocks (6.8 lb (3.1 kg) per metal block) were applied to the top
of the unit load to increase the total weight of the unit load. Except for the minor weight variance due to the
simulated pallet and stretch wrap types, the total weight of the unit load including packages (576 lb (261.3 kg))
and metal blocks (435 lb (197.3 kg)) was consistently maintained to 1,011 lb (458.6 kg) throughout the entire
experiment.

75
Figure 20. Structure of a unit load sample and experimental set-up used in this study.
Two 40 in. (L) x 40 in. (W) (1,016 mm x 1,016 mm) birch plywood panels having different thicknesses
were used to simulate different pallet stiffnesses: a ½ in. (13 mm) birch plywood panel and a ¾ in. (19 mm)
birch plywood panel. The bending stiffnesses of the panels were measured by three-point bending tests using a
fixed platen compression tester (Tinius Olsen). The stiffness of the ½ in. panel was 1,078 lb/in. and the stiffness
of the ¾ in. panel was 371 lb/in. The stiffnesses of the panels were in the adjusted stiffness range of typical
pallets determined using the same bending test (Table 15). In this study, the ½ in. (13 mm) birch plywood panel
and the ¾ in. (19 mm) birch plywood panel were represented as low stiffness pallet and high stiffness pallet,
respectively.
Table 15. Description of pallets and simulated pallets investigated in this study.
Pallets Dimension (LxW) Adjusted bending stiffness
Block class wood pallet 48 in. x 40 in.
(1,209 mm x 1,016 mm)
2,804 lb/in
(50 kg/mm)
Multiple-use plastic pallet 48 in. x 40 in.
(1,209 mm x 1,016 mm)
1,508 lb/in
(27 kg/mm)
Stringer class wood pallet 48 in. x 40 in.
(1,209 mm x 1,016 mm)
1,056 lb/in
(19 kg/mm)
Single-use plastic pallet 44 ½ in. x 38 ¼ in.
(1,130 mm x 978 mm)
324 lb/in
(6 kg/mm)
Simulated pallets Dimension (LxW) Bending stiffness
High stiffness (¾ in. (19 mm) Birch plywood) 40 in. x 40 in.
(1,016 mm x 1,016 mm)
1,078 lb/in
(19 kg/mm)
Low stiffness (½ in. (13 mm) Birch plywood) 40 in. x 40 in.
(1,016 mm x 1,016 mm)
371 lb/in
(7 kg/mm)
76
Three sizes of corrugated paperboard boxes (B-flute) were used in this study. The external dimensions
of the three boxes were 5 in. x 10 in. x 10 in. (127 mm x 254 mm x 254 mm); 10 in. x 10 in. x 10 in. (254 mm x
254 mm x 254 mm); and 20 in. x 10 in. x 10 in. (504 mm x 254 mm x 254 mm). The boxes were a regular
slotted container (RSC) style with the board combination of 35/26B/35 (lb/msf). The value of edge crush test
(ECT) was 32 lb/in. (571 g/mm). The boxes were manufactured and shipped knocked-down by Packaging
Corporation of America, Roanoke, Virginia, USA. Rigid oriented strand board (OSB) boxes, manufactured
using 0.5 in. (13 mm) thick OSB board to the exact inside dimensions of the corrugated paperboard boxes, were
placed into the corrugated box. The OSB boxes were filled with dried sand. Once the OSB boxes were filled
with sand, a lid was secured with four metal screws to seal the box. Hot melt glue was applied to each of the
flaps of the corrugated paperboard box to seal the box. The weights of each package for the small, medium, and
large size packages were 6 lb (2.7 kg), 12 lb (5.4 kg), and 24 lb (10.8 kg), respectively.
Eighty gauge thickness (0.0008 in., 0.02 mm) linear low-density polyethylene (LLDPE) stretch film,
supplied by Berry Plastics, Evansville, Indiana, USA, was used for stretch wrapping unit load samples. Three
containment force levels were used in this study: 0 lb (0 kg, no stretch wrap), 30 lb (13.7 kg), and 60 lb (27.2
kg). The detailed stretch wrapping procedure is discussed in Section 2.2.2. Table 16 shows the detailed
characteristics of each component of the unit load sample used in this study.

77
Table 16. Description of unit load components used in this study.
Simulated pallet
Dimension (L x H x H) Weight
40 in. x 40 in. x 0.5 in.
(1,016 mm x 1,016 mm x 13 mm)
14.6 lbs
(6.6 kg)
40 in. x 40 x in. x 0.75 in.
(1,016 mm x 1,016 mm x 19 mm)
23.8 lbs
(10.8 kg)
Package
(Corrugated paperboard box + OSB +
Sand)
Outer Dimension (L x W x H) Filled weight
5 in. x 10 in. x 10 in.
(127 mm x 254 mm x 254 mm)
6 lbs
(2.7 kg)
10 in. x 10 in. x 10 in.
(254 mm x 254 mm x 254 mm)
12 lbs
(5.4 kg)
20 in. x 10 in. x 10 in.
(504 mm x 254 mm x 254 mm)
24 lbs
(10.8 kg)
Stretch film Dimension (W x H)
20 in. x 0.008 in. (508 mm x 0.02 mm)
Metal block
Dimension (L x W x H) Weight (each)
8 in. x 4 in. x 0.75 in.
(203.2 mm x 101.6 mm)
6.8 lbs
(3.1 kg)

78
4.3.2. Testing Methods
4.3.2.1. Unit load Bending Test
Unit load bending tests using a 3x3x2 factorial experimental design were performed to investigate the
effects of containment force on unit load deflection (Table 17). All combinations were tested in triplicate.
Table 17. Experimental design of the unit load bending test on simulated pallets.
Stiffness of
simulated pallet
Containment
force
Packaging size (L x W x H) Replicates
Low stiffness
(1/2 in. (13 mm)
Birch plywood
board)
0 lb (0 kg)
(no stretch
wrap)
5 in. x 10 in. x 10 in. (127 mm x 254 mm x 254 mm) 3
10 in. x 10 in. x 10 in. (254 mm x 254 mm x 254 mm) 3
20 in. x 10 in. x 10 in. (504 mm x 254 mm x 254 mm) 3
30 lb
(13.6 kg)
5 in. x 10 in. x 10 in. (127 mm x 254 mm x 254 mm) 3
10 in. x 10 in. x 10 in. (254 mm x 254 mm x 254 mm) 3
20 in. x 10 in. x 10 in. (504 mm x 254 mm x 254 mm) 3
60 lb
(27.2 kg)
5 in. x 10 in. x 10 in. (127 mm x 254 mm x 254 mm) 3
10 in. x 10 in. x 10 in. (254 mm x 254 mm x 254 mm) 3
20 in. x 10 in. x 10 in. (504 mm x 254 mm x 254 mm) 3
High stiffness
(3/4 in. (19 mm)
Birch plywood
board)
0 lb (0 kg)
(no stretch
wrap)
5 in. x 10 in. x 10 in. (127 mm x 254 mm x 254 mm) 3
10 in. x 10 in. x 10 in. (254 mm x 254 mm x 254 mm) 3
20 in. x 10 in. x 10 in. (504 mm x 254 mm x 254 mm) 3
30 lb
(13.6 kg)
5 in. x 10 in. x 10 in. (127 mm x 254 mm x 254 mm) 3
10 in. x 10 in. x 10 in. (254 mm x 254 mm x 254 mm) 3
20 in. x 10 in. x 10 in. (504 mm x 254 mm x 254 mm) 3
60 lb
(27 .2kg)
5 in. x 10 in. x 10 in. (127 mm x 254 mm x 254 mm) 3
10 in. x 10 in. x 10 in. (254 mm x 254 mm x 254 mm) 3
20 in. x 10 in. x 10 in. (504 mm x 254 mm x 254 mm) 3
Total runs 54
In Figure 21, all unit load bending tests were conducted on the platform of a stretch-wrap machine
(Wulftec, Model WSML-150-b) in order to consistently apply the stretch wrap to the unit load and avoid
variation due to moving the unit load after preparation. The 40 in. x 40 in. (1,016 mm x 1,016 mm) simulated
pallet was supported on two double-stacked 4 in. (102 mm) wide and 4 in. (102 mm) height I-beams with a 36 in.
(914 mm) span between the beams. The grain direction of the veneer was perpendicular to the supports. An
additional double-stacked 4 in. (102 mm) wide I-beam was positioned next to the center of the simulated pallet
to prevent the deflection of the unit load during loading of the packages. Three layers of packages were placed
on the simulated pallet. In addition, two layers of metal blocks were stacked onto the top layer of the packages
to increase the total weight of the unit load.

79
Figure 21. Experimental set-up of the unit load bending test.
Once the packages were loaded on the simulated pallet, the LLDPE stretch film was applied using the
stretch-wrapping machine. The same rotational speed of the turn table (24.3 in./sec (617.2 mm/sec)) and
movement speed of the carriage (1.2 in./sec (30.5 mm/sec)) were used on all unit load samples. The film’s pre-
stretch was 200%. This was controlled using a film stretch measurement using a film stretch indicator (Highlight,
Model PTC-919M-HI-10). The wrapping pattern of each wrapping cycle consisted of one layer of overlap on
the top and one layer on the bottom. Two and four cycles of wrapping were applied to generate 30 lb (13.6 kg)
and 60 lb (27.2 kg) containment force, respectively. In order to prepare a unit load with 30 lb (13.6 kg)
containment force, 0.5 lb (227 g) of the stretch film was wrapped to the unit load. For creating a unit load with
60 lb (27.2 kg) of containment force, 1 lb (454 g) of the stretch film was applied to the unit load.
A digital containment force measurement system (Highlight, Model Portable Film Force System) was
used to measure the containment force of the stretch wrap. A load-cell was located at 18 in. (457 mm) and 10 in.
(254 mm) from the corner of a unit load face as described in ASTM 4649-Standard Guide for Selection and Use
of Stretch Wrap Films. The precision of the containment force measurement was ±2 lb (±907 g) from the target

80
force. The load-cell was removed from the unit load after the containment force measurement was completed.
The film was removed from the unit load and it was stretch wrapped again with the same machine setting and
procedure. It was assumed the same containment force was achieved.
Three string potentiometers (UnitMeasure, Model P510-5-S3) were placed on the middle and center of
both unsupported edges of the simulated pallet to measure the deflection of the unit load samples. A pallet jack
was used to lift up and release the samples. The unit load was lifted slightly with the pallet jack to remove the I-
beam located next to the center of the unit load and was leveled again to the two supports using the pallet jack.
As the pallet jack was lowered, the unit load deflections were measured and recorded after 30 seconds.
A three-way factorial Analysis of Variance (ANOVA) test was performed to analyze the effects of
containment force and packaging size on the deflection of unit loads on two different simulated pallet stiffnesses.
Post-hoc analysis was conducted to check the level of difference among levels of treatments using Tukey’s HSD
method. A statistics software (JMP Pro®, Version 10) was used for performing the statistical analysis. Equation
4 shows the statistical model of the experimental design:
𝑦𝑖𝑗𝑘𝑟 = 𝜇 + 𝛼𝑖 + 𝛽𝑗 + 𝛾𝑘 + (𝛼𝛽)𝑖𝑗 + (𝛽𝛾)𝑗𝑘 + (𝛼𝛾)𝑖𝑘 + (𝛼𝛽𝛾)𝑖𝑗𝑘 + 휀𝑖𝑗𝑘𝑟
[Equation 4]
Where:
𝑦𝑖𝑗𝑘𝑟 = unit load deflection (subject of interest), 𝜇 = overall mean, 𝛼𝑖 = effect of 𝑖th level of containment force,
𝛽𝑗 = effect of 𝑗th level of packaging size, 𝛾𝑘= effect of 𝑘th
level of simulated pallet stiffness, (𝛼𝛽)𝑖𝑗 = joint
effects of 𝑖th level of containment force and 𝑗th
level of packaging size, (𝛽𝛾)𝑗𝑘 = joint effects of 𝑗th level of
packaging size and 𝑘th level of simulated pallet stiffness, (𝛼𝛾)𝑖𝑘 = the joint effects of 𝑖th
level of containment
force and 𝑘th level of simulated pallet stiffness, (𝛼𝛽𝛾)𝑖𝑗𝑘 = joint effects of 𝑖th
level of containment force and 𝑗th
level of packaging size and 𝑘th level of simulated pallet stiffness, 휀𝑖𝑗𝑘𝑟 = random error with N(0,𝜎2), 𝑖 = factor
level of containment force group (1,2,3); 𝑗 = factor level of packaging size group (1,2,3); 𝑘 = factor level of
simulated pallet stiffness group (1,2); 𝑟 = replicate index (1,2,3).

81
4.3.2.2. Simulated Pallet Bending Test with Rack Support Condition Using an Airbag
Pallet bending tests using a flexible airbag were performed to measure the deflection of the simulated
pallets supporting uniform flexible load distribution (Figure 22). This represents a non-bridged payload. The
simulated pallets were supported on two 4 in. (102 mm) width and 4 in. (102 mm) height I-beams spaced 36 in.
(914 mm) apart with a 2 in. (51 mm) underhang on each side. The simulated pallets were loaded to 1,024 lb (464
kg) and the deflection of the simulated pallet was measured for 30 seconds using string potentiometers
(UnitMeasure, Model P510-5-S3) placed at the middle and the center of both unsupported edges of the
simulated pallet.
Figure 22. Experimental set-up of the simulated pallet bending test with rack support condition using a flexible
airbag to represent a non-bridged payload on top of the pallet.
4.3.2.3. Pressure Distribution Mapping
A digital pressure measurement system, including a pressure pad (Tekscan, Model 5400N-94) and a
corresponding sensor map (Tekscan, Model A-M2), was used to measure the pressure distribution between the
top of the simulated pallet and the packaging during the unit load bending tests. The pressure pad system was
connected to a data acquisition software (Tekscan, Model I-Scan® ) to record the pressure gained from each
sensel of the pad from 3-90 psi in real-time. The pressure pad was placed between the simulated pallet and the

82
packages, covering a quarter of the simulated pallet surface. The images were taken after the center I-beam was
removed.
4.4. Results and Discussion
The results of the factorial ANOVA analyses (Tables in Appendix B) show that there were statistically
significant effects of the stretch wrap containment force and packaging size, and the stiffness of simulated pallet
on the unit load deflection.
Tables 18 and 19 show the results of unit load bending tests and simulated pallet bending tests using the
airbag. Differences among the stretch wrap containment force and packaging size for each simulated pallet
determined by a post-hoc analysis using Tukey’s HSD tests are denoted with capital letters in Tables 18 and 19.
The packaging size had statistically significant effects on the unit load deflections at all measurement locations
regardless of the levels of the stretch wrap containment force and the stiffness of simulated pallets. The stretch
wrap containment force had statistically significant effects on the unit load deflections at all measurement
locations when the unit load was made of the smallest sized packages (5 in. x 10 in. x 10 in. (127 mm x 254 mm
x 254 mm)) or medium sized packages (10 in. x 10 in. x 10 in. (254 mm x 254 mm x 254 mm)). However, it did
not have a significant effect on the unit load deflections when the unit load contained the largest sized packages
(20 in. x10 in. x10 in. (504 mm x 254 mm x 254 mm)). The extremely strong load-bridging generated by the
largest sized packages (20 in. x10 in. x10 in. (504 mm x 254 mm x 254 mm)) could offset the effect of stretch
wrap containment force on the unit load deflection in this case.

83
Table 18. Average unit load deflections as a function of stretch wrap containment force, packaging size, and stiffness of simulated pallet with
Tukey’s HSD results to determine the differences among containment force groups for each packaging size level and simulated p allet.
Simulated
pallet
stiffness 1
Packaging
size 2
Containment
force (lb) 3
Average unit load deflection (in.)
Front location Center location Back location
in COV (%) Tukey’s 4
in COV (%) Tukey’s 4
in COV (%) Tukey’s 4
Low
Airbag 2.11 2.11 2.11
Small
0 1.53 4 A 1.65 5 A 1.51 6 A
30 0.49 4 B 0.52 3 B 0.50 6 B
60 0.30 6 C 0.31 6 C 0.30 5 C
Medium
0 0.60 10 A 0.66 8 A 0.60 10 A
30 0.22 6 B 0.25 6 B 0.23 6 B
60 0.14 6 C 0.15 8 C 0.14 8 C
Large
0 0.13 4 A 0.15 6 A 0.12 4 A
30 0.10 4 B 0.11 4 B 0.10 5 B
60 0.09 3 B 0.09 3 C 0.09 4 B
High
Airbag 0.52 0.53 0.56
Small
0 0.39 1 A 0.42 1 A 0.41 2 A
30 0.20 3 B 0.21 3 B 0.21 2 B
60 0.15 4 C 0.16 4 C 0.16 4 C
Medium
0 0.22 2 A 0.24 3 A 0.22 2 A
30 0.13 8 B 0.14 7 B 0.13 8 B
60 0.10 5 C 0.11 5 C 0.11 6 C
Large
0 0.09 7 A 0.10 8 A 0.09 7 A
30 0.08 7 B 0.08 6 B 0.08 6 A
60 0.07 8 B 0.07 5 B 0.08 8 A
1 The low and high stiffness of simulated pallets were made of ½ in. and ¾ in. birch plywood panels, respectively.
2 The small, medium, and large sizes of packaging have 5 in. x 10 in. x 10 in. (127 mm x 254 mm x 254 mm), 10 in. x 10 in. x 10 in. (254 mm x 254 mm x 254 mm),
and 20 in. x 10 in. x 10 in. (508 mm x 254 mm x 254 mm), respectively. 3 Zero pound of containment force means that the unit load had no stretch wrap.
4 Differences among containment force groups for each packaging size level and simulated pallet are denoted with capital letters (A, B, or C) determined by Tukey’s
HSD at α=0.05.
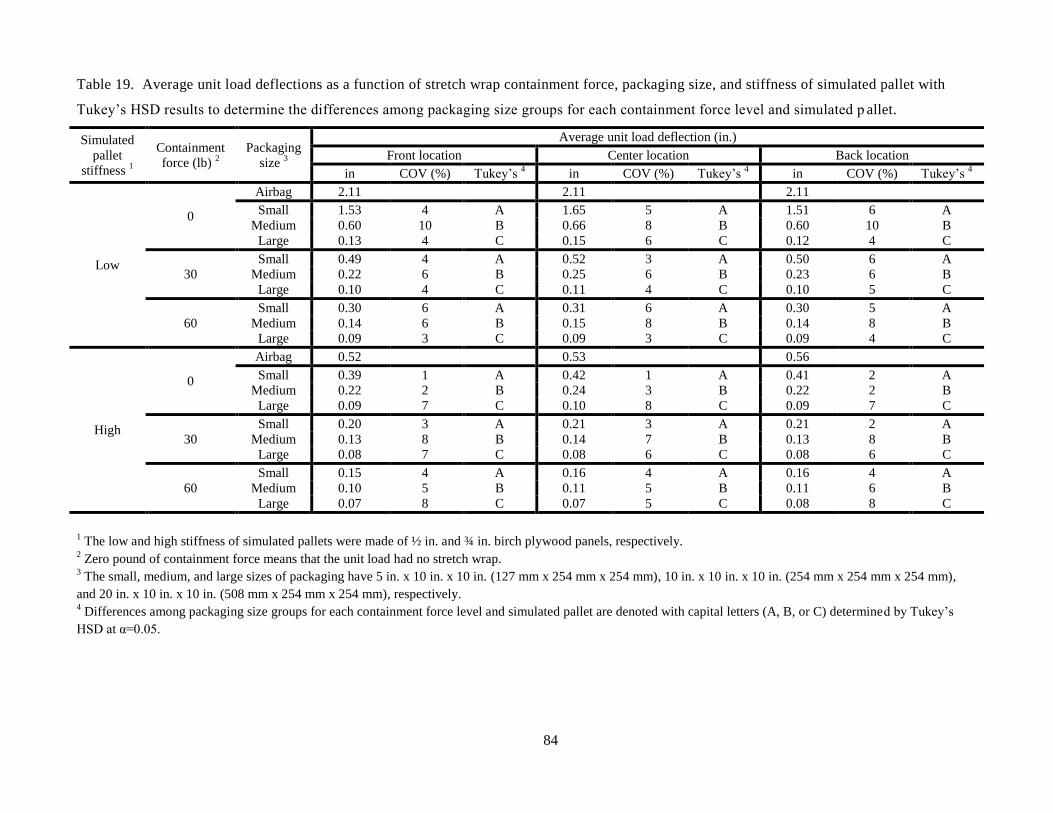
84
Table 19. Average unit load deflections as a function of stretch wrap containment force, packaging size, and stiffness of simulated pallet with
Tukey’s HSD results to determine the differences among packaging size groups for each containment force level and simulated p allet.
Simulated
pallet
stiffness 1
Containment
force (lb) 2
Packaging
size 3
Average unit load deflection (in.)
Front location Center location Back location
in COV (%) Tukey’s 4
in COV (%) Tukey’s 4
in COV (%) Tukey’s 4
Low
0
Airbag 2.11 2.11 2.11
Small 1.53 4 A 1.65 5 A 1.51 6 A
Medium 0.60 10 B 0.66 8 B 0.60 10 B
Large 0.13 4 C 0.15 6 C 0.12 4 C
30
Small 0.49 4 A 0.52 3 A 0.50 6 A
Medium 0.22 6 B 0.25 6 B 0.23 6 B
Large 0.10 4 C 0.11 4 C 0.10 5 C
60
Small 0.30 6 A 0.31 6 A 0.30 5 A
Medium 0.14 6 B 0.15 8 B 0.14 8 B
Large 0.09 3 C 0.09 3 C 0.09 4 C
High
0
Airbag 0.52 0.53 0.56
Small 0.39 1 A 0.42 1 A 0.41 2 A
Medium 0.22 2 B 0.24 3 B 0.22 2 B
Large 0.09 7 C 0.10 8 C 0.09 7 C
30
Small 0.20 3 A 0.21 3 A 0.21 2 A
Medium 0.13 8 B 0.14 7 B 0.13 8 B
Large 0.08 7 C 0.08 6 C 0.08 6 C
60
Small 0.15 4 A 0.16 4 A 0.16 4 A
Medium 0.10 5 B 0.11 5 B 0.11 6 B
Large 0.07 8 C 0.07 5 C 0.08 8 C
1 The low and high stiffness of simulated pallets were made of ½ in. and ¾ in. birch plywood panels, respectively.
2 Zero pound of containment force means that the unit load had no stretch wrap.
3 The small, medium, and large sizes of packaging have 5 in. x 10 in. x 10 in. (127 mm x 254 mm x 254 mm), 10 in. x 10 in. x 10 in. (254 mm x 254 mm x 254 mm),
and 20 in. x 10 in. x 10 in. (508 mm x 254 mm x 254 mm), respectively. 4 Differences among packaging size groups for each containment force level and simulated pallet are denoted with capital letters (A, B, or C) determined by Tukey’s
HSD at α=0.05.

85
Figure 23 shows the fractional changes in the unit load deflections as a function of the stretch
wrap containment force, packaging size, and stiffness of simulated pallets. For both the low and the high
stiffness simulated pallets, the deflections of unit loads decreased as the stretch wrap containment force
and packaging size increased.
The fractional changes in the unit load deflections due to the stretch wrap containment force
increase were larger when the unit load had smaller size of packages and lower stiffness of pallets 1. For
the low stiffness simulated pallet, the unit load deflections measured at the center with small 2, medium
3,
and large 4 packages were reduced by 68%, 63%, and 28%, respectively, when the stretch wrap
containment force increased to 30 lb (13.6 kg) from zero (no stretch wrap). The unit load deflections were
further reduced by 81%, 77%, and 44% when the stretch wrap containment force increased to 60 lb (27.2
kg) from zero (no stretch wrap). Meanwhile, for the high stiffness simulated pallet, the deflection of the
unit load decreased only by 50%, 41%, and 25%, respectively, and by 63%, 55%, and 29%, respectively,
due to the same changes in the containment force. Similar trends in the unit load deflections were found
in other measurement locations (front and back of the simulated pallets).
The fractional changes in the unit load deflections due to the packaging size increase were larger
when the unit load had lower stretch wrap containment force and lower stiffness of pallets 1. For the low
stiffness simulated pallet, the unit load deflections measured at the center of the unit loads with zero (no
stretch wrap), 30 lb (13.6 kg), and 60 lb (27.2 kg) of stretch wrap containment forces were reduced by
60%, 52%, and 51%, respectively, when the packaging size increased to medium 3 from small
2. The unit
load deflections were further reduced by 91%, 79%, and 72% when the packaging size increased to large
4 from small
2. For the high stiffness simulated pallet, the deflection of unit load decreased by 44%, 35%,
1 Previous studies (Fegan 1982; Colie 1984) reported similar results regarding the effect of pallet stiffness on the
unit load deflections. The studies indicated that the reduction in unit load deflections due to load-bridging of unit
loads became more severe as the stiffness of the pallet decreased. 2 5 in. x 10 in. x 10 in. (127 mm x 254 mm x 254 mm)
3 10 in. x 10 in. x 10 in. (254 mm x 254 mm x 254 mm)
4 20 in. x 10 in. x 10 in. (508 mm x 254 mm x 254 mm)
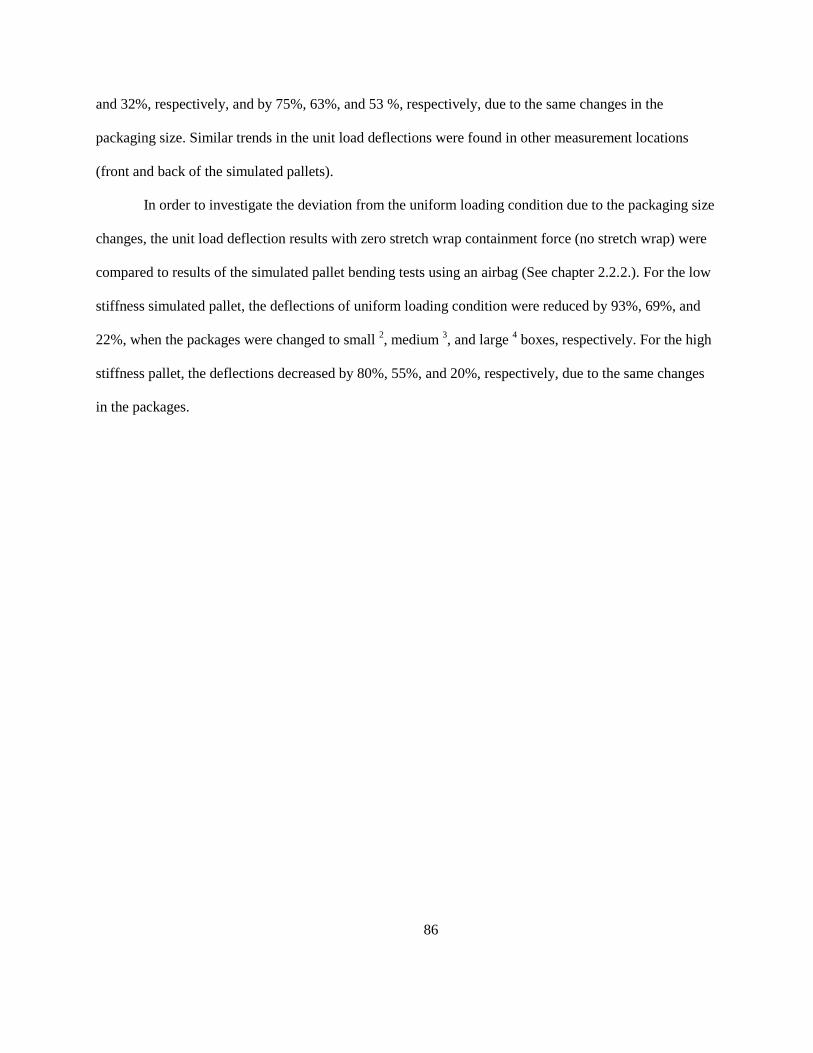
86
and 32%, respectively, and by 75%, 63%, and 53 %, respectively, due to the same changes in the
packaging size. Similar trends in the unit load deflections were found in other measurement locations
(front and back of the simulated pallets).
In order to investigate the deviation from the uniform loading condition due to the packaging size
changes, the unit load deflection results with zero stretch wrap containment force (no stretch wrap) were
compared to results of the simulated pallet bending tests using an airbag (See chapter 2.2.2.). For the low
stiffness simulated pallet, the deflections of uniform loading condition were reduced by 93%, 69%, and
22%, when the packages were changed to small 2, medium
3, and large
4 boxes, respectively. For the high
stiffness pallet, the deflections decreased by 80%, 55%, and 20%, respectively, due to the same changes
in the packages.
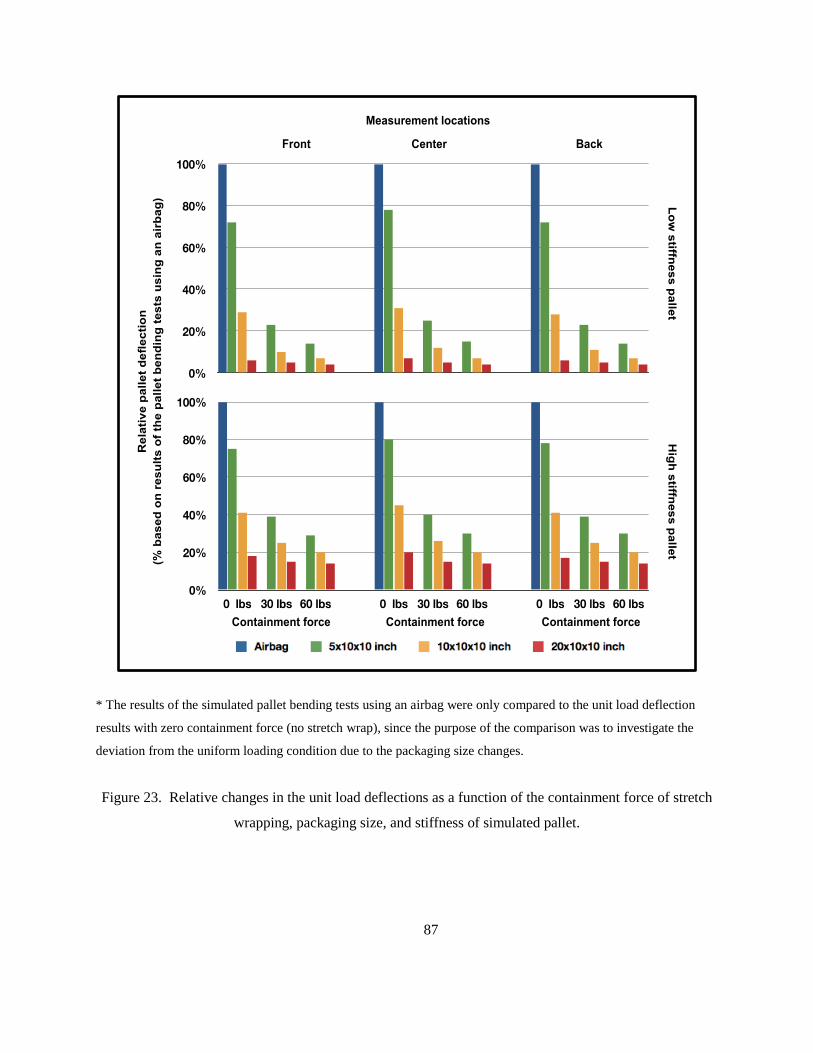
87
* The results of the simulated pallet bending tests using an airbag were only compared to the unit load deflection
results with zero containment force (no stretch wrap), since the purpose of the comparison was to investigate the
deviation from the uniform loading condition due to the packaging size changes.
Figure 23. Relative changes in the unit load deflections as a function of the containment force of stretch
wrapping, packaging size, and stiffness of simulated pallet.

88
The changes in the unit load deflection can be explained by the changes in stress distribution on
the simulated pallet due to the characteristics of the unit loads.Figures 24 and 25 present the changes in
the stress distribution for the investigated unit loads as a function of the containment force and packaging
size on the high and low stiffness simulated pallets, respectively. For both simulated pallets with low and
high stiffness, more stress was concentrated at the simulated pallet end supported by the rack as the
stretch wrap containment force increased. Increased stress concentration was also observed on the
simulated pallet end supported by the rack as the packaging size increased. The changes in the stress
distribution due to changes in the stretch wrap containment force and packaging size were more evident at
the low stiffness simulated pallet. The middle section of simulated pallets experienced stress reduction, as
more load stress was concentrated on the simulated pallet end supported by the rack due to the changes in
the stretch wrap containment force, packaging size, and simulated pallet stiffness. The decrease of unit
load deflections caused by the stretch wrap containment force increase, packaging size increase, and
simulated pallet stiffness decrease were led by this change in the stress distribution.
The raw pressure values on the top of one quarter of the simulated pallets were quantified and
converted into three-dimensional diagrams. The pressure value shown in each cell in the diagrams
represents the corresponding actual pressure value for each sensel (0.45 in2/sensel (2.9 cm
2/sensel)). The
quantified raw pressure data were mirrored to expand the pressure values of a quarter of the simulated
pallet (20 in. x 20 in.(508 mm x 508 mm)) to the full-size simulated pallet (40 in. x 40 in. (1,016 mm x
1,016 mm)) based on assumed symmetric response. The three-dimensional diagrams for raw pressure
values for the full-size simulated pallet are presented in Figures C1 through C18 of Appendix C. In
addition, the data across the width of the sensed area was averaged along the length of the simulated
pallet at every 0.67-inch, which is the width of each sensel, based on assumed symmetric response.
Sensels that recorded 0 psi were not included in the averaged pressure values. The diagrams showing the
averaged pressures were presented Figure D1 through D18 of Appendix D.

89
Simulated
pallet
stiffness
Containment
Force
Packaging size 1
Small
Medium
Large
High
0 lb (0 kg)
(not stretch
wrap)
30
(13.6 kg)
60 lb
(27.2 kg)
* Each image shows a quarter section of the simulated pallet. The bottom right corner of each image shows the
right-front corner of the unit load supported by the rack. The right side of each image shows the end of the simulated
pallet supported by the rack, and the left side of the image shows the middle section of the simulated pallet.
1 The small, medium, and large sizes of packaging have 5 in. x 10 in. x 10 in. (127 mm x 254 mm x 254 mm), 10 in.
x 10 in. x 10 in. (254 mm x 254 mm x 254 mm), and 20 in. x 10 in. x 10 in. (508 mm x 254 mm x 254 mm),
respectively.
Figure 24. Changes in the stress distributions on the top of one quarter of the high stiffness simulated
pallets.

90
Pressure
range
Simulated
pallet
stiffness
Containment
Force
Packaging size 1
Small
Medium
Large
Low
0 lb (0 kg)
(no stretch
wrap)
30 lb
(13.6 kg)
60 lb
(27.2 kg)
* Each image shows a quarter section of the simulated pallet. The bottom right corner of each image shows the
right-front corner of the unit load supported by the rack. The right side of each image shows the end of the simulated
pallet supported by the rack, and the left side of the image shows the middle section of the simulated pallet.
1 The small, medium, and large sizes of packaging have 5 in. x 10 in. x 10 in. (127 mm x 254 mm x 254 mm), 10 in.
x 10 in. x 10 in. (254 mm x 254 mm x 254 mm), and 20 in. x 10 in. x 10 in. (508 mm x 254 mm x 254 mm),
respectively.
Figure 25. Changes in the stress distributions on the top of one quarter of the low stiffness simulated
pallets.

91
In ISO 8611, the failure of a pallet is decided based on two criteria to determine the load carrying
capacity of the pallet design: 1) physical failure of the entire pallet or its components, or 2) deflection
limit of the pallet (6% of the free span between supports). While stiffness of pallets typically governs the
load carrying capacity of flexible and low stiffness pallets, strength of pallets mainly governs the load
carrying capacity of rigid and high stiffness pallets. Therefore, it is dangerous to connect the results of
this study to the change in the load carrying capacity of all types of pallets, although they showed the
significant effects of stretch wrap containment force and packaging size on the deflection of simulated
pallets. It will be necessary to further investigate the influence of these factors on strength of simulated
pallets to draw a clear conclusion for the load carrying capacity of the pallets in future studies.
4.5. Conclusion
(1). Results of this study determined that stretch wrap has an important function during storage in
warehouse rack systems in terms of reducing pallet deformation in addition to its role in load
stabilization. For the high stiffness simulated pallet, which was comparable to the stringer class wood
pallet, deflection in the unit load of the smallest sized packages decreased by 50% and 63% when the
containment force increased from zero pounds to 30 lbs and 60 lbs, respectively.
(2). The containment force effect on reduction in the unit load deflection was the greatest for the
unit load consisting of the smallest packages (5 in. x 10 in. x 10 in.). However, containment force effect
was not significant for the largest packages (20 in. x 10 in. x 10 in.) due to extremely strong load-bridging
caused by the packages themselves.
(3). The packaging size effect on the reduction in the unit load deflection was the greatest for the
unit load having the lowest stretch wrap containment force. For the high stiffness simulated pallet
segment, which was comparable to the stringer class wood pallet spanning the width of a storage rack,
average deflection in the unit load having no stretch wrap containment force decreased by 44% and 75%,
when the packaging size was changed from the 5 in. x 10 in. x 10 in. to 10 in. x 10 in. x 10 in., and from 5

92
in. x 10 in. x 10 in. to 20 in. x 10 in. x 10 in., respectively. Compared to the deflection results of the
uniform flexible loading condition, the deflection in the unit load decreased 80% when the unit loads
consisted of the largest sized packages.
(4). As the containment force and packaging size increased, the compression stress decreased at
the center of the simulated pallet and increased at the edge of the simulated pallet. The redistribution of
compression stresses corresponded to a reduction in bending moment and explained the lower deflection
in the unit load when higher stretch wrap containment force and larger-sized packaging were tested. The
stress concentration at the pallets’ edges, caused by the stretch wrap containment force and packaging size
changes, should be accounted for in order to avoid packaging damages during storage in warehouse rack
systems.
(5). The strong effects of stretch wrap containment force on pallet deformation can be particularly
useful when applied to low stiffness and flexible pallets. However, the difference in deflection does not
necessarily indicate a greater change in the load carrying capacity of the all types of pallets. The load
carrying capacity of the pallet will be influenced by pallet design and the strength of pallets.
4.7. Limitation
There was a limitation in pressure sensor ranges (3-90 psi). Time-dependent characteristics of the
tested materials, such as creep properties, were not investigated in this study. This study only measured
deflections of simulated pallets; therefore, it is not possible to formulate a clear conclusion on the change
in the load-carrying capacity of all pallets.
4.6. Acknowledgements
USDA Forest Service, Ongweoweh Corporation, and the Members of the Center for Packaging
and Unit Load Design of Virginia Tech are gratefully acknowledged for their financial support for this

93
research project. The Roanoke, VA plant of Packaging Corporation of America (PCA) and Highlight
Industries are also acknowledged for the testing material and equipment support for this research project.
References
ASTM. (2009). ASTM D4649-03: Standard Guide for Selection and Use of Stretch Wrap Films.
American Society for Testing and Materials (ASTM) International, West Conshohocken, PA
Bisha, J. V. (2012). Correlation of the Elastic Properties of Stretch Film on Unit Load Containment,
Department of Wood Science and Forest Products, Virginia Tech, Blacksburg, VA, Ph.D. dissertation
Bush RJ., Araman PA. (2008) Final Report - Updated Pallet and Container Industry Production and
Recycling Research (2008). Virginia Tech, Blacksburg, VA.
Collie, S. (1984). Laboratory Verification of Pallet Design Procedures. Department of Wood Science and
Forest Products, Virginia Tech, Blacksburg, VA. Master’s thesis
Fegan, B. (1982). Load-support Conditions and Computerized Test Apparatus for Wood Pallets.
Department of Wood Science and Forest Products. Virginia Tech, Blacksburg, VA. Master’s thesis.
ISO.(2011) ISO 8611:Pallets for materials handling -- Flat pallets. International Organization for
Standardization (ISO): Geneva, Switzerland
Singh, J., et al. (2014). "The effect of stretch wrap prestretch on unitized load containment." Packaging
Technology and Science.
Trebilcock B. Talking pallets with modern readers. Modern Materials Handling (2013) 68: 26-34.
Peerless Media, LLC: Framingham, MA, USA
Twede D. and Selke S. (2004) Cartons, Crates and Corrugated Board Handbook of Wood and Paper
Packaging. DEStech Publications, Inc. Lancaster, PA, USA
White MS., Hamner P. (2005) “Pallets move the world: the case for developing system-based designs for
unit loads”. Forest product journal (2005) 55:8-16.

94
White MS., Dibling W., Rupert R., McLeod J. Determination of pallet maximum working loads from
nominal load measurements (1999). Center for Unit Load Design, Virginia Tech, Blacksburg, VA

95
Chapter 5: Process Methods and Levels of Automation of Wood Pallet
Refurbishment in the United States
5.1. Abstract
Wood pallet repair firms included in the study received an average of approximately 1.28 million
cores (i.e., used pallets) for recovery in 2012. A majority of cores received were stringer style pallets
(93%) rather than block pallets (7%). The most common pallet size received and repaired by firms was 48
x 40 inch. The most commonly used stringer repair method was the application of companion stringers.
Most firms (69%) travelled 11-50 miles to obtain cores. It was found that most firms utilized high levels
of manual labor with machinery support. The board trimming and pallet sorting/stacking processes had
the highest level of automation, while the inspection, nailing and painting processes utilized manual labor.
5.2. Introduction
Wood pallets remain popular and important components in modern material handling and
distribution systems. Pallets enable efficient transportation and storage of goods in a unitized form while
reducing economic transaction costs. There are an estimated 2 billion pallets in circulation in the United
States (Buehlmann et al. 2009). While pallets can be made from various materials, including rigid plastics,
metal, wood composites, and corrugated paperboard, the majority of pallets (92%) made in the U.S. are
constructed using solid wood (Trebilcock 2013) due to a favorable balance between price and
performance (Clarke 2002).
The repair of cores (i.e., used pallets) is a growing trend in the United States. Newly
manufactured wood pallets are supplied to pallet users such as product manufacturers, retailers, and pallet
pooling companies. When pallets break or are damaged while circulating through the supply chain, often
they are sent to wood pallet repair firms. After the damaged pallets are repaired, they can be resupplied to
the pallet users. According to a study by Bush and Araman (2009), repair for reuse was the most frequent
96
end-of-life option for used pallets received by repair firms. Repaired pallet production has more than
doubled from 1995 to 2006, while new pallet production grew modestly (7%) during the same period
(Bush and Araman 2009). If damaged pallets cannot be repaired, they may be transformed into products
such as boiler fuel and mulch. Figure 26 provides an example of typical wood pallet repair process.
1, 2, 3, 4, 5, 6, 7, 8, 9, 10 Ten processes investigated regarding process methods and automation levels in this
study.
Figure 26. Wood pallet repair process investigated in this study.
The increased production and demand for repaired pallets is affected by numerous factors,
including a lower selling price and recycling mandates. Price benefits might be the first reason for the
increased use of repaired wood pallets. Pallet users can purchase repaired pallets at lower prices and save

97
money by avoiding landfill tipping fees. The typical price for an used Grocery Manufacturer’s
Association (GMA) 48 x 40 inch pallet is four to six dollars, while the price of a new GMA 48 x 40 inch
wood pallet is nine to eleven dollars (Ray et al., 2006). The average landfill tipping fee for hardwood
pallets is $36.69 per ton (USEPA 2012). The durability of repaired pallets also is an important factor.
(Clarke et al., 2005) found that new and repaired wood pallets are similar in resistance to rough handling,
resulting in comparable service lives in some supply chains. Recycling mandates due to growing
environmental concerns also can affect pallet repair. For example, North Carolina House Bill 1465 passed
in 2005 (NCGA 2005) have banned wood pallets from landfill disposal since October 1st, 2009 in North
Carolina.
Even though the production and demand has increased over the years, there is no standardized
process for repairing wood pallets. Damaged wood pallets are typically repaired by adding additional
components such as companion stringers or metal plates to cracked stringers or by replacing broken
deckboards. Processes and equipment vary since pallet repair firms use different methods depending on
their capabilities. Manual repair methods using hand-held tools are still common, while robotics systems
for pallet repair that require minimal manual labor recently have been introduced to the industry.
Pallet repair can be an economically and environmentally beneficial end-of-life option that can
increase the sustainability of wood pallets (Buehlmann et al. 2009). In addition, standardization of repair
methods can improve the physical performance of repaired wood pallets (Clarke et al. 2005). Despite the
use and potential value of repaired pallets, few studies have investigated the wood pallet repair industry.
The purpose of this study was to document the current status of wood pallet repair in the United
States by identifying the process methods and equipment usage in repair operation from an automation
perspective. The study reported in this paper provides information concerning the level of automation
used to repair pallets in the United States. This indicates the level of efficiency and opportunities to
improve the efficiency of the pallet repair.
98
5.3. Research Methods
A 25-item questionnaire was created to collect information regarding firm characteristics, pallet
repair procedures, and other information relevant to the pallet repair business. The questionnaire consisted
of two parts: ten questions focusing on the pallet repair processes and on automation levels, followed by
15 general information questions regarding company demographics, materials for stringer repair, wood
scrap usage, and typical core retrieval distances. Question types included close-ended inquiries, partially
open-ended inquiries with an “Other” option, and open-ended inquiries asking for short, sentence-based
answers. Before initiating the survey, the questionnaire was reviewed by three experts in the wood pallet
industry. In addition, the questionnaire was pre-tested with ten firms to verify validity. Respondents
reported data for calendar year 2012.
The pallet repair/recovery firms is the initial sample frame for the study were drawn from those
listed on the National Wood Pallet and Container Association’s (NWPCA) member list (NWPCA 2013).
NWPCA is the largest trade organization representing U.S. wood pallet and container manufacturers.
After removing duplicates and listings with invalid contact information, the sample frame included 343
firms. All of these firms were included in the sample.
The questionnaire was initially distributed on May 6, 2013 using the online survey software
Qualtrics. The first e-mail reminder was sent to all non-respondents two weeks after the initial distribution
of the questionnaire. The second and third (final) e-mail reminders were sent to non-respondents four and
six weeks after initial questionnaire distribution, respectively. In an effort to increase the response rate,
additional paper versions of the survey questionnaire were distributed to the non-respondents at the
NWPCA Annual Leadership Meeting held in Fort Lauderdale, Florida between March 1, 2014 and March
3, 2014. The survey closed on March 20, 2014.
The collected data were analyzed to determine the correlations among various factors, such as
number of employees, numbers of cores received and repaired by the firms, annual gross sales, and

99
geographical locations. The statistical software Jmp (version 10) was used to perform the statistical
analyses.
The automation levels of the wood pallet repair firms were analyzed based on two assumptions in
this study. The first assumption was that the 10 processes used during pallet repair (Figure 1) contributed
equally to a firm’s overall automation level. The second assumption was that the difference between the
three levels of automation within each process (three choice options) was the same. The choice options
were categorized into three levels that were assigned numerical values (scores) one, two, or three. Level 1
(score 1) corresponded to repair completed with hand tools (e.g. hammers and dismantling bars). Level 2
(score 2) corresponded to semi-automated repair used some electric equipment but still requiring manual
labor (e.g. bandsaw dismantlers with manual feeds). Level 3 (score 3) corresponded to fully automated
repair used an integrated electric equipment with only a minimal amount of manual labor (e.g. machine-
controlled infeed/outfeed dismantling bandsaw systems). The assigned scores of the ten unit-processes
were averaged to calculate the automation level of each responding firm.
5.4. Results and Discussion
Of the 343 firms in the sample, 52 responded. Among the 52 respondents, 13 firms did not
operate pallet repair operations in 2012. Therefore, the adjusted sample included 330 firms. Of the 39
valid responses that were received, 35 were via the email survey and 4 from the paper survey. This
resulted in an overall response rate of 11.8%.
5.4.1. Respondent Characteristics
Most respondents (82%) operated both new pallet manufacturing and pallet repair businesses
while seven (18%) engaged solely in pallet repair. The respondents were categorized into nine
geographical regions according to the Census Regions and Divisions of United States (Figure 27). The
majority of responses were obtained from firms located in the North Central States (32%), followed by
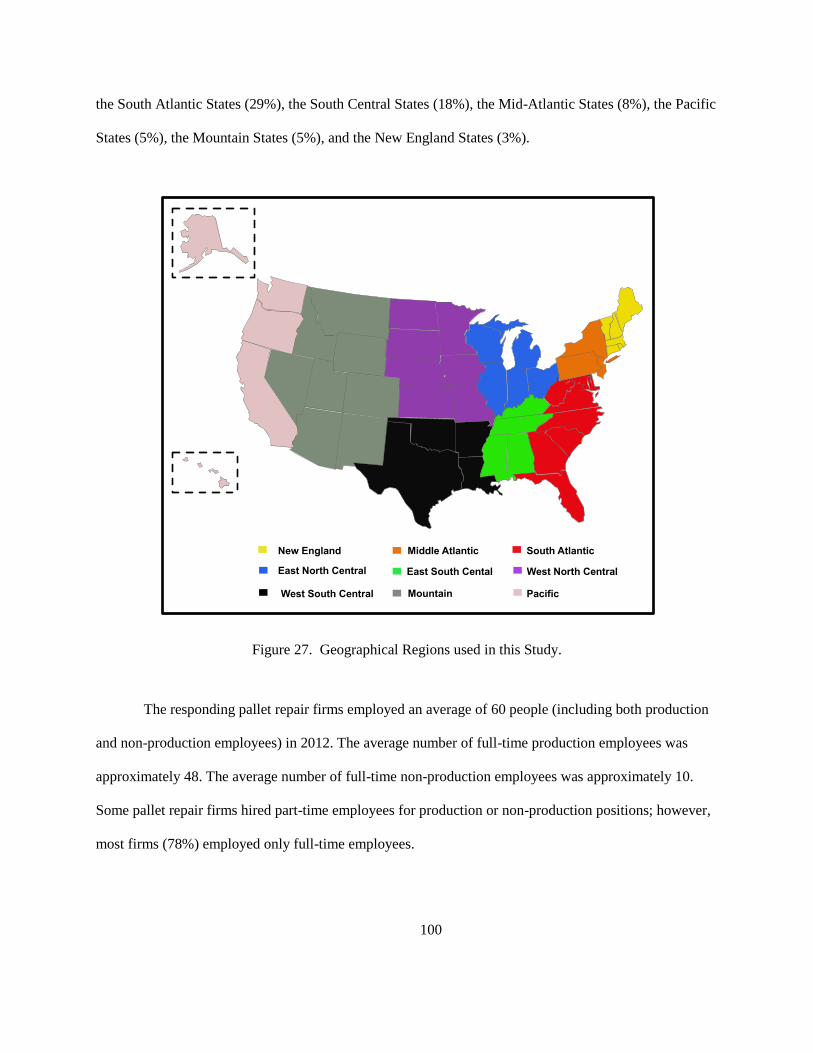
100
the South Atlantic States (29%), the South Central States (18%), the Mid-Atlantic States (8%), the Pacific
States (5%), the Mountain States (5%), and the New England States (3%).
Figure 27. Geographical Regions used in this Study.
The responding pallet repair firms employed an average of 60 people (including both production
and non-production employees) in 2012. The average number of full-time production employees was
approximately 48. The average number of full-time non-production employees was approximately 10.
Some pallet repair firms hired part-time employees for production or non-production positions; however,
most firms (78%) employed only full-time employees.
Mountain
East South Cental
West South Central
East North Central
Pacific
West North Central
South AtlanticMiddle AtlanticNew England

101
Based on the total number of employees, responding repair firm sizes were distributed as follows:
small-size firms (1-20 employees, 25%), medium-size firms (21-100 employees, 58%), and large-size
firms (Over 100 employees, 17%).
The responding pallet repair firms received an average of approximately 1.28 million cores
(median: 725,000 cores) in 2012. The results indicated much higher received-core numbers compared to a
previous study conducted in 2006 (Bush and Araman, 2009), which reported an average of 394,160
received cores. Different samples used in each study could lead to the different results regarding the
received-core numbers. While the sample used in Bush and Araman (2009) included all pallet
manufacturers and recyclers in the Unites States, the sample of this study included the U.S. pallet
recycling firms that are NWPCA members.
There are two main classes of wood pallets: stringer-class and block-class. The stringer-class
pallet is constructed from at least two stringers, multiple deckboards, and fasteners. The block-class pallet
is constructed from rectangular blocks, multiple deckboards, and fasteners. Sixty percent of firms
received both stringer-class pallets and block-class pallets. Forty percent of firms received only stringer-
class pallets, while no responding firm received only block-class pallets. The pallet repair firms who
repaired both stringer- and block- class pallets primarily repaired stringer-class pallets (93% of the pallets
repaired). Only one firm reported repairing more block-class pallets than stringer-class pallets. The
dominance of stringer-class pallets among the received cores was also found in Bush and Araman (2009)
that reported only three percent of the received cores to be block-class pallets. The greater percent of new
stringer class pallet production over block class pallets found in Trebilcock (2013) could be the primary
cause of the unbalanced ratio between stringer-class pallets and block-class pallets during the repair
process. Another reason may be the additional equipment investment necessary to repair block-class
pallets (Kirkaldy 2011).
The most common core sizes received by responding repair firms were 48 x 40 inch (80%); 42 x
42 inch (5%); and 48 x 48 inch (4%). Similar results were reported in a study on pallet users in the United

102
States in 2012 (Trebilcock 2013). Figure 28 provides the percentages for the core sizes received by
responding pallet repair firms.
Figure 28. Distribution of Pallet Sizes Received by Responding Firms in 2012.
Most responding firms (69%) reported receiving cores from a travel distance of 11 to 50 miles of
the repair firm. Twenty-three percent of firms traveled between 51 and 100 miles, and six percent traveled
between 101 and 200 miles. Two percent reported collecting cores less than 10 miles. No firm reported
collecting cores over 200 miles from the plant location. In order to analyze the association between travel
distance and other respondent characteristics gross sales, numbers of pallet repaired, and geographical
location (gross sales, numbers of pallet repaired, and geographical location) a Pearson chi-square analysis
was performed. The analysis failed to reject the null hypothesis of independence at normal significance
levels (Table 20). The typical distance for collecting cores is likely dependent on transportation costs
including gas price and the number of cores available in a region (Bouffier et al. 1995). Also, competition
for a limited number of cores may affect the firm's decision on the range they were willing to travel for
collection.

103
Table 20. Results of Pearson Chi-Square analysis to investigate the associations between the travel
distance to collect cores and respondent characteristics (at the significance level 0.5).
Respondent Characteristics N DF Chi-Square P-value (Prob>Chi-Square)
Geographical location 34 24 31.261 0.1464
Number of repaired cores 34 12 11.238 0.5087
Gross sales 35 12 8.242 0.7660
Thirty-three percent of the firms reported repairing over 1 million cores in 2012. Thirty percent of
the repair firms repaired 500,000 to 999,999 cores and eighteen percent repaired 100,000 to 499,999.
Sixteen percent of the firms and three percent of the firms reported repairing 10,000 to 99,999 cores and
less than 10,000 cores, respectively.
Most respondents (33%) reported 1 to 5 million dollars in annual gross sales in 2012. Thirty-one
percent of firms reported 5.1 to 10 million dollars while twenty-two percent reported sales of 10.1 to 20
million dollars. Eight percent of firms reported over 30 million dollars and six percent reported less than 1
million dollars in annual gross sales in 2012.
The responding pallet repair firms reported utilizing wood scraps for purposes other than the
repair. Sixty-three percent of firms reported processing wood on site to make mulch or chips in 2012.
Processing wood scraps on site allows pallet repair firms to both avoid disposal tipping fees and generate
sales revenue from the resulting products. The level of contamination of the shredded used pallets is
sufficiently low; therefore, the ground wood scraps are safe for reuse as animal bedding or a litter (White
and McLeod 1989). The choice to have grinding facilities on site can be dependent on several factors
including finances, availability of space for grinding equipment, location of firms (industrial or residential
areas), and regional market variation (LeBlanc 2003). Analysis of the data collected in this study failed to
reject the null hypothesis of no statistically significant association between wood scrap processing and
gross sales, the numbers of employees, cores received, cores repaired, or geographical regions. Pallet

104
repair firms that did not processing wood scraps on site sometimes contracted third-party grinding
facilities to process their wood scraps to avoid tipping fees.
While many firms reported having scrap processing operations, only eleven percent had a furnace
or boiler that could utilize wood scraps. The gross sales, number of repaired pallets, and employee
numbers were not found to be statistically correlated to the use of a furnace or boiler. Economic
feasibility depending on relative costs of wood recovery and processing options are likely to be the
primary factors for the decision of whether to have furnace or boiler to utilize wood scraps (SWANA
2002).
5.4.2. Process Types, Equipment, and Pallet Repair Procedure
Data were obtained from wood pallet repair firms regarding the typical methods and equipment
types used in pallet repair. Figure 29 shows the processes and corresponding equipment types used by the
responding wood pallet repair firms.
All responding repair firms used forklifts to unload and load pallets. At most repair firms (87%),
operators visually inspected received pallets to make pallet-grade decisions, while some firms (13%)
employed scanning machines along with the operators’ visual inspection. To sort received pallets based
on inspected grades and stack them at various locations, firms reported using three different methods
almost equally. Thirty-eight percent of firms sorted and stacked pallets using machine-controlled
infeed/outfeed stackers, while thirty-six percent of firms manually sorted and stacked pallets. Forklifts
were used for the sorting and stacking process at twenty-six percent of responding firms.
Pallets that are unfit for repair are dismantled to create spare parts for pallet repair or ground into
mulch or other products. Bandsaw dismantlers with manual feeds were used to dismantle pallets at most
firms (87%). Other firms used dismantling bars and hammers (5%), machine-controlled infeed/outfeed
dismantling bansaw systems (5%), or disc/shear type dismantlers with manual feeds (3%).

105
To trim recovered boards, the majority of firms (62%) utilized machine-controlled infeed/outfeed
trim saws. Other repair firms used single-head or dual-head table saws (20%) or radial-arm saws (18%)
with manual feeds. Approximately three quarters of the responding repair firms (74%) used a notching
stringer process. Among these firms, the majority (69%) used single-head or double-head notching
machines with manual feeds. Others (31%) used machine-controlled infeed/outfeed single-head or
double-head notching machines.
Most firms (77%) repaired damaged pallets by hand using nail-guns on a repair table. Thirteen
percent of firms reported using machine controlled infeed/outfeed nailing systems, while ten percent
reported using corrugated metal fasteners. The majority of the responding firms (64%) did not use metal
plates for repair stringers. Among the firms who used metal plates, most firms (86%) used plating
machines (platers) with manual feeds, while other firms (14%) used machine-controlled infeed/outfeed
plating systems. The most commonly used stringer repair method was the application of companion
stringers. Various types of companion stringers were applied including half companion (used by 89% of
responding firms), C-block (used by 36% of responding firms) and full companion type (used by 11% of
responding firms).
Wood pallets received for repair may have a stamp signifying treatment in accordance with
International Standards for Phytosanitary Measures Number 15 (ISPM 15) (FAO 2009). This stamp must
be removed when the pallet is repaired. The majority of firms (85%) used paint to remove the ISPM 15
stamp or to paint pallets to custom colors. Of the firms that did use paint, eighty-five percent of firms
painted or marked repaired pallets using spray paint or paint buckets and rollers by hand. High-pressure
air spray systems and machine-controlled spray systems were used at 9% and 6% of responding firms,
respectively. For moving pallets within the firms, forklifts were the main method (85% of respondents)
followed by power conveyors (15%).
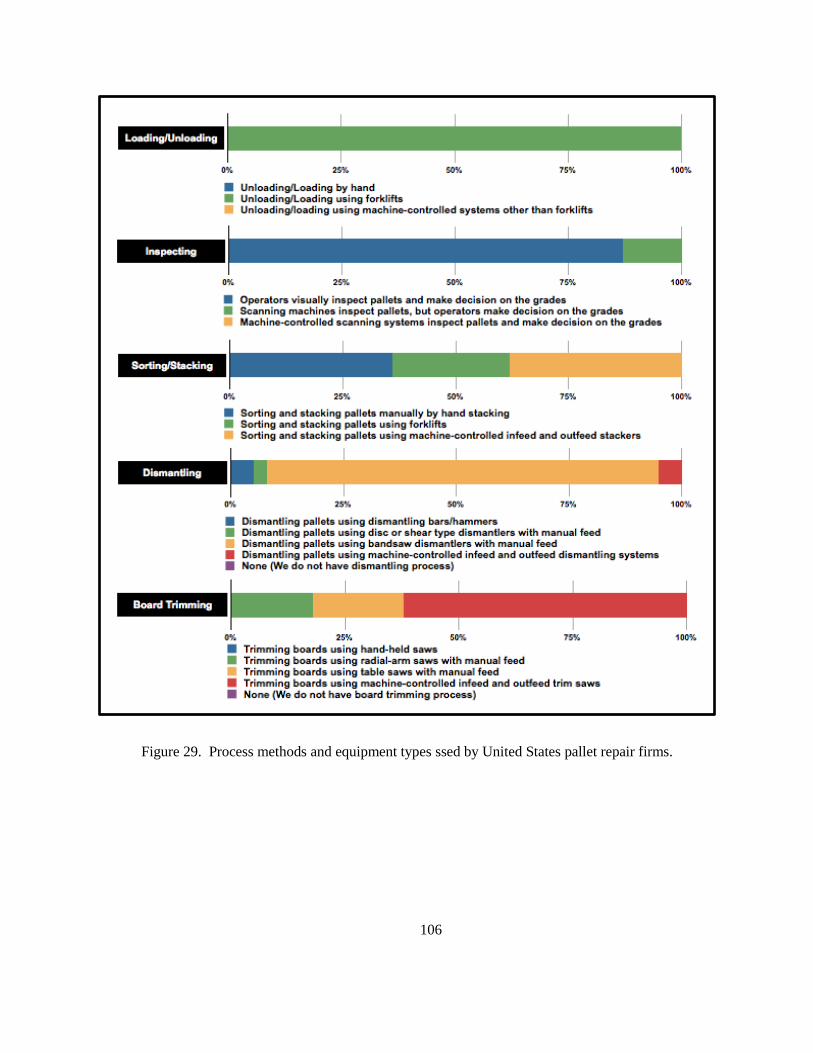
106
Figure 29. Process methods and equipment types ssed by United States pallet repair firms.
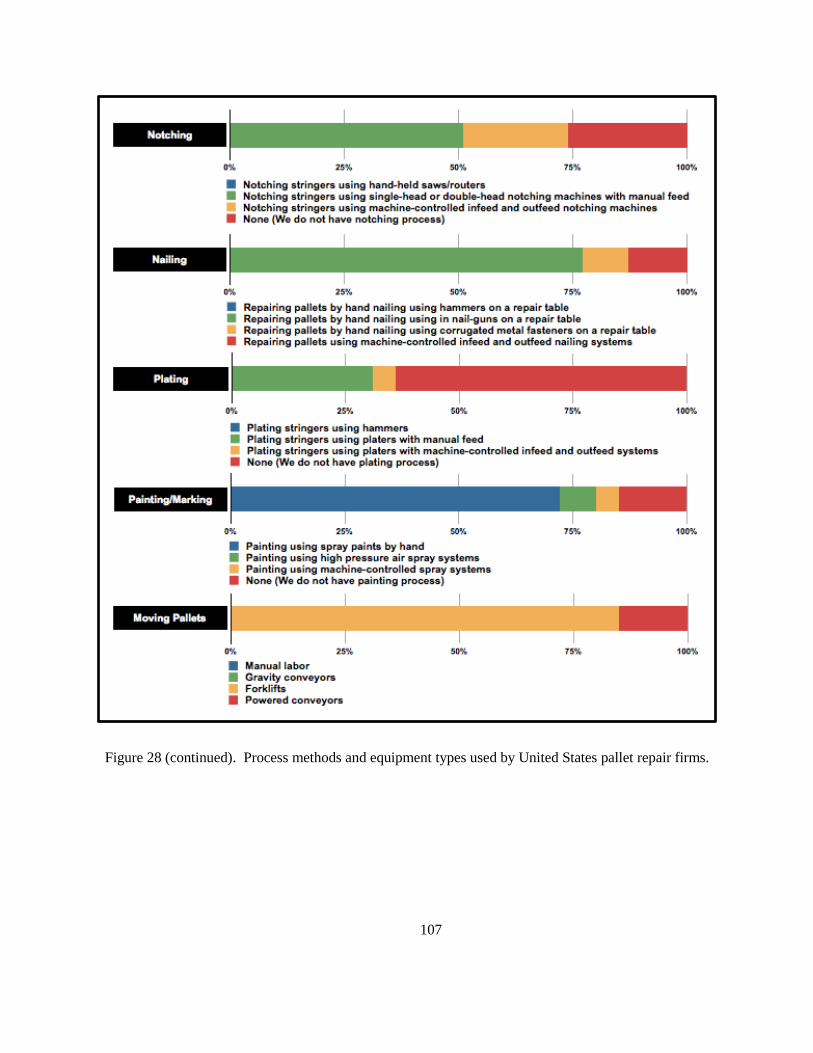
107
Figure 28 (continued). Process methods and equipment types used by United States pallet repair firms.

108
5.4.3. Overall Automation Level of the Pallet Repair Firms
The average automation levels of each responding firm was used to calculate the overall mean of
the automation of the responding firms. The overall mean automation level of the responding firms was
1.97 (standard deviation: 0.24), which was very close to the semi-automation category, following the
normal distribution (Figure 5). Shapiro-Wilk test was conducted to check the normality of the data
regarding the automation levels of the responding firms (95% confidence level); as a result, the data were
normally distributed (P-value = 0.1288).
The descriptive results (Figure 30) show that most responding firms operated the pallet repair
process using high levels of manual labor with machinery support. None of the firms implemented a
completely automated process (level of automation: 1) where machines decided everything, or a
completely manual process (level of automation: 3) where humans make all decisions and perform all
necessary actions.
Higher levels of automation, utilizing machine-controlled infeed/outfeed systems, were most
common in the board-trimming and sorting/stacking processes, while completely manual process types
were primarily used for the inspecting process, nailing, and painting processes.
Figure 30. Distribution of the automation scores of responded pallet repair firms.

109
The automation investment in the wood pallet repair process could be affected by various factors,
including technical and market availability of equipment (York 1992), economic feasibility (Michael and
Millen 1985), as well as levels of workloads and labor/safety-related regulations (Karwowski et al. 1988).
High prices of fully automated pallet repair systems as compared to alternatives could be the primary
reason for the relatively low level of automation in the U.S. wood pallet repair industry. Increasing
competition in the overall wood pallet industry (Neville 2013) and potential increasing minimum wage
can encourage pallet repair firms to adapt more automated systems for achieving better productivity and
quality.
Regulations regarding the work environment and labor safety also may impact the level of
automation during pallet repair. For example, the strict worker safety regulations for protecting labor in
European countries were a significant reason for the adoption of robotic pallet repair among European
pallet manufacturers/recyclers (Brindley 2013). Increasing regulations regarding labor and safety could
stimulate adoption of automated equipment in the U.S. The Patient Protection and Affordable Care Act
(PPACA) (2010), which is a new federal law in the U.S., might be a factor resulting the adoption of more
automated equipment and systems in the wood pallet repair industry. The PPACA forces companies with
50 or more workers to offer a health insurance package, or pay an annual penalty ($2,000) for each full-
time worker. Adopting more automated equipment could be a strategy to maintain or increase
productivity of pallet repair companies while maintaining fewer than 50 employees. According to an
interview with an automatic pallet repair system manufacturer, the demand of automatic pallet repair
equipment and process lines increased after the PPACA law was proposed.

110
5.5. Limitation
Several potential study limitations should be noted. The relatively low response rate (11.8%) in
this study might reduce the generalizability of the research findings. While NWPCA is the largest
association in the U.S. wood pallet industry, the NWPCA membership, may not be fully representative of
the U.S. wood pallet repair industry as a whole. The sample frame of this study consisted of only
NWPCA members. As such it may have been biased toward larger companies with greater production
than the wood pallet industry overall.
5.6. Conclusion
(1). Wood pallet repair firms in the United States received an average of approximately 1.28
million cores per firm (median: 725,000 cores) in 2012. The majority of cores repaired by the responding
companies were stringer class pallets (93%). The most common pallet size received and repaired was 48 x
40 inch. The most commonly used stringer repair method was the application of half companion stringers
(89% of stringer repairs). Most of the responding firms (69%) travelled 11-50 miles to obtain cores. The
majority of the firms (33%) repaired over 1 million cores in 2012, and a third of respondents (33%)
reported 1 to 5 million dollars in annual gross sales.
(2). It was found that most firms utilized high levels of manual labor with machinery support.
There was no firm that used a totally manual process or a fully-automated process to repair cores. The
board trimming and sorting/stacking processes were often automated, while the inspecting, nailing, and
painting processes were generally manual.

111
5.7. Acknowledgments
The authors would like to thank all participating wood pallet repair firms for providing data for
this research project. The National Wood Pallet Association (NWPCA) and Pallet Enterprise Magazine
are gratefully acknowledged for their support in promoting the survey. This study was financially
supported by the members of the Virginia Tech’s Center for Packaging and Unit Load Design.
References
Bouffier, C. G., Downing, C. C., and Riall, B. W. (1995). "Pallet Disposal: Current Situation and
Opportunities for Change." Georgia Tech Research Corporation, Atlanta, GA.
Brindley, C. (2013). "The Future of Pallet Production Today - Robots Effectively Used in European Pallet
Companies." Pallet Enterprise.
Buehlmann, U., Bumgardner, M., and Fluharty, T. (2009). "Ban on landfilling of wood pallets in North
Carolina: an assessment of recycling and industry capacity." Journal of cleaner production, 17(2), 271-
275.
Bush, R. J., and Araman, P. A. (2009). "Pallet Recovery, Repair and Remanufacturing in a Changing
Industry: 1999 to 2006." Pallet Enterprise, 29(8), 24-27.
Clarke, J. (2002). "Pallets 101: industry overview and wood, plastic, paper & metal options." Pallet user
education series, Pallet Enterprise.
Clarke, J. W., White, M. S., and Araman, P. A. (2005). "Comparative performance of new, repaired, and
remanufactured 48-by 40-inch GMA-style wood pallets." Forest products journal, 55(12).
FAO. (2009). "International Standards for Phytosanitary Measures 1 to 32. ." Food and Agriculture
Organization of the United Nations (FAO), Rome, Italy.
Karwowski, W., Rahimi, M., and Mihaly, T. (1988). "Effects of computerized automation and robotics on
safety performance of a manufacturing plant." Journal of Occupational Accidents, 10(3), 217-233.

112
Kirkaldy, B. (2011). "Block Pallet Repair Tips: It’s a Bit Different than Dismantling, Repairing and
Remanufacturing Stringer Pallets " Pallet Enterprise.
LeBlanc, R. (2003). "Companies Taking Closer Look At Managing Residuals." Pallet Enterprise.
Michael, G. J., and Millen, R. (1985). "Economic justification of modern computer-based factory
automation equipment: a status report." Annals of Operations Research, 3(2), 23-34.
NCGA. (2005). "Session Law 2005-362 House Bill 1465." G. A. o. N. C. (NCGA), ed., Releigh, NC.
Neville, A. (2013). "Skidding along: Renewed manufacturing activity will boost revenue despite
increased competition." IBISWorld, lnc.
NWPCA. (2013). "Pallet/Container Companies Search Results - Pallet recycling/repair." National Wood
Pallet & Container Association, Alexandria, VA.
PPACA. (2010). "Patient Protection and Affordable Care Act (PPACA): 42 U.S.C. § 18001."
Quesada-Pineda, H., Sanchez-Gomez, S., and Araman, P. A. (2012). "A quantitative study of the US
wood pallet industry based on supply chain management practices." Notes.
Ray, C. D., Michael, J. H., and Scholnick, B. N. (2006). "Supply-chain system costs of alternative grocery
industry pallet systems." Forest products journal, 56(10).
Sheridan, T. B., and Verplank, W. L. (1978). "Human and computer control of undersea teleoperators."
DTIC Document.
SWANA. (2002). "Successful Approaches to Recycling Urban Wood Waste." Solid Waste Association of
North America (SWANA), Madison, WI.
Trebilcock, B. (2013). "Reader Survey: Talking pallets with Modern’s readers." Modern Material
Handling, Peerless Media LLC, Framingham, MA.
USEPA. (2012). "Pallet Alternative Cost Calculator." The United States Environmental Protection
Agency (USEPA).

113
York, J. (1992). "Productivity in Wood Containers - Monthly Labor Review." U. S. B. o. L. Statistics, ed.,
Washington D.C.
White, MS. and McLeod J. (1989). "Properties of Shredded Wood Pallets." Pallet and Container
Laboratory Bulletin No. 12. William J. Sardo Jr. Pallet and Container Research Laboratory, Department
of Wood Science and Forest Products, Virginia Tech, Blacksburg, VA.

114
Chapter 6: Life Cycle Inventory Analysis of Refurbishment Process for 48- By
40- Inch Stringer Class Wood Pallet in the United States
6.1. Abstract
This study developed gate-to-gate life-cycle-inventory (LCI) data for the repair of 48 by 40- inch
(1,219 by 1,016- mm) stringer class wood pallets in the United States. Data were collected from seven
wood pallet repair facilities in the United States. Approximately 1.98 FBM (foot, board measure) (4.67E-
03 m3) of lumber were used for repairing each 48 by 40- inch (1,219 by 1,016- mm) stringer class wood
pallet; however, 97% of the lumber inputs were supplied using lumber from damaged pallets received by
the pallet repair facilities. Electricity powering repair equipment made the largest contribution to
greenhouse gas (GHG) emissions. Steel nails for the pallet repair had the largest contribution to GHG
emissions among the material inputs, while the dismantled lumber yielded the largest GHG emissions
credits. Overall, a repair process for a 48 by 40- inch (1,219 by 1,016- mm) stringer class wood pallet had
GHG credits rather than a positive GHG emission due to the GHG offsets from co-products.
6.2. Introduction
In global supply chains, a shipping pallet is an essential component to transport and store goods
in unit load form. In the United States, approximately 2 billion pallets circulate (Buehlmann et al. 2009),
and 90-91% of pallets are constructed out of solid wood (Trebilcock 2013). There are two main wood
pallet designs: stringer class pallets and block class pallets. The stringer class pallet consists of at least
two stringers, multiple deckboards, and fasteners; while the block class pallet consists of rectangular
blocks, multiple deckboards, and fasteners. The main difference between two pallet designs is
accessibility of material handling equipment such as forklifts and pallet jacks. Block class pallets allow
full access on all four sides for both forklifts and pallet jacks. However, stinger class pallets limit either
access on the stinger sides for both material handling equipment (when their stringers do not have notches)

115
or access on the stringer sides for pallet jacks (when they have notches). Stringer class pallets tend to
require less material and have a cheaper price than the equivalent strength of block class pallets (Clarke
2002). According to a study on pallet users in the United States in 2012 (Trebilcock 2013), stringer class
pallets which had 48 by 40- inch (1,219 by 1,016- mm) dimension were the most commonly used pallets
in U.S. supply chains.
A noticeable trend in the U.S. wood pallet market is the growing use of repaired/recovered used
pallets. Araman and Bush (2015) found that repair for reuse was the most frequent end-of-life option for
used pallets received by pallet recyclers. There are various advantages that could encourage the use of
repaired used pallets. Repaired used pallets provide cost benefits to pallet users such as low prices and
opportunity to avoid landfilling tipping fee (Buehlmann et al. 2009). Compared to newly manufactured
wood pallets, the repaired used pallets retain acceptable physical performance characteristics (White et al.
2001, Clarke et al. 2005). In addition, repairing pallets is advantageous in the face of recycling mandates
such as North Carolina House Bill 1465 passed in 2005 (NCGA 2005).
As environmental concerns grow, life cycle assessment (LCA) is used in the packaging and pallet
sectors to address sustainability management and to evaluate the environmental performance of their
products and services. There have been various LCA studies performed for comparing environmental
impacts of various types of pallets (Lee and Xu 2004, Franklin Associates 2007, Gasol et al. 2008, ERM
2008, Philip 2010, Ali 2011, Carrano et al. 2014a, Carrano et al. 2014b). However, the environmental
impacts of the wood pallet repair process has often been excluded from the system boundary of the study
(Lee and Xu 2004) or assumed to be negligible (Franklin Associates 2007, Ali 2011) due to a lack of life
cycle inventory data for the process. Even when studies (e.g. ERM 2008, Philip 2010, Carrano et al.
2014a, Carrano et al. 2014b) included the wood pallet repair process and analyze the environmental
impacts of the process, the specific life cycle inventory information were not indicated or available. Only
one study (Gasol et al. 2008) provided the life cycle inventory data for the wood pallet repair process.
116
However, the study only included pooling (rental) block class wood pallets in the LCA and had a
geographical scope of Spain.
It is clear that specific life cycle inventory data for 48 by- 40- inch (1,219 by 1,016- mm) stringer
class wood pallets, which is the most commonly used pallet type in the United States, were not indicated
in any previous studies. Detailed life cycle inventory data for this pallet type is essential in order to
perform an accurate LCA of wood pallets with a geographical scope of the United States. Reliable and
complete life cycle inventory data is a fundamental component that affects the overall quality of LCA
results (EPA 2006). An accessible life cycle inventory data regarding the wood pallet repair process will
increase the reliability, completeness, and representativeness of any future LCA study of wood pallets.
The objective of this research is to develop a life cycle inventory for the repair process of 48 by
40- inch (1,219 by 1,016- mm) stringer class wood pallets in the United States. The life cycle of this study
was gate-to-gate where the system boundary included only the pallet repair related activities, from
unloading used pallets to loading repaired pallets on trailers at the repair facilities. The functional unit of
this study was a repaired 48 by 40- inch (1,219 by 1,016- mm) stringer class wood pallet. The
geographical scope of this study was the United States and the temporal scope was the calendar year 2012.
The data collection and reporting procedures of this study were in accordance with ISO 14040 (ISO 1997)
and 14041 (ISO 1998).
The output of this study is intended for use by LCA practitioners and researchers as an input to
the LCA of 48 by 40- inch (1,219 by 1,016- mm) stringer class wood pallets from a cradle-to-grave or
cradle-to-cradle perspective.

117
6.3. Research Methods
Primary data were collected from seven wood pallet repair facilities located in the United States.
The facilities were located in California, Connecticut, Florida, North Carolina, Indiana, Montana, and
Pennsylvania. Data was collected from the responding facilities via surveys based on their bills of
materials. The responses represented production data for calendar year 2012.
The cumulative atmospheric emissions including greenhouse gas (GHG) emissions generated
during the pallet repair process were analyzed using SimaPro (Version 7.3.3) LCA modeling software
(Pre Consultants 2012).
6.3.1. Unit Process and System Boundary
The repair process for wood pallets typically consists of various sub-processes: sorting, stacking,
dismantling, trimming, notching, nailing (reassembling), plating, painting, loading/unloading, and internal
transportation. Three main materials are used in the pallet repair process: wood (lumber), steel (nails and
steel connector plates), and paint. There is some variance in the specific process types and material use
among the facilities; in particular, some facilities do not utilize the notching, plating, and/or painting
processes. Figure 31 describes the unit process flow of the typical pallet repair facility.

118
1 The wood scraps can be used for energy recovery for internal use in wood pallet repair facilities;
however, no responding facility in this study used the wood scraps for that purpose.
Figure 31. Flow diagram for the wood pallet repair process.
Unloading/Inspecting/Sorting/Stacking
Damaged pallets are unloaded at the pallet repair facilities by forklifts. Operators then visually
inspect pallets and assign grades depending on the severity and type of damage. The pallets are sorted and
stacked by assigned grades using manual labor, forklifts, or stacking machines. The majority of sorted
pallets are stacked in the repair station while some were stacked in the dismantling station.

119
Dismantling/Trimming/Notching
In the dismantling station, the pallets are taken apart primarily by bandsaw dismantlers with
manual infeed/outfeed. Some repair facilities also use dismantling bars/hammers, disc/shear type
dismantlers with manual feeds, or a machine controlled infeed/outfeed dismantling system. The
disassembled lumber often is trimmed using machine-controlled infeed/outfeed trim saws, single-head or
dual-head table saws, or radial-arm saws with manual feeds. Some dismantled stringers are notched using
single- or double-head notching machines with manual feeds or by machine-controlled infeed/outfeed.
The dismantled lumber (trimmed, untrimmed, notched, and unnotched) is moved to the pallet repair
station by forklift for use as deckboards, stringers, or companion stringers.
Repairing (Nailing or/and Plating)
In the repair station, the damaged pallets are repaired primarily by hand using nail-guns on a
repair table. Helically threaded nails of identical length (0.009 pound (4 g) per nail) is the most commonly
used nail design for stringer class pallet production, although there are various designs for nails used in
the pallet industry (Carrano et al. 2014a).
Most of the wood used to repair or replace damaged parts of the pallets are supplied from the
dismantled lumber. However, limited amount of new lumber (softwood and hardwood) is also used for
the pallet repair. The choice of species used for pallets depends on the firms’ availability in the particular
regions.
In order to repair the damaged stringers, companion stringers are typically applied. In some repair
facilities, metal connector plates also are installed to the damaged stringers by plating machines (platers)
with manual feeds.

120
Painting
Since pallets are made by green wood that may harbor pests, many used wood pallets typically
have a phytosanitary certification stamp according to International Standards for Phytosanitary Measures
Number 15 (ISPM 15) (FAO 2009). At the repair facilities, the ISPM 15 stamps of the repaired pallets
should be covered with paint to resupply the pallets to users. Solvent-based spray paints (10 ounce (296
ml) per can) are mainly used for this purpose.
Internal Transportation
Forklifts using liquid petroleum gas (LPG) are the primary material handling equipment for the
internal transportation. Power conveyors are also often used to move the pallets, parts, and scraps inside
of the repair facilities.
6.3.2. Data Sources
The primary input data for the raw materials, electricity, and energy consumption were reported
based on the annual consumption of the responding facilities in 2012. The output data for each type of co-
product were estimated by the responding facilities, since it was difficult to separate each amount of co-
products among the total co-product output by their bill of materials.
This study used background (secondary) data to analyze the environmental emissions associated
with the feedstocks of material, electricity, and energy inputs. The material extraction and production
phases of hardwood lumber, softwood lumber, and liquid petroleum gas (LPG) were obtained from the
U.S. Life Cycle Inventory (USLCI) (NREL 2012). The background data for electricity also referred to the
national electricity grid from USLCI (NREL 2012). Life cycle inventory (LCI) data provided from World
Steel Association (World Steel Association 2011) were used to analyze the environmental impacts from
the material extraction, production phases, and end-of life phases of nails and metal connector plates. The
EcoInvent (Ecoinvent 2010) database was used for paints. SimaPro (Version 7.3.3) LCA modeling

121
software (Pre Consultants 2012) was used to calculate the overall emissions of related inventories
associated with the feedstocks of all inputs. Table 21 shows the type of background data used in this study.
Table 21. Type and source of background data used in this study.
Input type Source of life cycle inventory data
New softwood lumber Sawn lumber, softwood, rough, green, at sawmill USLCI1
New hardwood lumber Sawn lumber, hardwood, rough, green, at sawmill USLCI1
Nails LCI for steel products, wire rod World Steel Association2
Metal plates LCI for steel products, plate, 85% recycling rate World Steel Association2
Paint Alkyd paint, white, 60% in solvent, at plant EcoInvent3
Electricity Electricity, at Grid, US USLCI1
LPG Liquefied petroleum gas, at refinery/l/US USLCI1
1The U.S. Life Cycle Inventory database (NREL 2012)
2 (World Steel Association 2011)
3 (EcoInvent 2012)
The uncertainty of the inventory data was analyzed and reported using a Pedigree matrix
(Weidema and Wesnæ s 1996), a typical method to model uncertainty of the LCI data with lognormal
distributions (Frischknecht and Rebitzer 2005). The pedigree matrix consists of five data quality
indicators: reliability, completeness, temporal correlation, geographical correlation, and further
technological correlation.
6.3.3. Assumption and limitation
Several assumptions and potential limitations of this study should be noted:
This study only includes the 48 by 40- inch (1,219 by 1,016- mm) pallets, since pallet repair
facilities report that a vast majority of pallets are 48 by 40- inch (1,219 by 1,016- mm)
(Trebilcock 2013). However, data obtained from the two responding pallet repair facilities
included data for repairing other sizes of pallets such as 48 by 48- inch (1,219 by 1,219- mm)
and 48 by 45- inch (1,219 by 1,143- mm). In these cases, the inputs and outputs of wood
materials for the 48 by 40- inch (1,219 by 1,016- mm) pallets were allocated by volume based
122
weighting factors (based on the reported percentages of each pallet size). According to
experts in the pallet repair process, the influence of pallet size on inputs and outputs for
electricity, energy, nails, and paint are small or negligible. Therefore, there was no weighting
factor based on the pallet size and volume in the allocation of the inputs and outputs of
electricity, energy, nails and paint for the 48 by 40- inch (1,219 by 1,016- mm) pallets.
For allocations made in this study, the actual thickness of pallet deckboards was assumed to
be 9/16 inch (14 mm) (hardwood) or 11/16 inch (17 mm) (softwood). The thickness of
stringers was assumed to be 1 ¼ inch (32 mm). It was assumed that the widths of lead
deckboards and inner deckboards were 5 ½ inch (140 mm) and 3 ½ inch (89 mm),
respectively. The pallet opening height was assumed as 3 ½ inch (89 mm). It was assumed
that the typical structure of a stringer class wood pallet comprised seven top deckboards (two
lead deckboards and five inner deckboards), five bottom deckboards (two lead deckboards
and three inner deckboards), and three stringers. Based on the assumed dimensions, the
average volume of a 48 by 40- inch (1,219 by 1,016- mm) stringer class wood pallet was
assumed as 12.7 FBM (foot, board measure) (3.00E-02 m3) per pallet.
The moisture content of both damaged pallets and repaired pallets was assumed at 18%. The
moisture content of new hardwood lumber was assumed at 30%. The moisture content of new
softwood lumber was assumed at 18% (Hamner 2009).
There may be variances in the raw material inputs depending on the severity of damage for
each pallet. For example, some damaged pallets received by the repair facilities could be
reused with little or no repair.
This study did not include the packages (primary, secondary, and tertiary) for containing and
delivering the material inputs such as new lumber, nails, plates, and paint.
This study did not include off-site transportation for the inputs such as new lumber, nails,
plates, LPG, and paint.

123
This study did not include the inputs and outputs of the infrastructure such as buildings,
administration, and machinery.
6.4. Results and Discussion
6.4.1. Material flow
Overall, 84% of the damaged pallets (48 by 40- inch (1,219 by 1,016- mm) stringer) received by
reporting facilities were repaired for reuse pallets. This did not include the pallets reused without any
repair. Some damaged pallets (13%) were dismantled and the materials used for repairing other pallets.
Other damaged pallets (3%), along with wood scrap generated during the entire pallet repair operation,
were collected to be ground or reused as mulch or wood chips on- or off-site. No wood waste was
landfilled from the repair facilities.
Process input
Table 22 shows the input associated with the repair process of a 48 by 40- inch (1,219 by 1,016-
mm) stringer class wood pallet. The reporting format follows the EcoInvent LCI reporting format
including variance and pedigree scores (Ecoinvent 2012).
The majority of lumber used for replacing or repairing the damaged parts of the pallets was
supplied from the dismantled parts of the received used pallets. The repair process for a damaged 48 by
40- inch (1,219 by 1,016- mm) stringer class wood pallet required approximately 1.92 FBM (foot, board
measure) (4.53E-03 m3) of dismantled lumber. The unit conversion between FBMs and cubic meters (m
3)
was based on 1,000 FBM being equal to 2.36 m3 (USDA 2002). Since the dismantled lumber were a co-
product produced within the system boundary of this study, it must not be counted as raw material inputs
with corresponding environmental burdens. The amount of new softwood and new hardwood lumber
required for pallet repair was minimal.

124
Approximately 0.06 pounds (27 g) of steel nails, which is equivalent to approximately 7 nails,
were required per pallet repair. Metal connector plates also were used to repair the stringers of damaged
pallets; however, this was only used at one facility. Some facilities used spray paint (10 ounce (296 ml)
per can) to cover the ISPM stamp. Forklifts running on liquid petroleum gas (LPG) were the primary
means of internal material handling.
A repair process for pallets consumed approximately 0.09 kilowatt per hour. This value is almost
identical to that required to manufacture a new 48 by 40- inch (1,219 by 1,016- mm) stringer class
reusable wood pallet (0.09 kilowatt per hour) as reported in Carrano et al. (2014a). This means that the
electricity requirements to manufacture a new pallet and to repair a damaged pallet are almost the same.
Table 22. Overall gate-to-gate LCI inputs associated with the repair process of a 48 by 40- inch
(1,219 by 1,016- mm) stringer class wood pallet in the United States. 4
Materials Units Mean
(per repaired pallet)
SD2 3
Pedigree score
New softwood lumber m3 (FBM) 6.27E-05 (2.66E-02) 2.75E-08 (4.94E-03) (1,3,1,3,3)
New hardwood lumber m3 (FBM) 6.64E-05 (2.81E-02) 3.08E-08 (5.54E-03) (1,3,1,3,3)
Dismantled lumber 1, 2
m3 (FBM) 4.54E-03 (1.92E+00) 8.67E-07 (1.56E-01) (3,3,1,3,3)
Steel nails g (lbs) 2.89E+01 (6.37E-02) 4.37E+01 (2.13E-04) (1,3,1,3,3)
Steel plates g (lbs) 3.57E+00 (7.86E-03) 8.90E+01 (4.33E-04) (1,3,1,3,3)
Paint ml (US Oz) 5.01E-01 (1.69E-02) 1.69E-01 (1.94E-04) (1,3,1,3,3)
Electricity Kwh 9.47E-02 2.17E-03 (1,3,2,3,3)
Fuels
LPG ml (US Oz) 3.11E+01 (1.05E+00) 3.31E+02 (3.79E-01) (1,3,2,3,3) 1 The value was calculated based on the estimation for the usage of the received damaged pallets (reported in
percentage) by the respondents. 2 The material was a co-product generated within the system boundary of this study, not a new raw material input;
therefore, it should not be counted from the total environmental burdens. 3 The five pedigree scores indicate reliability, completeness, temporal correlation, geographical correlation, and
further technological correlation of the inventory data, respectively. Scores range from 1 (highest quality level) to 5
(lowest quality level) with representing a quality level of each of the five categories (Weidema and Wesnæ s 1996). 4 Results do not include inputs for the production and delivery of wood, nails, plates, and paints.

125
Process outputs
The main product produced by a repair process was a 48 by 40- inch (1,219 by 1,016- mm)
stringer class wood pallet. In addition, a pallet repair process generated two types of co-products:
dismantled lumber (approximately 1.92 FBM (4.53E-03 m3) per repaired pallet) and wood scraps
(approximately 1.68 pounds (762 g) per repaired pallet). The dismantled lumber was reused for the repair
process as deckboards or companion stringers. The wood scraps were ground at on- or off-site grinding
facilities and used as mulch or wood chips. Since these co-products were reused or sold for various
purposes, they were not counted as waste.
All responding facilities reported that there was no wood waste landfilled. They said all wood
scraps (including sawdust) were ground at on- or off-site grinding facilities. There could be wood wastes
naturally generated during the repair process, which was difficult to collect and measure. However, the
estimated amount of the wood waste was zero in this study, according to respondents. The outputs of co-
products were calculated based on the usage of damaged pallets estimated (in percentage) by the
respondents, rather than their volumes or mass directly reported from the bill of materials.
A pallet repair process also generates approximately 0.03 pounds (14 g) of steel scraps. The steel
scraps were generated primarily from the nails of damaged pallets and were collected by the repair
facilities to be recycled at off-site facilities.
Table 23 shows the output data associated with the repair process of a 48 by 40- inch (1,219 by
1,016- mm) stringer class wood pallet, following EcoInvent LCI reporting format and including variance
and pedigree scores (EcoInvent 2012).

126
Table 23. Overall gate-to-gate LCI outputs associated with the repair process of a 48 by 40- inch
(1,219 by 1,016- mm) stringer class wood pallet in the United States.
Products Units Mean
(per repaired pallet)
SD2 2
Pedigree score
Repaired pallet Pallet 1 N.A. (1,3,1,3,3)
Co-products
Dismantled lumber 1
m3 (FBM) 4.54E-03 (1.92E+00) 8.67E-07 (1.56E-01) (3,3,1,3,3)
Wood scrap 1
kg (lbs) 7.61E-01 (1.68E+00) 2.80E-01 (1.36E+00) (3,3,1,3,3)
Recycled wastes
Steel scrap g (lbs) 1.20E+01 (2.65E-02) 8.32E+02 (4.05E-03) (1,3,1,3,3) 1 The value was calculated based on the estimation for the usage of the received damaged pallets (reported in
percentage) by the respondents. 2 The five scores indicates reliability, completeness, temporal correlation, geographical correlation, and further
technological correlation of the inventory data, respectively. Scores range from 1 (highest quality level) to 5 (lowest
quality level) with representing a quality level of each of the five categories (Weidema and Wesnæ s 1996).
Cumulative atmospheric emissions
U.S. Environmental Policy Agency (USEPA) criteria air pollutants (USEPA 1995) were reported
in this study, including six pollutants as indicators of air quality: carbon monoxide, lead, nitrogen dioxide,
ozone, sulfur dioxide, and particulate matter. Ozone is formed through chemical reactions between
volatile organic compound (VOC) emissions and oxides of nitrogen (NOx) in the presence of sunlight,
rather than being directly emitted into the air. Therefore, emissions of VOC and non-methane
hydrocarbons, which can include volatile organics, were listed as potential contributors to ozone (Franklin
Associates 2007). Table 24 shows the selected cumulative atmospheric emissions.

127
Table 24. Selected cumulative atmospheric emissions generated during a repair process of a 48 by
40- inch (1,219 by 1,016- mm) stringer class wood pallet.
Emission Kg Lb
Carbon Monoxide -3.94E-07 -8.69E-07
Carbon Monoxide (fossil) 4.67E-07 1.03E-06
Carbon Monoxide (biogenic) 5.52E-04 1.22E-03
Lead 2.33E-07 5.14E-07
VOC
-2.56E-03 -5.64E-03
Non-methane Hydrocarbons
6.30E-06 1.39E-05
Sulfur Oxides -7.30E-05 -1.61E-04
Nitrogen Oxides -1.18E-03 -2.60E-03
Particulates -1.79E-03 -3.95E-03
The results included the emissions embodied in the feedstocks of all inputs. The credits due to the co-products
(reported with negative values) were considered in the results.
6.4.2. Greenhouse Gas (GHG) Emissions
The impact indicator chosen for the greenhouse gas (GHG) emission analysis was the IPCC 2001
GWP 100a developed by the Intergovernmental Panel on Climate Change (IPCC) (McCarthy 2001). The
impact indicator estimated the global warming potential (GWP) based on the carbon dioxide equivalents
(kg CO2 equivalents) emitted for a 100-year time horizon.
The total GHG emission generated from the entire pallet repair process, including carbon credits
embodied in the co-products, was -0.197 kg CO2 equivalents. It means that the GHG emissions credits the
repair process yielded exceeded the GHG emissions generated from the repair process. It should be noted
that the co-products produced during the pallet repair process yielded large credits for the GHG emissions.
Particularly, the dismantled lumber reused for the pallet repair as material inputs contributed significant
credits (-0.297 kg CO2 equivalents). The steel scraps collected for off-site recycling (-0.045 kg CO2
equivalents) and the wood scraps collected for grinding into mulch or chips (-0.004 kg CO2 equivalents)
also yielded GHG emissions credits.
Electricity was the largest contributor of GHG emissions (0.065 kg CO2 equivalents) in the repair
process. The steel nails used in the pallet repair (assembly) process were the largest contributor for
generating GHG emissions among the material inputs (0.060 kg CO2 equivalents). Other material inputs,

128
such as LPG (0.009 kg CO2 equivalents), metal plates (0.007 kg CO2 equivalents), new hardwood lumber
(0.004 kg CO2 equivalents), new softwood lumber (0.002 kg CO2 equivalents), and paint (0.001 kg CO2
equivalents), had relatively small contribution to GHG emissions due to their small amount of usage.
Figure 32 shows the contribution by each material as well as process electricity.
Figure 32. Greenhouse gas emissions generated during a repair process of a 48 by 40- inch (1,219 by
1,016- mm) stringer class wood pallet. The results included the emissions embodied in the feedstocks of
all inputs. The credits due to the co-products (reported with negative values) were considered in the
results.

129
6.5. Conclusion
This study documented and analyzed all inputs and outputs associated with the repair process of
48 by 40- inch (1,219 by 1,016- mm) stringer class wood pallets by collecting primary data from seven
pallet repair facilities located in the United States based on their annual bills of materials for the calendar
year 2012. The LCI results from this study will be a useful resource for researchers as an input to the
LCA of the most commonly used pallet type in the United States, the 48 by 40- inch (1,219 by 1,016- mm)
stringer class wood pallet. The specific conclusions are presented as follows:
(1). On average, 1.98 FBM (4.67E-03 m3) of lumber was used for repairing each 48 by 40- inch stringer
class wood pallet. Most of the lumber inputs were supplied by using dismantled lumber from damaged
pallets while new lumber inputs were small. Approximately 0.06 pounds of steel nails (7 nails) were used
per pallet repair.
(2). According to the greenhouse gas (GHG) emission analysis, a pallet repair process yielded -0.197 kg
CO2 equivalents. The electricity for the pallet repair made the largest positive contribution to GHG
emissions, followed by steel nails. Other inputs made only small contributions to GHG emissions. Repair
co-products, such as dismantled lumber and wood scraps, had significant credits (negative contributions)
to GHG emissions. The overall wood pallet repair process had GHG credits rather than a positive GHG
emission, because of the GHG offsets from dismantled lumber, steel scraps, and wood scraps. Therefore,
it could be concluded that the repair itself was an environmentally beneficial end-of-life option for 48 by
40- inch stringer class wood pallets in terms of the GHG generation.
(3). Implementing lean principles can help to reduce GHG emissions in the repair process. Standardized
methods for nail usage in pallet repair and strict management of co-products may further reduce GHG
emissions.

130
(4). Transportation between pallet repair firms and used pallet suppliers generated significant GHG
emissions. Therefore, enhancing transportation efficiency can be a key factor in reducing GHG emissions
during pallet repair operations.
6.6. Acknowledgements
The authors would like to thank all participating wood pallet repair facilities for providing
insights to this research project. National Wood Pallet Association (NWPCA) and Pallet Enterprise
Magazine are gratefully acknowledged for their support in promoting the participation. World Steel
Association also is gratefully acknowledged for providing their life cycle inventory data. This study was
financially supported by the members of the Virginia Tech’s Center for Packaging and Unit Load Design.
References
Araman PA. and Bush RJ. (2015) “New and Used Pallet Information Plus Other Topics.” Presentation at
Western Pallet Association Annual Meeting, Rancho Mirage, CA, USA.
Azhar, A. (2011) End of Life scenarios for the Re-load Pallet. Master’s Thesis. Halmstad University,
Halmstad, Sweden.
Buehlmann, U., Bumgardner, M., and Fluharty, T. (2009) "Ban on landfilling of wood pallets in North
Carolina: an assessment of recycling and industry capacity." Journal of Cleaner Production 17 (2):271-
275.
Carrano, AL., Thorn, BK., and Woltag, H. (2014) "Characterizing the Carbon Footprint of Wood Pallet
Logistics." Forest Products Journal 64 (7):232-241.
Carrano, AL., Pazour, JA., Debjit, R., and Thorn, BK. (2014) "Selection of pallet management strategies
based on carbon emissions impact." International Journal of Production Economics.
Clarke, J. (2002) Pallets 101: industry overview and wood, plastic, paper & metal options. In Pallet user
education series: Pallet Enterprise.

131
Clarke, J., White, MS., and Araman, PA. (2005) "Comparative performance of new, repaired, and
remanufactured 48by 40-inch GMA-style wood pallets." Forest Products Journal 55 (12).
Ecoinvent. (2010) Ecoinvent v2. http://www.ecoinvent.org/home/: Swiss Centre for Life Cycle
Inventories.
Ecoinvent. (2012) EcoSpold version 2.2. edited by Ecoinvent.
http://www.ecoinvent.org/database/ecospold-data-format/: Swiss Centre fro Life Cycle Inventories.
ERM. (2008) Streamlined Life Cycle Assessment of iGPS, Typical Pooled Wood Pallets, and Single-Use
Wood Pallets - Intelligent Pooling Systems (iGPS) Company LLCConfidential Report. Environmental
Resources Management (ERM), Kansas City, KS
Franklin Associate. (2007) Life Cycle Inventory of Wood Pallet Systems: Final Summary Report for
CHEP America. Prairie Village, KS, USA.
FAO. (2009) International Standards for Phytosanitary Measures 1 to 32. . Rome, Italy: Food and
Agriculture Organization of the United Nations (FAO).
Frischknecht, R. and Rebitzer, G. (2005) "The ecoinvent database system: a comprehensive web-based
LCA database." Journal of Cleaner Production 13 (13):1337-1343.
Gasol, CM., Farreny, R., Gabarrell, X., and Rieradevall, J.( 2008) "Life cycle assessment comparison
among different reuse intensities for industrial wood containers." Int J Life Cycle Assess 13:421-431.
Hamner, P. (2009) "Virginia Tech Column: Desiccants Effective Way to Combat Moisture in Shipping
Containers." Pallet Enterprise
ISO. (1997) ISO 14040:1997 Environmental Management -- Life Cycle Assessment -- Principles and
Framework. Geneva, Swiss: International Standard Organization (ISO).
ISO. (1998) ISO 14041 Environmental Management - Life Cycle Assessment - Goal and Scope
Definition and Life Cycle Inventory Analysis.
Lee, SG. and Xu, X. (2004) "A simplified life cycle assessment of re-usable and single-use bulk transit
packaging." Packaging Technology and Science 17:67-83.

132
McCarthy, JJ. (2001) Climate change 2001: impacts, adaptation, and vulnerability: contribution of
Working Group II to the third assessment report of the Intergovernmental Panel on Climate Change:
Cambridge University Press.
NCGA. (2005) Session Law 2005-362 House Bill 1465. edited by General Assembly of North Carolina
(NCGA). Releigh, NC, USA.
NREL. (2012) US LCI Database. edited by National Renewable Energy Laboratory (NREL).
http://www.nrel.gov/lci/.
Philip, SKA. (2010) "Environmental analysis of pallets using life cycle analysis and multi-objective
dynamic programming." Master, Department of Industrial Engineering, The Pennsylvania State
University.
Pre Consultant. (2012) SimaPro 7 Life-Cycle Assessment Software Package 7.3.3, Amersfoort, The
Netherlands.
Trebilcock, B. (2013) "Reader survey: talking pallets with Modern’s readers." Modern Material Handling.
USDA. (2002) "A Guide to Exporting Solid Wood Products." United States Department of Agriculture
(USDA). Washington, D.C., USA.
USEPA. (1995) "Guidelines for Assessing the Quality of Life Cycle Inventory Analysis." United States
Environmental Protection Agency (USEPA). Cincinnati, OH, USA.
Weidema, BP. (2000) "Avoiding co‐product allocation in life cycle assessment." Journal of Industrial
Ecology 4 (3):11-33.
Weidema, BP. and Wesnæ s, MS. (1996) "Data quality management for life cycle inventories—an
example of using data quality indicators." Journal of Cleaner Production 4 (3):167-174.
White, MS., Clarke, J., and Araman, PA. (2001) "Performance of pallet parts recovered from used wood
pallets." Forest Products Journal 51 (2).
World Steel Association. (2011) LCI Data for Steel Products - Wire Rod and Plate. edited by World Steel
Association. Pittsburgh, PA, USA.

133
Chapter 7: Trials and Tribulations
7.1. Investigation of Influence of the Number of Packaging Layers on the Load-bridging.
In addition to the studies described in Chapter 3, the effect of the number of packaging layers on
the load-bridging in unit loads was investigated.
In order to evaluate the effects of the number of packaging layers on pallet deflection, additional
experiments were conducted using the 20 in. x 10 in. x 10 in. B-flute corrugated paperboard boxes and
the ¾ in. birch plywood (the medium stiffness pallet section). The boxes in each layer were filled with
different weights to make the overall unit load weight uniform to 240 pounds. Three duplicate tests were
conducted for each variable. The procedure for the experiment was the same with the unit-load bending
test procedure described in Chapter 3.
Table 25 shows the results of one-way analysis of variance (ANOVA) conducted to analyze the
effect of number of layers in a unit load on pallet deflection. Since the p-value is less than 0.0001 (<0.05),
it is concluded that the number of packaging layers on the unit load had significant effect on the unit load
deflection.
Table 25. ANOVA results for effects of the number of packaging layers on load-bridging.
Source DF Sum of Squares Mean Square F Ratio
Model 4 0.11397252 0.028493 47.2615
Error 22 0.01326342 0.000603 Prob > F
C. Total 26 0.12723594 <.0001*
*Statistically significant at the 95% of significance level
Table 26 shows the average deflection of the pallet using the numbers of packaging layers
ranging from one to five in a unit load. The deflection of the pallets decreased as the number of packaging
layers in a unit load increased. When the number of packaging layers on the pallet increased from one to
five layers, the deflection of the pallet decreased by 75%. According to the Tukey’s HSD test results
(Table 12), the differences in the average deflections of the five layers of the pallet were statistically

134
significant. As the number of packaging layers on the pallet increased from one to five, there were more
surfaces between the packages, resulting in greater friction, which could have resulted in the reduction of
horizontal movement of the packages towards the outside of the unit load. Thus, the increased friction
created by the additional surfaces between packages might be the primary reason the deflections of the
pallets decreased as the number of packaging layers increased.
Table 26. Summary table of pallet deflection result for a unit load containing different number of layers.
Layer Average Deflection (COV)
1 0.28 in. (5%) a
2 0.19 in. (14%) b
3 0.15 in. (20%) c
4 0.08 in. (10%) d
5 0.04 in. (7%) d
Note: Differences among number of layers on the ¾ in. simulated pallet section are denoted with the superscript
letter(s) determined by the Tukey’s HSD test at α=0.05.
135
7.2. Investigation of Influence of Handling Cycles on the Load-bridging.
In addition to the studies described in Chapter 4, the effect of handling cycles on the load-
bridging in unit loads was investigated.
In order to investigate unit load deflection changes depending on the handling cycles, a unit load
bending test with a particular condition was repeated five times without any reconditioning or realignment
of the unit load sample. Before each cycle, the unit load sample was lifted up until the bottom of the unit
load reached to 2 in. (51 mm) above the rack supports and then lowered onto the supports. An Analysis of
Variance (ANOVA) tests were performed to analyze the effects of handling cycles on the deflection of
unit loads on two different stiffnesses of simulated pallets.
Figures 33 and 34 present the deflection of the unit load as a function of the handling cycles.
ANOVA test with significance level of 0.05 was performed to analyze the effects of handling cycles on
unit load deflection. It was found that the majority of the variables the handling cycles had no statistically
significant effect on the deflection of the unit load. However, noticeable unit load deflection changes were
found between the first and the second cycles of the bending tests when the unit loads were composed of
5 in. x 10 in. x 10 in. packages without stretch wrapping.

136
* Statistically significant at the 95% of significance level
Figure 33. The changes of unit load deflections due to the handling cycles on the low stiffness simulated
pallet.

137
*Statistically significant at the 95% of significance level
Figure 34. The changes of unit load deflections due to the handling cycles on the high stiffness simulated
pallet.
138
Chapter 8: Summary, Conclusions, and Recommendations for Future Study
The purpose of this research is to investigate fundamental information to improve the
sustainability of unit loads. The sustainability of unit loads is approached from two different perspectives:
1) physical interactions between unit load components, and 2) end-of-life option of unit load components.
The specific objectives of this research were:
Objective 1: Investigate influences of size and flute type of corrugated paperboard boxes on load-
bridging in unit loads.
Objective 2: Investigate influences of stretch wrap containment force on load-bridging in unit loads.
Objective 3: Document the current status of wood pallet repair in the United States by identifying the
process methods and equipment usage in repair operation from an automation perspective.
Objective 4: Analyze the environmental impacts of the wood pallet repair process in the United
States through life cycle inventory analysis.
8.1. Conclusions
The conclusions from each objective are listed below:
Objective 1: Investigate influences of size and flute type of corrugated paperboard boxes on load-
bridging in unit loads (Chapter 3).
(1). Increasing the size of packages led to increased load-bridging and a significant decrease in
unit load deflection. The packaging size effect on unit load deflection was the greatest for the
simulated pallet segment with low stiffness. For the medium stiffness simulated pallet segment,
which was comparable to the stringer class wood pallet spanning the width of a storage rack,
average deflection in the unit load decreased by 30%, 52%, and 70%, when package size

139
increased to 5 in. x 10 in. x 10 in., 10 in. x 10 in. x 10 in., and 20 in. x 10 in. x 10 in., respectively.
Designing and utilizing larger packaging is highly recommended to take advantage of the benefit
that comes from load-bridging unit-loads to reduce unit load deflection.
(2). Unit load deflection decreased when the flute type of corrugated paperboard boxes changed
from B-flute and BC-flute to E-flute for simulated pallet segments of all stiffness levels. For the
medium stiffness simulated pallet segment, which was comparable to the stringer class wood
pallet spanning the width of a storage rack, unit load deflection decreased by 19%, when B-flute
or BC-flute corrugated boxes were changed to the E-flute boxes. However, there was no
difference between the B-flute and BC-flute in terms of unit load deflection.
(3). The pressure decreased at the center of the simulated pallet segment and increased at the end
of the simulated pallet segment as the package size increased and the simulated pallet segment
stiffness decreased. This redistribution of compression stresses towards the ends of the simulated
pallet segments represented the reduction in bending moment and explained the lower simulated
pallet segment deflections observed when the package size increased. In order to avoid damaging
the packaging during storage in rack systems, packaging engineers must consider the effects of
changes in the pallet and packaging characteristics on the stress concentration at the pallets’ edges.
(4). Updated design methods that consider the packaging size effect on the unit loads deflection
can help to reduce the amount of raw materials required to build pallets using current pallet
design methodologies.

140
Objective 2: Investigate influences of stretch wrap containment force on load-bridging in unit
loads (Chapter 4).
(1). Results of this study determined that stretch wrap has an important function during storage in
warehouse rack systems in terms of reducing pallet deformation in addition to its role in load
stabilization. For the high stiffness simulated pallet, which was comparable to the stringer class
wood pallet, deflection in the unit load of the smallest sized packages decreased by 50% and 63%
when the containment force increased from zero pounds to 30 lbs and 60 lbs, respectively.
(2). The containment force effect on reduction in the unit load deflection was the greatest for the
unit load consisting of the smallest packages (5 in. x 10 in. x 10 in.). However, containment force
effect was not significant for the largest packages (20 in. x 10 in. x 10 in.) due to extremely strong
load-bridging caused by the packages themselves.
(3). The packaging size effect on the reduction in the unit load deflection was the greatest for the
unit load having the lowest stretch wrap containment force. For the high stiffness simulated pallet
segment, which was comparable to the stringer class wood pallet spanning the width of a storage
rack, average deflection in the unit load having no stretch wrap containment force decreased by
44% and 75%, when the packaging size was changed from the 5 in. x 10 in. x 10 in. to 10 in. x 10
in. x 10 in., and from 5 in. x 10 in. x 10 in. to 20 in. x 10 in. x 10 in., respectively. Compared to
the deflection results of the uniform flexible loading condition, the deflection in the unit load
decreased 80% when the unit loads consisted of the largest sized packages.
(4). As the containment force and packaging size increased, the compression stress decreased at
the center of the simulated pallet and increased at the edge of the simulated pallet. The

141
redistribution of compression stresses corresponded to a reduction in bending moment and
explained the lower deflection in the unit load when higher stretch wrap containment force and
larger-sized packaging were tested. The stress concentration at the pallets’ edges, caused by the
stretch wrap containment force and packaging size changes, should be accounted for in order to
avoid packaging damages during storage in warehouse rack systems.
(5). The strong effects of stretch wrap containment force on pallet deformation can be particularly
useful when applied to low stiffness and flexible pallets. However, the difference in deflection
does not necessarily indicate a greater change in the load carrying capacity of the all types of
pallets. The load carrying capacity of the pallet will be influenced by pallet design and the
strength of pallets.

142
Objective 3: Document the current status of wood pallet repair in the United States by identifying
the process methods and equipment usage in repair operation from an automation perspective
(Chapter 5).
(1). Wood pallet repair firms in the United States received an average of approximately 1.28
million cores per firm (median: 725,000 cores) in 2012. The majority of cores repaired by the
responding companies were stringer class pallets (93%). The most common pallet size received
and repaired was 48 x 40 inch. The most commonly used stringer repair method was the
application of half companion stringers (89% of stringer repairs). Most of the responding firms
(69%) travelled 11-50 miles to obtain cores. The majority of the firms (33%) repaired over 1
million cores in 2012, and a third of respondents (33%) reported 1 to 5 million dollars in annual
gross sales.
(2). It was found that most firms utilized high levels of manual labor with machinery support.
There was no firm that used a totally manual process or a fully-automated process to repair cores.
The board trimming and sorting/stacking processes were often automated, while the inspecting,
nailing, and painting processes were generally manual.

143
Objective 4: Analyze the environmental impacts of the wood pallet repair process in the United
States through life cycle inventory analysis (Chapter 6).
(1). On average, 1.98 FBM (4.67E-03 m3) of lumber was used for repairing each 48 by 40- inch
stringer class wood pallet. Most of the lumber inputs were supplied by using dismantled lumber
from damaged pallets while new lumber inputs were small. Approximately 0.06 pounds of steel
nails (7 nails) were used per pallet repair.
(2). According to the greenhouse gas (GHG) emission analysis, a pallet repair process yielded
−0.197 kg CO2 equivalents. The electricity for the pallet repair made the largest positive
contribution to GHG emissions, followed by steel nails. Other inputs made only small
contributions to GHG emissions. Repair co-products, such as dismantled lumber and wood scraps,
had significant credits (negative contributions) to GHG emissions. The overall wood pallet repair
process had GHG credits rather than a positive GHG emission, because of the GHG offsets from
dismantled lumber, steel scraps, and wood scraps. Therefore, it could be concluded that the repair
itself was an environmentally beneficial end-of-life option for 48 by 40- inch stringer class wood
pallets in terms of the GHG generation.
(3). Implementing lean principles can help to reduce GHG emissions in the repair process.
Standardized methods for nail usage in pallet repair and strict management of co-products may
further reduce GHG emissions.
(4). According to GHG emissions during the pallet repair process as analyzed in this study,
transportation between pallet repair firms and used pallet suppliers generated significant GHG
emissions. Therefore, enhancing transportation efficiency can be a key factor in reducing GHG
emissions during pallet repair operations.

144
8.2. Limitations of Research
Limitations of each chapter of this dissertation are presented as follows:
Chapter 3: The Influence of Size and Flute Type of Corrugated Paperboard Boxes on Load-
Bridging in Unit Loads.
This study only investigated two-dimensional interactions instead of three-dimensional
interactions.
Time-dependent characteristics of the tested materials, such as creep properties, were not
investigated in this study.
It is not possible to formulate a clear conclusion yet on the change in the load-carrying capacity
of all pallets, since this study only measured deflections of simulated pallet segments.
There was a limitation in pressure sensor ranges (0-5 psi).
This study only used wood boards as simulated pallet segments instead of actual pallets.
Chapter 4: The Influence of Stretch Wrap Containment Force and Packaging Size on Load-
Bridging in Unit Loads.
Time-dependent characteristics of the tested materials, such as creep properties, were not
investigated in this study.
This study only measured deflections of simulated pallets; therefore, it is not possible to
formulate a clear conclusion yet on the change in the load-carrying capacity of all pallets.
There was a limitation in pressure sensor ranges (3-90 psi).
This study only used wood boards as simulated pallets instead of actual pallets.
145
Chapter 5: Process Methods and Levels of Automation of Wood Pallet Repair in the United States.
The relatively low response rate (11.8%) in this study might reduce the generalization of the
research findings.
The sample frame of this study consisted of only National Wood Pallet and Container Association
(NWPCA) members. While the NWPCA is the largest association in the U.S. wood pallet
industry, the NWPCA membership may not be fully representative of the U.S. wood pallet repair
industry as a whole. As such it may have been biased toward larger companies with greater
production than the wood pallet industry overall.
Chapter 6: Life Cycle Inventory Analysis of the Wood Pallet Repair Process in the United States.
Data was obtained from seven facilities in this study. The limited number of participating
facilities might reduce the generalization of the research findings.
This study did not include the packages (primary, secondary, and tertiary) for containing and
delivering the material inputs, such as new lumber, nails, plates, and paint.
This study did not include off-site transportation for the inputs, such as new lumber, nails, plates,
LPG, and paint.
For allocations made in this study, the actual thickness of pallet deckboards was assumed to be
9/16 inch (hardwood) or 11/16 inch (softwood). The thickness of stringers was assumed to be 1 ¼
inch. It was assumed that the widths of lead deckboards and inner deckboards were 5 ½ inch and
3 ½ inch, respectively. The pallet opening height was assumed as 3 ½ inch.

146
8.3. Recommendations for Future Study
Based on the observations of this research the following suggestions for future study can be made:
Chapter 3: The Influence of Size and Flute Type of Corrugated Paperboard Boxes on Load-
Bridging in Unit Loads.
Time-dependent study with consideration of creep performance of the materials is suggested.
Future studies need to quantify the effect of these factors on strength of pallet segments to
formulate clear conclusion on the change in the load-carrying capacity of all pallets.
Further investigation into the influence of the effects of packaging size on raw materials
consumption is highly recommended, along with additional research into the environmental
impacts of all pallets.
Development of a Finite Element Analysis model on the effects of packaging size on pallet
performance is highly recommended.
Investigation of three-dimensional interactions is recommended.
Experiment with actual pallets is encouraged to validate the results of this study.
Pressure sensor ranges should be greater than 5 psi.
Developing simulation models for predicting the physical interactions is highly recommended.
Further investigation of effects of the number of packaging layers on the load-bridging is
encouraged.
Chapter 4: The Influence of Stretch Wrap Containment Force and Packaging Size on Load-
Bridging in Unit Loads.
Time-dependent study with consideration of creep performance of the materials is encouraged.
It will be necessary to further investigate the influence of these factors on strength of simulated
pallets to draw a clear conclusion for the load carrying capacity of the pallets in future studies.

147
Further investigation into the influence of the effects of stretch wrap containment force on raw
materials consumption is highly recommended, along with additional research into the
environmental impacts of all pallets.
Development of a Finite Element Analysis model on the effects of stretch wrap containment force
on pallet performance is highly recommended.
Pressure sensor ranges should cover less than 3 psi.
Developing simulation models for predicting the physical interactions is highly recommended.
Experiment with actual pallets is recommended.
Investigation of effects of coefficients of friction between the unit load components on the load-
bridging is encouraged.
Chapter 5: Process Methods and Levels of Automation of Wood Pallet Repair in the United States.
Conducting survey with a sample frame of the entire U.S. wood pallet industry will increase the
generalization of results.
Qualitative research will discover more information to forecast the automations in the U.S. wood
pallet repair industry.
Chapter 6: Life Cycle Inventory Analysis of the Wood Pallet Repair Process in the United States.
Further study with more facilities will help to increase the generalization of the research findings.
Further study including off-site transportation for the inputs and outputs is recommended.
Environmental impacts of other pallet size repair can be further analyzed.
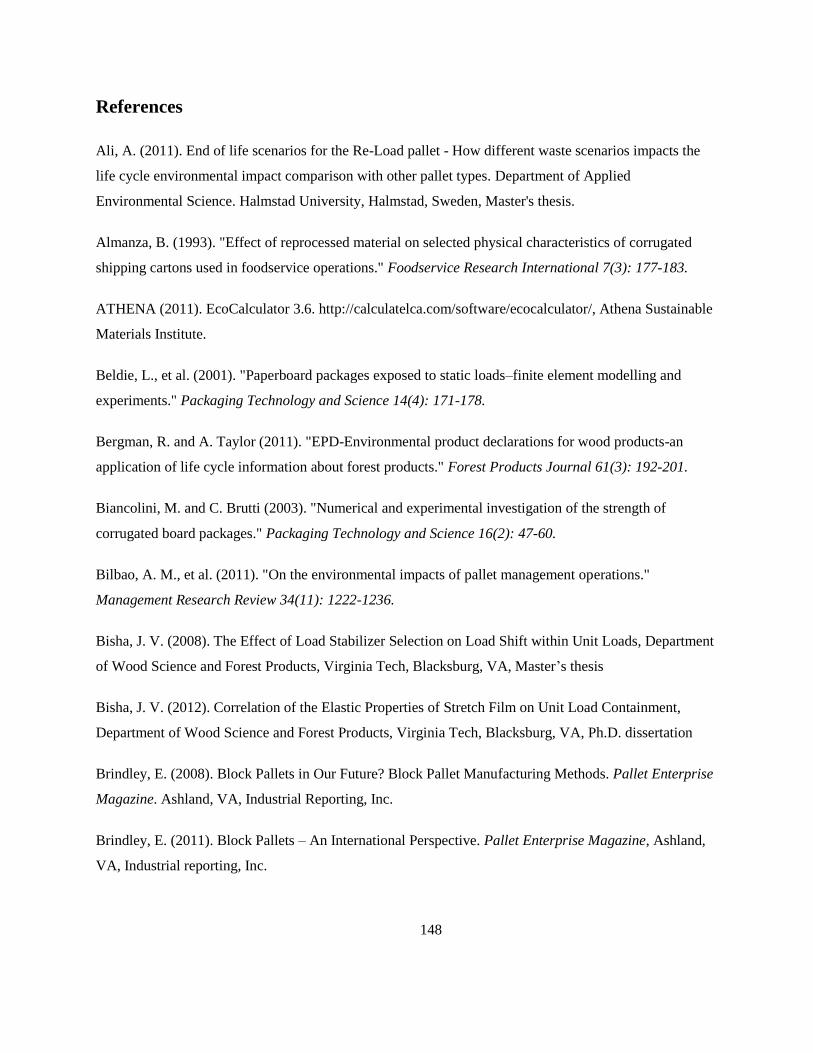
148
References
Ali, A. (2011). End of life scenarios for the Re-Load pallet - How different waste scenarios impacts the
life cycle environmental impact comparison with other pallet types. Department of Applied
Environmental Science. Halmstad University, Halmstad, Sweden, Master's thesis.
Almanza, B. (1993). "Effect of reprocessed material on selected physical characteristics of corrugated
shipping cartons used in foodservice operations." Foodservice Research International 7(3): 177-183.
ATHENA (2011). EcoCalculator 3.6. http://calculatelca.com/software/ecocalculator/, Athena Sustainable
Materials Institute.
Beldie, L., et al. (2001). "Paperboard packages exposed to static loads–finite element modelling and
experiments." Packaging Technology and Science 14(4): 171-178.
Bergman, R. and A. Taylor (2011). "EPD-Environmental product declarations for wood products-an
application of life cycle information about forest products." Forest Products Journal 61(3): 192-201.
Biancolini, M. and C. Brutti (2003). "Numerical and experimental investigation of the strength of
corrugated board packages." Packaging Technology and Science 16(2): 47-60.
Bilbao, A. M., et al. (2011). "On the environmental impacts of pallet management operations."
Management Research Review 34(11): 1222-1236.
Bisha, J. V. (2008). The Effect of Load Stabilizer Selection on Load Shift within Unit Loads, Department
of Wood Science and Forest Products, Virginia Tech, Blacksburg, VA, Master’s thesis
Bisha, J. V. (2012). Correlation of the Elastic Properties of Stretch Film on Unit Load Containment,
Department of Wood Science and Forest Products, Virginia Tech, Blacksburg, VA, Ph.D. dissertation
Brindley, E. (2008). Block Pallets in Our Future? Block Pallet Manufacturing Methods. Pallet Enterprise
Magazine. Ashland, VA, Industrial Reporting, Inc.
Brindley, E. (2011). Block Pallets – An International Perspective. Pallet Enterprise Magazine, Ashland,
VA, Industrial reporting, Inc.

149
Buchanan, J., et al. (1964). "Combined board characteristics that determine box performance."
Paperboard Packaging 49(9).
Bush, RJ. and Araman, PA (2008). Final Report - Updated Pallet and Container Industry Production and
Recycling Research. Virginia Tech, Blacksburg, VA
Bush, RJ. and Araman, PA. (2009). “Pallet recovery, repair and remanufacturing in a changing Industry:
1992 to 2006”. Pallet Enterprise: 22-27, Ashland, VA, Industrial Reporting, Inc.
Babbitt, A. L. (2005). "A life cycle inventory of coal used for electricity production in Florida." Journal
of Cleaner Production 13: 903-912.
Carrano, A. L., et al. (2014). "Characterizing the Carbon Footprint of Wood Pallet Logistics." Forest
Products Journal 64(7): 232-241.
Cernokus, E. A. (2012). "The Effect of Stretch Wrap Pre-Stretch on Unitized Load Containment."
Department of Industrial Technology and Business, Cal Poly, San Luis Obispo, CA, Mater’s thesis
Chan, F., et al. (2006). "A systematic approach to manufacturing packaging logistics." The International
Journal of Advanced Manufacturing Technology 29(9-10): 1088-1101.
Clarke, J. (2004). "Pallets 101: Industry overview and wood, plastic, paper, and metal options." Retrieved
May 24: 2008.
Clarke, J. W., et al. (2005). "Comparative performance of new, repaired, and remanufactured 48-by 40-
inch GMA-style wood pallets." Forest products journal 55(12).
Coffin, D. (2005). The creep response of paper. 13th Fundamental Research Symposium, Cambridge.
Collie, S. (1984). Laboratory Verification of Pallet Design Procedures. Department of Wood Science and
Forest Products, Virginia Tech, Blacksburg, VA. Master’s thesis
Cooper, J. F., et al. (2012). "Status of North American Life Cycle Inventory Data." Journal of Industrial
Ecology 16(3): 287-289.
Coulon, R., et al. (1997). "Data quality and uncertainty in LCI." The International Journal of Life Cycle
Assessment 2(3): 178-182.

150
Curran, M. A. (1996). The History of LCA. McGraw‐ Hill, New York.
Degroot, J., et al. (1994). "Effects of cast film fabrication variables on structure development and key
stretch film properties." Journal of applied polymer science 52(3): 365-376.
Delft University. (2012). IDEMAT. http://www.idemat.nl/, Delft University of Technology (TU Delft).
Ecobilan (2011). Tools for Environmental Analysis and Management (TEAM).
www.ecobalance.com/software/team, Ecobilan Group.
Ecoinvent (2007). Overview and Methodology. ecoInvent No.1. Swiss Centre for Life Cycle Inventories
(ecoInvent), Dubendorf, Swiss
Ecoinvent (2010). Ecoinvent v2. http://www.ecoinvent.org/home/, Swiss Centre for Life Cycle
Inventories, Dubendorf, Swiss
Ecoinvent (2012). EcoSpold version 2.2. Ecoinvent. http://www.ecoinvent.org/database/ecospold-data-
format/, Swiss Centre for Life Cycle Inventories, Dubendorf, Swiss
Elkington, J. (1994). "Towards the suitable corporation: win-win-win business strategies for sustainable
development." California management review 36(2): 90-100.
Elkington, J. (1997). "Cannibals with forks." The triple bottom line of 21st century.
Eriksson, et al. (2001). "FEFCO Standards Committee The FEFCO BCT Round Robin Test 2001."
ERM (2008). Streamlined Life Cycle Assessment of iGPS, Typical Pooled Wood Pallets, and Single-Use
Wood Pallets, Intelligent Pooling Systems (iGPS) Company LLC.
Fegan, B. (1982). Load-support Conditions and Computerized Test Apparatus for Wood Pallets.
Department of Wood Science and Forest Products. Virginia Tech, Blacksburg, VA. Master’s thesis.
Fiber Box Association (2005). Fibre Box Handbook, Fibre Box Association.
FPInnovations (2009). Pallet Trend 09. FPInnovations, Vancouver, BC, Canada
Frank, B. (2014). "Corrugated Box Compression—A Literature Survey." Packaging Technology and
Science 27(2): 105-128.

151
Franklin Associates (2007). Life Cycle Inventory of Wood Pallet Systems: Final Summary Report for
CHEP America. Franklin Associates: Prairie Village, KS.
Gasol, C. M., et al. (2008). "Life cycle assessment comparison among different reuse intensities for
industrial wood containers." The International Journal of Life Cycle Assessment 13(5): 421-431.
Gaur, P. (2007). Performance Testing and Comparison of Closures for Corrugated Shipping Containers,
ProQuest.
Godshall, W. D. (1968). "Effects of vertical dynamic loading on corrugated fiberboard containers."
Goehring, C. B. and W. B. Wallin (1981). A Survey of Loads, Loading Conditions, and
Gomez, L. S. S. (2011). Identifying Success Factors In The Wood Pallet Supply Chain. Department of
Wood Science & Forest Products. Virginia Tech, Blacksburg, VA. Master’s thesis.
GreenBlue (2012). Comparative Packaging Assessment (COMPASS). https://www.design-compass.org/,
GreenBlue's Sustaiable Packaging Coaliation (SPC).
Guinée, J. B. and R. Heijungs (2000). Life Cycle Assessment. Kirk-Othmer Encyclopedia of Chemical
Technology, John Wiley & Sons, Inc.
Guzman-Siller, C. F. (2009). Perception of value of grocery pallet systems: The retailer's point of view,
Michigan State University, East Lansing, MI. Master’s thesis
Haj-Ali, R., et al. (2009). "Refined nonlinear finite element models for corrugated fiberboards."
Composite Structures 87(4): 321-333.
Hamburg, I. (2011). Umberto 5.6. http://www.umberto.de/en/, Institute for Environmental Informatics
(ifu) Hamburg.
Han, C. D. and J. Y. Park (1975). "Studies on blown film extrusion. I. Experimental determination of
elongational viscosity." Journal of Applied Polymer Science 19(12): 3257-3276.
Han, J. and J. M. Park (2007). "Finite element analysis of vent/hand hole designs for corrugated
fibreboard boxes." Packaging Technology and Science 20(1): 39-47.

152
Handling Environment Condiitons for Wood Pallets. Northeastern Forest Experiment Station, Forestry
Sciences Laboratory, Princeton, WV
Heebink, T. B. (1959). "Load-carrying capacity of deck boards for general-purpose pallets."
Hernandez, R. J., et al. (2000). Plastics Packaging: Properties, Processing, Applications, and Regulations,
Munich, Germany.
Highlight Industries (2011). The Portable Film Force Stretch Film Test Kit. Grand Rapids, MI, USA,
Highlights Industries.
Hutchins, M. J. and J. W. Sutherland (2008). "An exploration of measures of social sustainability and
their application to supply chain decisions." Journal of Cleaner Production 16(15): 1688-1698.
International Plant Protection Convention (IPPC), (2009). International Standards For Phytosanitary
Measures (ISPM) No. 15. Regulation of wood packaging material in international trade, Food and
Agriculture Organization of the United Nations (FAO).
ISO (1997). ISO 14040:1997 Environmental Management -- Life Cycle Assessment -- Principles and
Framework. Geneva, Swiss, International Standard Organization (ISO).
ISO (1998). ISO 14041 Environmental Management - Life Cycle Assessment - Goal and Scope
Definition and Life Cycle Inventory Analysis.
ISO (1998). ISO 14041:1998 Environmental Management -- Life Cycle Assessment -- Goal and Scope
Definition and Inventory Analysis. Geneva, Swiss, International Standard Organization (ISO).
ISO (2000). ISO 14042:2000 Environmental Management -- Life Cycle Assessment -- Life Cycle Impact
Assessment. Geneva, Swiss, International Standard Organization (ISO).
ISO (2000). ISO 14043:2000 Environmental Management -- Life Cycle Assessment -- Life Cycle
Interpretation. Geneva, Swiss, International Standard Organization (ISO).
ISO (2001). Pallets for Materials Hanling - Principal Dimensions for Flat Pallets. ISO 6780, International
Standard Organization (ISO).

153
Jinkarn, T., et al. (2006). "Effect of carrying slots on the compressive strength of corrugated board
panels." Kasetsart J 40: 154-161.
Johnson, M. W., et al. (1979). "Optimum fiber distribution in singlewall corrugated fiberboard."
Johnson, M., et al. (1980). "Maximizing top-to-bottom compression strength." Paperboard Packaging
65(4): 98-108.
Johnsson, M. (1998). Packaging logistics: a value added approach, Chalsmer University, Chalsmer,
Sweden.
Kawanishi, K. (1989). "Estimation of the compression strength of corrugated fibreboard boxes and its
application to box design using a personal computer." Packaging Technology and Science 2(1): 29-39.
Kellicutt, K. and E. Landt (1951). "Safe stacking life of corrugated boxes." Fibre containers 36(9): 28.
Kellicutt, K. Q. and E. F. Landt (1958). "Basic design data for the use of fiberboard in shipping
containers." USDA Forest Service
Kirwan, M. J. (2005). "12 Solid fibreboard packaging." Paper and Paperboard Packaging Technology:
373.
Koning, J. (1978). "Compressive properties of linerboard as related to corrugated fiberboard containers.
Theoretical model verification [Wood products]." TAPPI
Koning, J. and R. Moody (1969). "Effect of glue skips on compressive strength of corrugated fiberboard
containers." TAPPI.
Koning, J. and R. Moody (1971). "Predicting flexural stiffness of corrugated fiberboard." TAPPI 54(11).
Koning, J. W. (1995). Corrugated Crossroads: A Reference Guide for the Corrugated Containers Industry,
TAPPI
Kumar, B. (2010). An Exploratory Investigation of the Transmissibility of Three Types of Wood Pallets,
Michigan State University, East Lansing, MI. Master’s thesis

154
Kutt, H. and B. Mithel (1969). "STRUCTURAL AND STRENGTH CHARACTERISTICS OF
CONTAINERS." TAPPI 52(9)
Kwak, W. (2010). "Analysis of compression strength of corrugated shipping containers with different
designed hand holes."
Lantech (2011). CTF-5. Louisville, KY, Lantech.
LeBlanc, R. and Richardson, S. (2003). Pallets: A North American Perspective. Ontario, Canada, PACTS
Management Inc.
Lee, M. H. and Park, J. (2004). "Flexural stiffness of selected corrugated structures." Packaging
Technology and Science 17(5): 275-286.
Lee, S. and Xu, X (2005). "Design for the environment: life cycle assessment and sustainable packaging
issues." International Journal of Environmental Technology and Management 5(1): 14-41.
Leiden University (2012). CMLCA 5.2. http://www.cmlca.eu/, Centre of Environmental Science, Leiden
University.
Leising, C. (2003). “Pallet Head: a hands-on guide to pallet recycling”. Pallet Enterprise, Ashland, VA,
Industrial Reporting Inc.
Lewis, H. (2005). "Defining product stewardship and sustainability in the Australian packaging industry."
Environmental Science & Policy 8(1): 45-55.
Little, J. (1943). "A theory of box compressive resistance in relation to the structural properties of
corrugated paperboard." Paper Trade J 116(24): 31-34.
Loferski, J. R. (1985). A Reliability Based Design Procedure for Wood Pallets. Department of Wood
Science and Forest Products. Virginia Tech, Blacksburg, VA. Ph.D dissertation.
Maltenfort, G. (1963). "Revision of top to bottom compression equations for doublewall corrugated."
Paperboard Packaging 48(11).
Maltenfort, G. (1980). "Compression load distribution on corrugated boxes." Paperboard Packaging
65(9): 71-72.

155
Maltenfort, G. G. (1989). Performance and Evaluation of Shipping Containers. Jelmar Publishing
Company, Plainview, NY
Maltenfort, G. G. (1996). Corrugated Shipping Containers: an Engineering Approach, Jelmar Publishing
Company, Plainview, NY
Marcondes, J. A. (1992). "Effect of load history on the performance of corrugated fibreboard boxes."
Packaging Technology and Science 5(4): 179-187.
McKee, R. and J. Gander (1957). "Top-load compression." TAPPI 40(1): 57-64.
McKee, R. C., et al. (1961). "Edgewise compression strength of corrugated board."
McKee, R. C., et al. (1962). "Flexural stiffness of corrugated board."
McKee, R., et al. (1963). "Compression strength formula for corrugated boxes." Paperboard Packaging
48(8): 149-159.
McKinlay, A. H. (1960). "Predict stacking strength of corrugated boxes accurately." Package
Engineering 5(10): 60-66.
MH1 (2005). Slip Sheets, & Other Bases for Unit Loads, an American National Standards Institute (ANSI)
standard pertaining to pallets used in the unit load method of assembling, stacking, storing, handling, and
transporting materials and products. Material Hanling Industry of America (MH1), Charlotte, NC
Michael Overcash, J. T. (2012). “Unit process life cycle inventory (UPLCI) – A structured framework to
complete product life cycle studies”. 19th CIRP International Conference on Life Cycle Engineering.
Berkley, CA: 1-4.
Navaranjan, N. and R. Jones (2010). "Lock-in infrared thermography for the evaluation of the structural
performance of corrugated paperboard structures." Composite Structures 92(10): 2525-2531.
NCGA (2005). Session Law 2005-362 House Bill 1465. North Carolina General Assembly (NCGA).
Releigh, NC.

156
NIST (2010). Building for Environmental and Economic Sustainability (BEES).
http://www.nist.gov/el/economics/BEESSoftware.cfm, National Institute of Standards and Technology
(NIST).
NREL (2012). US LCI Database. National Renewable Energy Laboratory (NREL).
http://www.nrel.gov/lci/.
NWPCA (1984). The Pallet Design System (PDS). National Wood Pallet and Container Association
(NWPCA), Alexandria, VA
PE International (2011). GiBi 5. http://www.gabi-software.com/, PE International.
Peacock, A. (2000). Handbook of polyethylene: structures: properties, and applications, CRC Press.
Peterson, W. and W. Schimmelpfenning (1982). "Panel edge boundary-conditions and compressive
strengths of tubes and boxes." TAPPI 65(8): 108-110.
Philip, S. K. A. (2010). Environmental analysis of pallets using life cycle analysis and multi-objective
dynamic programming. Department of Industrial EngineeringThe Pennsylvania State University,
Pennsylvania. Master’s thesis.
Popil, R. E., et al. (2006). “Adhesive level effect on corrugated board strength–experiment and FE
modeling”, 2006 International Progress in Paper Physics Seminar, Miami University, FL
Pre Consultants (2012). SimaPro 7 Life-Cycle Assessment Software Package. Amersfoort, The
Netherlands.
Quantis (2009). Quantis SUITE 2.0. http://www.quantis-intl.com/software.php, Quantis.
Ranger, A. (1960). "The compressive strength of corrugated fiberboard cases and sleeves." Paper
Technology 1(525): 31-41.
Ray, C. D., et al. (2006). "Supply-chain system costs of alternative grocery industry pallet systems."
Forest products journal 56(10).
Reap, J., et al. (2008). "A survey of unresolved problems in life cycle assessment." The International
Journal of Life Cycle Assessment 13(5): 374-388.

157
Rogers, L. K. (2011). "Keeping it together." Modern Materials Handling 66(7): 32-35.
Rolf Frischknecht, G. R. (2005). "The ecoinvent database system: a comprehensive web-based LCA
database." Journal of Cleaner Production 13: 1337-1343.
Rushton, A. (2010). The Handbook of Logistics and Distribution Management, Kogan Page Publishers.
Saphire, D. (1994). "Delivering the Goods."
Schaepe, M. (2000). "The influence of pin adhesion strength on edge crush and box compression
strength."
Shick, P. and N. Chari (1965). "Top-to-bottom compression for double wall corrugated boxes." Tappi J
48(7): 423-430.
Singh, J., et al. (2009). "Effect of manufacturer's joint fastening techniques on compression strength of
corrugated fiberboard boxes." Industrial Technology: 35.
Singh, J., et al. (2014). "The effect of stretch wrap prestretch on unitized load containment." Packaging
Technology and Science.
Singh, P., et al. (1992). "Compression of single-wall corrugated shipping containers using fixed and
floating test platens." Journal of testing and evaluation 20(4): 318-320.
Skidmore, K. (1962). "Effect of age on paperboard and corrugated." Paperboard Packaging 47(9): 60-62.
Srinangyam, M. (2003). Mathematical Modeling of Static Long-term Storage of Corrugated Boxes.
Michigan State University, East lansing, MI, Master’s thesis.
Steadman, R. (2002). "Corrugated board." Handbook of physical testing of paper 1: 563-660.
Stone, L. (2011). Compression testing: fixed vs. floating platen. ISTA International Transport Packaging
Forum. Orlando, FL.
Suh, S. (2010). Comprehensive Environmental Data Archive (CEDA), U.S. Version.
http://www.cedainformation.net/home.asp, Climate Earth, inc.

158
Suh, S., et al (2004). "System Boundary Selection in Life-Cycle Inventories Using Hybrid Approaches."
Environmental Science & Technology 38(3): 657-664.
Suh, S., et al. (2004). "System boundary selection in life-cycle inventories using hybrid approaches."
Environmental Science & Technology 38(3): 657-664.
Surber, R. and A. Catlin (1982). "Estimating the effects of interiors on corrugated box stacking strength."
Packaging Technology 28: 15-23.
TNO (1994). The environmentally oriented LCA of multiple use wood and synthetic pallets. Tilburg, The
Netherlands, Centre for Wood Technology (TNO).
Trebilcock, B. (2013). Talking pallets with modern readers. Modern Materials Handling 68: 26-34.
Peerless Media, LLC, Framingham, MA
Twede, D. and B. Harte (2003). "Logistical packaging for food marketing systems." Food packaging
technology: 98-99.
Twede, D. and S. E. Selke (2005). Cartons, Crates and Corrugated Board: Handbook of Paper and Wood
Packaging Technology, DEStech Publications, Inc.
Twede, D., et al. (2007). "A market-driven investigation of pallet trends in grocery chains." Journal of
food distribution research 38(1).
Urbanik, T. J. and Frank, B (2006). "Box compression analysis of world-wide data spanning 46 years."
Wood and fiber science 38(3): 399-416.
Urbanik, T. J. and Saliklis, E (2003). "Finite Element Corroboration of Buckling Phenomena Observed in
Corrugated Boxes 1." Wood and fiber science 35(3): 322-333.
USDA (2012). LCA Digital Commons. http://www.lcacommons.gov/, U.S. Department of Agriculture
(USDA).
USDOE (2009). U.S. Life Cycle Inventory Database Roadmap. U.S. Department of Energy (USDOE),
Washington D.C.

159
USEPA (2006). US EPA Life Cycle Assessment: Principles and Practice. U.S. Environmental Protection
Agency (U.S. EPA), Cincinnati, Ohio,
USEPA (2012). Pallet Alternative Cost Calculator, The United States Environmental Protection Agency
(USEPA).
Verghese, K. and Lewis, H (2007). "Environmental innovation in industrial packaging: a supply chain
approach." International Journal of Production Research 45(18-19): 4381-4401.
Viguié, J., et al. (2011). "Surface stress and strain fields on compressed panels of corrugated board boxes.
An experimental analysis by using Digital Image Stereocorrelation." Composite Structures 93(11): 2861-
2873.
Walker, S. S. a. R. (1995). "Life cycle analysis of nestable plastic and wood pallets." Journal of Plastic
Film and Sheeting 11: 312-325.
WCED (1987). "Our common future." United Nations World Commission on Environment and
Development (WECD), Oxford University Press.
Weidema, B. P. and Wesnæ s, M. S. (1996). "Data quality management for life cycle inventories—an
example of using data quality indicators." Journal of Cleaner Production 4(3): 167-174.
White, M. (2012). Course Materials: Pallet and Unit Load Design (WOOD 4224). Virginia Tech,
Blacksburg, VA
White, M. and Hamner, P (2005). "Pallets move the world: the case for developing system-based designs
for unit loads." Forest Products Journal 55(3): 8-16.
White, M., et al. (2006). Unit Load Design Short Course. Department of Wood Science and Forest
Products, Virginia Tech, Blacksburg, VA,
WhiteandCompany (2011). Best Load. Blacksburg, VA
Whitsitt, W. and McKee, R (1972). "Effect of relative humidity and temperature on stacking
performance." IPC report project 2695 9.

160
Wrisberg, N (2004). "Analytical tools for environmental design and management in a systems
perspective." Int J LCA 9(2): 137.
Yoo, J. (2008). Quantitative Analysis of the Compressive Stress Distributions across Pallet Decks
Supporting Packaging in Simulated Warehouse Storage, Virginia Tech, Blacksburg, VA. Master’s thesis
Yoo, J. (2011). Modeling Compressive Stress Distributions at the Interface between a Pallet Deck and
Distribution Packaging. Virginia Tech, Blacksburg, VA. Ph.D. dissertation
Zhao, L. L. (1993). Evaluation of the performance of corrugated shipping containers: Virgin versus
recycled boards, Victoria University of Technology.

161
Appendix A: Results of statistical analysis for analyzing the influences of
packaging size and flute type on the unit load deflections
Packaging size and pallet stiffness had significant effects on the unit load deflection, while there
was a significant interaction between packaging size and pallet stiffness (p-value<0.0001). Table A1
presents the results of the ANOVA for analyzing the effects of packaging size on the unit load deflections
for different stiffness of simulated pallet segments. Due to the significant interaction effect, a Simple
Main Effects test was performed to analyze the effects of packaging size by each simulated pallet
segment. According to the Simple Main Effects test results (p-value<0.0001 at all pallet stiffness levels)
(Table A2), all levels of packaging sizes were significantly different on all simulated pallet segments.
Statistical differences among the packaging sizes for each simulated pallet determined by Simple Main
Effects test are denoted with the capital letter(s) in Table 14.
Table A1. ANOVA results for the effects of packaging size and pallet stiffness on load-bridging.
Source DF Sum of Squares F Ratio Prob > F
Size 2 0.4714296 308.9466 <.0001*
Pallet stiffness 2 1.6109852 1055.743 <.0001*
Size*Pallet stiffness 4 0.2900815 95.0510 <.0001*
*Statistically significant at the 95% of significance level
Table A2. Results of Simple Main Effects test for the effects of packaging size on load-bridging.
Pallet stiffness SS DF F Ratio Prob > F
½” Birch Plywood (Low stiffness) 0.69440000 2 155.4627 <.0001*
¾” Birch Plywood (Medium stiffness) 0.04868889 2 1095.500 <.0001*
¾” Spruce (High stiffness) 0.01842222 2 276.3333 <.0001*
*Statistically significant at the 95% of significance level
Flute types of the boxes and pallet stiffness had significant effects on the unit load deflection
while there was a significant interaction between flute types and pallet stiffness (p-value<0.0001). Table
A3 presents the results of ANOVA for analyzing the effects of flute type on the unit load deflections on
different stiffness of simulated pallet segments. Due to the significant interaction effect, a Simple Main
Effects test was conducted to analyze the effects of flute types by each simulated pallet segment.

162
According to the Simple Main Effects test results (p-value<0.05 at all pallet stiffness levels) (Table A4),
the flute type had significant effects on all simulated pallet segments. Statistical differences among the
flute types for each simulated pallet determined by Simple Main Effects test are denoted with the capital
letter(s) in Table 14.
Table A3. ANOVA results for the effects of flute type and pallet stiffness on unit load deflections.
Source DF Sum of Squares F Ratio Prob > F
Flute 2 0.0754170 42.7884 <.0001*
Pallet stiffness 2 3.2279459 1831.401 <.0001*
Flute*Pallet stiffness 4 0.0492828 13.9805 <.0001*
*Statistically significant at the 95% of significance level
Table A4. Results of Simple Main Effects test for the effects of flute types on unit load deflections.
Pallet stiffness SS DF F Ratio Prob > F
½” Birch Plywood (Low stiffness) 0.11501089 2 22.4101 0.0016*
¾” Birch Plywood (Medium stiffness) 0.00642222 2 57.8000 0.0001*
¾” Spruce (High stiffness) 0.00326667 2 73.5000 <.0001*
*Statistically significant at the 95% of significance level

163
Appendix B: Results of the factorial ANOVA analyses to investigate the
effects of the stretch wrap containment force, the packaging size, and the
stiffness of simulated pallet
Table B1. Results of ANOVA for analyzing the overall effects of stretch wrap containment force,
packaging size, and pallet stiffness on the pallet deflections.
Measurement
locations
Source DF Sum of
Squares
F Ratio Prob >
F
Center
Pallet stiffness 1 0.9282667 1532.917 <.0001*
Containment force 2 1.5592444 1287.450 <.0001*
Packaging size 2 1.8373778 1517.101 <.0001*
Pallet stiffness*Containment force 2 0.6492000 536.0367 <.0001*
Pallet stiffness*Packaging size 2 0.6593778 544.4404 <.0001*
Containment force*Packaging size 4 1.0076778 416.0138 <.0001*
Pallet stiffness*Containment force*Packaging size 4 0.4907889 202.6193 <.0001*
Front
Pallet stiffness 1 0.7680296 1508.131 <.0001*
Containment force 2 1.2496444 1226.924 <.0001*
Packaging size 2 1.6270333 1597.451 <.0001*
Pallet stiffness*Containment force 2 0.5448148 534.9091 <.0001*
Pallet stiffness*Packaging size 2 0.5946704 583.8582 <.0001*
Containment force*Packaging size 4 0.8851556 434.5309 <.0001*
Pallet stiffness*Containment force*Packaging size 4 0.4292519 210.7236 <.0001*
Back
Pallet stiffness 1 0.7350000 1047.230 <.0001*
Containment force 2 1.2451444 887.0422 <.0001*
Packaging size 2 1.6665444 1187.248 <.0001*
Pallet stiffness*Containment force 2 0.5031000 358.4090 <.0001*
Pallet stiffness*Packaging size 2 0.5663444 403.4644 <.0001*
Containment force*Packaging size 4 0.8914444 317.5330 <.0001*
Pallet stiffness*Containment force*Packaging size 4 0.3932889 140.0897 <.0001*
*Statistically significant at the 95% of significance level

164
Table B2. Results of Simple Main Effects test for analyzing the effects of the packaging size on the
load-bridging in each level of the stretch wrap containment force and pallet stiffness.
Measurement location Pallet stiffness Containment force SS DF F Ratio Prob > F
Center Low 0 lb 3.454 2 1475.582 <.0001*
30 lb 0.269 2 114.864 <.0001*
60 lb 0.077 2 32.877 <.0001*
High 0 lb 0.155 2 1907.182 <.0001*
30 lb 0.029 2 361.909 <.0001*
60 lb 0.011 2 129.546 <.0001*
Front Low 0 lb 3.055 2 1550.605 <.0001*
30 lb 0.238 2 121.004 <.0001*
60 lb 0.073 2 37.184 <.0001*
High 0 lb 0.137 2 2052.000 <.0001*
30 lb 0.022 2 327.000 <.0001*
60 lb 0.011 2 158.333 <.0001*
Back Low 0 lb 2.996 2 1102.226 <.0001*
30 lb 0.25 2 91.888 <.0001*
60 lb 0.074 2 27.204 <.0001*
High 0 lb 0.161 2 1816.750 <.0001*
30 lb 0.025 2 285.750 <.0001*
60 lb 0.011 2 118.750 <.0001*
*Statistically significant at the 95% of significance level

165
Table B3. Results of Simple Main Effects test for the effects of the stretch wrap containment force
on the load-bridging in each level of the packaging size and pallet stiffness.
Measurement location Pallet stiffness Packaging size SS DF F Ratio Prob > F
Center Low 5 in. x10 in. x10 in. 3.104 2 1326.256 <.0001*
10 in. x 10 in. x 10 in. 0.451 2 192.484 <.0001*
20 in. x 10 in. x 10 in. 0.007 2 3.000 0.0751
High 5 in. x 10 in. x 10 in. 0.117 2 1441.091 <.0001*
10 in. x 10 in. x 10 in. 0.026 2 317.455 <.0001*
20 in. x 10 in. x 10 in. 0.002 2 19.909 <.0001*
Front Low 5 in. x 10 in. x 10 in. 2.631 2 1335.079 <.0001*
10 in. x 10 in. x 10 in. 0.362 2 183.925 <.0001*
20 in. x 10 in. x 10 in. 0.002 2 1.263 0.3067
High 5 in. x 10 in. x 10 in. 0.094 2 1414.333 <.0001*
10 in. x 10 in. x 10 in. 0.018 2 277.333 <.0001*
20 in. x 10 in. x 10 in. 0.001 2 9.000 0.0020
Back Low 5 in. x 10 in. x 10 in. 2.544 2 935.976 <.0001*
10 in. x 10 in. x 10 in. 0.353 2 129.834 <.0001*
20 in. x 10 in. x 10 in. 0.002 2 0.793 0.4677
High 5 in. x 10 in. x 10 in. 0.111 2 1249.750 <.0001*
10 in. x 10 in. x 10 in. 0.022 2 247.750 <.0001*
20 in. x 10 in. x 10 in. 0.000 2 3.250 0.0624
*Statistically significant at the 95% of significance level

166
Appendix C: Three-Dimensional Diagrams for Pressure Data based on
Assumed Symmetric Response
Figure C1. Three-dimensional diagram for pressure distribution of the sample consisting of 5 in.
x 10 in. x 10 in. corrugated paperboard boxes, zero pound of stretch wrap containment force, and the low
stiffness simulated pallet based on assumed symmetric response.
Figure C2. Three-dimensional diagram for pressure distribution of the sample consisting of 5 in.
x 10 in. x 10 in. corrugated paperboard boxes, 30 pounds of stretch wrap containment force, and the low
stiffness simulated pallet based on assumed symmetric response.
1
611
1722
273338
02468
101214161820
1 3 6 9 111417 19 22 25 27 30 33 36 38
Location (in.) (Side) Pre
ssu
re (
psi
)
Location (in.) (Front)
1
611
1722
273338
02468
101214161820
1 3 6 9 111417 19 22 25 27 30 33 36 38
Location (in.) (Side) Pre
ssu
re (
psi
)
Location (in.) (Front)

167
Figure C3. Three-dimensional diagram for pressure distribution of the sample consisting of 5 in.
x 10 in. x 10 in. corrugated paperboard boxes, 60 pounds of stretch wrap containment force, and the low
stiffness simulated pallet based on assumed symmetric response.
Figure C4. Three-dimensional diagram for pressure distribution of the sample consisting of 10 in.
x 10 in. x 10 in. corrugated paperboard boxes, zero pound of stretch wrap containment force, and the low
stiffness simulated pallet based on assumed symmetric response.
1
6
1117
2227
3338
02468
101214161820
1 3 6 9 11 14 17 19 22 25 27 30 33 36 38
Location (in.) (Side)
Pre
ssu
re (
psi
)
Location (in.) (Front)
1
6
1117
2227
3338
02468
101214161820
1 3 6 9 11 14 17 19 22 25 27 30 33 36 38
Location (in.) (Side)
Pre
ssu
re (
psi
)
Location (in.) (Front)

168
Figure C5. Three-dimensional diagram for pressure distribution of the sample consisting of 10 in.
x 10 in. x 10 in. corrugated paperboard boxes, 30 pound of stretch wrap containment force, and the low
stiffness simulated pallet based on assumed symmetric response.
Figure C6. Three-dimensional diagram for pressure distribution of the sample consisting of 10 in.
x 10 in. x 10 in. corrugated paperboard boxes, 60 pounds of stretch wrap containment force, and the low
stiffness simulated pallet based on assumed symmetric response.
1
6
1117
2227
3338
02468
10
12
14
16
1 3 6 9 11 14 17 19 22 25 27 30 33 36 38
Location (in.) (Side)
Pre
ssu
re (
psi
)
Location (in.) (Front)
1
6
1117
2227
3338
02468
10
12
14
16
1 3 6 9 11 14 17 19 22 25 27 30 33 36 38
Location (in.) (Side)
Pre
ssu
re (
psi
)
Location (in.) (Front)

169
Figure C7. Three-dimensional diagram for pressure distribution of the sample consisting of 20 in.
x 10 in. x 10 in. corrugated paperboard boxes, zero pound of stretch wrap containment force, and the low
stiffness simulated pallet based on assumed symmetric response.
Figure C8. Three-dimensional diagram for pressure distribution of the sample consisting of 20 in.
x 10 in. x 10 in. corrugated paperboard boxes, 30 pounds of stretch wrap containment force, and the low
stiffness simulated pallet based on assumed symmetric response.
1
6
1117
2227
3338
02468
101214161820
1 3 6 9 11 14 17 19 22 25 27 30 33 36 38
Location (in.) (Side)
Pre
ssu
re (
psi
)
Location (in.) (Front)
1
6
1117
2227
3338
02468
101214161820
1 3 6 9 11 14 17 19 22 25 27 30 33 36 38
Location (in.) (Side)
Pre
ssu
re (
psi
)
Location (in.) (Front)

170
Figure C9. Three-dimensional diagram for pressure distribution of the sample consisting of 20 in.
x 10 in. x 10 in. corrugated paperboard boxes, 60 pounds of stretch wrap containment force, and the low
stiffness simulated pallet based on assumed symmetric response.
Figure C10. Three-dimensional diagram for pressure distribution of the sample consisting of 5 in.
x 10 in. x 10 in. corrugated paperboard boxes, zero pounds of stretch wrap containment force, and the
high stiffness simulated pallet based on assumed symmetric response.
1
6
1117
2227
3338
02468
101214161820
1 3 6 9 11 14 17 19 22 25 27 30 33 36 38
Location (in.) (Side)
Pre
ssu
re (
psi
)
Location (in.) (Front)
1
6
1117
2227
3338
02468
101214161820
1 3 6 9 11 14 17 19 22 25 27 30 33 36 38
Location (in.) (Side)
Pre
ssu
re (
psi
)
Location (in.) (Front)

171
Figure C11. Three-dimensional diagram for pressure distribution of the sample consisting of 5 in.
x 10 in. x 10 in. corrugated paperboard boxes, 30 pounds of stretch wrap containment force, and the high
stiffness simulated pallet based on assumed symmetric response.
Figure C12. Three-dimensional diagram for pressure distribution of the sample consisting of 5 in.
x 10 in. x 10 in. corrugated paperboard boxes, 60 pounds of stretch wrap containment force, and the high
stiffness simulated pallet based on assumed symmetric response.
1
6
1117
2227
3338
02468
101214161820
1 3 6 9 11 14 17 19 22 25 27 30 33 36 38
Location (in.) (Side)
Pre
ssu
re (
psi
)
Location (in.) (Front)
1
6
1117
2227
3338
02468
101214161820
1 3 6 9 11 14 17 19 22 25 27 30 33 36 38
Location (in.) (Side)
Pre
ssu
re (
psi
)
Location (in.) (Front)

172
Figure C13. Three-dimensional diagram for pressure distribution of the sample consisting of 10
in. x 10 in. x 10 in. corrugated paperboard boxes, zero pound of stretch wrap containment force, and the
high stiffness simulated pallet based on assumed symmetric response.
Figure C14. Three-dimensional diagram for pressure distribution of the sample consisting of 10
in. x 10 in. x 10 in. corrugated paperboard boxes, 30 pounds of stretch wrap containment force, and the
high stiffness simulated pallet based on assumed symmetric response.
1
6
11
1722
273338
02468
101214161820
1 3 6 9 1114 17 19 22 25 27 30 33 36 38
Location (in.) (Side)
Pre
ssu
re (
psi)
Location (in.) (front)
1
6
1117
22273338
02468
101214161820
1 3 6 9 11141719 22 25 27 30 33 36 38
Location (in.) (Side)
Pre
ssu
re (
psi)
Location (in.) (Front)

173
Figure C15. Three-dimensional diagram for pressure distribution of the sample consisting of 10
in. x 10 in. x 10 in. corrugated paperboard boxes, 60 pounds of stretch wrap containment force, and the
high stiffness simulated pallet based on assumed symmetric response.
Figure C16. Three-dimensional diagram for pressure distribution of the sample consisting of 20
in. x 10 in. x 10 in. corrugated paperboard boxes, zero pound of stretch wrap containment force, and the
high stiffness simulated pallet based on assumed symmetric response.
1
6
1117
2227
3338
02468
10
12
14
16
1 3 6 9 11 14 17 19 22 25 27 30 33 36 38
Location (in.) (Side)
Pre
ssu
re (
psi
)
Location (in.) (Front)
1
6
1117
2227
3338
02468
101214161820
1 3 6 9 11 14 17 19 22 25 27 30 33 36 38
Location (in.) (Side)
Pre
ssu
re (
psi
)
Location (in.) (Front)

174
Figure C17. Three-dimensional diagram for pressure distribution of the sample consisting of 20
in. x 10 in. x 10 in. corrugated paperboard boxes, 30 pounds of stretch wrap containment force, and the
high stiffness simulated pallet based on assumed symmetric response.
Figure C18. Three-dimensional diagram for pressure distribution of the sample consisting of 20
in. x 10 in. x 10 in. corrugated paperboard boxes, 60 pounds of stretch wrap containment force, and the
high stiffness simulated pallet based on assumed symmetric response.
1
6
1117
2227
3338
02468
101214161820
1 3 6 9 11 14 17 19 22 25 27 30 33 36 38
Location (in.) (Side)
Pre
ssu
re (
psi
)
Location (in.) (Front)
1
6
1117
2227
3338
02468
101214161820
1 3 6 9 11 14 17 19 22 25 27 30 33 36 38
Location (in.) (Side)
Pre
ssu
re (
psi
)
Location (in.) (Front)

175
Appendix D: Schematic diagrams showing for averaged pressure values
across the width of the sensed area along the length of the simulated pallet
Figure C1. Schematic diagram showing for averaged pressure values across the width of the
sensed area along the length of the simulated pallet of the sample consisting of 5 in. x 10 in. x 10 in.
corrugated paperboard boxes, zero pound of stretch wrap containment force, and the low stiffness
simulated pallet.
Figure C2. Schematic diagram showing for averaged pressure values across the width of the
sensed area along the length of the simulated pallet of the sample consisting of 5 in. x 10 in. x 10 in.
corrugated paperboard boxes, 30 pounds of stretch wrap containment force, and the low stiffness
simulated pallet.
0
2
4
6
8
10
12
0 10 20 30 40
Av
era
ge p
ressu
re (
psi)
Location (in.) (Pallet front)
0
2
4
6
8
10
12
0 10 20 30 40
Av
era
ge p
ressu
re (
psi)
Location (in.) (Pallet front)

176
Figure C3. Schematic diagram showing for averaged pressure values across the width of the
sensed area along the length of the simulated pallet of the sample consisting of 5 in. x 10 in. x 10 in.
corrugated paperboard boxes, 60 pounds of stretch wrap containment force, and the low stiffness
simulated pallet.
Figure C4. Schematic diagram showing for averaged pressure values across the width of the
sensed area along the length of the simulated pallet of the sample consisting of 10 in. x 10 in. x 10 in.
corrugated paperboard boxes, zero pound of stretch wrap containment force, and the low stiffness
simulated pallet.
0
2
4
6
8
10
12
0 10 20 30 40
Av
era
ge p
ressu
re (
psi)
Location (in.) (Pallet front)
0
2
4
6
8
10
12
0 10 20 30 40
Av
era
ge p
ressu
re (
psi)
Location (in.) (Pallet front)

177
Figure C5. Schematic diagram showing for averaged pressure values across the width of the
sensed area along the length of the simulated pallet of the sample consisting of 10 in. x 10 in. x 10 in.
corrugated paperboard boxes, 30 pound of stretch wrap containment force, and the low stiffness simulated
pallet.
Figure C6. Schematic diagram showing for averaged pressure values across the width of the
sensed area along the length of the simulated pallet of the sample consisting of 10 in. x 10 in. x 10 in.
corrugated paperboard boxes, 60 pounds of stretch wrap containment force, and the low stiffness
simulated pallet.
.
0
2
4
6
8
10
12
0 10 20 30 40
Av
era
ge p
ressu
re (
psi)
Location (in.) (Pallet front)
0
2
4
6
8
10
12
0 10 20 30 40
Av
era
ge p
ressu
re (
psi)
Location (in.) (Pallet front)
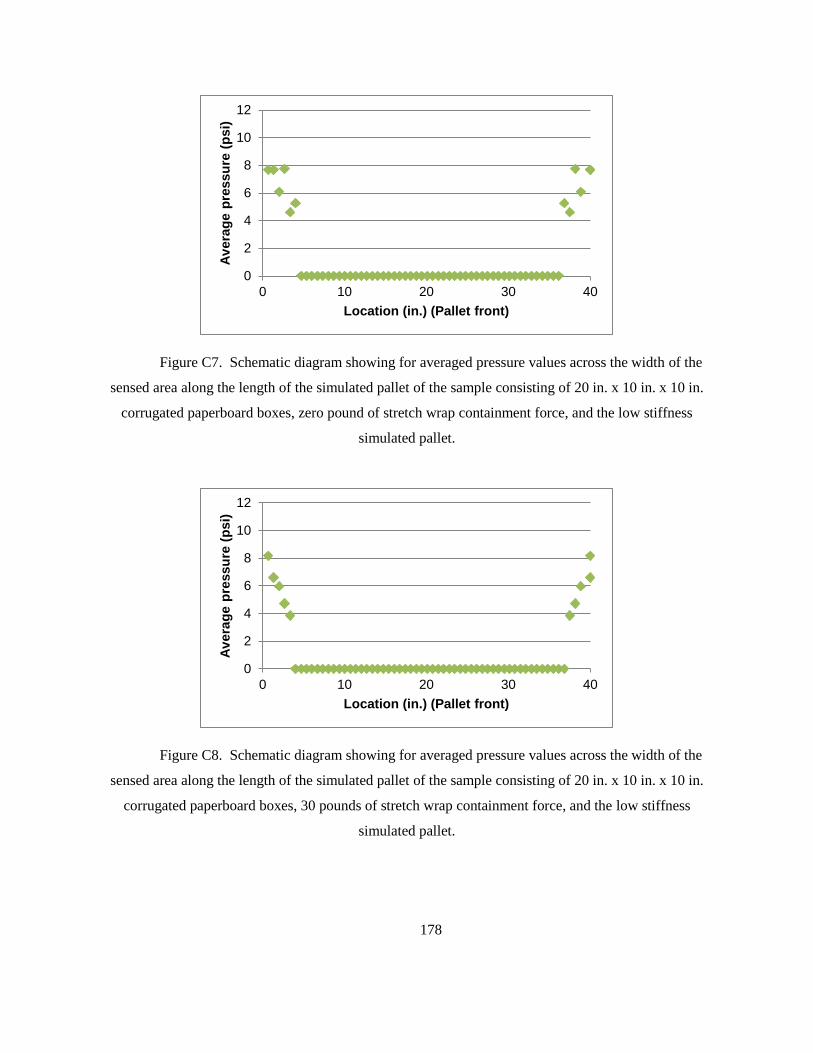
178
Figure C7. Schematic diagram showing for averaged pressure values across the width of the
sensed area along the length of the simulated pallet of the sample consisting of 20 in. x 10 in. x 10 in.
corrugated paperboard boxes, zero pound of stretch wrap containment force, and the low stiffness
simulated pallet.
Figure C8. Schematic diagram showing for averaged pressure values across the width of the
sensed area along the length of the simulated pallet of the sample consisting of 20 in. x 10 in. x 10 in.
corrugated paperboard boxes, 30 pounds of stretch wrap containment force, and the low stiffness
simulated pallet.
0
2
4
6
8
10
12
0 10 20 30 40
Av
era
ge p
ressu
re (
psi)
Location (in.) (Pallet front)
0
2
4
6
8
10
12
0 10 20 30 40
Av
era
ge p
ressu
re (
psi)
Location (in.) (Pallet front)

179
Figure C9. Schematic diagram showing for averaged pressure values across the width of the
sensed area along the length of the simulated pallet of the sample consisting of 20 in. x 10 in. x 10 in.
corrugated paperboard boxes, 60 pounds of stretch wrap containment force, and the low stiffness
simulated pallet.
Figure C10. Schematic diagram showing for averaged pressure values across the width of the
sensed area along the length of the simulated pallet of the sample consisting of 5 in. x 10 in. x 10 in.
corrugated paperboard boxes, zero pounds of stretch wrap containment force, and the high stiffness
simulated pallet.
0
2
4
6
8
10
12
0 10 20 30 40
Av
era
ge p
ressu
re (
psi)
Location (in.) (Pallet front)
0
2
4
6
8
10
12
0 10 20 30 40
Av
era
ge p
ressu
re (
psi)
Location (in.) (Pallet front)

180
Figure C11. Schematic diagram showing for averaged pressure values across the width of the
sensed area along the length of the simulated pallet of the sample consisting of 5 in. x 10 in. x 10 in.
corrugated paperboard boxes, 30 pounds of stretch wrap containment force, and the high stiffness
simulated pallet.
Figure C12. Schematic diagram showing for averaged pressure values across the width of the
sensed area along the length of the simulated pallet of the sample consisting of 5 in. x 10 in. x 10 in.
corrugated paperboard boxes, 60 pounds of stretch wrap containment force, and the high stiffness
simulated pallet.
0
2
4
6
8
10
12
0 10 20 30 40
Av
era
ge p
ressu
re (
psi)
Location (in.) (Pallet front)
0
2
4
6
8
10
12
0 10 20 30 40
Av
era
ge p
ressu
re (
psi)
Location (in.) (Pallet Front)

181
Figure C13. Schematic diagram showing for averaged pressure values across the width of the
sensed area along the length of the simulated pallet of the sample consisting of 10 in. x 10 in. x 10 in.
corrugated paperboard boxes, zero pound of stretch wrap containment force, and the high stiffness
simulated pallet.
Figure C14. Schematic diagram showing for averaged pressure values across the width of the
sensed area along the length of the simulated pallet of the sample consisting of 10 in. x 10 in. x 10 in.
corrugated paperboard boxes, 30 pounds of stretch wrap containment force, and the high stiffness
simulated pallet.
0
2
4
6
8
10
12
0 10 20 30 40
Av
era
ge p
ressu
re (
psi)
Location (in.) (Pallet front)
0
2
4
6
8
10
12
0 10 20 30 40
Av
era
ge p
ressu
re (
psi)
Location (in.) (Pallet front)

182
Figure C15. Schematic diagram showing for averaged pressure values across the width of the
sensed area along the length of the simulated pallet of the sample consisting of 10 in. x 10 in. x 10 in.
corrugated paperboard boxes, 60 pounds of stretch wrap containment force, and the high stiffness
simulated pallet.
Figure C16. Schematic diagram showing for averaged pressure values across the width of the
sensed area along the length of the simulated pallet of the sample consisting of 20 in. x 10 in. x 10 in.
corrugated paperboard boxes, zero pound of stretch wrap containment force, and the high stiffness
simulated pallet.
0
2
4
6
8
10
12
0 10 20 30 40
Av
era
ge p
ressu
re (
psi)
Location (in.) (Pallet front)
0
2
4
6
8
10
12
0 10 20 30 40
Av
era
ge p
ressu
re (
psi)
Location (in.) (Pallet front)

183
Figure C17. Schematic diagram showing for averaged pressure values across the width of the
sensed area along the length of the simulated pallet of the sample consisting of 20 in. x 10 in. x 10 in.
corrugated paperboard boxes, 30 pounds of stretch wrap containment force, and the high stiffness
simulated pallet.
Figure C18. Schematic diagram showing for averaged pressure values across the width of the
sensed area along the length of the simulated pallet of the sample consisting of 20 in. x 10 in. x 10 in.
corrugated paperboard boxes, 60 pounds of stretch wrap containment force, and the high stiffness
simulated pallet.
0
2
4
6
8
10
12
0 10 20 30 40
Av
era
ge p
ressu
re (
psi)
Location (in.) (Pallet front)
0
2
4
6
8
10
12
0 10 20 30 40
Av
era
ge p
ressu
re (
psi)
Location (in.) (Pallet front)