investigation of failures of edenville and sanford dams
TRANSCRIPT

INVESTIGATION OF FAILURES OF EDENVILLE AND SANFORD DAMS
SEPTEMBER 13, 2021
I N D E P E N D E N T F O R E N S I C T E A M I N T E R I M R E P O R T


September 2021 i
Executive Summary
On Tuesday, May 19, 2020, the Edenville and Sanford Dams, located in central Michigan, failed. In August 2020, the Federal Energy Regulatory Commission (FERC) engaged a five-member independent forensic team (IFT) to investigate the failures and the physical and human factors that contributed to them. The IFT has progressed its investigation of both physical and human factors. At this time, the IFT has essentially completed its evaluation of the physical mechanisms of the dam failures, but the evaluation of the human factors is still in progress. Although the IFT’s work will not be completed and its final report will not be issued for several months, the IFT wanted to share its findings regarding the physical mechanisms of the dam failures with the profession and the public. In this interim report, the IFT’s findings to date on the physical mechanisms are presented in only summary form. All of the findings are supported by detailed evidence, which will be compiled and presented in the IFT’s final report.
The Edenville and Sanford Dams were two of four dams in Michigan owned at the time of the failures by Boyce Hydro Power, LLC, and located in series along the Tittabawassee River; the other two Boyce Hydro dams are Secord Dam and Smallwood Dam. All four dams were built in the 1920s. Secord is the most upstream of the four dams, followed further downstream by Smallwood, Edenville, and, finally, Sanford. The dams consisted of earthfill embankments, gated concrete spillways, powerhouses, and, in the case of Sanford Dam, a fuse plug spillway. At the time of the failures, Secord, Smallwood, and Sanford were active hydroelectric facilities. Edenville’s powerhouse was inactive, because its FERC license had been revoked in September 2018.
On Saturday, May 16, 2020, three days before the failures, the levels of the lakes impounded by the four Boyce Hydro dams were all slightly below normal operating pool elevations. On that day, AccuWeather was predicting heavy rain in the coming days. Beginning Sunday, May 17 and extending through Tuesday, May 19, the watersheds upstream of the four dams received significant, but not extreme, rainfall. Rainfall totals for those three days for Secord, Smallwood, Edenville, and Sanford were 5.90 inches, 3.69 inches, 3.76 inches, and 2.95 inches, respectively. The vast majority of the total rainfall for each dam occurred on Monday, May 18—about 96 percent at Secord, 100 percent at Smallwood, 82 percent at Edenville, and 95 percent at Sanford.
At the end of the day (11:59 p.m.) on Sunday, May 17, the levels of all four lakes were slightly below the lower limits prescribed in the normal summer operating rules, which were for the pools to be within the range of +0.3 feet to -0.4 feet of normal pool. Around daylight on Monday, May 18, the pool levels at Secord, Smallwood, and Edenville Dams reportedly began to rise. The lake level at Sanford Dam was reported to begin rising at about mid-day on Monday, May 18.
Spillway gates were opened at all four dams throughout the day on Monday, May 18, beginning at 7:00 a.m. By about 3:30 p.m. that afternoon, all gates at Secord, Smallwood, and Edenville Dams were open. There were no further gate operations at these three dams before the failure of Edenville Dam. Gate operations at Sanford Dam continued until about 8:00 p.m. on May 18, after which there were no further gate operations at any of the Boyce Hydro dams before the failure of Edenville Dam.
Despite all spillway gates being open, the lake levels continued to rise through the afternoon and evening of Monday, May 18 and the morning of Tuesday, May 19. The water level at Secord Dam peaked in the early afternoon of Tuesday, May 19, and the water level at Smallwood is believed to have peaked in the late afternoon that day.

September 2021 ii
At about 1:00 a.m. on Tuesday, May 19, Wixom Lake, the lake impounded by the Edenville Dam, reached the previous pool of record – the highest lake level previously recorded – which is about 2.5 feet above normal pool level and about 4 feet below the Edenville Dam embankment crest elevations. Wixom Lake continued to rise throughout that day until the time of the failure, when the lake level is estimated to have been about 5.5 feet above normal pool level, about 3 feet higher than the previous pool of record, and 1 to 1.5 feet below the nominal embankment crest.
The investigation was aided substantially by a video of the failure recorded by a local resident and referred to in this report as “the dam failure video.” Based on that video, photographs, and eyewitness accounts, a downstream section of the Edenville dam failed suddenly at about 5:35 p.m. The failure section was 40 to 80 feet wide, measured along the crest, and was located in the Edenville lefta embankment, between the gated spillway and the left (east) abutment. The downstream embankment section failed in less than 10 seconds. An upstream remnant remained standing for 10 to 20 seconds, before it gave way and the embankment was fully breached. The breach enlarged over the next few hours, releasing the water stored in Wixom Lake.
The IFT closely examined three potential primary failure mechanisms for Edenville Dam: overtopping, internal erosionb, and instability.
The IFT is confident that the embankment did not overtop. Although the reservoir level at the time of the failure was approaching the crest, especially at a depression in the crest at the location of the failure which developed about 35 minutes before the failure, there is no evidence of water flowing across the crest and no observed evidence of water on the downstream face of the dam until less than 4 minutes, and likely just seconds, before the failure.
Internal erosion was judged to not be plausible as the primary mechanism of failure. The observed physical characteristics of the failure are not consistent with an internal erosion failure mode:
1. No seepage exiting the ground surface was detected; in fact, no water was detected on the downstream ground surface until just before failure.
2. No turbid water discharge was detected. 3. No evidence of a developing open pipe, sinkhole, or progressive sloughing that might
indicate global backward erosion piping was observed. 4. The kinetics of the failure, in particular the global acceleration and velocity of the failure
mass, are not consistent with historical observations of internal erosion failures.
In the IFT’s opinion, internal erosion may have contributed to the depression in the crest that was observed about 35 minutes before the failure, and may have affected the phreatic surface and pore water pressures within the embankment, but it does not explain the primary physics of the failure.
In the IFT’s opinion, the most plausible principal mechanism for the failure of Edenville Dam, with strong evidence, is static liquefaction (flow) instability of saturated, loose sands in the downstream section of the embankment. Static liquefaction is discussed further in this report, but, briefly, it occurs when the mobilized shear strength in a saturated, loose sand decreases rapidly to values significantly less than the applied static shear stresses, resulting in a force imbalance that creates accelerations and velocities. Static liquefaction has been receiving increasing attention in recent years in the tailings dam arena because of several recent tailings dam failures. This failure mechanism has been rare, but not
a In this report, the terms “left” and “right” are used from the perspective of someone looking downstream in the direction water is flowing. This is commonly accepted terminology in dam engineering. b Internal erosion is the erosion of soil particles by seepage or leakage through a dam or its foundation.

September 2021 iii
unprecedented, for water storage dams, and water storage dam engineers have not typically considered it. It has generally been assumed by geotechnical engineers that, under loading conditions other than earthquakes, water will be able to flow in and out of sands and their strength will be defined by the drained shear strength, regardless of the density of the sand – i.e., there will be no dramatic strength reduction as occurs in static liquefaction.
The conclusion regarding static liquefaction at Edenville Dam is supported by (a) the accelerations and velocities of the failing soil mass evident in the dam failure video, (b) strong evidence of loose, uniform fine sand in the embankment, (c) strength loss behavior exhibited in laboratory tests on loose specimens of uniform sand collected from the breach remnant, and (d) a reasonably close match of a simplified kinetic analysis with the characteristics of the failure shown in the dam failure video. Although there is uncertainty concerning the exact trigger or triggers that led to the static liquefaction failure, there are several phenomena that are plausible triggers, either individually or in some combination, as explained in the report. The record lake level at the time of the failure almost certainly contributed to the static liquefaction instability failure.
The IFT also considered the possibility that the instability was caused by a rise in phreatic surface, decreasing effective stresses and drained strengths in the sand, and lowering the factor of safety below 1.0. However, a failure of this type is not consistent with the kinetics of the observed behavior. The stress-strain behavior of a loose sand in drained loading does not show a dramatic strength loss. Without dramatic strength loss, it is not possible to create the force imbalance needed to generate the observed accelerations and velocities during the failure. The failure scenario would instead be characterized by a rise in pore water pressure dropping the factor of safety below 1.0 and causing enough deformation to restore stability, followed by further rise in pore water pressure causing further slumping, with this process continuing and ultimately leading to enough deformation to cause failure through overtopping or internal erosion. The observed characteristics of the failure are not consistent with this mechanism, and the IFT judged this mechanism to be implausible as the primary cause of the failure.
The physics of the Sanford Dam failure are very clear. The failure was the result of embankment overtopping. The breach outflows from Wixom Lake after the failure of Edenville Dam caused the water level in Sanford Lake to rise more quickly than could be accommodated by the spillways at Sanford Dam. As the lake level rose above the crest of the fuse plug spillway at about 7:20 p.m., the fuse plug began to erode and provide additional spillway capacity. However, the combined capacity of the fuse plug spillway and the gated spillway was not sufficient to prevent the lake level from reaching the embankment dam crest elevation at about 7:46 p.m., a little more than 2 hours after the failure of Edenville Dam. As the lake level continued to rise, water flowed over the Sanford embankment crest and down the downstream slope, and the embankment eroded, creating a breach of the embankment. Given the failure of Edenville Dam, the failure of Sanford Dam was not unexpected. Regulators and engineers understood that should a breach occur at Edenville, Sanford would almost certainly be overtopped and fail.

September 2021 iv

September 2021 v
Table of Contents
Acronyms and Abbreviations .................................................................................................. vii 1 Introduction ........................................................................................................................ 1 2 Descriptions of Edenville and Sanford Dams ................................................................. 1
2.1 Edenville Dam ............................................................................................................ 2 2.2 Sanford Dam .............................................................................................................. 4 2.3 Secord and Smallwood Dams .................................................................................... 5
3 Chronology of the Failures ............................................................................................... 6 3.1 Precipitation, Lake Levels, and Gate and Powerplant Operations ............................. 6 3.2 Edenville Dam Failure ................................................................................................ 8 3.3 Sanford Dam Failure ................................................................................................ 19
4 Physical Mechanisms ...................................................................................................... 20 4.1 Edenville Dam .......................................................................................................... 20
4.1.1 Failure Mechanisms ...................................................................................... 22 4.1.1.1 Embankment Overtopping................................................................... 23 4.1.1.2 Internal Erosion ................................................................................... 23 4.1.1.3 Embankment Instability ....................................................................... 24
4.1.2 Cause of Crest Subsidence ........................................................................... 31 4.1.3 Reasons for Location of the Failure ............................................................... 31
4.2 Sanford Dam ............................................................................................................ 32 5 References ....................................................................................................................... 32
Figures Figure 1: Dam locations in Central Michigan ................................................................................ 2 Figure 2: Edenville Dam configuration .......................................................................................... 3 Figure 3: Sanford Dam configuration ............................................................................................ 5 Figure 4: Photograph showing depression in the crest of the Edenville left embankment at
5:03 p.m., Tuesday, May 19, 2020 ............................................................................ 10 Figure 5: Photograph showing depression in the crest of the Edenville left embankment at
5:20 p.m., Tuesday, May 19, 2020 ............................................................................ 11 Figure 6: Photograph showing the crest of the Edenville left embankment at 2:52 p.m.,
Tuesday, May 19, 2020 ............................................................................................. 11 Figure 7: Photograph showing the downstream side of the Edenville left embankment at
5:31 p.m., Tuesday, May 19, 2020 ............................................................................ 12 Figure 8: Enlarged photograph showing the upstream side of the Edenville left
embankment at 5:31 p.m., Tuesday, May 19, 2020 .................................................. 12 Figure 9: Enlarged still image from dam failure video at 0 seconds ........................................... 13 Figure 10: Enlarged still image from dam failure video at 4 seconds ......................................... 14 Figure 11: Enlarged still image from dam failure video at 6 seconds ......................................... 14 Figure 12: Enlarged still image from dam failure video at 7 seconds ......................................... 15 Figure 13: Enlarged still image from dam failure video at 8 seconds ......................................... 15 Figure 14: Enlarged still image from dam failure video at 10 seconds ....................................... 16 Figure 15: Enlarged still image from dam failure video at 15 seconds ....................................... 16 Figure 16: Enlarged still image from dam failure video at 28 seconds ....................................... 17 Figure 17: Enlarged still image from dam failure video at 36 seconds ....................................... 17

September 2021 vi
Figure 18: Edenville left embankment breach at 6:00 p.m. on Tuesday, May 19, 2020 ............. 18 Figure 19: Edenville left embankment breach at 6:24 p.m. on Tuesday, May 19, 2020 ............. 18 Figure 20: Edenville left embankment breach at 7:13 p.m. on Tuesday, May 19, 2020 ............. 19 Figure 21: Edenville left embankment breach at 9:04 p.m. on Tuesday, May 19, 2020 ............. 19 Figure 22: Sanford Dam failure, viewed from upstream (photo courtesy of EGLE) .................... 20 Figure 23: Brittle, strain-softening stress-strain curve ................................................................. 25 Figure 24: Illustration of initiation of collapse behavior at stress state below the drained
friction failure envelope ............................................................................................. 26 Figure 25: Conceptual stress paths to reach the instability line .................................................. 27 Figure 26: Laboratory undrained triaxial test results for Edenville Dam uniform fine sand
sample at 30 percent relative density ........................................................................ 28 Figure 27: Results of kinetic calculations for possible static liquefaction failure of Edenville
left embankment ........................................................................................................ 29 Figure 28: Laboratory drained triaxial test results for Edenville Dam uniform fine sand
sample at 30 percent relative density ........................................................................ 31 Figure 29: Plan from 2012 underdrain survey, showing lack of underdrains in the failure
location ...................................................................................................................... 32
Tables Table 1: Rainfall for the Four Boyce Hydro Dams from May 1 to May 19, 2020 ........................... 6 Table 2: Reported and Estimated Lake Levels at 11:59 P.M. May 18 (Monday), 6:00 A.M.
May 19 (Tuesday), and Noon May 19 (Tuesday), 2020 .............................................. 7 Table 3: Edenville Dam Failure Physical Attributes and Observations ....................................... 21
September 2021 vii
Acronyms and Abbreviations
°F degrees Fahrenheit ASCE American Society of Civil Engineers Edenville Dam Edenville Hydroelectric Project EGLE Michigan Department of Environment, Great Lakes, and Energy El. Elevation FERC Federal Energy Regulatory Commission ft/sec feet per second H:V horizontal:vertical IFT Independent Forensic Team M-30 Michigan Highway 30 NGVD29 National Geodetic Vertical Datum of 1929


Independent Forensic Team – Interim Report Failure of Edenville and Sanford Dams
September 2021 1
1 Introduction The Independent Forensic Team (IFT)1 is performing a thorough review of available information, conducting interviews, and performing engineering analyses to develop findings and opinions on the chain of physical conditions, judgments, decisions, actions, and inactions that, on May 19, 2020, led to the failures of the Edenville and Sanford Dams in Michigan, and why opportunities for intervention in this chain were not realized.
The IFT has progressed its investigation of both physical and human factors. At this time, the IFT has essentially completed its evaluation of the physical mechanisms of the dam failures, but the evaluation of the human factors is still in progress. Although the IFT’s work will not be completed, and its final report will not be issued for several months, the IFT wanted to share its findings regarding the physical mechanisms of the dam failures with the profession and the public.
In this interim report, the IFT’s findings to date on the physical mechanisms are presented in only summary form. All of the findings are supported by detailed evidence, which will be compiled and presented in the IFT’s final report.
In the remainder of this interim report, the IFT provides (1) brief descriptions of the Edenville and Sanford Dams, (2) a discussion of the chronology of the failures, and (3) the IFT’s findings concerning the physical mechanisms of the failures.
2 Descriptions of Edenville and Sanford Dams The Edenville and Sanford Dams were two of four dams in Michigan owned at the time of the failures by Boyce Hydro Power, LLC, and located in series along the same river; the other two Boyce Hydro dams are Secord Dam and Smallwood Dam. All four dams were built in the 1920s.
At the time of the 2020 failures, all of the Boyce Hydro dams except Edenville Dam were active hydroelectric facilities under the regulation of the Federal Energy Regulatory Commission (FERC). The Edenville Dam was also a FERC-regulated hydroelectric facility previously, but FERC revoked the Edenville Dam license in September 2018. At the time of the failures, Edenville Dam was regulated by the State of Michigan Department of Environment, Great Lakes, and Energy (EGLE).
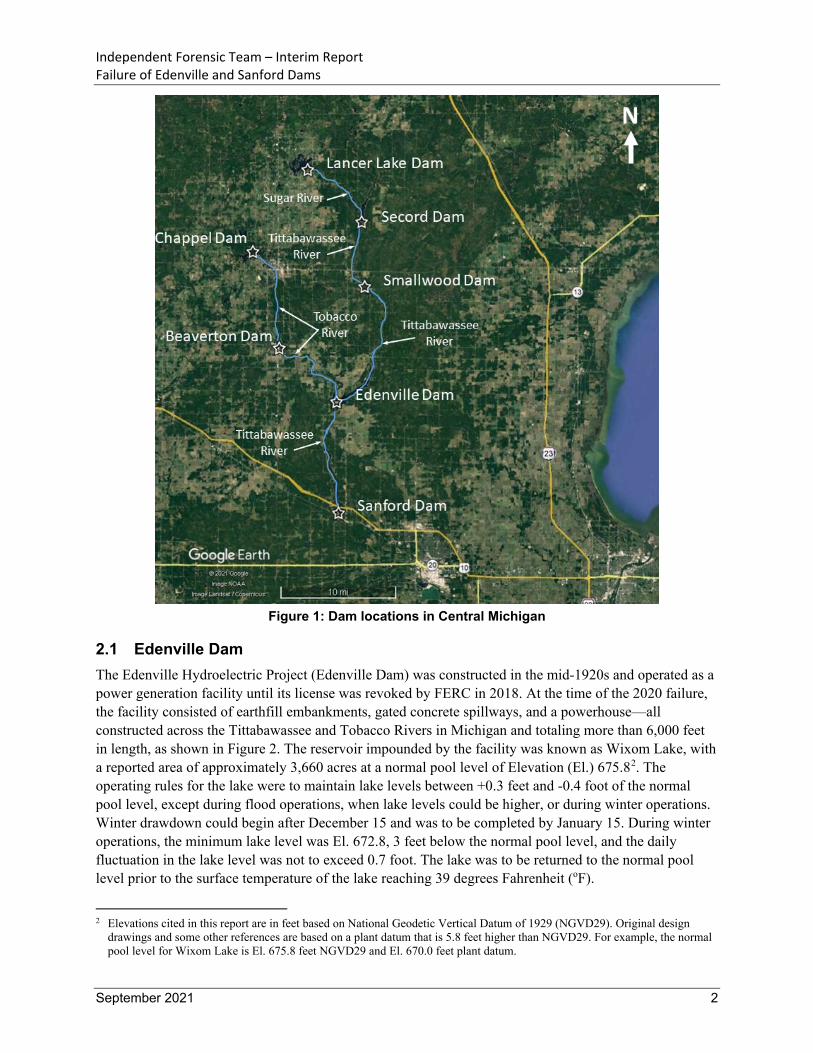
Secord and Smallwood Dams are located on the Tittabawassee River, upstream of Edenville Dam, and Sanford Dam is located on the Tittabawassee River downstream of Edenville Dam. Edenville Dam was constructed across both the Tittabawassee River and the Tobacco River, just upstream of their confluence. Lancer Lake Dam, owned by others, is on the Sugar River, which is a tributary of the Tittabawassee River, with its confluence below Secord Dam and just above Smallwood Dam. Two other dams, Beaverton and Chappel, are owned by others and are located on the Tobacco River upstream of Edenville Dam. The locations of all seven dams are shown on Figure 1.
1 The Independent Forensic Team is composed of John W. France (Team Leader), Irfan Alvi, Jennifer L. Williams, Arthur
Miller, and Steve Higinbotham.
Independent Forensic Team – Interim Report Failure of Edenville and Sanford Dams
September 2021 2
Figure 1: Dam locations in Central Michigan
2.1 Edenville Dam The Edenville Hydroelectric Project (Edenville Dam) was constructed in the mid-1920s and operated as a power generation facility until its license was revoked by FERC in 2018. At the time of the 2020 failure, the facility consisted of earthfill embankments, gated concrete spillways, and a powerhouse—all constructed across the Tittabawassee and Tobacco Rivers in Michigan and totaling more than 6,000 feet in length, as shown in Figure 2. The reservoir impounded by the facility was known as Wixom Lake, with a reported area of approximately 3,660 acres at a normal pool level of Elevation (El.) 675.82. The operating rules for the lake were to maintain lake levels between +0.3 feet and -0.4 foot of the normal pool level, except during flood operations, when lake levels could be higher, or during winter operations. Winter drawdown could begin after December 15 and was to be completed by January 15. During winter operations, the minimum lake level was El. 672.8, 3 feet below the normal pool level, and the daily fluctuation in the lake level was not to exceed 0.7 foot. The lake was to be returned to the normal pool level prior to the surface temperature of the lake reaching 39 degrees Fahrenheit (oF).
2 Elevations cited in this report are in feet based on National Geodetic Vertical Datum of 1929 (NGVD29). Original design
drawings and some other references are based on a plant datum that is 5.8 feet higher than NGVD29. For example, the normal pool level for Wixom Lake is El. 675.8 feet NGVD29 and El. 670.0 feet plant datum.
Independent Forensic Team – Interim Report Failure of Edenville and Sanford Dams
September 2021 3
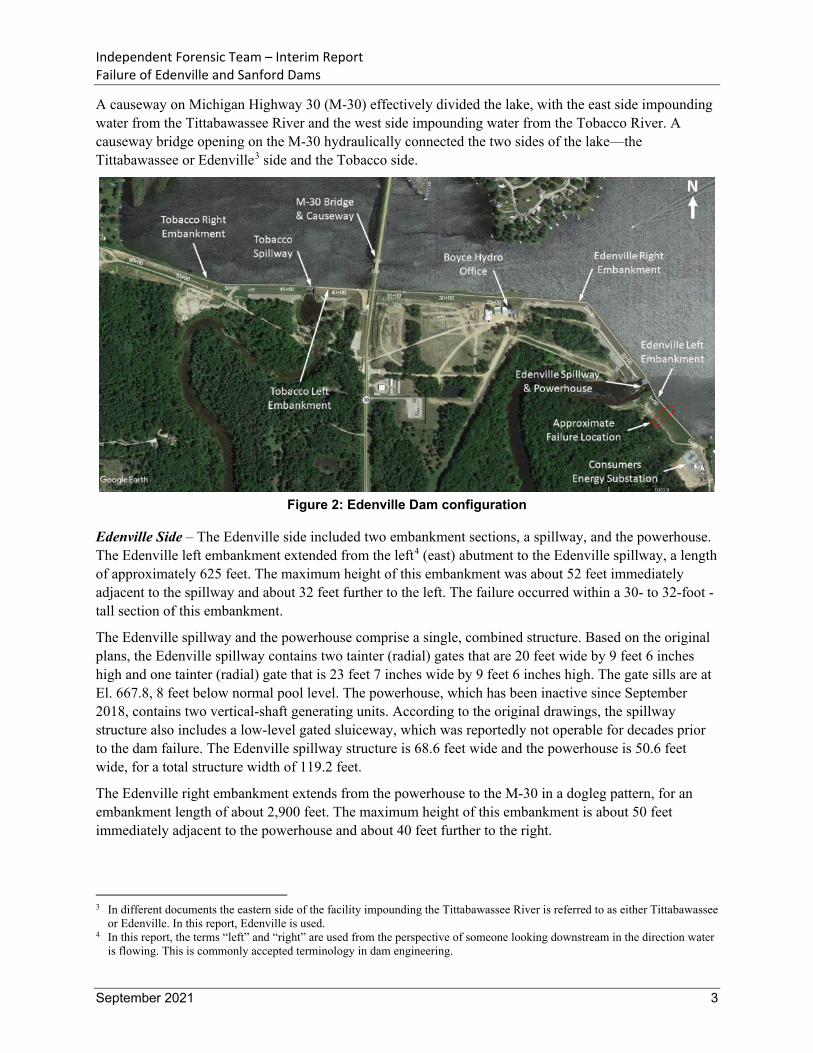
A causeway on Michigan Highway 30 (M-30) effectively divided the lake, with the east side impounding water from the Tittabawassee River and the west side impounding water from the Tobacco River. A causeway bridge opening on the M-30 hydraulically connected the two sides of the lake—the Tittabawassee or Edenville3 side and the Tobacco side.
Figure 2: Edenville Dam configuration
Edenville Side – The Edenville side included two embankment sections, a spillway, and the powerhouse. The Edenville left embankment extended from the left4 (east) abutment to the Edenville spillway, a length of approximately 625 feet. The maximum height of this embankment was about 52 feet immediately adjacent to the spillway and about 32 feet further to the left. The failure occurred within a 30- to 32-foot -tall section of this embankment.
The Edenville spillway and the powerhouse comprise a single, combined structure. Based on the original plans, the Edenville spillway contains two tainter (radial) gates that are 20 feet wide by 9 feet 6 inches high and one tainter (radial) gate that is 23 feet 7 inches wide by 9 feet 6 inches high. The gate sills are at El. 667.8, 8 feet below normal pool level. The powerhouse, which has been inactive since September 2018, contains two vertical-shaft generating units. According to the original drawings, the spillway structure also includes a low-level gated sluiceway, which was reportedly not operable for decades prior to the dam failure. The Edenville spillway structure is 68.6 feet wide and the powerhouse is 50.6 feet wide, for a total structure width of 119.2 feet.
The Edenville right embankment extends from the powerhouse to the M-30 in a dogleg pattern, for an embankment length of about 2,900 feet. The maximum height of this embankment is about 50 feet immediately adjacent to the powerhouse and about 40 feet further to the right.
3 In different documents the eastern side of the facility impounding the Tittabawassee River is referred to as either Tittabawassee
or Edenville. In this report, Edenville is used. 4 In this report, the terms “left” and “right” are used from the perspective of someone looking downstream in the direction water
is flowing. This is commonly accepted terminology in dam engineering.

Independent Forensic Team – Interim Report Failure of Edenville and Sanford Dams
September 2021 4
According to the original design drawings, the upstream and downstream slopes of the embankments are nominally 2.5H:1V (horizontal:vertical) and 2H:1V, respectively. However, downstream slopes have been flattened and berms have been added in some locations, and survey data show that the downstream slope is steeper than 2H:1V in some locations. In addition, survey data after the flood event indicate that the upstream slope was steeper than 2.5H:1V in some locations.
Tobacco Side – The Tobacco side includes two embankment sections and a spillway. The Tobacco left embankment extends from the M-30 crossing to the Tobacco spillway, a length of approximately 520 feet. The maximum height of this embankment is about 47 feet adjacent to the spillway and about 45 feet further to the left.
Based on the original plans, the Tobacco spillway contains two gates that are 23 feet 7 inches wide by 9 feet 6 inches high and one gate that is 20 feet wide by 9 feet 6 inches high. The gate sills are at El. 667.8, 8 feet below normal pool level. As on the Edenville side, according to the original drawings, the spillway structure also included a low-level gated sluiceway, which was reportedly not operable for decades prior to the failure. The Tobacco spillway structure is 72.2 feet wide.
The Tobacco right embankment extends from the Tobacco spillway to the right (west) abutment, in a slight dogleg pattern for an embankment length of about 1,895 feet. The maximum height of this embankment is about 47 feet adjacent to the spillway and about 32 feet further to the right.
Again, as on the Edenville side, according to the original design drawings, the upstream and downstream slopes of the embankments are nominally 2.5H:1V and 2H:1V, respectively. However, downstream slopes have been flattened and berms have been added in some locations, and survey data show that the downstream slope is steeper than 2H:1V in some locations.
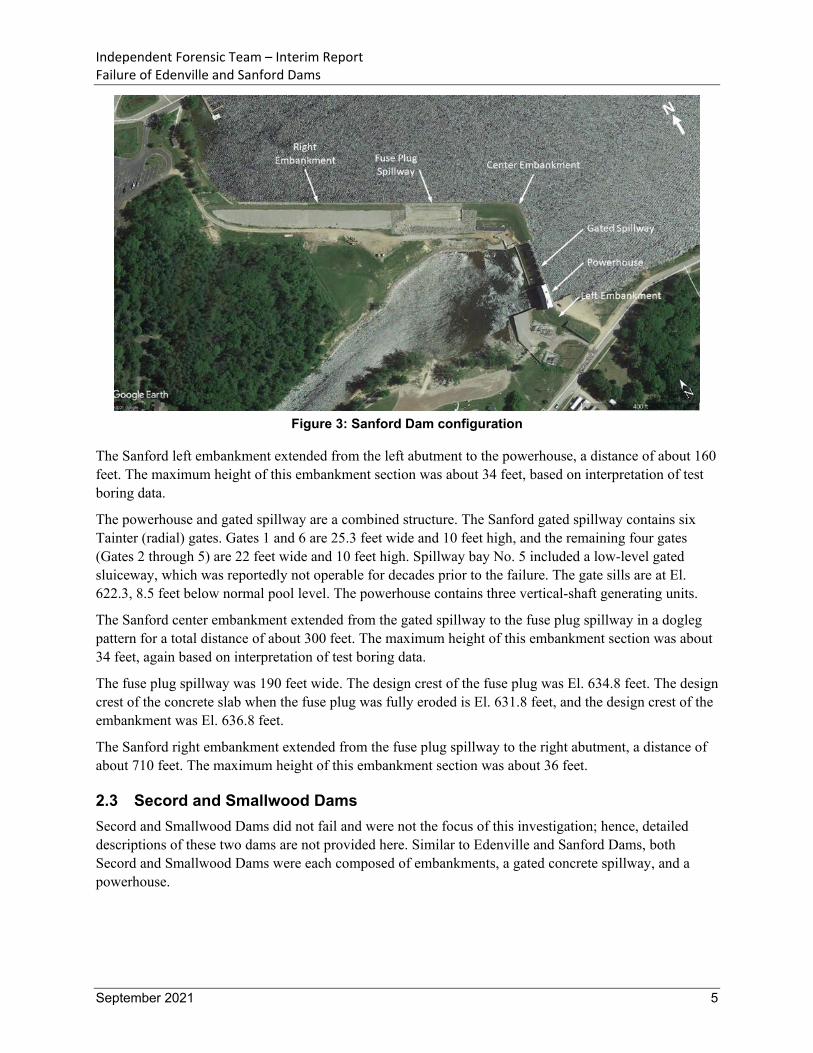
2.2 Sanford Dam At the time of the failure, Sanford Dam consisted of three embankments, a fuse plug spillway, a gated spillway, and a powerhouse, as shown in Figure 3. Sanford Lake had a surface area of about 1,526 acres at a normal pool level of El. 630.8. Similar to Edenville Dam, the operating rules for the lake were to maintain lake levels between +0.3 foot and -0.4 foot of the normal pool level, except during flood operations, when lake levels could be higher, or during winter operations. Winter drawdown could begin after December 15 and had to be completed by January 15. During winter operations, the minimum lake level was El. 627.8, 3 feet below normal pool level, and the daily fluctuation in lake level was not to exceed 0.7 foot. The lake was to be returned to normal pool level prior to the surface temperature of the lake reaching 39°F.
Independent Forensic Team – Interim Report Failure of Edenville and Sanford Dams
September 2021 5
Figure 3: Sanford Dam configuration
The Sanford left embankment extended from the left abutment to the powerhouse, a distance of about 160 feet. The maximum height of this embankment section was about 34 feet, based on interpretation of test boring data.
The powerhouse and gated spillway are a combined structure. The Sanford gated spillway contains six Tainter (radial) gates. Gates 1 and 6 are 25.3 feet wide and 10 feet high, and the remaining four gates (Gates 2 through 5) are 22 feet wide and 10 feet high. Spillway bay No. 5 included a low-level gated sluiceway, which was reportedly not operable for decades prior to the failure. The gate sills are at El. 622.3, 8.5 feet below normal pool level. The powerhouse contains three vertical-shaft generating units.
The Sanford center embankment extended from the gated spillway to the fuse plug spillway in a dogleg pattern for a total distance of about 300 feet. The maximum height of this embankment section was about 34 feet, again based on interpretation of test boring data.
The fuse plug spillway was 190 feet wide. The design crest of the fuse plug was El. 634.8 feet. The design crest of the concrete slab when the fuse plug was fully eroded is El. 631.8 feet, and the design crest of the embankment was El. 636.8 feet.
The Sanford right embankment extended from the fuse plug spillway to the right abutment, a distance of about 710 feet. The maximum height of this embankment section was about 36 feet.
2.3 Secord and Smallwood Dams Secord and Smallwood Dams did not fail and were not the focus of this investigation; hence, detailed descriptions of these two dams are not provided here. Similar to Edenville and Sanford Dams, both Secord and Smallwood Dams were each composed of embankments, a gated concrete spillway, and a powerhouse.

Independent Forensic Team – Interim Report Failure of Edenville and Sanford Dams
September 2021 6
3 Chronology of the Failures
3.1 Precipitation, Lake Levels, and Gate and Powerplant Operations5 On Saturday, May 16, 2020, 3 days before the failure, the levels of the four lakes impounded by the Secord, Smallwood, Edenville, and Sanford Dams (the four Boyce Hydro dams) were all at slightly below normal operating pool elevations. On that day AccuWeather was forecasting significant rainfall in the coming days.
Table 1 lists daily rainfall totals for the four Boyce Hydro dams from May 1 through May 19, 2020. As shown in the table, the total rainfall amounts for May 17 through May 19, 2020, were 5.90 inches, 3.69 inches, 3.76 inches, and 2.95 inches for Secord, Smallwood, Edenville, and Sanford, respectively. At all four dams, the overwhelming majority of the total rainfall occurred on Monday, May 18, 2020—about 96 percent at Secord, 100 percent at Smallwood, 82 percent at Edenville, and 95 percent at Sanford.
Table 1: Rainfall for the Four Boyce Hydro Dams from May 1 to May 19, 2020
Daily Rainfall Totals, inches
Date Sanford Edenville Smallwood Secord
5/1 0 0 0.03 0
5/2 0 0 0.03 0.03
5/3 0 0 0 0
5/4 0 0 0 0
5/5 0 0 0 0
5/6 0 0 0 0
5/7 0 0 0 0
5/8 0 0 0 0
5/9 0 0 0 0
5/10 0 0 0 0
5/11 0.03 0 0 0.06
5/12 0 0 0 0
5/13 0 0 0 0
5/14 0.27 0.17 0.14 0.13
5/15 0.73 0.75 0.40 0.83
5/16 0 0 0 0
5/17 0.2 0.46 0 0
5/18 2.79 3.08 3.69 5.67
5/19 0.16 0.32 0 0.23
Total 5/17 through 5/19
2.95 3.76 3.69 5.90
Total for May 4.18 4.78 4.29 6.95
5 Lake levels are based on data from reservoir level recorders provided by Boyce Hydro for times for which recorded data are
available, supplemented with eyewitness accounts and results of the IFT’s hydrologic/hydraulic model. Gate operation information is based on operator logs provided by Boyce Hydro and discussions with one of the Boyce operators.

Independent Forensic Team – Interim Report Failure of Edenville and Sanford Dams
September 2021 7
Some minor adjustments were made to the gates at Edenville Dam and Sanford Dam on Saturday and Sunday, May 16 and May 17, 2020. After the FERC license for Edenville was revoked in 2018, electricity could not be generated and water could not be released through the powerhouse, and the low-level sluiceways had apparently been inoperable for decades. The spillway gates were the only facilities available to control the lake level at Edenville within the operating rules, and the Edenville gates were therefore operated more frequently, both in closing and opening, than gates at the other three dams. At the end of the day (11:59 p.m.) on Sunday, May 17, the levels of all four lakes were slightly below the lower limits established in their operating rules.
During the early morning hours of Monday, May 18, the lake levels at all four dams either remained constant or dropped, remaining at levels below the normal operating levels. However, in the predawn hours the pool levels at Secord, Smallwood, and Edenville Dams began to rise. The lake level at Sanford Dam was reported to begin to rise at about midday on May 18.
Gates were opened at all four dams throughout the day on Monday, May 18, 2020, beginning at 7:00 a.m. By about 3:30 p.m. that afternoon, all gates at Secord, Smallwood, and Edenville Dams were open. There were no further gate operations at these three dams before the failure of Edenville Dam. Gate operations at Sanford Dam continued until about 8:00 p.m. on May 18, after which there were no further gate operations at any of the Boyce Hydro dams before the failure of Edenville Dam.
At the beginning of the event, power generation operations and releases were normal at Secord, Smallwood, and Sanford Dams. As noted above, there were no power generation operations or releases through the powerhouse at Edenville Dam because the hydropower license had been revoked. Power generation operations and releases at Secord Dam continued throughout the event. However, power generation operations and releases were stopped at Smallwood Dam on Monday, May 18, at 9:00 p.m., and at Sanford Dam on Tuesday, May 19, at 1:00 a.m. in accordance with operating plans during floods.
The pool levels continued to rise at all four dams throughout Monday, May 18, and the morning of Tuesday, May 19. Table 2 summarizes the lake levels at the end of the day (11:59 p.m.) on Monday, May 18; at 6:00 a.m. on Tuesday, May 19; and at noon on Tuesday, May 19. Most of the rise in lake levels at Secord, Smallwood, and Edenville Dams began in the afternoon and evening of Monday, May 18, and the gates at those three dams had been opened by the afternoon of that day. Most of the lake level rise at Sanford Dam began in the evening of May 18, and the gates at Sanford Dam had been opened by the evening of that day.
Table 2: Reported and Estimated Lake Levels at 11:59 P.M. May 18 (Monday), 6:00 A.M. May 19 (Tuesday), and Noon May 19 (Tuesday), 2020
Dam Lake Levels
11:59 p.m. May 18 6:00 a.m. May 19 Noon May 19 Secord El. 752.3 1.5 feet above
normal pool level El. 753.0 2.2 feet above normal pool level
El. 753.2, 2.5 feet above normal pool
Smallwood El. 708.0, 3.2 feet above normal pool level
El. 709.2, 4.4 feet above normal pool level
Sometime between 10:40 a.m. and 4:50 p.m. the maximum lake level was between 709.2 and 711+
Edenville El. 678.0, 2.2 feet above normal pool level
El. 679.4, 3.6 feet above normal pool level
Not available
Sanford El. 630.9, 0.1 feet above normal pool level
El. 631.7, 0.9 feet above normal pool level
El. 632.3 feet, 1.5 feet above normal pool

Independent Forensic Team – Interim Report Failure of Edenville and Sanford Dams
September 2021 8
The water level at Secord Dam peaked at about El. 753.5 feet about 4.3 feet below the embankment crest at 1:00 p.m. on Tuesday, May 19, about 4 hours and 35 minutes before the failure of Edenville Dam. At Smallwood Dam, the water level was El. 709.2 feet at about 6:00 a.m. on May 19, the time of the last recorded water level at Smallwood. The lake level at Smallwood is believed to have continued to rise through the day, cresting somewhere between El. 709.2 feet and El. 711+ feet in the late afternoon. The water levels at Edenville and Sanford Dams after noon on May 19 are discussed below.
3.2 Edenville Dam Failure At midnight on Sunday, May 17, Wixom Lake, the lake impounded by the Edenville Dam, was at about El. 675.4, about 0.4 foot below normal pool level, at the lower limit of the authorized summer operating range.6 The lake level began to rise at about 5:00 a.m. on Monday, May 18, and continued to rise until the time of the Edenville Dam failure at about 5:35 p.m. on Tuesday, May 19.
Spillway gates at both the Tobacco and Edenville spillways at Edenville Dam were operated between 7:00 a.m. and 3:30 p.m. on Monday, May 18. At 3:30 p.m. that day, all six gates, three at the Tobacco spillway and three at the Edenville spillway, had been opened and remained at those openings until the time of the failure.
At about 1:00 p.m. on Monday, May 18, Wixom Lake reached normal pool level, El. 675.8 feet. The next day, Tuesday, May 19, at about 1:00 a.m., the lake reached the previous pool of record,7 El. 678.3. According to the Boyce Hydro incident report to FERC, at 3:30 a.m. that day, the lake was at least 3 feet above normal pool. Wixom Lake continued to rise throughout the day on May 19, until the time of the failure. Measurements of Wixom Lake water levels are not available for the afternoon of May 19. Based on eyewitness accounts and evaluation of photographs, the IFT estimates that the water level of the lake at the time of the failure was in the range of about El. 681 to El. 681.5. This lake level is about 3 feet higher than the previous pool of record, about 5.5 feet higher than normal pool, and about 1 foot to 1.5 feet below the estimated pre-failure crest elevations of the Edenville left embankment.
The first report of significant damage at Edenville Dam was at daybreak on Tuesday, May 19, when two of the operators reported erosion and sloughing near the top of the upstream slope of the east end of the Edenville Dam embankments. The Chief Operator and the Assistant Chief Operator, both Boyce Hydro employees, traveled to Edenville Dam. They were joined at the site later that morning by individuals from EGLE, Fisher Contracting, and Spicer Engineering. The Chief Operator was also in contact with Boyce Hydro ownership in Las Vegas, Nevada, that morning. A Boyce Hydro incident report submitted to FERC states, “The engineers and contractor met at the dam between 10:30–11:00 a.m. They all walked the length of the dam and noted no leakage or damage to the embankment on the downstream slopes.” The report further states, “It was agreed that Fisher Contracting would attempt to mitigate the erosion of the embankment by placing turbidity barriers, sandbags, and geocloth on the reservoir face of the dam...” Information collected by the IFT in interviews confirms that Fisher Contracting spent the rest of the day deploying erosion control measures on the upstream face of the Edenville Dam embankments. At the time of the Edenville Dam failure, crews were reportedly working in the vicinity of the Boyce Hydro office, to the right of the Edenville spillway and the powerhouse.
6 A Boyce Hydro incident report submitted to FERC indicates that, at the end of the day on May 17, Wixom Lake was 0.44 foot
below normal pool level or slightly below the lower limit of the authorized range. 7 “Pool of record” is the highest known lake level in the history of the project. Based on available information, the previous pool
of record at Wixom Lake was El. 678.3, 2.5 feet above normal pool level. The previous pool of record occurred on April 5, 1929.

Independent Forensic Team – Interim Report Failure of Edenville and Sanford Dams
September 2021 9
Early in the afternoon, a large depression was observed in the downstream slope of the Tobacco left embankment, adjacent to the Tobacco spillway. This depression is believed to have been caused by erosion from currents in the spillway discharge.
As the reservoir continued to rise throughout the day, the parties were concerned about both the erosion on the upstream slope and the possibility that the reservoir would rise high enough to overtop the embankments. The possibility of attempting a controlled breach of Edenville Dam was being considered as the reservoir continued to rise in the afternoon, with the likely controlled breach location at the west (right) end of the Tobacco embankments, where the height of the embankment was small. At the time of the dam failure, the controlled breach was still being considered, but the decision had been deferred because the rate of rise of the lake had slowed from an estimated 2 inches per hour before 3:00 p.m. to an estimated 1 to 1.5 inches per hour after 3:00 p.m.
Because the crews were not deploying erosion control measures on the Edenville left embankment (at the east end), there was limited attention paid to that section of embankment, which was the location of the failure. The IFT was not able to find any record of close-up examination of the Edenville left embankment during the afternoon of Tuesday, May 19. In interviews, the IFT heard several eyewitness accounts of observations of the Edenville left embankment made from the lakeshore upstream and from the Consumers Energy substation downstream, before the failure, during the failure, and after the failure. The IFT was also able to collect a number of still photography and video images of the Edenville left embankment, which were provided by the eyewitnesses.
Other than the upstream erosion, the IFT was not able to find any reports of distress in the Edenville left embankment on Tuesday, May 19, prior to about 5:00 p.m. Eyewitnesses report observing a depression or subsidence in a section of the Edenville left embankment crest at about 5:00 p.m., about a half hour before the failure, and this observation is supported by photographic evidence as shown in Figures 4 and 5. Another photograph taken at 2:52 p.m. that afternoon does not show a depression in the crest (Figure 6). The photographs in Figure 4 through Figure 6 were taken by local residents who were observing the lake and the dam from the upstream left (east) bank of the lake.
After observing the depression in the crest, several residents walked to the Consumers Energy substation located downstream of the Edenville left embankment. The photograph of the downstream side of the embankment in Figure 7 was taken at 5:31 p.m. that day. The photograph shows the depression in the crest, but otherwise does not show any significant signs of distress in the embankment. Figure 7 shows a lighter colored area near the toe of the embankment at the ultimate failure location. The IFT considered the possibility that this light color might indicate seepage, but after reviewing other photographs and talking with eyewitnesses, the IFT concluded that it does not appear to be seepage. Historical photographs showed significant variability of color on the face of the embankment. However, because Figure 7 is a distant view of the embankment, the possibility that the color difference represents seepage cannot be totally ruled out.
Figure 8 shows a view of the depression in the crest from upstream at 5:33 p.m. The photograph in Figure 8 also shows the erosion that had occurred on the upstream slope of the embankment.

Independent Forensic Team – Interim Report Failure of Edenville and Sanford Dams
September 2021 10
Figure 4: Photograph showing depression in the crest of the Edenville left embankment at 5:03
p.m., Tuesday, May 19, 2020
Depressed Area on the Crest

Independent Forensic Team – Interim Report Failure of Edenville and Sanford Dams
September 2021 11
Figure 5: Photograph showing depression in the crest of the Edenville left embankment at 5:20
p.m., Tuesday, May 19, 2020
Figure 6: Photograph showing the crest of the Edenville left embankment at 2:52 p.m., Tuesday,
May 19, 2020
Depressed Area on the Crest

Independent Forensic Team – Interim Report Failure of Edenville and Sanford Dams
September 2021 12
Figure 7: Photograph showing the downstream side of the Edenville left embankment at 5:31 p.m.,
Tuesday, May 19, 2020
Figure 8: Enlarged photograph showing the upstream side of the Edenville left embankment at
5:31 p.m., Tuesday, May 19, 2020

Independent Forensic Team – Interim Report Failure of Edenville and Sanford Dams
September 2021 13
Shortly after the photographs shown in Figure 7 and Figure 8 were taken, the eyewitnesses report observing a stream of water flowing down the downstream face of the dam. This observation prompted one of the eyewitnesses, a local resident, to begin a video recording on his phone at 5:35 p.m. His video is referred to in this report as “the dam failure video.” Several still images from the video are shown in Figure 9 through Figure 17.
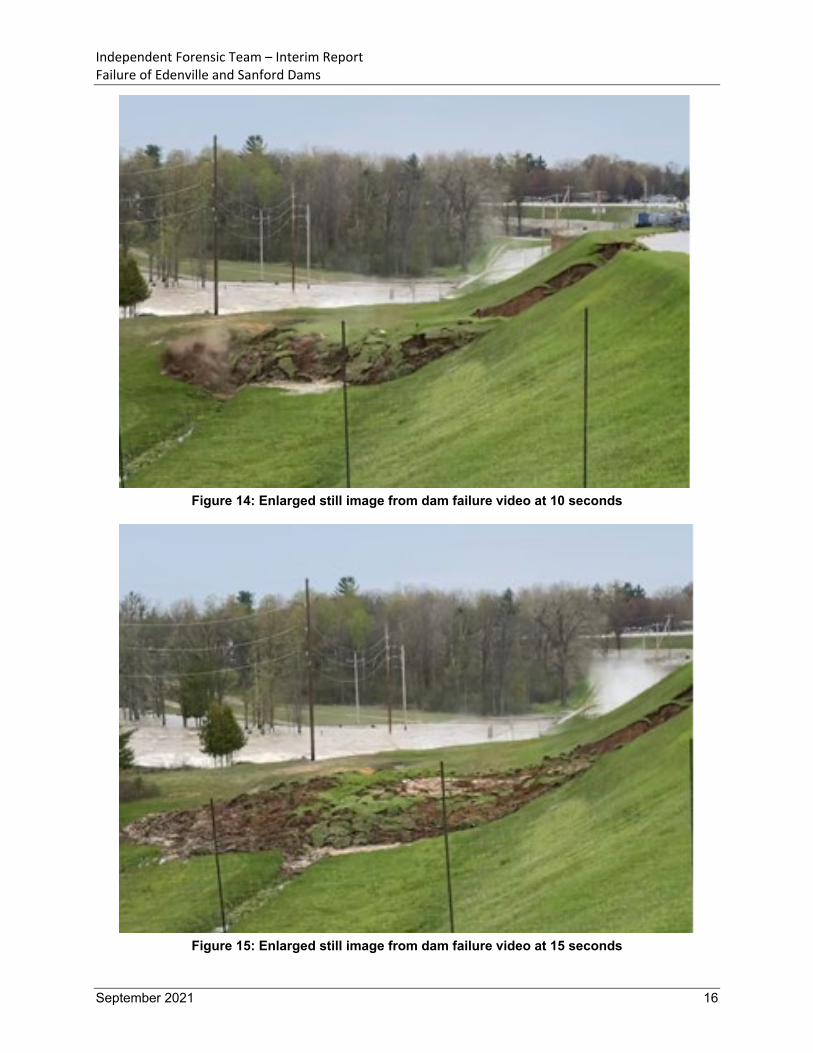
Figure 9 is at the beginning of the video (0 seconds, 5:35 p.m.) and shows the depression in the crest and the stream of water on the downstream face, but no other obvious signs of distress. Figure 10, at 4 seconds, shows a slight bulge in the downstream toe and possibly an increase in the depression at the crest. Figure 11, at 6 seconds, shows a significant increase in the toe bulge and the depression in the crest. Figure 12 through Figure 15 show the progression of the embankment failure over the subsequent 8 seconds, from 7 seconds to 15 seconds in the video, concluding with a large mass of soil deposited downstream of the toe of the dam. Figure 16, at 28 seconds, shows increasing water flow through the failed embankment location. By 36 seconds, Figure 17, a breach through the embankment has formed. From the dam failure video, it can be concluded that the failure of the embankment occurred in no more than about 10 seconds and the breach developed between about 10 and 20 seconds later. It is also noted that the failure of the embankment was initially limited to a length estimated to be between 40 and 80 feet along the axis of the dam.
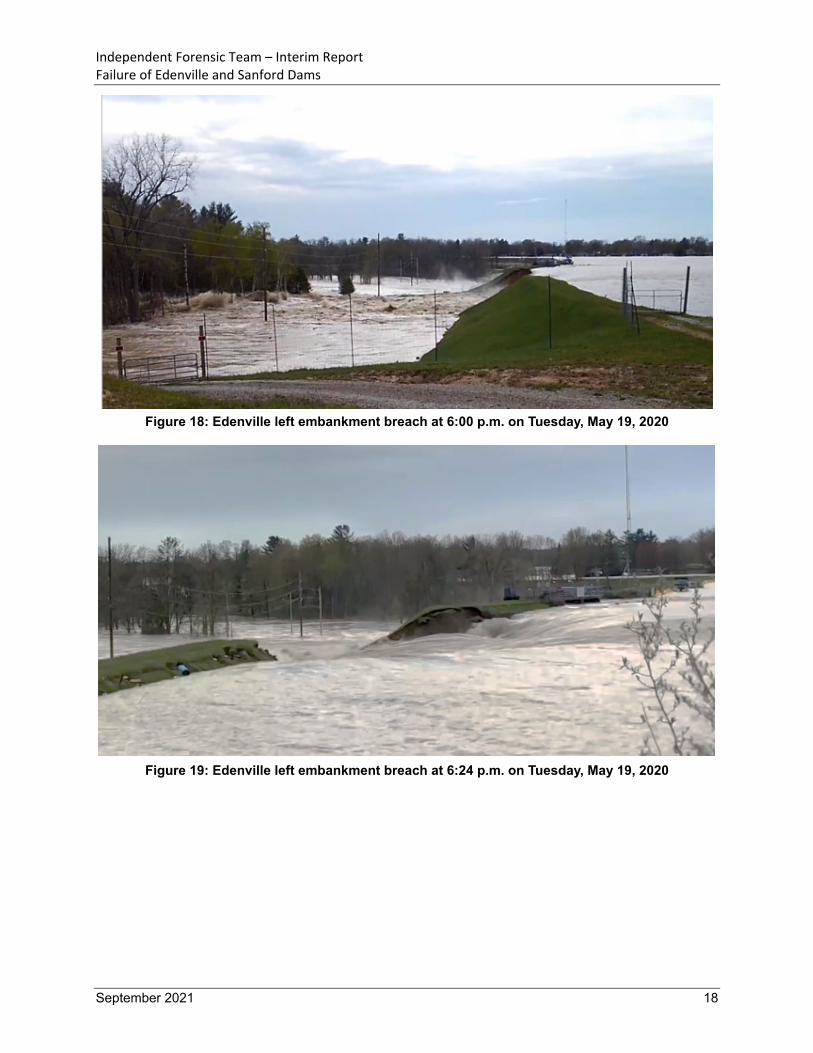
Over the next several hours the breach widened, and Wixom Lake was drained. Four images of the widening of the breach are shown in Figures 18 through 21.
Figure 9: Enlarged still image from dam failure video at 0 seconds

Independent Forensic Team – Interim Report Failure of Edenville and Sanford Dams
September 2021 14
Figure 10: Enlarged still image from dam failure video at 4 seconds
Figure 11: Enlarged still image from dam failure video at 6 seconds

Independent Forensic Team – Interim Report Failure of Edenville and Sanford Dams
September 2021 15
Figure 12: Enlarged still image from dam failure video at 7 seconds
Figure 13: Enlarged still image from dam failure video at 8 seconds
Independent Forensic Team – Interim Report Failure of Edenville and Sanford Dams
September 2021 16
Figure 14: Enlarged still image from dam failure video at 10 seconds
Figure 15: Enlarged still image from dam failure video at 15 seconds

Independent Forensic Team – Interim Report Failure of Edenville and Sanford Dams
September 2021 17
Figure 16: Enlarged still image from dam failure video at 28 seconds
Figure 17: Enlarged still image from dam failure video at 36 seconds
Independent Forensic Team – Interim Report Failure of Edenville and Sanford Dams
September 2021 18
Figure 18: Edenville left embankment breach at 6:00 p.m. on Tuesday, May 19, 2020
Figure 19: Edenville left embankment breach at 6:24 p.m. on Tuesday, May 19, 2020

Independent Forensic Team – Interim Report Failure of Edenville and Sanford Dams
September 2021 19
Figure 20: Edenville left embankment breach at 7:13 p.m. on Tuesday, May 19, 2020
Figure 21: Edenville left embankment breach at 9:04 p.m. on Tuesday, May 19, 2020
3.3 Sanford Dam Failure The outflow from the Edenville Dam failure flowed into Sanford Lake. At about 7:19 p.m. on Tuesday, May 19, the lake level at Sanford Dam reached El. 634.8, the crest of the fuse plug spillway. Shortly after that time, the fuse plug spillway began to erode, increasing the discharge capacity at the dam. However, the combined capacity of the spillway gates and the eroding fuse plug spillway could not keep pace with the large inflow from the failure of Edenville Dam. At about 7:46 p.m., the lake level at Sanford Dam

Independent Forensic Team – Interim Report Failure of Edenville and Sanford Dams
September 2021 20
reached El. 636.8, the low spot on the embankment crest, and continued to rise. Shortly afterward, an overtopping failure of Sanford Dam occurred, and the failure flood from Edenville Dam plus the contents of Sanford Lake were released, inundating the areas downstream. A view of the failed Sanford Dam is shown in Figure 22.
Given the failure of Edenville Dam, the failure of Sanford Dam was not unexpected. As noted in the Boyce Hydro incident report, “It was always understood by the regulators and engineers involved that should a breach occur at Edenville, Sanford would necessarily fail.”
Figure 22: Sanford Dam failure, viewed from upstream (photo courtesy of EGLE)
4 Physical Mechanisms
4.1 Edenville Dam After consideration of a range of possible explanations for the physics of the failure of Edenville Dam on Tuesday, May 19, 2020, it is the IFT’s opinion that a static liquefaction (flow) instability failure of the downstream slope of the Edenville left embankment is the most plausible primary physical mechanism for the failure, which occurred over a 40- to 80-foot length of the embankment. The IFT believes that the high pool level on May 19, about 3 feet higher than the previous pool of record, contributed to the instability failure but did not overtop the Edenville embankments. Although there is uncertainty concerning the exact trigger or triggers that led to the static liquefaction failure, there are several phenomena that are plausible triggers, either individually or in some combination. After the downstream slope failure, the remnant upstream embankment section briefly held back the reservoir for about 10 to 20

Independent Forensic Team – Interim Report Failure of Edenville and Sanford Dams
September 2021 21
seconds before the remnant embankment began to give way and the stored reservoir water was released through the breach.
In the discussion below, the IFT describes its consideration of potential failure mechanisms and the reasons for the conclusion that a static liquefaction instability failure is the most plausible mechanism. In evaluating potential failure mechanisms, the IFT weighed information collected from videos and still photographs taken prior to and during the failure and from interviews with eyewitnesses. The IFT also considered data from previous subsurface investigations and analyses, and soil mapping, testing, and seepage and stability analyses performed by the IFT. Table 3 lists a number of physical attributes and observations identified in the investigation that needed to be considered in the evaluation of the failure mechanism. The confidence in the physical attributes and observations varied, as noted in the table. The highest confidence was assigned to direct videographic or photographic evidence, and the lowest confidence was assigned to eyewitness reports of a single eyewitness, which were not corroborated by other eyewitnesses or videographic or photographic evidence.
Table 3: Edenville Dam Failure Physical Attributes and Observations Physical Attribute or Observation Comments on Confidence
Less than 4 minutes, likely a matter of only seconds, before the failure, water was observed running down the face; no water exiting the face was observed before that time, though a lesser amount of seepage, which was not visually detectable from a distance, cannot be ruled out.
Strong confidence for water running down the face before failure. • The dam failure video clearly shows water running
down the face just before failure. • Eyewitnesses report that water exited the face just
before the failure. Reasonably strong confidence for lack of substantial flow of water exiting the face earlier. • The videographer reports that the observation of
water exiting the face was the reason that he started the phone video.
• A photo at 5:31 p.m., 4 minutes before failure, does not show water exiting the face. This photo at 5:31 p.m. is from a distance (from the Consumers Energy substation), so it may not show lesser amounts of seepage exiting the face.
Failure of the downstream section of the embankment occurred in about 10 seconds.
Strong confidence. • The dam failure video captures the failure of the
downstream section. The upstream embankment remnant failed, releasing the reservoir, about 10 to 20 seconds after the failure of the downstream section of the embankment.
Strong confidence. • The dam failure video captures the release of the
reservoir. During the failure, jets of water emanated from the failure mass.
Strong confidence. • The dam failure video clearly shows the jets of
water. Reservoir level was at an historic high at the time of the failure, about 3 feet higher than the previous pool of record.
Reasonably strong confidence. • At the time of the failure, the reservoir level was
estimated to be about 1 foot to 1.5 feet below the level of the unsettled embankment crest. This equates to a reservoir level of about Elevation (El.) 681 to El. 681.5 based on a nominal embankment crest of El. 682.5 to El. 683 from previous surveys.
• Available records indicate that the historic high-water level in the reservoir was El. 678.3, which occurred on April 5, 1929. This elevation is about

Independent Forensic Team – Interim Report Failure of Edenville and Sanford Dams
September 2021 22
Physical Attribute or Observation Comments on Confidence 2.5 feet above normal pool level and about 4 feet below the embankment crest.
• The available reservoir level records may be incomplete.
A section of the embankment crest in the failure location settled about 30 to 35 minutes before the embankment failed.
Reasonably strong confidence. • A photo (at distance) in mid-afternoon (2:52 p.m.)
shows a level crest. • Photos (at distance) at 5:03 p.m. and 5:20 p.m.
show a lowered section of the crest in the area of the ultimate failure.
• Eyewitnesses report that the depression in the crest occurred suddenly at about the time of the 5:03 p.m. photo; observation of the depression is the reason the eyewitnesses walked to the downstream side of the dam, where they arrived minutes before the failure.
During the failure, velocities of the failure mass (both total and horizontal) reached 5 meters per second (16.4 feet per second) and displacements (both total and horizontal) exceeded 25 meters (82 feet).
Reasonably strong confidence. • Based on American Society of Civil Engineers
(ASCE) team pixel-tracing analysis of the failure video. (ASCE 2021)
The embankment failure was confined to the embankment and did not extend into the foundation.
Reasonably strong confidence. • The mass seen moving in the dam failure video
clearly appears to be confined to the embankment, not extending into the foundation.
• In the ASCE pixel tracing, Point P5 at the toe of the embankment did not show movement.
Cracks occurred in the settled section of the crest before the failure.
Moderate confidence. • Photos from both upstream and downstream appear
to show a longitudinal crack, but the photos are from a distance.
• Some eyewitnesses report observing cracks, possibly including transverse cracks.
A circular flow of water in the lake (“whirlpool”) was suggested near the upstream face of the dam based on the movement of floating debris.
Moderately weak confidence. • This was reported by only one eyewitness but was
described in detail regarding the diameter and rotational rate of the flow.
• Other eyewitnesses did not report this observation, even when directly asked.
Water exiting the downstream face of the dam at about two-thirds height jetted out horizontally 10 or 20 feet.
Weak confidence. • This was reported by only one eyewitness, albeit the
most technically capable of the eyewitnesses. • Other eyewitnesses did not report this observation,
even when directly asked.
4.1.1 Failure Mechanisms Potential primary failure mechanisms considered for the failure of Edenville Dam were grouped into the following general categories:
• Embankment overtopping
• Internal erosion of the embankment or foundation
• Embankment instability
Independent Forensic Team – Interim Report Failure of Edenville and Sanford Dams
September 2021 23
Each potential mechanism is discussed below.
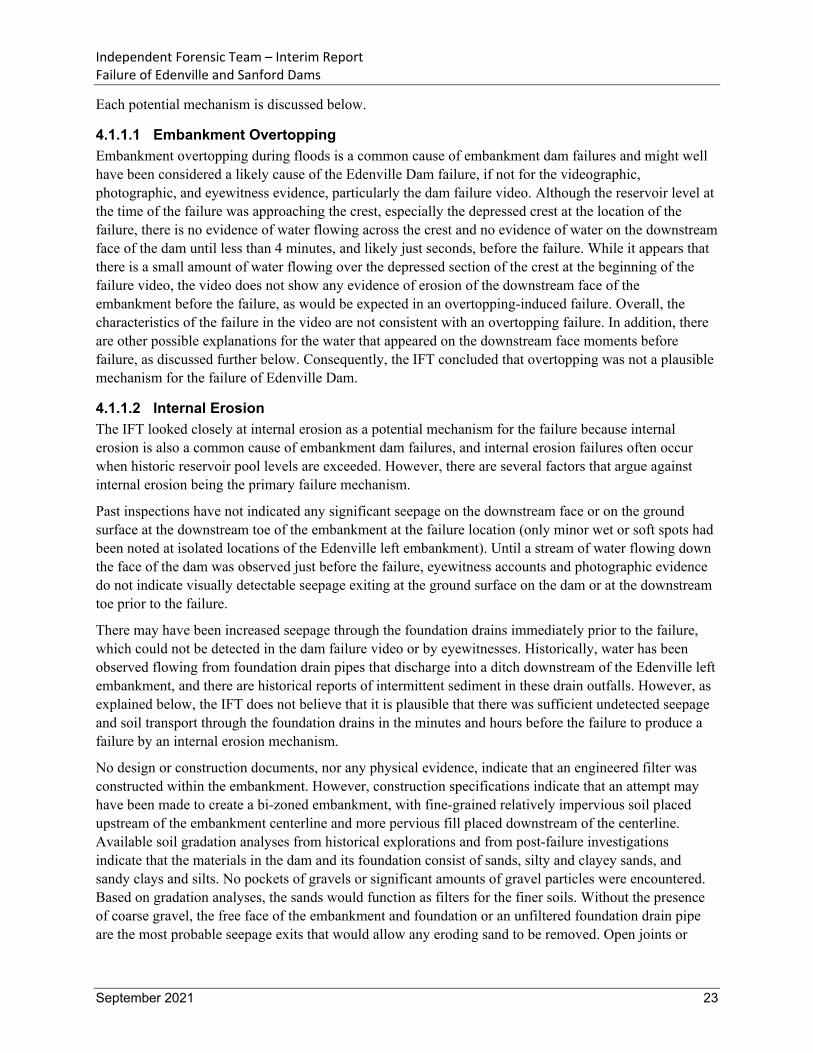
4.1.1.1 Embankment Overtopping Embankment overtopping during floods is a common cause of embankment dam failures and might well have been considered a likely cause of the Edenville Dam failure, if not for the videographic, photographic, and eyewitness evidence, particularly the dam failure video. Although the reservoir level at the time of the failure was approaching the crest, especially the depressed crest at the location of the failure, there is no evidence of water flowing across the crest and no evidence of water on the downstream face of the dam until less than 4 minutes, and likely just seconds, before the failure. While it appears that there is a small amount of water flowing over the depressed section of the crest at the beginning of the failure video, the video does not show any evidence of erosion of the downstream face of the embankment before the failure, as would be expected in an overtopping-induced failure. Overall, the characteristics of the failure in the video are not consistent with an overtopping failure. In addition, there are other possible explanations for the water that appeared on the downstream face moments before failure, as discussed further below. Consequently, the IFT concluded that overtopping was not a plausible mechanism for the failure of Edenville Dam.
4.1.1.2 Internal Erosion The IFT looked closely at internal erosion as a potential mechanism for the failure because internal erosion is also a common cause of embankment dam failures, and internal erosion failures often occur when historic reservoir pool levels are exceeded. However, there are several factors that argue against internal erosion being the primary failure mechanism.
Past inspections have not indicated any significant seepage on the downstream face or on the ground surface at the downstream toe of the embankment at the failure location (only minor wet or soft spots had been noted at isolated locations of the Edenville left embankment). Until a stream of water flowing down the face of the dam was observed just before the failure, eyewitness accounts and photographic evidence do not indicate visually detectable seepage exiting at the ground surface on the dam or at the downstream toe prior to the failure.
There may have been increased seepage through the foundation drains immediately prior to the failure, which could not be detected in the dam failure video or by eyewitnesses. Historically, water has been observed flowing from foundation drain pipes that discharge into a ditch downstream of the Edenville left embankment, and there are historical reports of intermittent sediment in these drain outfalls. However, as explained below, the IFT does not believe that it is plausible that there was sufficient undetected seepage and soil transport through the foundation drains in the minutes and hours before the failure to produce a failure by an internal erosion mechanism.
No design or construction documents, nor any physical evidence, indicate that an engineered filter was constructed within the embankment. However, construction specifications indicate that an attempt may have been made to create a bi-zoned embankment, with fine-grained relatively impervious soil placed upstream of the embankment centerline and more pervious fill placed downstream of the centerline. Available soil gradation analyses from historical explorations and from post-failure investigations indicate that the materials in the dam and its foundation consist of sands, silty and clayey sands, and sandy clays and silts. No pockets of gravels or significant amounts of gravel particles were encountered. Based on gradation analyses, the sands would function as filters for the finer soils. Without the presence of coarse gravel, the free face of the embankment and foundation or an unfiltered foundation drain pipe are the most probable seepage exits that would allow any eroding sand to be removed. Open joints or
Independent Forensic Team – Interim Report Failure of Edenville and Sanford Dams
September 2021 24
cracks in the foundation drain pipe would not allow a significant volume of material to be eroded rapidly. With no signs of significant seepage or eroding material from the dam face, the available information does not support the sudden breach being principally caused by internal erosion. Based on mapping of the remnant breach faces, there is some uncertainty as to whether the attempt at zoning described above occurred consistently along the embankment. Regardless of whether the embankment was bi-zoned or homogeneous, the conclusion would be the same: the lack of observed seepage or embankment distress prior to the sudden failure does not support internal erosion as the primary failure mechanism.
It is possible that animal burrows or deteriorating remnants of wooden trestles or railroad ties were present within the embankment. Such features could lead to localized internal erosion or collapse within the embankment, but not to a full internal erosion failure mode without breakout of seepage on the downstream slope or at the toe to initiate backward erosion piping. As noted above, significant seepage breaking out on the surface has not been reported historically for the Edenville left embankment.
The embankment is founded on a soil foundation consisting of a sand layer overlying clayey glacial till (hardpan) that is at least 20 to 40 feet thick. Top-of-rock is believed to be deep at the site. The shallow foundation sand layer is dense with varying amounts of silt and would have some erosion resistance under the estimated seepage gradients. Seepage through this layer would most likely daylight near the embankment toe, where eroding material would have been visible. There are no indications of other materials or other features in the foundation that would serve as likely pathways for internal erosion, particularly without the observation of seepage breakout near the toe.
Finally, the observed physical characteristics of the failure are not consistent with an internal erosion failure mode:
1. No seepage exiting the ground surface was detected; in fact, no water was detected on the downstream ground surface until just before failure.
2. No turbid water discharge was detected.
3. No evidence of a developing open pipe, sinkhole, or progressive sloughing that might indicate global backward erosion piping was observed.
4. The kinetics of the failure, in particular the global acceleration and velocity of the failure mass, are not consistent with historical observations of internal erosion failures.
In the IFT’s opinion, internal erosion may have contributed to the depression in the crest that was observed about 35 minutes before the failure, but it does not explain the primary physics of the failure.
4.1.1.3 Embankment Instability In the IFT’s opinion, the video of the failure appears to show a rapid instability failure of a significant portion of the downstream section of the dam, followed shortly after by a collapse of the upstream remnant of the embankment. Particularly striking characteristics of the instability failure are the apparent acceleration and velocity of the failure mass, which is indicative of a flow failure.
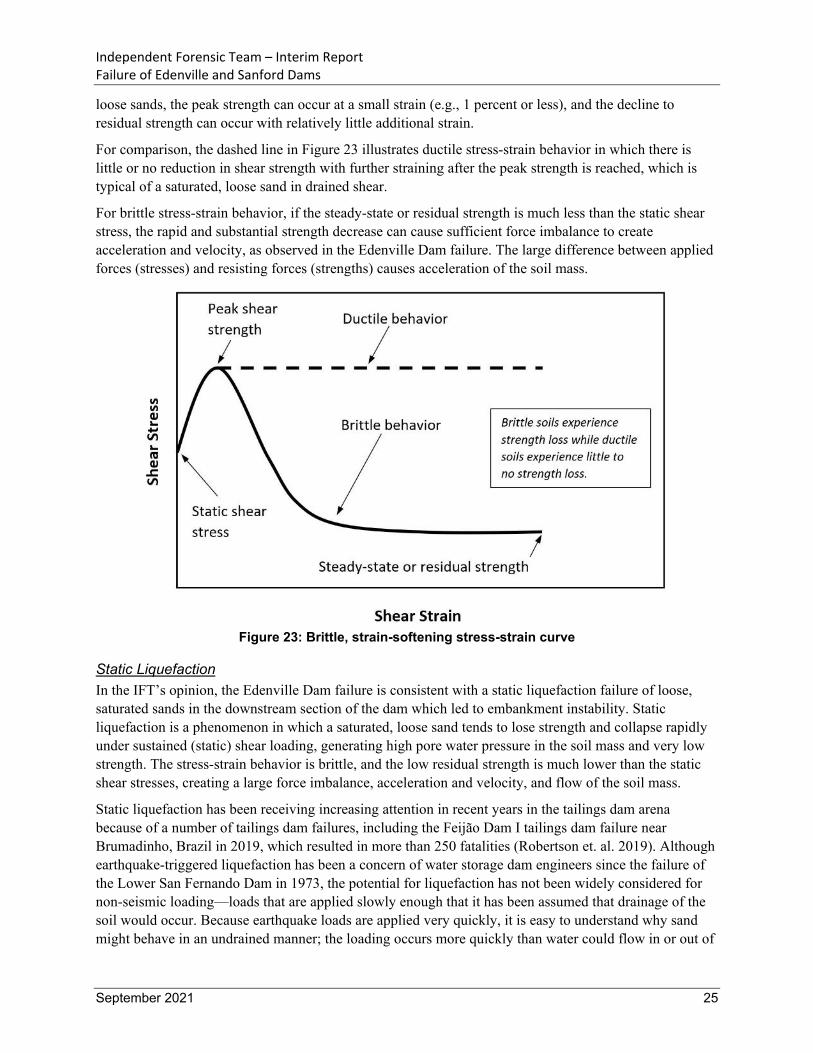
Such failures can only occur with soils that have a brittle, strain-softening stress-strain curve in which the mobilized strength drops substantially with relatively little strain. This behavior is illustrated by the solid line in Figure 23, which shows the stress-strain curve for a saturated, loose sand in undrained shear – shear without drainage of the pore water in the soil mass. As shown in Figure 23, initially the shear stress increases from an initial static shear stress as the sample is strained (deformed) until it reaches a peak value (peak strength), after which the shear strength drops quickly with further straining to a much lower strength (steady-state or residual strength), which is lower than the initial static shear stress. For saturated,
Independent Forensic Team – Interim Report Failure of Edenville and Sanford Dams
September 2021 25
loose sands, the peak strength can occur at a small strain (e.g., 1 percent or less), and the decline to residual strength can occur with relatively little additional strain.
For comparison, the dashed line in Figure 23 illustrates ductile stress-strain behavior in which there is little or no reduction in shear strength with further straining after the peak strength is reached, which is typical of a saturated, loose sand in drained shear.
For brittle stress-strain behavior, if the steady-state or residual strength is much less than the static shear stress, the rapid and substantial strength decrease can cause sufficient force imbalance to create acceleration and velocity, as observed in the Edenville Dam failure. The large difference between applied forces (stresses) and resisting forces (strengths) causes acceleration of the soil mass.
Figure 23: Brittle, strain-softening stress-strain curve
Static Liquefaction In the IFT’s opinion, the Edenville Dam failure is consistent with a static liquefaction failure of loose, saturated sands in the downstream section of the dam which led to embankment instability. Static liquefaction is a phenomenon in which a saturated, loose sand tends to lose strength and collapse rapidly under sustained (static) shear loading, generating high pore water pressure in the soil mass and very low strength. The stress-strain behavior is brittle, and the low residual strength is much lower than the static shear stresses, creating a large force imbalance, acceleration and velocity, and flow of the soil mass.
Static liquefaction has been receiving increasing attention in recent years in the tailings dam arena because of a number of tailings dam failures, including the Feijão Dam I tailings dam failure near Brumadinho, Brazil in 2019, which resulted in more than 250 fatalities (Robertson et. al. 2019). Although earthquake-triggered liquefaction has been a concern of water storage dam engineers since the failure of the Lower San Fernando Dam in 1973, the potential for liquefaction has not been widely considered for non-seismic loading—loads that are applied slowly enough that it has been assumed that drainage of the soil would occur. Because earthquake loads are applied very quickly, it is easy to understand why sand might behave in an undrained manner; the loading occurs more quickly than water could flow in or out of

Independent Forensic Team – Interim Report Failure of Edenville and Sanford Dams
September 2021 26
the voids in the soil, even for relatively high-permeability sands. However, it has generally been assumed by geotechnical engineers that under most other loading conditions, water will be able to flow in and out of sands and they will behave drained during shear, with the strength defined by the drained shear strength, regardless of the density of the sand. Further, reported static liquefaction failures of water storage dams have been rare, but not unprecedented.
Research, principally by tailings dam practitioners, has shown that collapse behavior in saturated, loose sands can be triggered at stress states below those at the drained friction failure envelope, which is normally taken to indicate the available strength of the soil if the loading is not seismic. Figure 24 shows a stress path for the undrained triaxial shear test of the saturated, loose sand in Figure 23. The stress path is a plot of the relationship between the applied shear stress and confining stress (portrayed in the figure as mean effective stress) as the soil is sheared. The stress path starts at the point labeled “Static shear stress” in Figure 24, which corresponds to the point of zero shear strain in Figure 23, indicating the initial undeformed state of the soil. As the soil is strained (deformed), the stress path moves to the point labeled “Peak strength (collapse point)” in Figure 24, which corresponds to the point labeled “Peak shear strength” in Figure 23. Finally, the stress path continues to the point labeled “Steady-state or residual strength” in Figure 24, which corresponds to the point labeled the same in Figure 23. Stress path movement toward the left indicates development of pore water pressure in the soil. From Figure 24, it is seen that some pore water pressure develops as the shear stress increases to the peak strength, but this is followed by a large increase in pore water pressure, reducing the strength to the steady-state or residual strength.
Figure 24: Illustration of initiation of collapse behavior at stress state below the drained friction
failure envelope

Independent Forensic Team – Interim Report Failure of Edenville and Sanford Dams
September 2021 27
If the test illustrated in Figure 24 is conducted using “load control,” that is with the load producing the shear stress applied with dead weights, a collapse behavior is observed. As the weights are slowly added, there is a small amount of strain and some increase in pore water pressure as the shear stress increases to the peak strength. After the peak strength is reached, the pore water pressure and the strain both increase rapidly and the sample effectively collapses because the pore water pressure dramatically decreases the strength. The same behavior occurs in the field in a flow slide failure of saturated, loose sand. Because of this observed behavior, the line of undrained peak strengths shown on Figure 24 has been called the collapse line or instability line. Because the collapse or instability line is significantly below the drained friction failure envelope, as shown in Figure 24, the shear stress required to reach the collapse or instability line is less than that at the drained friction failure envelope. Hence, in a stability analysis, the factor of safety against reaching the instability line would be less than that against reaching the drained friction failure envelope.
Research has also shown that the instability line, where collapse is triggered, can be reached by (1) an increase in pore water pressure (decrease in effective stress), (2) an increase in shear stress, or (3) a combination of the two, as shown in Figure 25. Path 1, the orange path in Figure 25, shows that an increase in pore water pressure with no change in the applied static shear stress can move the stress path to the left until it intersects the collapse or instability line, at which point pore water pressure increases rapidly, strength decreases dramatically, and collapse/instability results. This behavior is significant, because it indicates that a rise in phreatic surface in an embankment that includes saturated, loose sands can trigger the collapse behavior, without any significant changes in shear stress and at a stress state below the drained friction failure envelope.
Figure 25: Conceptual stress paths to reach the instability line

Independent Forensic Team – Interim Report Failure of Edenville and Sanford Dams
September 2021 28
Evidence for Static Liquefaction at Edenville Dam There is substantial evidence that the Edenville left embankment may have contained saturated, low-density (loose) sands that were potentially subject to static liquefaction. Numerous borings in the Edenville Dam embankments, including the Edenville left embankment, encountered uniform fine sands with low blow counts, indicating they were loose. Loose, uniform fine sands were found in the lower part of the downstream section of the Edenville left embankment remnant at the left side of the breach. Although information concerning the original construction methods for the embankments is contradictory, it is reasonable to conclude that some of the embankment materials were dumped with little or no compaction.
Laboratory tests on specimens from a bulk uniform fine sand sample collected from the left breach face show dramatic brittle, strain-softening collapse behavior when the sand is loose. Figure 26 shows the results of undrained triaxial strength tests on three specimens of the sand compacted to 30 percent relative density and consolidated to different confining pressures. The left side of the figure shows stress-strain curves for the three specimens. All three curves show brittle stress-strain behavior like that shown in Figure 23. The right side of Figure 26 shows stress paths for the three specimens. All three specimens show peak undrained shear strengths at stress states well below the drained frictional envelope of 31 degrees, followed by large increases in pore water pressure and dramatic decreases in strength, similar to the behavior illustrated in Figure 24. Consequently, these test results show that a sand sample taken from the left embankment, when it is loose, exhibits the stress-strain characteristics necessary for static liquefaction.
Figure 26: Laboratory undrained triaxial test results for Edenville Dam uniform fine sand sample at
30 percent relative density8
The IFT also completed a kinetic analysis of a possible static liquefaction failure scenario for the Edenville left embankment, using the simplified procedure originally proposed by Davis et al. (1988). This procedure consists of calculating accelerations, velocities, and deformations for a potential failure mass within the embankment. A travel path for the center of gravity of the mass is assumed, and the initial acceleration is based on the force imbalance created by the reduction of strength to the steady-state
8 ѱ′ is the angle of the failure envelope in the q-p′ plot and ɸ′ is corresponding effective stress friction angle.
Independent Forensic Team – Interim Report Failure of Edenville and Sanford Dams
September 2021 29
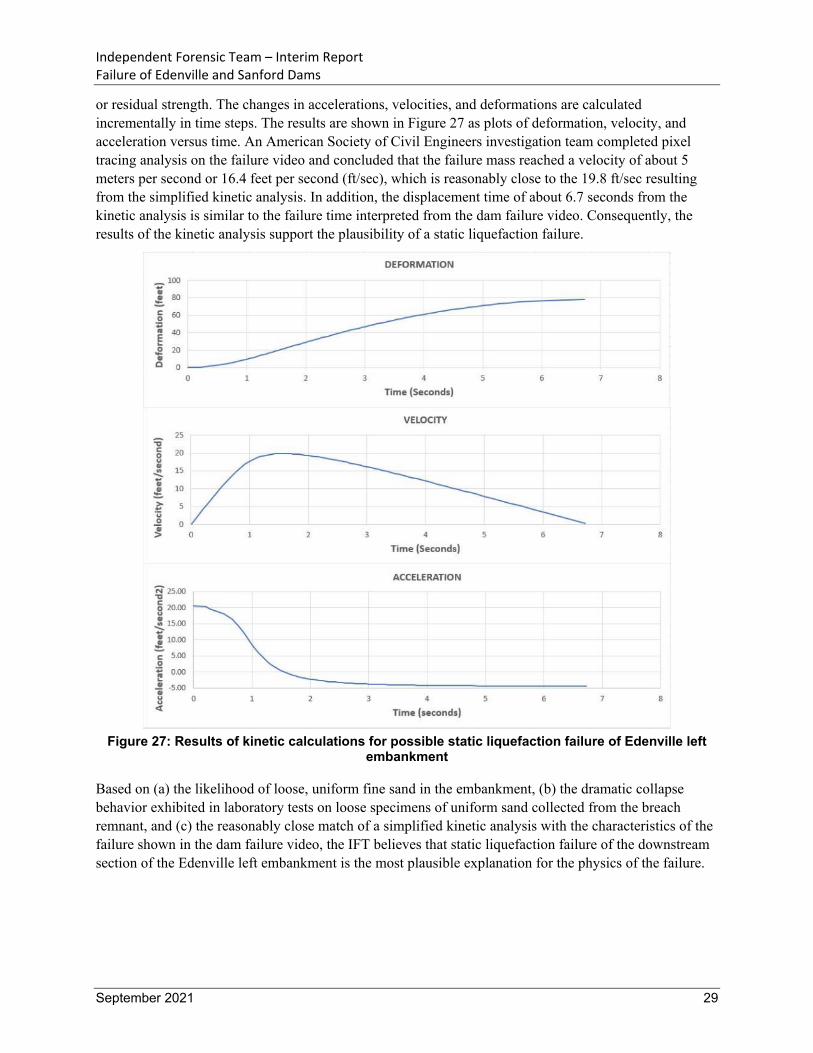
or residual strength. The changes in accelerations, velocities, and deformations are calculated incrementally in time steps. The results are shown in Figure 27 as plots of deformation, velocity, and acceleration versus time. An American Society of Civil Engineers investigation team completed pixel tracing analysis on the failure video and concluded that the failure mass reached a velocity of about 5 meters per second or 16.4 feet per second (ft/sec), which is reasonably close to the 19.8 ft/sec resulting from the simplified kinetic analysis. In addition, the displacement time of about 6.7 seconds from the kinetic analysis is similar to the failure time interpreted from the dam failure video. Consequently, the results of the kinetic analysis support the plausibility of a static liquefaction failure.
Figure 27: Results of kinetic calculations for possible static liquefaction failure of Edenville left
embankment
Based on (a) the likelihood of loose, uniform fine sand in the embankment, (b) the dramatic collapse behavior exhibited in laboratory tests on loose specimens of uniform sand collected from the breach remnant, and (c) the reasonably close match of a simplified kinetic analysis with the characteristics of the failure shown in the dam failure video, the IFT believes that static liquefaction failure of the downstream section of the Edenville left embankment is the most plausible explanation for the physics of the failure.

Independent Forensic Team – Interim Report Failure of Edenville and Sanford Dams
September 2021 30
Trigger for Static Liquefaction It is less clear exactly what triggered the static liquefaction, but there are several plausible triggers. As noted above, static liquefaction can be triggered by increases in pore water pressures, increases in shear stresses, or a combination of the two.
As the reservoir level rose on Monday and Tuesday, May 18 and May 19, 2020, there were several possible sources of increased pore water pressure in sand located in the downstream section of the dam. The upper sand foundation layer provides a source for water to flow beneath the embankment and elevate the phreatic surface in the downstream section, even if the upstream section of the dam was composed of lower permeability fill. The historically high reservoir level could have led to an historically high phreatic surface from this source.
The reservoir level at the time of failure is believed to have been about 3 feet higher than the previous pool of record. This represents a hydraulic load on the embankment about 10 percent higher than had been previously experienced, which could have produced historically high shear stresses. The higher reservoir level also exposed a 3-foot vertical section of the upstream embankment face to the reservoir for the first time—a first filling for that portion of the embankment. Within this 3-foot horizon, there could have been pervious soils that contributed to elevated phreatic levels in the embankment. There is also some evidence that cracks developed in the embankment in conjunction with the crest subsidence that occurred about 35 minutes before failure. Flow through these cracks, if they developed, could also have contributed to elevated phreatic levels.
Consideration of Conventional Instability The IFT considered the possibility that the instability was caused by a rise in phreatic surface, decreasing effective stresses and drained strengths in the sand, and lowering the factor of safety below 1.0. However, a failure of this type is not consistent with the kinetics of the observed behavior. Drained triaxial strength tests were completed on specimens from the bulk sample used for the undrained strength tests presented in Figure 26. These specimens were also prepared at 30 percent relative density and consolidated to three different confining stresses. The results are shown in Figure 28. The stress-strain curves, on the left side of Figure 28, do not exhibit brittle, strain-softening behavior, but rather show ductile behavior, with little or no decrease in strength from the peak strength. Without brittle, strain-softening behavior, it is not possible to create the force imbalance needed to generate the observed accelerations and velocities during the failure. There is no evidence of any other embankment materials that would have brittle, strain-softening stress-strain behavior.
With ductile stress-strain behavior, it would be expected that the instability failure would be progressive—a rise in pore water pressure dropping the factor of safety below 1.0 and causing enough deformation to restore stability, followed by further rise in pore water pressure causing further slumping, with this process continuing and ultimately leading to enough deformation to cause failure through overtopping or internal erosion. The observed characteristics of the failure are not consistent with this mechanism, and the IFT judged this mechanism to be implausible as the primary cause of the failure, although it may have contributed to the observed crest subsidence noted above and may have been a contributing trigger for static liquefaction.

Independent Forensic Team – Interim Report Failure of Edenville and Sanford Dams
September 2021 31
Figure 28: Laboratory drained triaxial test results for Edenville Dam uniform fine sand sample at
30 percent relative density
4.1.2 Cause of Crest Subsidence The specific reasons for the crest subsidence are not entirely clear, although several plausible possibilities exist. The subsidence could have been caused by the collapse of previously unwetted loose sand within the upper part of the embankment or collapse of voids in the upper part of the embankment from animal burrows or rotted wooden members (trestles or railroad ties). It is also possible that there were one or more voids primarily within the lower part of the embankment from a prior history of internal erosion into the underdrains, possibly in a relatively vertical orientation, and these voids may have collapsed. Another possibility is that the subsidence was the result of an initial instability of the embankment prior to the overall instability failure. The subsidence could have contributed to the development of cracks, allowing water into the embankment, and may also have resulted in some shock stresses within the embankment, which contributed to the triggering of liquefaction.
4.1.3 Reasons for Location of the Failure One question that arose during the IFT’s investigation is: Why was the failure limited to a 40- to 80-foot length of the embankment? One possible explanation is that the failure section included the loosest sands within the embankment. Another possible, and perhaps more plausible, explanation is that the clay tile underdrains beneath the embankment were missing in the failure section. A 2012 investigation of the drains did not identify drains beneath the failure location, as shown in Figure 29, suggesting that the drains at that location either were never installed or subsequently had become buried and ineffective. Since the remainder of the drains along the Edenville left embankment have been observed to consistently flow, they appear to provide some degree of drainage for the embankment. The lack of drains in the failure location could have resulted in a higher phreatic surface at that location than elsewhere along the embankment.
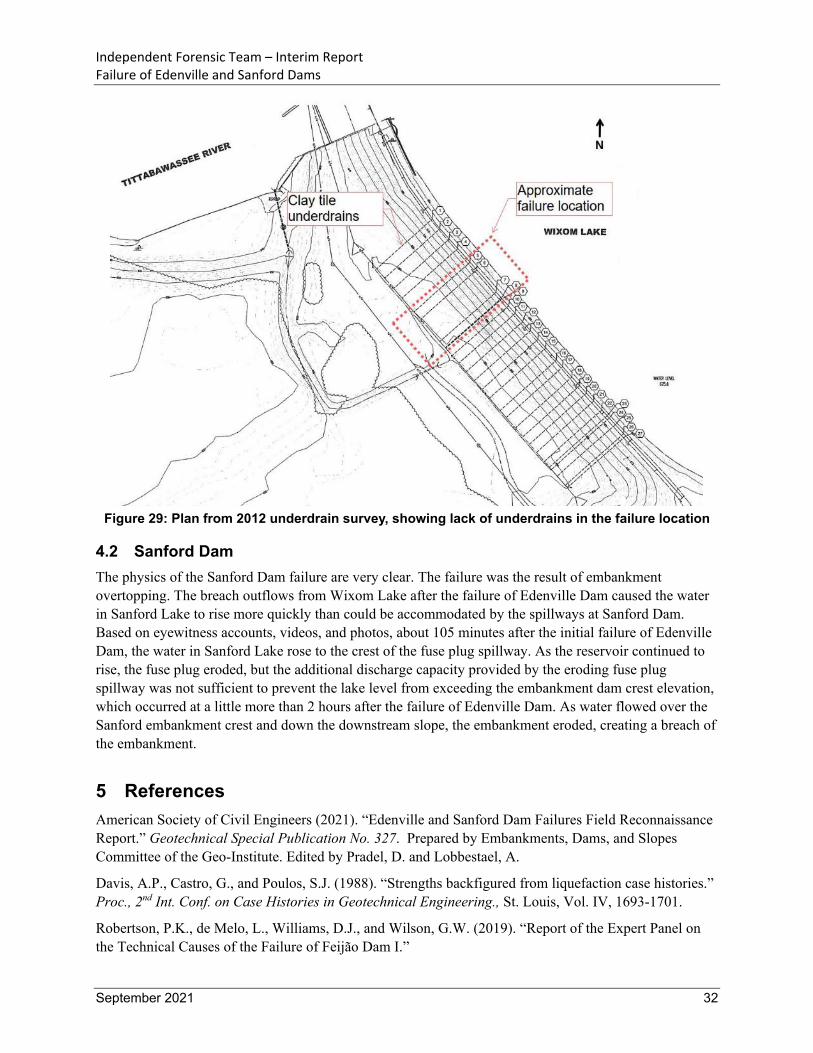
Independent Forensic Team – Interim Report Failure of Edenville and Sanford Dams
September 2021 32
Figure 29: Plan from 2012 underdrain survey, showing lack of underdrains in the failure location
4.2 Sanford Dam The physics of the Sanford Dam failure are very clear. The failure was the result of embankment overtopping. The breach outflows from Wixom Lake after the failure of Edenville Dam caused the water in Sanford Lake to rise more quickly than could be accommodated by the spillways at Sanford Dam. Based on eyewitness accounts, videos, and photos, about 105 minutes after the initial failure of Edenville Dam, the water in Sanford Lake rose to the crest of the fuse plug spillway. As the reservoir continued to rise, the fuse plug eroded, but the additional discharge capacity provided by the eroding fuse plug spillway was not sufficient to prevent the lake level from exceeding the embankment dam crest elevation, which occurred at a little more than 2 hours after the failure of Edenville Dam. As water flowed over the Sanford embankment crest and down the downstream slope, the embankment eroded, creating a breach of the embankment.
5 References American Society of Civil Engineers (2021). “Edenville and Sanford Dam Failures Field Reconnaissance Report.” Geotechnical Special Publication No. 327. Prepared by Embankments, Dams, and Slopes Committee of the Geo-Institute. Edited by Pradel, D. and Lobbestael, A.
Davis, A.P., Castro, G., and Poulos, S.J. (1988). “Strengths backfigured from liquefaction case histories.” Proc., 2nd Int. Conf. on Case Histories in Geotechnical Engineering., St. Louis, Vol. IV, 1693-1701.
Robertson, P.K., de Melo, L., Williams, D.J., and Wilson, G.W. (2019). “Report of the Expert Panel on the Technical Causes of the Failure of Feijão Dam I.”