investigation of a cu-20 mass% nb in situ composite - dierk raabe
TRANSCRIPT

D. Raabe e1 al.: Investigation of it Cu-20 mass% Nb in situ Composite. IJa rt I
Dierk Raabe, Frank Heringhaus '), Ude HanKen and Gunter Gottstein (imlillil for Melaflkrmde rmd M ewllplr.l'sik. KopemikllSJtr. 14, Rheilli.~ch- lVestfiilisclu! Tl'dmisdle Hocilsd"de Aachell. D-52056 Aachl'll. Gf'rman)'J
Investigation of a Cu-20 mass% Nb in situ Composite Part I: Fabrication, Microstructure and Mechanical Properties
Fiber reinfo rced in si tu metal matrix composites (MMCs) consisting of Cu :md 20 mass"!.. Nb were fabrica ted by liuge strain cold ro ll ing and wire drawing of a cast ingo!. The microstructural evolution of the composites was invcstigat,,"<1 by me:ms of scanning and transmission electron microscopy. The mechanical properties of the MM Cs were discussed on the basis o fthc microstructu ra l changes during deform:lI ion . The results substantiate that the vol ume densi ty of in ternal bou ndaries and the fila ment spacing have considerable innuence on the strength of Cu ·20 mass% Nb. The evolution of the strength during defo rmatio n was simula ted by appl ica tion of analytical approHchcs which incorporate ex perimental data. The results revea l a very good corresponde nce to the behavior observed. On the basis o f the curren t findings potentia l industrial applications a rc d iscussed .
Unlersuehung eines Cu-20 Masse--e;. Nb in si tu-Verbundwerkslotfes Teil I: lierstellung, Gemge und mechanische £ igenschaft en
Fa serverstiirkte in si tu Metall matrix-VerbundwerkstolTe (MM Cs) bestehend aus Cu und 20 Ma sse-'}';, Nb wurden d urch st:Jrkc Walz- sowie Drahtverformung aus einem Gussblock hergestellt. Die Mikrostrukturentwicklung des VerbundwerkstolTes wurde millels Raster- und T ransm issionselek tronenmi kroskopie untersucht. Die Diskussion der mechanischen Eigenschaften der M MCs erfo lgte auf der G rund lage der beobachtcten Gefiigeanderungen. Die Ergebn isse legen nahe. daB d ie Dichte der inneren Grenzflache n und die Filamentabstiinde einen bctriichtl ichen Einflua auf die Festigkeit ha ben. Unter Verwendung anaIyt ischer An !>ii tze wurde die Entwicklung der Festigkeit wiihrend der Verformung si mulier\. Die Ergebnisse weisen cine se hr gu te Obereinstimmung mit dcm beobachteten Wcrkstoffverhal ten auf. Auf der Hasis der gegenwiirt igcn Resul tate werden potentielle industrie lle Anwendungen erorte r\.
1 Introduction
C u and Nb have negligible mutual so lubili ty in the so lid state (I. 2]. Hence. fiber reinforct."<I in situ processed metal
') Now with: N:ttioml l High Magnetic Field L:lOOratory. Tallahassee. Florida 32306. USA
Z. Met:l ll kd. 86 ( 1995) 6 (t; Carl Hanser Verlag, Munchen
matrix composites ( MM Cs) can be man ufactured by large degrees of deformation, e.g. by wire d ra wing or cold ro ll ing of a cast ingot. Heavily deformed Cu- Nb M MCs reve"l it
very high strength and good ekct rica l conductivity. Both the mechanical propert ies and the electrical conductivity o f C u Nb considerably exceed those of competit ive alloys like Cu lJe, C u- Ni. C u- i- Mn, Cu 1':1 o r Cu- C r ( Fig. I). Decreasi ng the Nb content leads to " loss of st rength and increasing the Nb content leads to the degradation of ductil ity and electrical cond uctivity ( Fig. I). Thus. an alloy contai ning 20 ma ss% Nb appears to combine opt imum clectric:tl and mechanical properties [3 to 8]. Cu- Nb composi tcs ha ve been under in tensive investigatio n in the plisl ( I to 16J mainly for two rellsons: i. From a scienti fic point o f view Cu-20 mass% Nb is a
very challenging materi:l!' si nce its tensile strength after deformation is very high. in particular much greater than expected from the ru le of mixtu res (3 10 9J ( Fig. 2). Severa l models ha ve bt.-en proposed to explain the strengt h observed . The barrier model by Spitzig et al. (1 to 9. II) attributes the strength to the difficulty of propaga ting plastic flow through the f,,'C-occ interfaces (fcc "" face centered cubic. bee "" bod y cen tered cubic). Funkenbusch and Courtney interpret [10] the strength in terms of geometrically necessary d islocations owing 10
Ihe incompatibi li ty o f plastic deformation of the bec and fcc phase. In fact, both models succeed in describ ing the o bserved increase of strength assuming reasonable fitti ng pa rameters_ In a recen t a ppro:lch. Raabe and Hangen
'," ',- ,
• 1#15Cr
:: , t8: CII'!5NIJ
" .. • CII'!5 Ta ~ ,
~ • Cu-20NIJ
J ' ,000 [. Cu.5 Nb
1,100 \1 , o Cu.Be-Ni
• 1.'00
'" 1 ,,,., ,-• 000 ", • " .. -. .I 000 C • , .~ C , 000
'" " " .. " " " " Inlemaliol1jll Annealed CII Standard, tACS [%]
Fig. 1. Ult imate tensile strength \'erslIs in ternational annealed Cu standard. lACS. of \'arious Cu ba~d alloys.
405

D. Raabe et al. : Investigation of a Cu-20 mass% Nb in situ Composite. Part I
"00 , , , -
lOCO
"'" .'" . " c .. -20"l",Ng
'''''' '" os e .. ... 0 ' 0 62,.,.-.
''''' , , ::: ,200 -• • • ,an -~ • "'" , - eo" • .1-- -- , • • , 5 , ,
o , • , , 10 12 ORAW RA T!(). ~ " n IAo/A )
Fig. 2. Experimentally detel;ted ultimate tensile strengths of pure Cu. pure Nb and Cu-20 mass% Nb [121.
[13.14) have suggested a physical model which accoun!s for the observed dislocat ion structures and fo r the crystallogr<lphic tex tures of both phases without employment of fitting parameters.
11 . From a technical and commercii, I point of view the combin:uion of high strength and good electrical conduct ivity makes Cu- Nb based M MCs hig hly potential ca ndidate mated .. ls ror the product ion or mechanicilily stressed elcctrical devices such as ,Ipplication in longpu lse high-field resistive magncts [IS. 16].
Whereas the microst ructu re ofC u-20 mass% Nb has been subject to various studies in the past . its rigorous correlation l,I,'ith the mechanical behavior as well as corresponding simulat ions which are based on en tirely physical rat her thun on semi-empirical models ha\'e not yet been submil1ed. Furthennore. recent experimental fi ndi ngs such as the occurrence of structurally less ordered. i.e. glassy a reHS in the Nb fi la ment s [17] as wel1 as the impact of texture on strength have not yet been discussed at all.
2 Fabrication of Cu- Nb in situ Composites
The Cu- Nb system reveals negligible mutual solubili ty in the solid state [I. 2] ( Fig. 3). The strong difference of the melt ing points (Tc" = 1356 K. TNb ,.. 2740 K) indicates that in the as-cast ingots a dendri tic grain structure is obtaincd. The morphology of the grains is domina ntly predetermi nl-d by the mel ting. casting and cooling conditions. By imposing large degret.'S of plastic deformation the initial dendrites rorm into elongated filamen ts f3 to 13]. Cu- Nb MM Cs reveal ,I considerable dependence or the extent :lrld bch:tvior of their coexisting phases on compositional deviations. Interst itial impu rities like O. N. S Hnd C a rc of major importance ror deviations from the equilibrium phase diagram [2] . The nearly horizontal shape of the liquidus curve suggests a nat course of the Gibbs rree energy curve over a wide compositional regime [ II. Accordingly. onc has to take
406
in to account the occu rrence of a miscibility gap when interstitial impu rities are present. Among these, 0 is supposed to have the strongest imp:lct [2].
For the product ion or caSI Cu-20 mass% Nb ingots the med ium rrequency induction melting technique was applied [18 to 201. For this purpose an induction frequency or 10 kHz_ a maximum coil voltage or 250 V and 11 maxi mum generator power of 3D kW were used [ 18_ 19]. The complete aggregate was capsuled to allow fo r application of vacuum or inert gas atmosphere. Up 10 about 2125 K the tem perature was measured pyrometrically. For cleaning the furnace chamber prior to melt ing or the composite. an initial vacuum or 10 ~ mbar was produced. Subsequently. the fu rnace was fi lled with argon and ev,lcullted again. The init ial e u melt was then prepared under a vacuum of 1.3 x 10 .I rn bar. During melti ng of the e u the Nb remained solid . Arter reaching the melting point of Cu the rurnace chamber was filled wi th argon up to a pressure of 0.8 bar. Accordi ng to the Cu- Nb equilibrium phase diagram (I] a melt ing temperatu re of at least 2000 K is recommended for Cu-20 mass% Nb (Fig. 3a). However. wi th increasing impuri ty con tent a melting lemperature of at least 2075 K to 2125 K appears necessa ry (Fig. 3b) [2]. Si nce the exact con tent of interstitial foreign atoms in the Nb was not known_ the melting tempcr:llure was raised up to about 2125 K to
• - • • • • - -I 246') ' C ""I
-I " 0" :1 :... !
~ j - ; !l M+(1~, . l E , • ., f-
lflll4 . .'17 " Cl~" ;1 ,- f 1080 " ., _ J .. ~.; .... [U, .. ,
1 • .. " " .. • " ., " "
a) c .. weight % I'Ih
246S ' C.
M,. Cl"."
I 67S"C
b) weight %
Fig. Ja and b. PhaS<' diagrdms ofCu and Nb. a) "urc constituents [II. bi impure constituents PI.
z. Meta llkd. 86 (1995) 6

D. Raabe et a1.: Investigation of a Cu-20 mass% Nb in situ Composite, Par t I
assure the entire dissolution of the Nb. Insufficient melting temperatures allowed for the survival of sma ll Nb crysta ls which were subsequently found within the fracture surfaces of broken wires (Fig. 4). It can be assumed that they are the main source for material failure during wire drawing. The n,tixing of the melt was achieved due to convection currents produced by the elect romagnetic stirring effect. Subsequently, ingots of 18 mm diameter were cast under an argon atmosphere at a pressure of 0.8 bar. For the cast a crucible and a mould of high purity graphite were used. Since Cu based alloys arc commonly not very suitable for intricate sha pe forming. the mould had to be preheated to nearly 900 K in order to improve flow cha racteristics. Since eu and Nb reveal almost equal densities ((leu == 8890 kg/mJ. QNb == 8580 kg/mJ) gravitat io nal segregation does thus not occu r.
From the as-cast ingots wire drawn and cold rolled specimens were manufactured. The wires were processed by rota ry swaging and subsequent drawing through hard metal drawing bench dies without intermediate annealing. The final diameter of the wires was 0.12 mm which represents a loga rithmic deformation or true slrain of '/ == 10 (c == 99.995 %). In the composite wires. minimum fiber spacing of about 50 nm were found after '/ == 10. Additionally. as-cast Cu-20 mass% Nb samples were cold rolled to a final thickness of 0.06 mm, which corresponds to a true strain of '/ == 5.2 (E = 99.4 %). In case that Cu based composites arc used for the production of electrical coils the stability of the microstructure against heating had to be investigated. For this purpose various heat treatments were carried out. some of them directly during observation in the TEM.
3 Crystallographic Textures 3. [ Experimental
For texture investigations. wire drawn and cold rolled specimcns were prepared from various deformation degrees [[8. 20 to 231. Frrom the incomplete X-ray pole figures [24J 1" 1}. 1200}. 1220). {J II} (Cu) und I " O}. 1200}. 1" 2) (Nb) the orientation distribution functions (ODFs) were
.) '" b,
~1 ... :.V .. /1
-' 1 Mo>. 2.05
r.~~.''''
,. ". Fig. 5a to c. Texture of the ell phase' in the wire drawn MMe. electron diffraction . a) Undcformed material. b) Increasing deformation (e = 98.7 %, '1 = 4.3). c) Heavy deformation Ie = 99.98 %, 1/ = 8.6).
Z. Met<lllkd . 86 (1995) 6
Fig. 4a and b. Sma[[ Nb crystals found in the cross-sections of broken wires.
computed using the Fourier type series expansion method (lm~' = 22) [25J. The O DFs were approx imated by Ga ussian model functions [26] for error corrections which stem from the absence of the odd-order Fourier coefficients. For the examination of the microtexture specimens were prepared for scanning electron microscopy (SEM). By usc of the elect ron back scattering diffraction (EBSD) technique. single grain orientation measurements were carried out [22. 23, 27). The results arc presented by use of inverse pole figures and ODFs.
3.2 Results
As is evident from Fig. 5 (electron diffract ion) and Fig. 6 (X- ray diffraction). quantitative micro- and macrotexture investigations both supply consistently reliable texture data. The undeformed material elucidates a random orientati on distribution of the Cu phase (Figs. Sa. 6a). With increasing deformation (E = 98.7 %. '1 = 4.3) a Cu tex ture is generated wh ich is described by a fiber axis between < [ [ I ) a nd < 100) (Figs. 5b, 6b). After heavy wire deformation (Il = 99.98 %, 1/ = 8.6) two texture fibers arc developed. The first one is characterized by a < II I ) and the second one by a < I 00 ) direction paraJlellO the drawing axis (Fig. 5c). The orientation density of the <I ll ) fiber exceeds that of the ( [00 ) fiber. Both the results achieved by electron diffraction ( Fig. 5) and by X-ray diffraction (Fig. 6) substantiate that the intensity of the ( 111 ) fiber increases, whilst that of the ( 100) fiber remains fairly stable on a [ow level during
.) '" b) 0)
Mu.: 1.5' ~I M ••• .... MD.: 14.:4
,_",3% " <-99,9610 ." \
,
(' ______ I
J~ I ,. ". Fig. 6a 10 c. Texture of Ihe eu phase in the wire drawn MMC, X-ray diffraction. a) Undefonned material. b) Increasing deformation (£ = 98.7 %, 'I = 4.3). c) Heavy deformation (£ ... 99.98 %. 1/ ... 8.6).
., '" b) 'J
.\1 . , .: 1. 14 4'\, .... "./ \ Mn.: 10.05
'~'i\, -1 ' " , -"'.96% II ,.".l~ ) \ , , I L: f;;1 ,
,. '. Fig. 7a 10 c. Texture of Nb phase in the wire drawn MMC, X-ray diffraction . a) Underorme<! material. b) Increasing deformation (e = 98.7 %. '1 = 4.3). c) Heavy deformation (E = 99.98 %. 'I = 8.6).
407

D. Raabe et al.: Investigation of a Cu-20 mass% Nb in situ Composi le. Pan I
111 11 lOll) (11 2) <111) <112> <100> tOO l )
<110> 11121 1111) <110' <1 10>
11101 <110>
In ease of cold ro lling. the texture devi:ues only in elise of Nb from that observed for pure samples. Especially the formation of a strong { I I I }( II 0) orient.Hion already after weak degrees o f roll ing deformat ion suggests local relaxation or the shear constraint in transverse direction . This behavior is attributed to the fact that the Cu phase has a low yield strength and allows hcnce for transverse shear of the Nb filaments [18].
I (9 )
1 "
"
" ,
0 ' ,,'
rp,.9{) •
fA, ·"5
o '''' c 96% .. 97% x 99% .. 99.5%
50 ' 90' ~.
I (gl '. 1 20 \
"
,
0 ' ""
0 88% 06% 97%
.'" 99.5'110
50' 90 ' ~.
4 Microstructure 4.1 Microscopy and Specimen
Preparat ion
Fig. 8. TCXlUre of Ihe Cll phase in thc cold rolled MM C. X-my dilfraClion.
Fig. 9. Tcxture of the Nb phase in thc cold rolled MMC. X-ray diffraction.
Whereas the substructure of the Cu phase has been subject to various stud· ies 17. 9. 17. 18]. the microslruclUre of the Nb filamen ts has not yet been stud-
heavy deformation. In the Nb phase of the wire drawn samples a ( 11 0 ) texlUre fiber parallel to the drawing direction is generated after strong defonntu ion (t > 98 %. '/ _ 4). For lower deformations (t < 98 %. ' / = 4) the Nb texture remains very weak ( Fig. 7a to c).
During roll ing, in the Cu phase o f the M MC a typical deformation texture is developed. which includes {l 12i ( lIl ) (Fig. 8). 11231 ( 634 ) and {l IO i( 1I 1). In the Nb ribbons a st rong a-fiber including 1001 }( ll0), {111 1( 110) a nd l lll l( 11 0 ) is formed already after low deg~s of deformation (Fig. 9).
3.3 Discussion
Fo r low and intermediate degrees of deformation the texlUre evolu tion of wire dnlwn and rolled Cu ilnd Nb in the MM C corresponds to the results observed for single-phase m'llerilll (18. 10 to 23). Since texture analysis sensitively reneets crystallographic mechanisms. for low and interme· di:lle str.Jins the current results do hence not 5ubst.lIltiate a striking difference between the deformation mechanisms which occur in si ngle· phase lind in MM C samples. An important fea ture of the results obtained for the wire drawing is. however. the retardation of the textu re evolution . Whereas the texture in si ngle-phase Cu and Nb wires becomeS already pronounced during wea k deformation. the wire texture o bserved in the MMC is developed on ly after heavy deformation . This retardation of texture c\'olution is attributed to the deformation state occurring during wire dmwing. As will be discussed subsequently, after t = 80 % ('/ ... 1.6) only very weak deformation of the Nb phase has taken place. [n this strain regime most of the MMC defonna tion has been accomplished by the Cu matrix. In this fi rst stage of drawing (up to r. =' 80 "Ia. '/ _ 1.6) merely the dendrite llrms which initially had a perpendicular orientat ion with respect to the dend rite axis. as well as the dendrite axis of the Nb phase itself. were rotated parallel to the drawing axis wi thout essentially dl.'Creasing their diameters.
408
ied o n a similar level PO]. In the currCllt study the morphology. topology as well as the avcrage spacing have
been quantitatively eXllmined for both phases by usc of scllnn ing (SEM) and transmission electron microscopy (TEM). However. special attention was d rawn to the stud· ies of the substructure of the Nb filaments. In case of wire drawn MM C samples the preparation of isolated Nb fi laments is highly intricate. '·Ienee. in order to receive quantitative data, the investigation of the Nb substructure was essentially carrioo out on rolled rather than on wire drawn samples.
To avoid mechanical loading and heating of the specimens a new TEM foil preparation techn ique was developed whleh especially allo wed for a thorough examination of the filamen ts. For providing fl at sections. rolled samples were lirst cleaned in alcohol using ultrasonic vibrations. Subsequently. a thin Cu layer of some microns was removed by etchi ng with a solution of 50 ml H, P0 4 and 50 ml HzO ( T ;>; 168 K. U = 20 V). This solution exclusively affects the Cu matrix. whereas HNO) etches both. Cu and Nb. After etching the specimen was cleaned agai n and then etched in a solution o f 50 ml alcohol. 50 ml HF and 20 to 30 mt li NO ) (T = ]00 K. U = 0 V). By usc of this solution the Nb filaments which out lasted the first etching were dissoluted. This successive procedure was repeated until perforation was nearl y achieved . The last etching was then carried out by carefully dissolving the residual Cu close to the hole. As a result the Nb fil aments were carefu lly ex tracted and isolatt.:d from the Cu matrix . To achieve equal thinning of both phases some s<un ples were treated conventionally, viz. by use of mechanical thinning. dimpling and subsequent ion bellm treatment.
The S<lInplcs were exami ned employin g a JEOL 2000FX operated at 200 kV using bright-field ( OF). dark-field ( DF) and selectoo area elcctron diffraction (SAD) techniques. Additionally. a JSM 6 100 SEM was llpplied . For directly o bserving the structuml regularity. high resolution transmission elect ron microscopy ( HRTEM ) was applied. Fo r this purpose a JEOL 2000 EX operated at 200 kV was used. The chemical a nlllysi s was locally detennined by usc of energy-dispersive X-ray spectrometry (EDX) .
Z. Metallkd. 86 ( 1995) 6

O. Raabe et at: InvestigatIon of a Cu-20 mass% Nb in situ Composite. Part I
Fig. lOa to c. SEM micrographs of as<ast Cu-20 maSS-/_ Nb. a) Cross-section. primary Nb dendrites in Cu matrix. b) Isolated Nb dendri tes. Cu matrix dissolved. c) Isola ted Nb dendrites. Cu matrix dissol\ed. Dendrites up 10 third generation can Ix recogmzed.
4.2 Microstructu re of the Wire Drawn Samples 4.2.1 Results
Figure lOa shows the microstructure of the as-cast Cu-20 mass% Nb composite. The primary Nb dendrites ( light) <Ire embedded in the Cu matrix (dark). After selectively di ssolving the Cu matrix by use of HNO" quantitative metallography was carried out on isolated dendri tes (Fig. JOb). From Fig. lOe it is evident that the dendrites branch out up to the third generation. Whereas the o rientations of the primary Nb dendriteS are randomly di stribu ted in the as-cast samples, the dendritic arms are commonly aligned parallel to the crystallographic (100) directions. The mean diameter of the secondary dendrites amounted to
Z. Metallkd. 86( 1995) 6
Fi~ . l la to c. SEM micrographs of Nb filaments. isolated by dissolving the Cu matrix al different degrees of wire deformillion . a) £ - 88.9 -t". b) e - 948 %, c)e _ 99.995 %.
(10 = 2.2 0.4 ~m. The initial dendrite diameter as well as the degree of subsequent cold deformation determine the mechanical prolX=rties (Hall-Petch type hardening contribution of internal phase boundaries) and the electromagnetic properties (inelastic scattering of conduction elect rons at internal phase boundaries) of the latter wire or sheet.
The evolution of the morphology of the Nb dendritcs in to elongated fibers is eviden t from Fig. Ila to c. After small amounts of defonnation (Fig. I la) (/: = 88.9 %. 'I = 2.2) thc Nb morphology appeared qui te inhomogeneous. Whereas some dendrite arms revea led considerable elongation, others appea red almost undeformed (Fig. Ila). Higher amounts of defonn:llion (t = 94.8 %. 'I = 3) resulted
409

O. Raabe et al.: Investigation of;l Cu-20 mass% Nb in situ Composite, Part I
Fig. 12. TEM micrograph of wire drawn Cu-20 mass% Nb. Some stmlll Nb filaments are indicated by arrows.
in fi laments of a more unifonn shupe (Fig. lib). The ultimate deformation (I; =99.995 %. '1 - 10) led to an average fiber diameter of about 130 nm and a filament thickness of 60 nm . The smallest filaments, however, revealed a thickness less than 50 nm (Fig. l lc). Some fibers consisted of;l thick p:lrt with elongated thin tails (Fig. Ilc). In the heavily deformed in situ MMC all filaments were aligned parallel to the wire axis [13,16. 17]. The random orientation distribution of the dend rite axes, as shown in the micrographs of Fig. II , is an artifact from the SEM sample preparation. In order to quantitatively examine also the minimum occurring filamen ts. TEM measurements were additionally employed (Fig. 12). Some of the smallest Nb fil aments are indica ted by a rrows.
The evolutio n of the deformat ion of the Nb filaments, as calculated from the metallographic data, is given as a function o f the wire deformat io n in Fig. 13. The curve basically shows a linear dependence, although not a one to one correspondence. According 10 Fig. 13. a wire deformation of ,/ "" 10 (I: = 99.995 %) corresponds to a Nb filament
410
deformation of '1 = 5.75 (I: = 99.68 %). The actual deformation of the Nb phase was thus generally lower than expecled for a ho mogeneous deformation of the wire. In the transverse section the folded mo rphology of the Nb filaments. which is referred to as curling, can be observed tlfter:t deformation of '1 = 7.6 (I: "" 99.95 %) ( F ig. 14). The wire hardness (200 g Vickers) is depicted as a function of deformat io n in Fig. IS. In the as-cast condition a value of about HV80 was measured . The hardness attained a
• .t , ,
! • , • , , , , , • §
, • E • 2 " ~ , D , Z
, • • • , • • " " Wire Deformation. '1 .. In (I\JA)
Fig. 13. nefomlation of the Nb filaments as a function of the wire deformation.
Fig. 14. Cross·seclion of a Cu·20 mass% Nb wire. ,,= 7.6 (,0; - 99.95). Ihe curling of the fitamen tS becomes apparent.
-".
~ '" > < , '" ~ • '" • <
,~
'" , • , , " Wire Oe1ormabon. 1"1 . In{AdA}
Fig. 15. Change or microhardness (Vickers. 2008) of Cu-20 mass% Nb with increasing wire defonnution.
Z. Metallkd. 86 (1995) 6

D. Raabe et al.: In \'estigalion of a Cu-20 mass"!. Nb in situ Composite. Part I
'''''' ""'" a t."'.lI'm
'000 a, ,._l.Sjin,
~ "'00 , '" " 0<00 w • ~ " w ""0 -0; , '000 w ~
w .00 ~ • , ;0 ~
" ' 00
'00
o • , , DRAW RATIO. ~ ' 1~IAo/A)
Fig. 16. Ultimate tensile strength versus draw ratio. two different ini tial dendrite diameters 129].
plateau value of HVI50 within the range 2!:> 'I !:> 6. At la rge deformation (" > 6) a strong increase of the hardness ..... as observed. extending to a maximum va lue of HV325 at 1/ "" 10 (£ = 99.995 %).
4.2.2 Discussion
The average diameter of the secondary dendrites was about 2 Jlm. Com pared with other product ion methods this val ue is quite small 15 to 10) and thus ensures a high tensile strength after heavy deformation (Fig. 16). The high cooling rate did nOI only lead to a small dendrite diameter but also to a higher density of dendrites of second and thi rd generati on.
The observed in homogeneous Nb morphology up to a defonnation degree of" ::t: 2 (£ "" 87 %)( Fig. IlnJ substantilues that very heavy deformation is necessary to produce a homogeneous size distribution of the Nb fi laments within the MMC( Fig. l ib, c). This is explai ned by several reasons. First ly. the strain dis tribution during ..... ire drawing is inhomogeneous across the wire diameter resulting in an inhomogeneous dendrite morphology. Secondly. small degrees of deformation cause the initially randomly oriented dendrites (18,22, 23) to rotate towards an orientation parallel to the wi re axis as indicated by the lower deformation of the Nb dendrites compared with the Cu matrix (Fig. I ]). This is also confirmed by the hardness plateau observed fo r ,,< 6 (c _ 99.8 %) (Fig. 15). After this alignment (II ::t: 6) a massive cross-sectional area reduction of the dendrites took place. These observations correspond to the finding that wi th regard to strength considerable devia tions from the predictions of the linear rule of mixt ures ( ROM ) were observed for high (" > 6) but not for low degrees of deformation. This is apparently the reason that for" ::::: 2 (I) _ 87 "!o) ( Fig. Ila) a mixtu re of highly defonned dendrites and almost unde· formed ones were found next to eaeh other. Moreover, the deformation is strongly influenced by the incom patibility of the deformation of the fcc Cu and the bee Nb phase. Since the distribution of the Nb is inhomogeneous. the more
Z. Metallkd. 86 (1995) 6
ductile Cu phase has to undergo a higher deformat ion locally. This again modifies the local stress distribution within the wire. i.e. neither the actual Cu deformation nor the actual Nb deforma tion equals the true wire defonnation .
After heavy deformation of the MM C all Nb filaments a re aligned parallel to the wire axis. As noted before, the r:lI1dom orientation of the fibers in Fig. II is an artifact introduced during sJ)(,'Cimen preparation. The strong bending of the filaments occurring subsequent to dissolving the Cu matrix indica tt."S strong residual st resses. i.e. a high content of goometncally necessa ry dislocations. Another striking feature of the Nb filaments is their flat and curled morphology when observed in the cross-section of the wire (Fig. 14). While the wire defonnation imposes a strain state with rotation symmetry about the drawing direction, the resulting shape of the Nb filaments docs not reveal this symmetry. This had to be attributed to the microscopic stra in di stri but ion and can be explained by the orientation distribution of the Nb filaments. As is eviden t from texture experiments and Taylor simulations. the bec Nb phase develops a ( 110) fiber texture during wire deformation (" > 4) (20 to 23). According to Hosford 1]1], this texture allows for only two or the four ( II I ) bee slip directions to contribute to plastic deformation par<lllel to the wire axis. However. the activation of only 2 symmetrical slip system s causes a local plane strain defonnllt ion which leads. under the externally imposed axisymmetric flow. to a bent shape of the Nb phase. which is referred to as curling. Th is phenomenon on ly occurs in composites which consist of a bee and a fcc phase. In fcc metals. where usually a ( Ill ) texture is generated during wire drawing, no planar slip is enforced , i.c. lIccordingly no curling is observed in
Fig. 17a and b. Trans\'erse section or rolled Cu·:ro mass% Nb. a) £_ 95 %. b) c - 99.4 '"10.
411
O. Raabe et al.: Investigation of a Cu-20 mass% Nb in situ Composite. Part I
10 r;====,-----~ -+--- thickness ---.- width
0.1 "-"---L......c.---'_.L....-,-....J o 1 2 3 4 5
True Strain
6
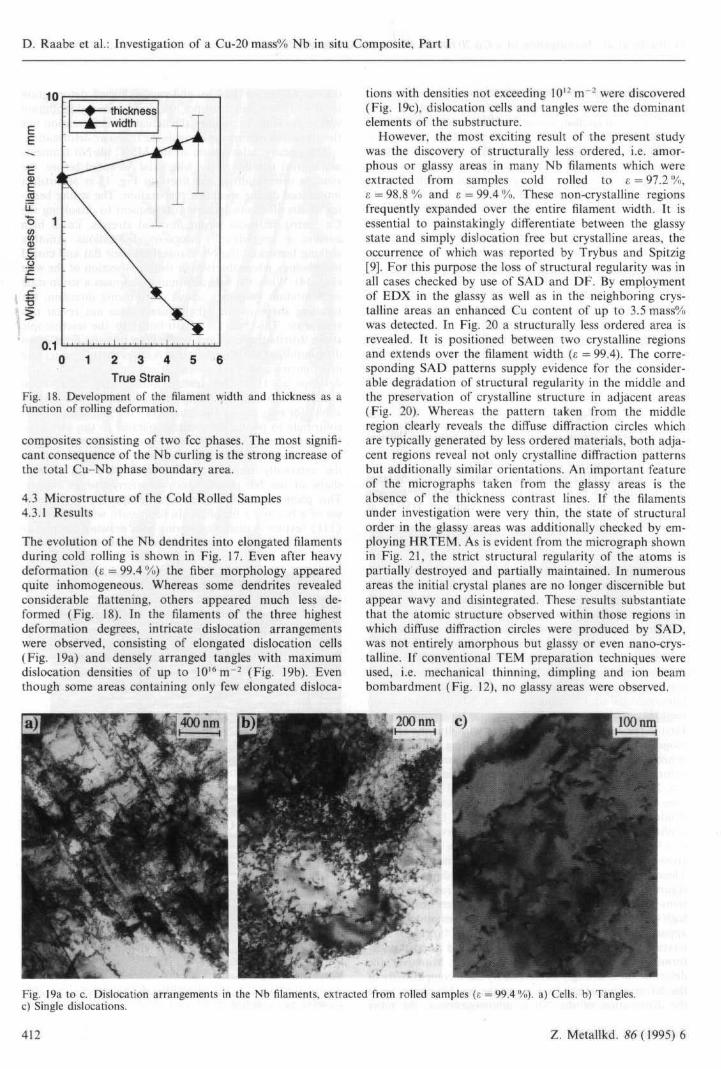
Fig. 18. Development of the filament width and thickness as a funct ion of rolling deformation. '
composites consisting of two fcc phases. The most significant consequence of the Nb curling is the strong increase of the total Cu- Nb phase boundary area.
4.3 Microstructure of the Cold Rolled Samples 4.3.1 Results
The evolution of the Nb dendrites into elongated filaments during cold rolling is shown in Fig. 17 . Even after heavy deformation (e = 99.4 %) the fiber morphology appeared quite inhomogeneous. Whereas some dendrites revealed considerable Aanening, others appeared much less deformed (Fig. (8). In the filaments of the three highest deformation degrees, intricate dislocation arrangements were observed, consisting of elongated dislocation cells (Fig. 19a) and densely arranged tangles with maximum dislocation densities of up to 10 16 m- 1 (Fig. 19b). Even though some areas containing only few elongated disloca-
tions with densities not exceeding 1012 m- 2 were discovered (Fig. 19c), dislocation cells and tangles were the dominant clements of the substructure.
However, the most exciting result of the present study was the discovery of structurally less ordered, i.e. amorphous or glassy areas in many Nb filameniS which were extracted from samples cold rolled to ~ = 97.2 "IoJ, I: = 98.8 % and t = 99.4 'Yu. These non-crystalline regions frequently expanded over the enti re filament width. It is essential to painstakingly differentiate between the glassy state and simply dislocation free but crystalline areas, the occurrence of which was reported by Trybus and Spitzig [9J. For th is pu rpose the loss of structural regularity was in all cases checked by use of SAO and OF. By employment of EDX in the glassy as well as in the neighboring crystalline areas an enhanced eu content of up to 3.5 mass% was detected. in Fig. 20 a structurally less ordered area is revealed. It is positioned between two crystalline regions and extends over the filument width (f. = 99.4). The corresponding SAD patterns supply evidence for the considerable degradation of st ructural regularity in the middle and the preservution of crystalline structure in adjacent arcus ( Fig. 20). Whereas the pattern taken from the middle region clearly reveals the diffuse diffraction circles which are typically generated by less ordered materials, both adjacent regions reveal not only crystalline diffraction patterns but additionally similar orientations. An important feature of the micrographs taken from the glassy a reas is the absence of the thickness contrast lines. If the filaments under investigation were very thin, the state of structural order in the glassy areas was additionally checked by employing HRTEM . As is evident from the micrograph shown in Fig. 21, the strict structural regularity of the atom s is partially destroyed and partially maintained. In numerous areas the initial crystal planes are no longer discernible but appear wavy and disintegrated. These results substantiate that the atomic structure observed within those regions in which diffuse diffraction circles were produced by SAD, was not en tirely amorphous but glassy or even nano-crystalline. If conventional TEM preparation techniques were used, i.e. mechan ical thinning. dimpling and ion beam bombardment ( Fig. 12). no glassy areas were observed.
Fig. 19a 10 c. Dislocation arrangements in the Nb filaments. e:< tracted from rolled samples (c - 99.4 %). a) Cells. b) Tangles. c) Single dislocations.
412 Z. Metallkd. 86 (1995) 6

D. Ra:lbe et al.: Investigation of a Cu-20 mass% Nb in situ Composi te. Part I
4.].2 Discussion
After low and even after heavy rolling deform<ltion the thickness distribution of the filaments lIppcars very inhomogeneous in the rolled MMC. As al ready expou nded for wire drawn specimens this is essenti:llIy allribuled to the inhomogeneous distribution of stress. After the highest deforma\Jon investigated (t = 99.4 %) an average filament thickness of 104 nm and minimum values of less than 50 nm were found (Fig. 18). The average filament width after t - 99.4 % was about 4000 nm (Fig . 18).
The appearance of structurally less ordered areas in the Nb fibers []2] is the most interesting discovery. In various studies on wire drawn [7. 27] and rolled (9] Cu-20 mass% Nb the microstructural evolution of the Nb filaments was investigated by use ofTEM. Albeit the dislocation arrangements and densities found there (7. 27. 9] were very similar to those observed in the present study. the occurrence of glassy areas was not mentioned in former publications. This disagreement is essentially attributed to the different TEM foil preparation method []2J. In the present study the essential step was the introduction of a new technique which allowed for a low preparation temperature less than ]00 K. At this temperature regime premlllure crystallization of the glassy areas can be excluded. In all previous TEM
Z. Metallkd. 86 ( 1995) 6
Fig. 21. I·ITEM micrograph taken from a structurally less ordered area in a Nb filament . extrdeted from a rolled sample.
Fig. 20. StructurJlly less ordered area In II
Nb filament . eXlracted from a rolled sample (t _ 99 4 -Ie). SAD diffraction patterns indicale glassy or nanlXrystalline aTe'ol in the filament
studies on deformed Nb filaments. however. [e.g. 7. 9]. mechanical grinding. dimpling lInd subsequent ion beam bombardment was employed. This conventional procedure gives rise to an enhanced sample temperature prior to observation. II is hence likely that in previous stud ies crystal· Iization of ini tially glassy areas had taken place during sam ple preparation. This is also underlined by the fact that in the present study no glassy areas were observed when the conventional foi l preparation method was employed. Furthermore. in previous works longitudinal and transverse sections. but no flat sections were in<'estigated [7. 9. 27]. In this investigation il was exclusively made usc or the latter type ofscclions. the examination of which allows ror statisti· ca lly 1II0re reliable observations. si nce numerous structurally less ordered areas extended over the entire filament width.
In the glassy as wel1 as in the adjacent cryslal1ine areas lin enhanced Cu content was detected . In addition. the graphite crucible used to prepare the melt. is known to promote lin increased content of N. C and S ( 19. 20]. This fact was confinned by the high electrical resistivity of the as-cast ingot [II]. The enhanced impurity content. however. is a ncccssl.lrY precondition for the formation or metallic glass. since very pure metal s were never transformed into the amorphous state . Metallic glasses consisting either of 4dtrunsition metals (e.g. Nb) and 4s·metals (e.g. Cu). or a
413

D. Raabe et al.: Investigation of a Cu-20 mass% Nb in situ Composite, Part I
transition metal (e.g. Nb) and metalloid atoms (e.g. C N, 5, B, Si), have frequently been observed [e.g. 33. 34]. As reported by Wang et a1. [35] a nd Iwasaki and Wang [36J, amorphous alloys containing more than 80 mass'Yo Nb have been produced by employing rapid quenching. These findings underline the present observation, viz. that Nb potentially revea ls the tendency to undergo phase transformation into a structurally less ordered sta te.
5 Simulation of the Yield Strength
In former models [8, IOJ the increase of strength is described in terms of various parameters fitted to experimenta l flow curves. In the present work a physical model is introduced. The new approach is a modified linear rule of mixtures ( MROM ). It regards the yield strength of the composite as the sum of the volumetr ic weighted average of the experi· mentall y observed yield st rengths of the individual pu re phases and a Hall -Petch type contribution arising from the imp:lct of the Cu- Nb phase boundaries. The latter contribution is analytically described in terms of two main ingredien ts. Firstly. by dislocation pile-ups in the eu matrix and sttondly, by the approach of Sevillano [37] which incorporates the activation of di sloca tion movement and mult iplica· tion in lamcllar two-phase aggregates in the Nb fi laments. The curren t model accounts essentially for wire drawn specimens. However, most of the underlying assumptions suggested in the following also can be applied to rol led samples. The dislocation arrangements, the textures and the distribution of the filament geometry presently observed as well as those reported by other authors [e.g. 20, 23, 28 , 29J are considered. The TEM data [e.g. 28. 29] suggest an evolution of the Nb fi lament thickness f and interdendritic spaci ng), as a function of the true wire strain, 'I. according to :
t = to · exp ( - ANh '!MM C: )
and ( I)
}. = ).0 exp( - Ac:u ' 'IMMC)
with starting values ,0 = 1.2)lm and ;. 0 =: 6)lm [29J. Accounting fo r the different deformation of both phases in the composite, the relations Ac u and A"'h are introduced:
'lcu l1 (,u=-- ; 'IMM(,
'I"'b A Nb = -- ; 'IM~1C'
A' '1 = ln
A (2)
where AO and A are the initial and the present cross-section, '/M1.1C the true strain of the bulk sample, 'INb the strain ofNb and 'Icu that of the eu phase. In the current model the deviation . 8(J, between the prediclions of the li near rule of mixtures (ROM). aIlOM' and the strength observed, aN .l , is attributed to the presence of the filaments.
( J)
Following the ROM the yield strength can be written as
( 4)
where a~OM is the yield strength for pure eu and O"~i;M that for pure Nb. Vcu and VNb are the volume fractions ofCu and Nb, respectively. For 8a the same approach applies:
( 5)
where 8acu and 6.a N b are the additional strength contributions, attributed to the impact of the filament s. From Eqs. (4) and (5) it is evident that both parts, (l"IIOM and 8(1,
414
are calculated as the volumetric weighted average of the corresponding strength contributions of the individual pure phases. Such an approach justifies to denote the model as MROM .
[n the following it was assumed that both contributions. !'J.a Cu and !'J.(JNb, relate to each other in the same way as is observed for the ultimate tensile strengths of the pure constituents, U~01.1 and (1~~M' The relation R was as a function of strain computed from experimental data.
(6)
The externally imposed st ress which is carried by the Nb as well as the dislocation pile-ups in the eu phase in front of the phase boundaries both contribute to the strength, Tva' which is required to initiate movement of dislocations in the Nb filaments [37J:
(7)
where t is the filament thickness, G the shear modulus. b the Burgers vtttor and A a constant for mixed dislocations, If dislocation multiplication rather than movement is considered inside the filamen t, , is replaced by ,/2 in Eq. (7) [37]. Since the thickness of the fi laments is considerably below that of the matrix. the glide resis tance in Nb wi ll hence exceed that in the eu phase. The stress at the tip of the pile-ups in the Cu phase can be written as
, I ( d"") r~~ = r~~ · I1p1p = - · f Va--M m Nb (8)
where 6.u Nb is the stress in the Nb as imposed externally, f ~~ the stress at the tip of the pite-up in the Cu phase, " I'll' the number of dislocations assembled in the pile·up, Ml"ob the Taylor factor of the Nb phase and III the orientation factor between the fcc pile-up and the bee sli p system. The highest number of dislocations to be piled-up between two interfaces resu lts in [38]
~' 'e'c' ~; c'_'i~_---",_C-,") ' r ip , !If'll' = Ge u ' be u
(9)
where ). - = }. /mcu and ( - = f /m Nb are the distances cor· rected with respect to the orientation of the active slip system . Accordingly, fIIeu is the orientation factor ofeu and IIINb that of Nb. From Eqs. (8) and (9) it follows
C" ) 2 ;,- ·( I -I'cu) _ 1 ( 8(1 Nb) (Tplp . _- T\'II - --
Ge u beu III ,\1 Nb ( 10)
Incorporating!'J.(1 = MT as well as Eq. (6) this relat ion can be written as
(8(1CU) 2 ). +· ( I-I'c8 ) I ( -- = - LV8 - R life" Ge u . be " m
() ))
resulting in
+ ( R AIL · Geu · be" ) 1 LVII · ,Mt·u· Ge, · beu
2 i .+ · (I - I·cu ) · M Nb //I + ).- (I - I'("u ) · //I
( 12)
The yield st rength contributed by the presence of the fi laments thus amounts to
z. Metallkd. 86 (1995) 6

D. RlIabc et al.: [nvestiglltion of .. Cu-20 mass% Nb in si lu Composite. Part I
The Taylor fac tor for a ( I I I> fiber texture of Cu under uniaxial load is Mt~! = 3. 16 ( Full Constrai nts Taylor model) [ 131. In the Nb fi laments {lJO}( III ) .lIl2}( III ) and {123}( I [ 1) sl ip systems can be activa ted. In case of Full Constraints conditions the ( 110) oriented Nb has a Taylor facto r of M~~1= 3 .67 ({1JO}( II I) slip only) or A'I~8 = 3. [8 (48 slip systems). Due to Ihe curling phenomenon of the Nb. Relaxed Constraints cond itions were also considered. In case of {IIO} ( I I I ) slip Ihe Taylor f.\ctor amounls to M~~2 = 2.45 and for 48 sli p systems to M~ = 2.15. The orientation factors wh ich were used 10
compute the resolved shear stresses wert: /IIc u = 0.27. m"" = 0.4 and III = 0.98. Using Ihe lowesl Taylor fllclo~ computed, the contribution of the fiber morphology to the yield strength of the composite then amoun ts to
(08 0 , (4.25 MPa .a.a 0: • + ._ . R) ' - M R
" +
( 14)
The simulat ion (i ndicated as: RO M + MMC. i.e. 111l0 M + L\a) reveli is a very good correspondence to Ihe experimental results (EXP) (Fig. 22). The experimenlal data for computing a llOM were ta ken from (121. For high degrccs of deformation the ultimate tensile strengths (UTS) from which the data of the ROM were com puted correspond to the yield strengths (UTS :::::: Rr'J z). This does not apply for low strains (U TS > Rf"J~ )' The model. however, describes the yield strength rather than the lITS. For low strains the data incorpora tcd from the ROM arc hence somewhat overcstimau..'d .
..... ',Il/10 -
" .. ~ uoo ~
• .. • ; ~ ..
... '" .........
• • • • '0 12
True StraIn
Fig. 22. Prediction of the yield strength of the MM C according 10 Ihe new model. The simulation (indicated as: RO M + MM C. i.e. 0"110,,", + 6.G") reveals a very good correspondence to e."(perimelll (EX P). The ellperinlenlal data ..... ere taken from 1121.
6 Conclusions
The fabriC:ttion, microstructu re. lexture and mechanical properties o f heavi ly rolled and wire drawn Cu-20 wt.% Nb in sit u composites have oc"en studied. It was shown that the high strength of this MMC can be understood in lerms of its microstruclUre. Especially the subslruclure of the Nb is
Z. Metallkd. 86 (1995) 6
essentia l for the strength of the MMC. In the Nb fihlments dislocation cells, t~nglcs and glassy areas were observed . A new model which describes the evolution of the yield strength on the basis of the microstructure and texture as a function of strain was introduced. The model yields a very good correspondence to experimcnl.
Li teratllre
1. c/wkrabmi. D. J. : l..ullghlil,. D. E.: Bull. Alloy Phase Dillgr.J.ms 2 ( 19g2) 936.
2. n'rrkholl, G. I.: AIt'ksalldrotw. L. N.: Izv. Akad. Nauk SSSR. Met. 4(1984)210.
3. Frommqer. G.: Verbundwt'rkslolTe. DGM-Verlag ( 198[). 4. Kllrll.wk. K. R. : H.,!."k, J.: J. Arr!. Phys. 52 (1981) 1370. 5. lkl"k . J.: I/lIrbisoll . J . P.: Bell. J. L: J. Apr\. I'h)"s. 49 (1978)
6031. 6. BI'I,k. J.: Kllrasl'k, K. R.: in: D . Kuhlmunn-Wilsdorf. W. C.
Harrigan (eds.). New Develo rments and Arplications ill Composites. AIME. Warrendale. PA ( 1979) 101.
7. Spir: iK. W. A.: Pl'llOll. A . R.: lAabs. F. C.: Actll metal1. 35 (1987) 2472.
8. Spit:ig. IV. A.: Acta metal!. 39 (l99 t ) t085. 9. Trybus. c.: Spi/: ig, JI'. A.: Acta metal!. ./7(1989) 1971.
10. F/lllk('lIlm.sch. P. D.: COllr/lley. T. If. : Acta metall. 33 (1985) 913.
11. Ruube. D.: l1('rillghlll,",. F.:phys. Slat. so!. (11) 142(!994) 473. 12. Spil:ig. IV. A.: Kro/: . P.: Scripta metall. 21 (1987) I 143. 13. Rill/be. D.: l1allgt·II. U.: in: S. I. Andersen, J. B. Bilde-Sorenseo.
T. Lorentzen, O. H. Pedersen. N. J. Sorensen ( t'ds.). Proc. 151h Riso 101. Symp. on Mal. Sc. on Num. Predic tion of Def. Proc. a nti the Ikhav. of Reul Mil t .. RiSe Nat. Lab. Roski lde. Denmark ( 1994) 487.
14. Rallm.. D .. l/(mg",' . U.: GOIIS/eill. G. : Proc. Int. Wo rkshop on " High-Strength, High-Conducti\'ity Composite Mal. ... Nal. High Magn. Field Lab .. Tullahassee. Florida (1994).
15. Emll",y. J. D.: Hill. M. A. : Spil:ig. IV. A .. SlIkllj. }'.: MRS Hull . 8(1993)57.
16. Sdlllei(wr-M,m/ali. n·J.: IEEE Trans. Magn. 18 (1982) 32. 17. Rll(II)t." D.: !fllllgt'lr. u.: Maler. Lett .. in press. 18. Raube. D.: GO/lSlrill. G.: J. de Phys. IV. 001. C7. sup. J. de Ph)"s .
III J( I993) 1727. 19. Naillglums. F.: Raam,. D.: KIlII/. L.: GOlwdn. G.: Zcitoch rift
Metall 6 ( 1993) 558. 20. Ill'ringnllils. F.: Raobe. D.: GallS/eill. G.: Melall 48 ([994)
287. 21. /W(lbe. D.: I)isserta tion. RWTH Aachen (1992). 22. RUt/be. D.: Ball. J.: GO/lSreill. G. : Scripta mClnll. 2 7, 19(2) 21 I 23. flt'r illgitIlIlS. F.: H(mKt'n. u.: R(I(IIw. D .. G(J1/l"/t'iIl. G .. Maler.
Sci. Forum /57- 162(1994) 709 . 24. Schill;. L. G.: App!. Phys. 20 ( 1949) 1030 . 25. BilligI'. H. J.: Z. Mcta llkd . 56 (1965) 872. 26. Luck.'. K. : Pospi«h. J.: Viw ich. K. II.: Jllm. J.: ACla mctall. 29
(1981)167 . 27. Engler. 0.: GOIWl'ill, G .. Steel Research 6.1 (1992) 413. 28. Pel/IIII. A. R.: Laabs. F. C : Spi/;ig . IV. A.: Chl!llg. C C :
Ultr',1microscop)" 22 ( 1987) 25 I.' 29. Verlwt'!len. J. D.: Spir:ig, W. A .. Sclrmidt. F. A .. KrOl;. P. D.:
Gibsoll, E. D.: J . Mater. $c. 24 (1989) 101 5. 30. Rllobt. D.: lIullgl'II. U.: ACla metall.. in press. 31. Ho.lj()rd. W. ,... Jr. : Trllns. of TMS AI ME 230 ( 1964) 12. 32. Rallbe. D.: 1I11l/geli. U.: J. Maler. Res .. in press. 33. LuOOrsky . F. E. : Amorphous Metallic Alloys. lJul1erworths,
London (1983). 34. GUlllhtrlKlI, 1I. J.: Berk. H .: Glass), Mda[s. Springer Vt'rlag.
Berlin. 1( 1981).2(\982). 35. WanK, W. K.: IWI/saki. H. : Sur)"(III(1f(l)"w/{/. G.: MaIl/mow. T.:
Fukllmichi. F.: S)"OI/O, Y.: TtJgo. T. : in: T. MasumolO, K. SUZllki (eds.), Proc. 4th Int. Conf. on Rapidly Quenched Metals. Sendai. 198\. Jap. Ins!. of Melals. $cndai RQ4 (1982)663.
36. III"IIJaki.lI.: lV(mg. W. K.: Sci. Rep. of Res. Insi. oftheTohoku Univ. 29A ( 1981) t95.
37. Sl'lIi11(1II0. J. G.: J. de I'hys. If/ 6 (1990) 967. 38. Chou, r . T.: ph)'s. Slat. sol. /7(1966) 509.
( Receil.'f't/ AllgU.W 16, 1994)
415
ler lft