investigation numerical of axial bearing capacity of piles
TRANSCRIPT
International Journal of the Physical Sciences Vol. 6(33), pp. 7589 - 7603, 9 December, 2011 Available online at http://www.academicjournals.org/IJPS DOI: 10.5897/IJPS11.869 ISSN 1992 - 1950 ©2011 Academic Journals
Full Length Research Paper
Numerical investigation of axial bearing capacity of piles embedded in sloping ground
Abbas Babaei
Department of Civil Engineering, Noor Branch, Islamic Azad University, Noor, Iran. E-mail: [email protected]/ [email protected].
Accepted 06 October, 2011
In practice, piles may be constructed in sloping ground where the axial capacity of piles may be affected by the ground slope. This paper presents the effect of the ground slope geometry on the ultimate axial bearing capacity of vertical pile using numerical simulation based on Plaxis 3D Foundation software. The pile is assumed to consist of linear and elastic material. Various aspect ratios (L/D) for the pile have been considered. The soil behavior is modeled based on the Mohr Coulomb failure criterion. Loose and dense sand, and sandy clay have been used for numerical modeling. Interface elements have been applied to the pile-soil boundaries to accommodate the slip which may occur between these two materials. The simulation of the pile-soil system is first calibrated using available data from the field load tests on piles to ensure the validity of the constructed numerical modeling. Various shapes for the ground slope have been considered in analyses, including flat- sloping, uniformly sloping, all-around upward sloping, and all-around downward sloping ground. The results have shown that the pile axial capacity increases with increase in the value of the upward sloping. In contrast, the pile capacity decreases with increase in the downward sloping. From a provided data base, empirical expressions have been presented to take into account the slope shape effect on the pile capacity. It has been found that this empirical expression can be confidently used in practice to account for the ground sloping effect on the pile capacity. This expression may be used in conjunction with conventional methods based on the limit equilibrium approach. This is interesting since practicing engineers are well familiar with conventional methods calculating the pile axial capacity. Key words: Pile, ground slope, axial capacity, pile, Mohr Coulomb, numerical method, finite element, Mohr Coulomb failure criterion.
INTRODUCTION Piles are structural components made of wood, concrete or steel and are used for transferring of surface loads to ground depth. The expenditure of pile set-up is much higher than shallow foundations. Despite this, in practice, they are still widely used for sufficient capacity and low settlement requirements. The subject of load-carrying capacity of piles has been extensively investigated using numerical, analytical or experimental methods (Donald, 2000; Kim and Barker, 2010). However, the ground sloping effect on pile response under axial loading has not been explored, to the best knowledge of the authors.
In this paper, numerical simulation based on Plaxis 3D Foundation has been used to determine the influence of the ground slope on the pile axial capacity. Based on the numerical results, empirical expressions have been introduced which may be used in conjunction with conventional methods to compute the bearing capacity of piles embedded in sloping ground (Bowles, 2001).
Axial bearing capacity of piles
Various methods may be used to calculate the axial
7590 Int. J. Phys. Sci. capacity of piles due to the failure of the soil around the pile shaft and toe. These include static analysis, using in-situ tests, dynamic method, and direct load test. In static analysis, shear strength parameters of the soil is used in conventional approaches. Total or effective stress analyses may be used in this method. As a complementary method, in-situ test results may also be used which provide continuous information of the site soil (Titi et al., 1999; Eslami and Fellenius, 1997). Dynamic methods are on the base of the relation between the exerting energy and pile reaction or emitted wave equation analysis of pile during the pile embedment. During loading test, the pile exposes a static load in the real condition and its load-displacement characteristics are studied at different states. As a result, the pile capacity stemming from shaft and toe resistance components are obtained. This is partially lengthy, difficult, and expensive; however, it can be directly evaluating the pile capacity. Numerical approaches are useful and powerful tools to deal with complexity of the pile problems (Budhu, 2010).
Numerical simulation of pile-soil system To calculate the axial capacity of pile subjected to vertical
load, the final element program FoundationPlaxis D3
has been used. This program has capability to model the soil-structure interaction and considers precisely the soil and structure behavior with no simplification. The finite element mesh is extended to the boundaries around the pile sufficiently to avoid unrealistic results. The lateral boundary was assumed to be at 5r where r denotes the pile radius. The soil behavior is assumed to obey the Mohr-Coulomb failure criterion.
Verification
To demonstrate the capability of the constructed numerical soil-pile simulation, field test data reported in the literature are considered. First, data are reported by Ismael (2001, 1990, and 1996), Ismael and Sanad (1993), Ismael et al. (1994) and the second tests were performed by Neves et al. (2001) and third tests were performed by El-Mossallamy (1999).
Tensile loading calibration
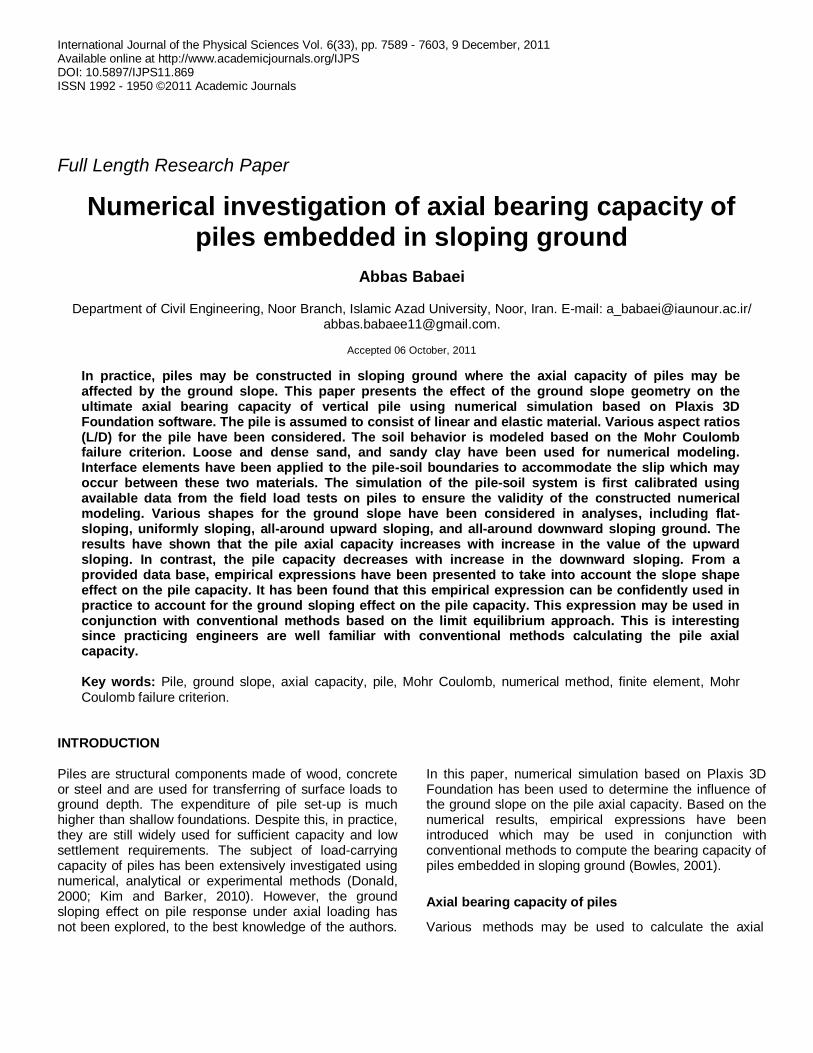
Ismael (2001) performed field tension loading test site South Surra on a real full scale pile. The soil profile in the site is shown in Figures 1, 2 and 3. The specifications of the soil and pile are given in Table 1.
Compressive calibration model in non homogenous soil
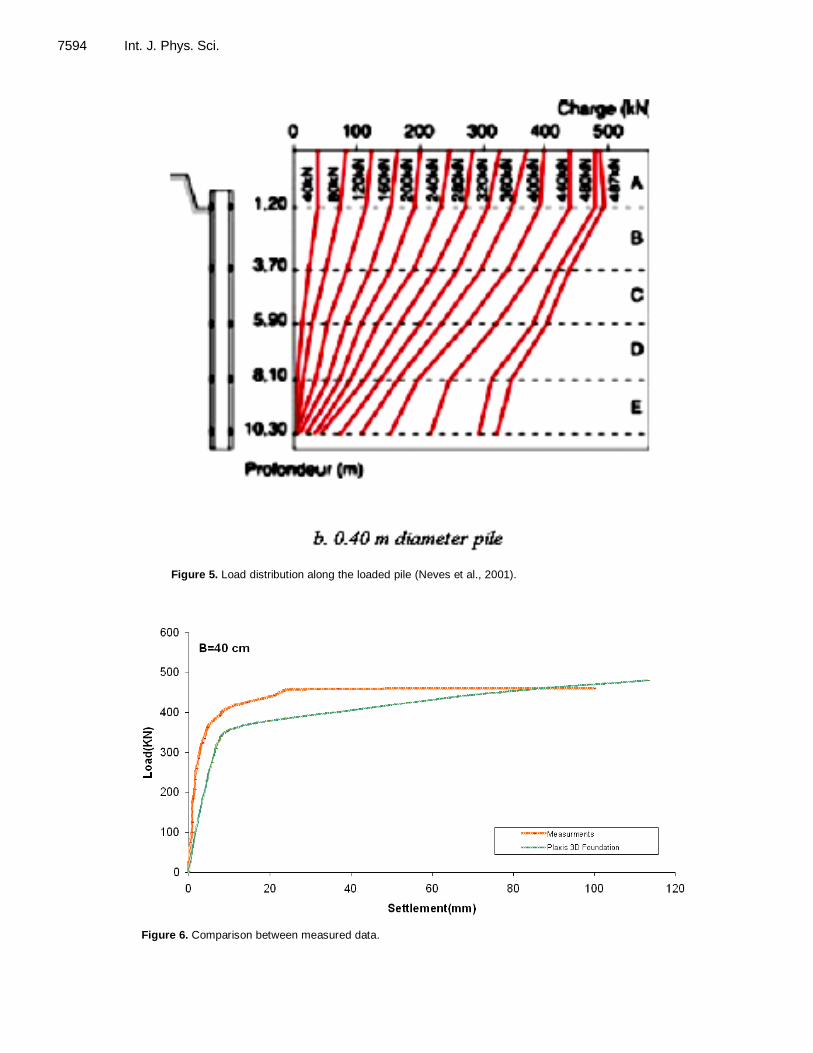
In the second test, a test pile embedded in an inhomogeneous soil is considered. The soil and pile specifications are given in Figures 4, 5 and 6 and Table 2.
Compressive calibration model in homogenous soil
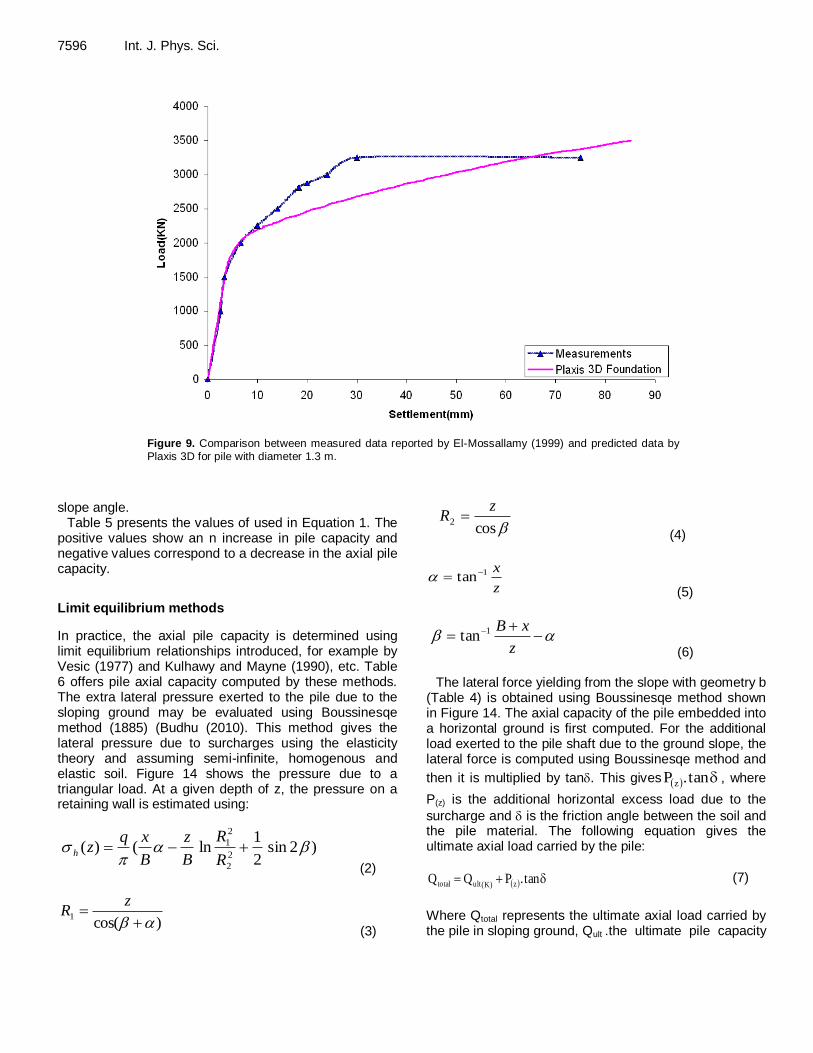
Two cases showed that the predictions made by numerical analyses are reasonable and can be used confidently to simulate soil-pile in sloping ground (Figures 7, 8 and 9).
Numerical simulation of soil-pile system in sloping ground
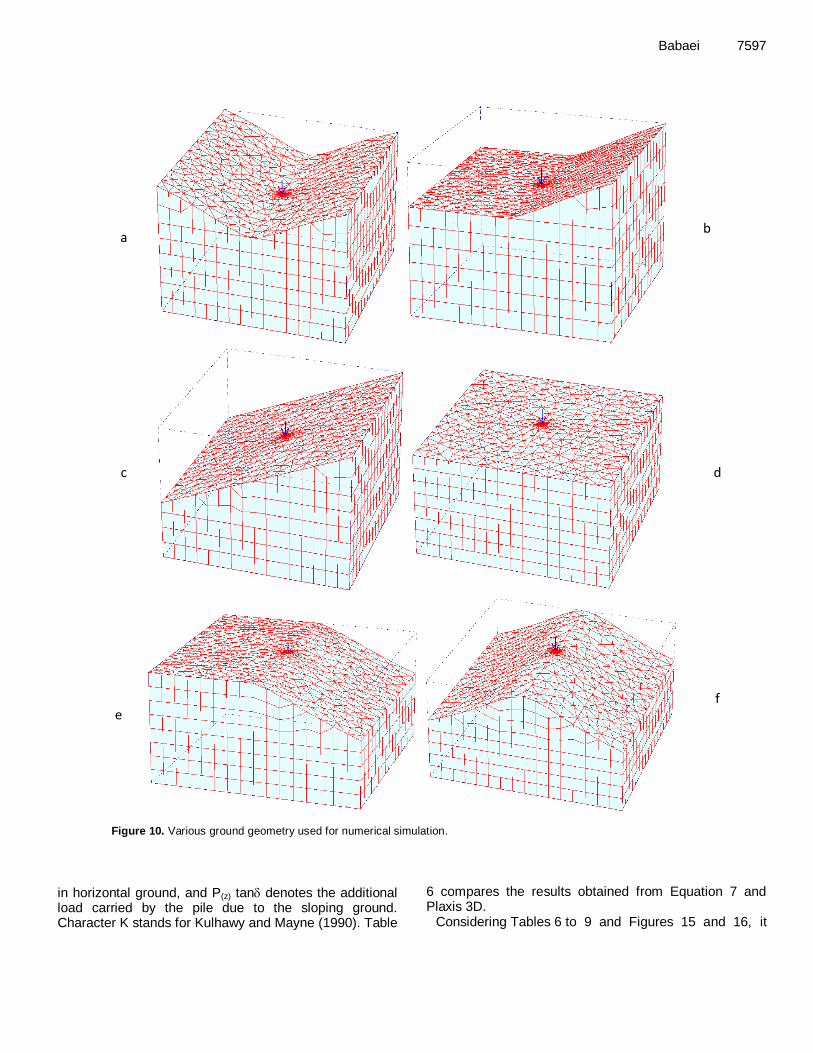
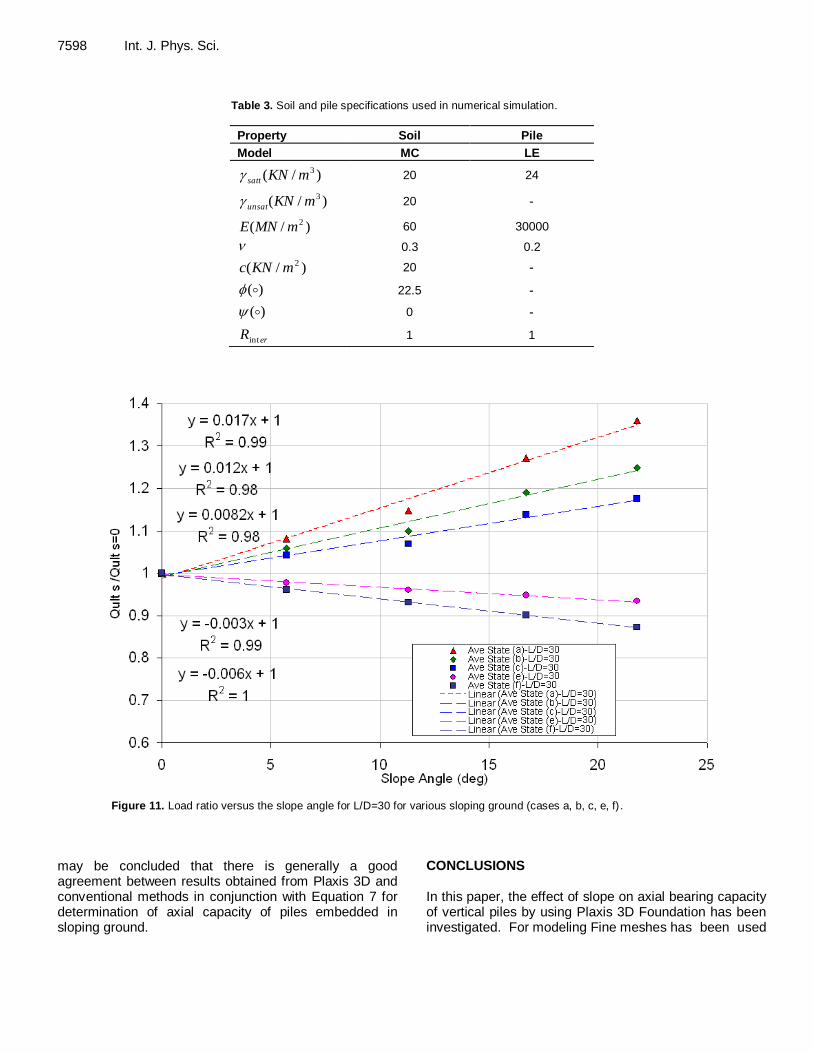
To explore the slope effect on the pile axial capacity, six slope geometries are considered and the pile capacity is compared with the same pile embedded into a flat ground of the same properties (Figure 10). For this purpose, loose sand and three slenderness ratios of 30, 40, and 50 are used. The pile diameter is assumed 1 m in all analyses. The soil and pile properties are given in Table 3.
Result in five geometrical slope state while L/D=30, 40 and 50
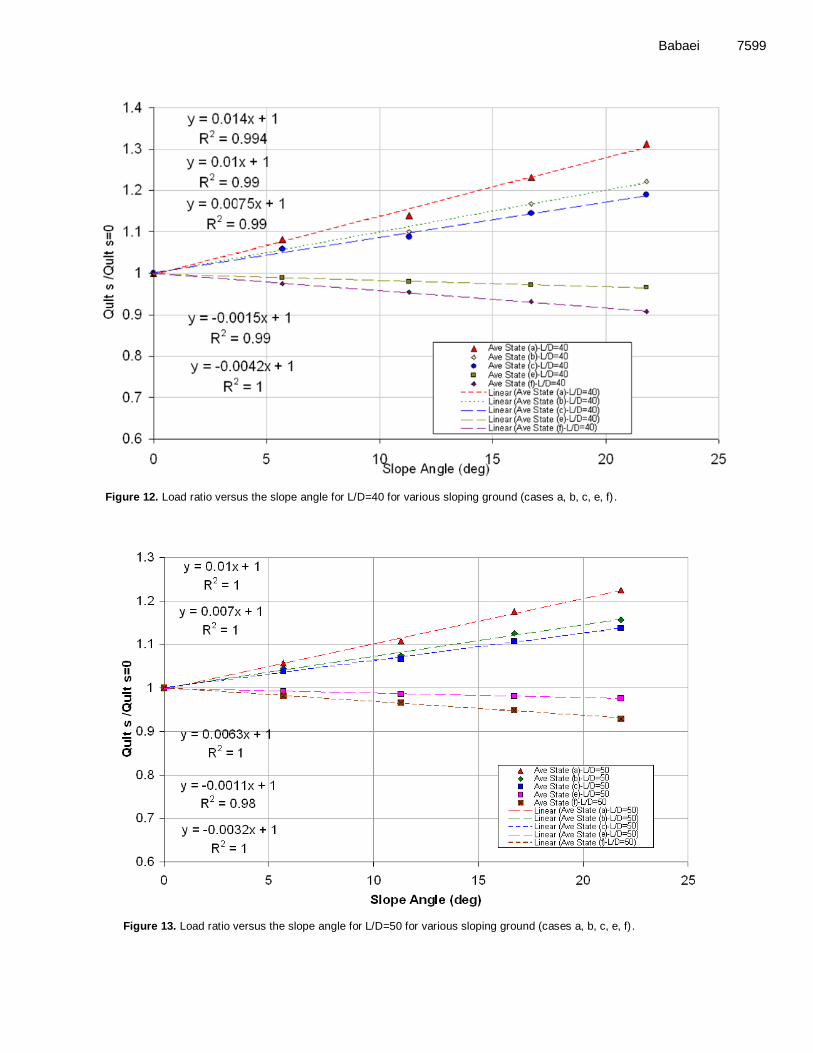
Here, the results for slope geometries (a, b, c, e, and f) with the pile slenderness ratios of L/D=30, 40 and 50 are presented. Figures 11, 12 and 13 show the axial capacity ratio versus the ground slope. This ratio represents the axial capacity of the pile embedded into a sloping ground divided by the axial capacity of the same pile embedded into the horizontal ground of the same properties. Each figure corresponds to a slenderness ratio. As seen in each figure, the pile capacity increases with increase in the lateral pressure due to the ground slope on the pile shaft. It is also noted that, in some cases, there is a decrease in the axial capacity of the pile.
Based on the results presented in Figures 11, 12 and 13, the following empirical expression is presented:
100
1
)0(
ult
ult
Q
Q
(1) Where Qult represents the pile axial capacity increment and Qult denotes the axial capacity of the same pile embedded into the horizontal ground of the same properties. Character expresses the ground surface
Babaei 7591
Figure 1. Soil conditions at test site South Surra.
7592 Int. J. Phys. Sci.
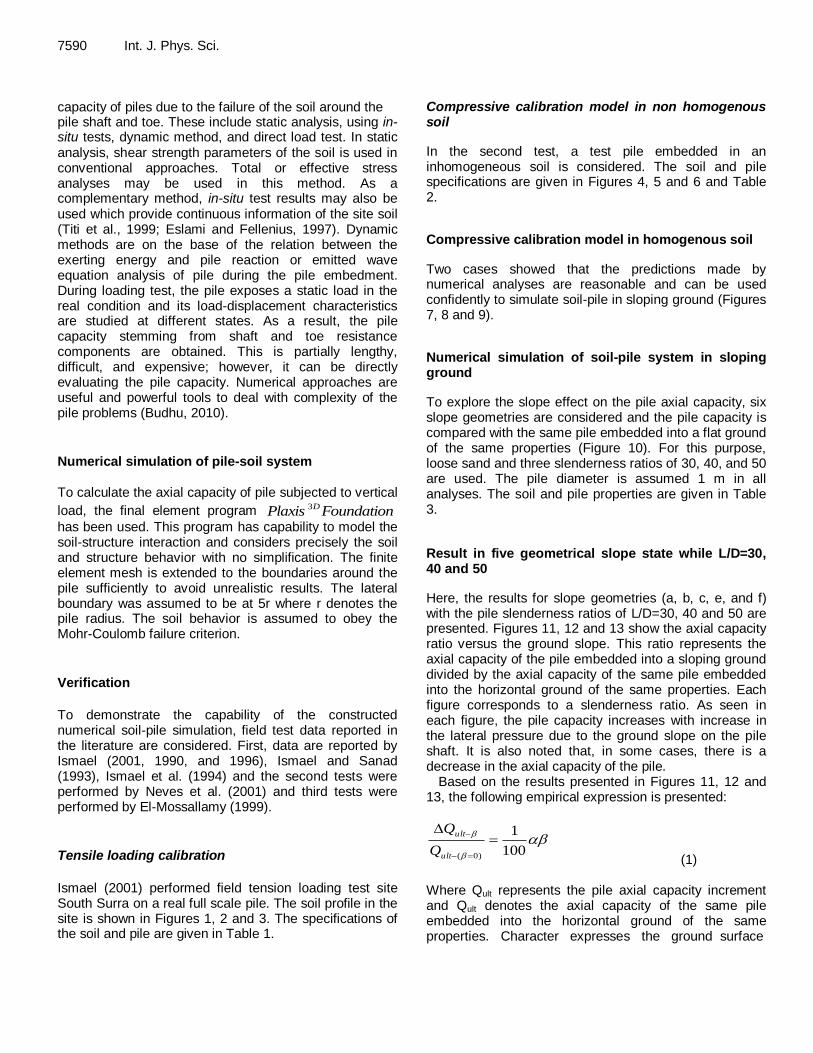
Figure 2. (a) set-up for test; (b) tensile test; (c) pile fracture after tension Ismael (2001).
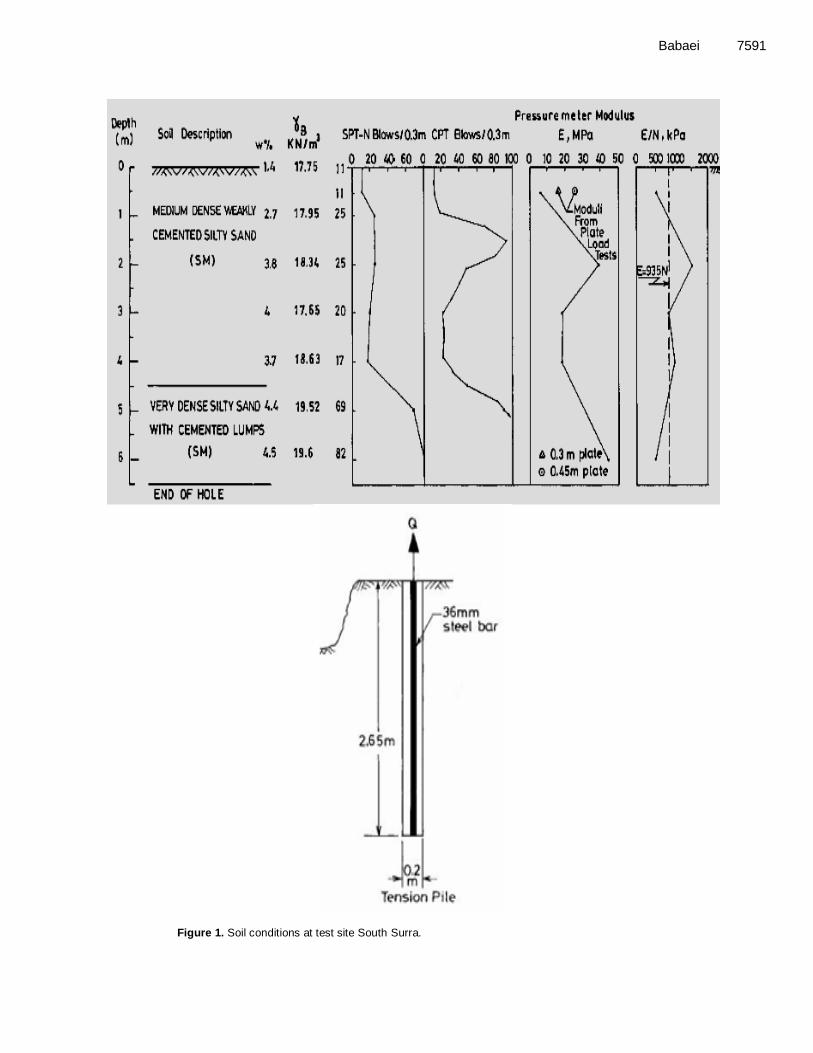
Figure 3. Comparison between measured data reported by Ismael (2001) and predicted data by Plaxis 3D for
pile with diameter 0.2 m.

Babaei 7593
Table 1. Soil and pile properties for numerical simulation (LE: Linear Elastic, MC: Mohr Coulumb).
Property Layer 1 Layer 2 Pile
Model MC MC LE
18 19.6 23
18 19.6 -
37 40 32000
0.3 0.3 0.3
20 20 -
35 35 -
0 0 -
1 1 1
Figure 4. Soil profile at Saopaolo University Campus (Neves et al., 2001).
)m/kN( 3
satt
)m/kN( 3
unsat
)m/MN(E 2
)m/kN(c 2
)(
)(
erRint
7594 Int. J. Phys. Sci.
Figure 5. Load distribution along the loaded pile (Neves et al., 2001).
Figure 6. Comparison between measured data.
Babaei 7595
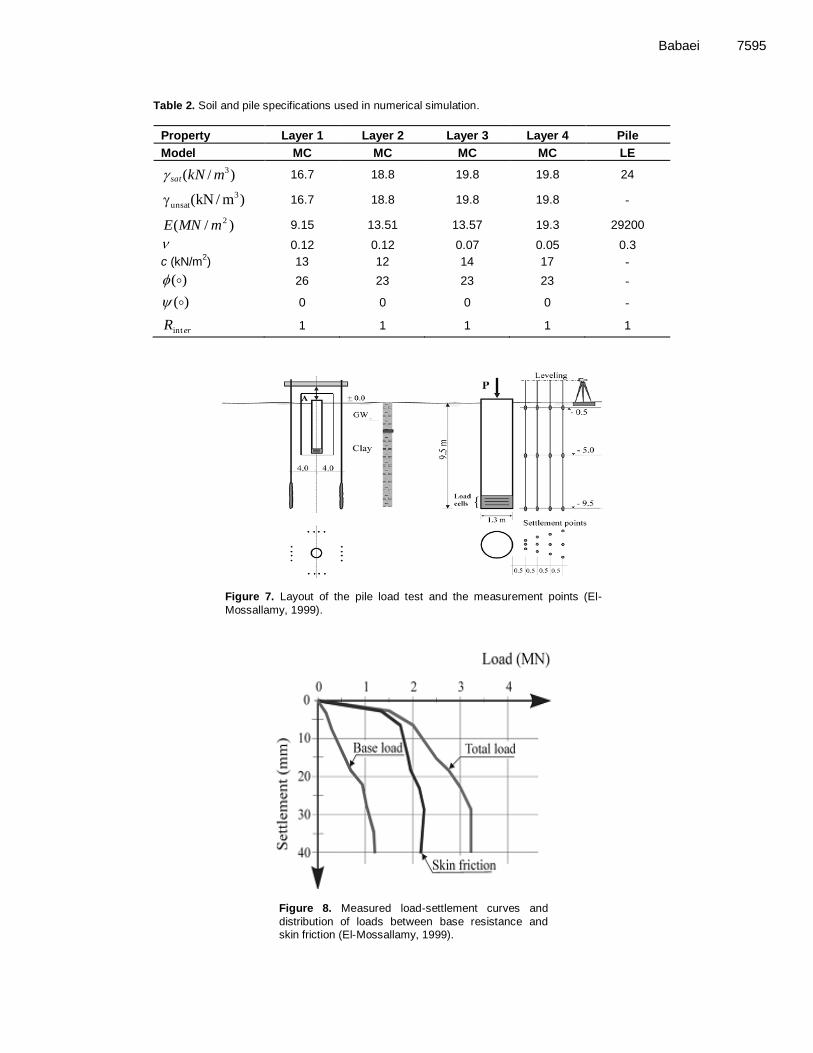
Table 2. Soil and pile specifications used in numerical simulation.
Property Layer 1 Layer 2 Layer 3 Layer 4 Pile
Model MC MC MC MC LE
)/( 3mkNsat 16.7 18.8 19.8 19.8 24
)m/kN( 3
unsat 16.7 18.8 19.8 19.8 -
)/( 2mMNE 9.15 13.51 13.57 19.3 29200
0.12 0.12 0.07 0.05 0.3
c (kN/m2)
13 12 14 17 -
)( 26 23 23 23 -
)( 0 0 0 0 -
erRint 1 1 1 1 1
Figure 7. Layout of the pile load test and the measurement points (El-
Mossallamy, 1999).
Figure 8. Measured load-settlement curves and
distribution of loads between base resistance and skin friction (El-Mossallamy, 1999).
7596 Int. J. Phys. Sci.
Figure 9. Comparison between measured data reported by El-Mossallamy (1999) and predicted data by Plaxis 3D for pile with diameter 1.3 m.
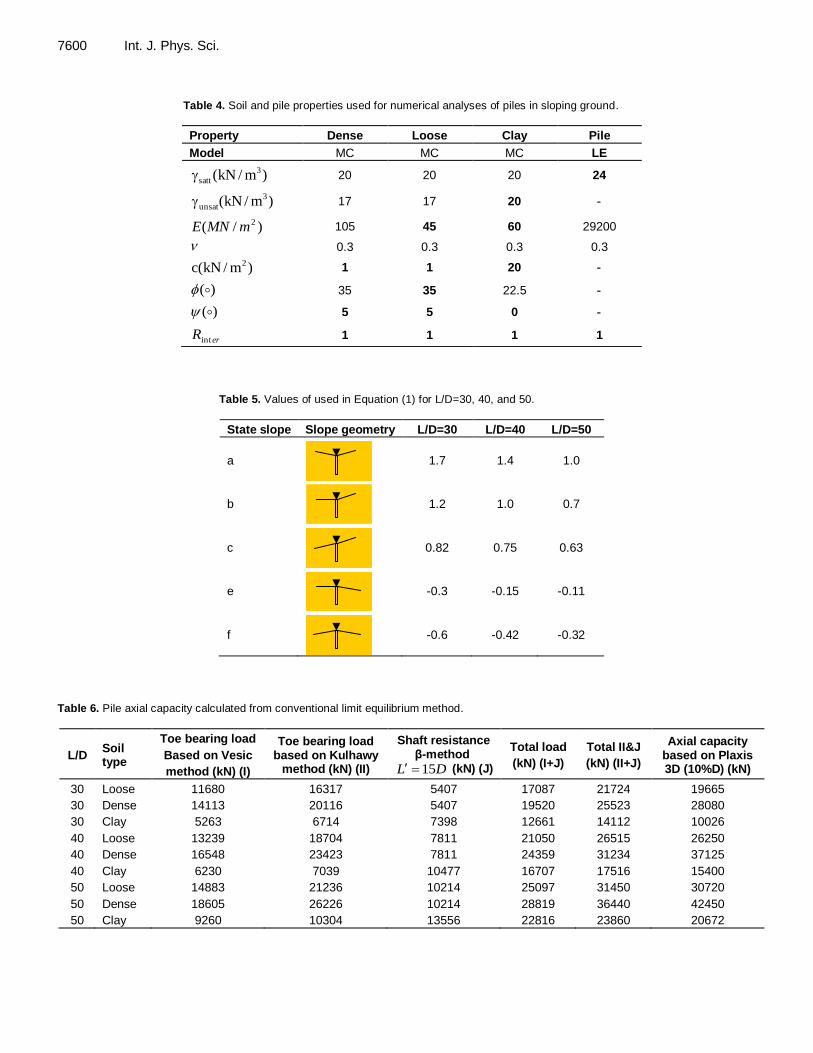
slope angle. Table 5 presents the values of used in Equation 1. The
positive values show an n increase in pile capacity and negative values correspond to a decrease in the axial pile capacity.
Limit equilibrium methods
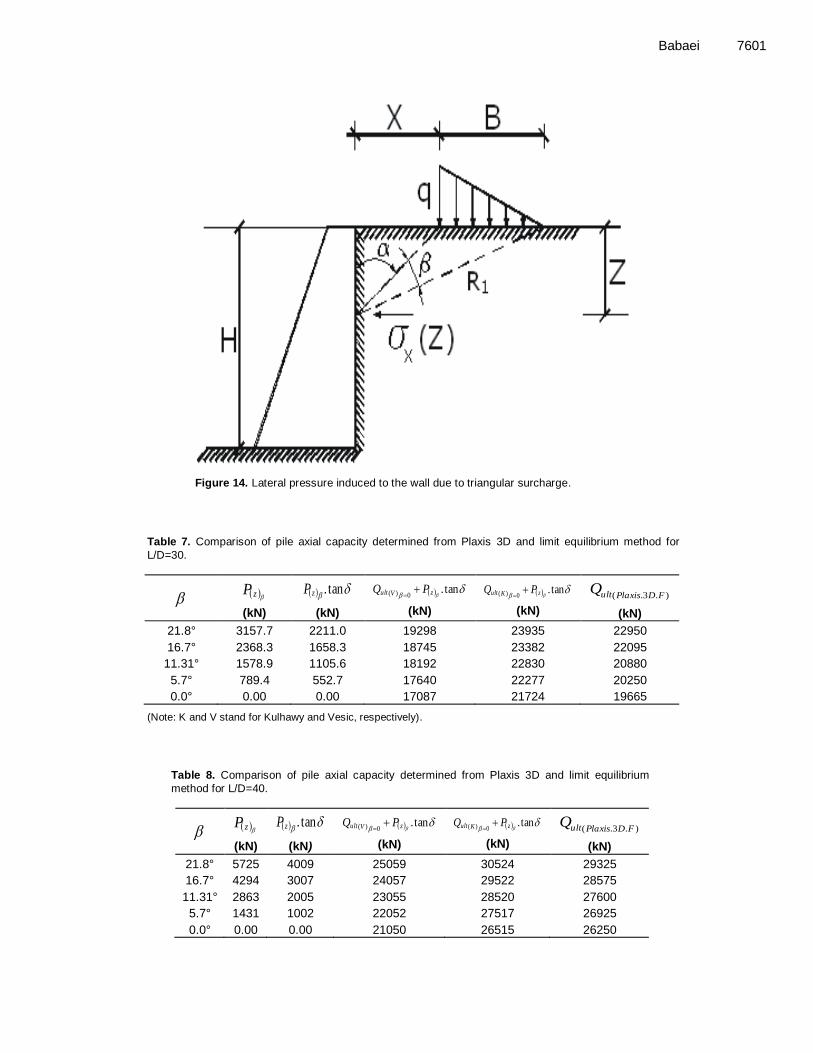
In practice, the axial pile capacity is determined using limit equilibrium relationships introduced, for example by Vesic (1977) and Kulhawy and Mayne (1990), etc. Table 6 offers pile axial capacity computed by these methods. The extra lateral pressure exerted to the pile due to the sloping ground may be evaluated using Boussinesqe method (1885) (Budhu (2010). This method gives the lateral pressure due to surcharges using the elasticity theory and assuming semi-infinite, homogenous and elastic soil. Figure 14 shows the pressure due to a triangular load. At a given depth of z, the pressure on a retaining wall is estimated using:
(2)
(3)
(4)
(5)
(6)
The lateral force yielding from the slope with geometry b (Table 4) is obtained using Boussinesqe method shown in Figure 14. The axial capacity of the pile embedded into a horizontal ground is first computed. For the additional load exerted to the pile shaft due to the ground slope, the lateral force is computed using Boussinesqe method and
then it is multiplied by tan. This gives tan.P z , where
P(z) is the additional horizontal excess load due to the
surcharge and is the friction angle between the soil and the pile material. The following equation gives the ultimate axial load carried by the pile:
tan.PQQ z)K(ulttotal (7)
Where Qtotal represents the ultimate axial load carried by the pile in sloping ground, Qult .the ultimate pile capacity
)2sin
2
1ln()(
2
2
2
1
R
R
B
z
B
xqzh
)(cos1
zR
cos2
zR
z
x1tan
z
xB1tan
Babaei 7597
Figure 10. Various ground geometry used for numerical simulation.
in horizontal ground, and P(z) tan denotes the additional load carried by the pile due to the sloping ground. Character K stands for Kulhawy and Mayne (1990). Table
6 compares the results obtained from Equation 7 and Plaxis 3D.
Considering Tables 6 to 9 and Figures 15 and 16, it
b a
c d
e f
7598 Int. J. Phys. Sci.
Table 3. Soil and pile specifications used in numerical simulation.
Property Soil Pile
Model MC LE
)/( 3mKNsatt 20 24
)/( 3mKNunsat 20 -
)/( 2mMNE 60 30000
0.3 0.2
)/( 2mKNc 20 -
)( 22.5 -
)( 0 -
erRint 1 1
Figure 11. Load ratio versus the slope angle for L/D=30 for various sloping ground (cases a, b, c, e, f) .
may be concluded that there is generally a good agreement between results obtained from Plaxis 3D and conventional methods in conjunction with Equation 7 for determination of axial capacity of piles embedded in sloping ground.
CONCLUSIONS In this paper, the effect of slope on axial bearing capacity of vertical piles by using Plaxis 3D Foundation has been investigated. For modeling Fine meshes has been used
Babaei 7599
Figure 12. Load ratio versus the slope angle for L/D=40 for various sloping ground (cases a, b, c, e, f) .
Figure 13. Load ratio versus the slope angle for L/D=50 for various sloping ground (cases a, b, c, e, f) .
7600 Int. J. Phys. Sci.
Table 4. Soil and pile properties used for numerical analyses of piles in sloping ground.
Property Dense Loose Clay Pile
Model MC MC MC LE
)m/kN( 3
satt 20 20 20 24
)m/kN( 3
unsat 17 17 20 -
)/( 2mMNE 105 45 60 29200
0.3 0.3 0.3 0.3
)m/kN(c 2 1 1 20 -
)( 35 35 22.5 -
)( 5 5 0 -
erRint 1 1 1 1
Table 5. Values of used in Equation (1) for L/D=30, 40, and 50.
State slope Slope geometry L/D=30 L/D=40 L/D=50
a
1.7 1.4 1.0
b
1.2 1.0 0.7
c
0.82 0.75 0.63
e
-0.3 -0.15 -0.11
f
-0.6 -0.42 -0.32
Table 6. Pile axial capacity calculated from conventional limit equilibrium method.
L/D Soil type
Toe bearing load
Based on Vesic
method (kN) (I)
Toe bearing load based on Kulhawy
method (kN) (II)
Shaft resistance β-method
DL 15 (kN) (J)
Total load
(kN) (I+J)
Total II&J
(kN) (II+J)
Axial capacity based on Plaxis 3D (10%D) (kN)
30 Loose 11680 16317 5407 17087 21724 19665
30 Dense 14113 20116 5407 19520 25523 28080
30 Clay 5263 6714 7398 12661 14112 10026
40 Loose 13239 18704 7811 21050 26515 26250
40 Dense 16548 23423 7811 24359 31234 37125
40 Clay 6230 7039 10477 16707 17516 15400
50 Loose 14883 21236 10214 25097 31450 30720
50 Dense 18605 26226 10214 28819 36440 42450
50 Clay 9260 10304 13556 22816 23860 20672
Babaei 7601
Figure 14. Lateral pressure induced to the wall due to triangular surcharge.
Table 7. Comparison of pile axial capacity determined from Plaxis 3D and limit equilibrium method for
L/D=30.
zP
(kN)
tan.zP
(kN)
tan.0)( zVult PQ
(kN)
tan.0)( zKult PQ
(kN)
).3.( FDPlaxisultQ
(kN)
21.8° 3157.7 2211.0 19298 23935 22950
16.7° 2368.3 1658.3 18745 23382 22095
11.31° 1578.9 1105.6 18192 22830 20880
5.7° 789.4 552.7 17640 22277 20250
0.0° 0.00 0.00 17087 21724 19665
(Note: K and V stand for Kulhawy and Vesic, respectively).
Table 8. Comparison of pile axial capacity determined from Plaxis 3D and limit equilibrium
method for L/D=40.
zP
(kN)
tan.zP
(kN)
tan.0)( zVult PQ
(kN)
tan.0)( zKult PQ
(kN)
).3.( FDPlaxisultQ
(kN)
21.8° 5725 4009 25059 30524 29325
16.7° 4294 3007 24057 29522 28575
11.31° 2863 2005 23055 28520 27600
5.7° 1431 1002 22052 27517 26925
0.0° 0.00 0.00 21050 26515 26250

7602 Int. J. Phys. Sci.
Table 9. Comparison of pile axial capacity determined from Plaxis 3D and limit equilibrium method for L/D=50.
zP
(kN)
)(.
tagPz
(kN)
tagPQ zVult .0)(
(kN)
tagPQ zKult .0)(
(kN) ).3.( FDPlaxisultQ
(kN) 21.8° 7842 5491 30588 36941 33360
16.7° 5882 4119 29216 35569 32940
11.31° 3921 2746 27843 34196 32040
5.7° 1961 1373 26470 32823 31380
0.0° 0.00 0.00 25097 31450 30720
Figure 15. Comparison of pile axial capacity ratio determined from Plaxis 3D and
limit equilibrium methods for L/D=30.
Figure 16. Comparison of pile axial capacity ratio determined from Plaxis 3D and
limit equilibrium methods for L/D=40.
and to eliminate the sensitivity to meshing, at a distance of five times of pile radius around the pile finer meshes used. The investigations show the following results in loose and dense sands around medium to tall piles at common and stable slopes. The results have shown that the pile axial capacity increases with increase in the value of the upward sloping. In contrast, the pile capacity decreases with increase in the downward sloping. REFERENCES
Bowles JE (2001) Foundation Analysis and Design. McGraw-Hill Press. Donald PC (2000). Foundation Design: Principles and Practices. 2th
Edition, Prentice Hall Press. El-Mossallamy Y (1999). Load-settlement Behavior of Large Diameter
Bored Piles in Over-Consolidated Clay. Proceeding of The 7th
International Symposium on Numerical Models in Geotechnical Engineering, Graz, Austria. pp. 443-450.
Eslami AE, Fellenius BH (1997). Pile capacity by direct CPT and CPTu methods applied to 102 case histories. Canadian Geotech. J., 34(6):
886-904. Titi HH, Murad Y, Abu-Farsakh (1999). Evaluation of Bearing Capacity
of Piles from Cone Penetration Test Data. Louisiana Department of
Transportation and Development Louisiana Transportation Research Center. Available at Online: http://www.vulcanhammer.info/drivability/Titi-Abu-Farsakh.pdf.
Ismael NF (1990). „„Behavior of laterally loaded bored piles in cemented sands.‟‟ J. Geotech. Engrg. ASCE, 116(11): 1678–1699.
Babaei 7603 Ismael NF (1996). „„Loading tests on circular and ring plates in very
dense cemented sands.‟‟ J. Geotech. Engrg., ASCE, 122(4): 281–287.
Ismael NF, Al-Sanad HA, Al-Otaibi F (1994). „„Tension tests on bored piles in cemented desert sands.‟‟ Can. Geotech. J., Ottawa, 31(3): 597–603.
Ismael NF, Al-Sanad HA (1993). „„Plate loading tests on weakly cemented surface desert sands.‟‟ Geotech. Engrg., J. Southeast Asian Geotech. Soc., Bangkok, Thailand, 24(2): 133–150.
Ismael NF (2001). Axial Load Test Bored Piles and Pile Groups in Cemented Sands. J. Geotech. Geonviron. Eng., 127(9): 766-773.
Kim JS, Barker RM (2002). Effect of Live Load Surcharge on Retaining
Walls and Abutments. J. Geotechnical and Geoenviromental Eng., 128(10): 803-812.
Kulhawy FH, Mayne PW (1990). Manual on estimating soil properties
for foundation design. Report EL-6800, Electric Power Research Inst., Palo Alto, p. 306.
Budhu M (2010). Soil Mechanics and Foundations. 3th Edition, Wiley
Press. 761p. Neves M, Mestat P, Frank R, Degny E (2001). “Research on the
behavior of bored piles - I. in situ and laboratory experiments”,
CESAR-LCPC, 231: 39-54. Vesic AS (1977). Design of pile foundations. National Cooperative
Highway Research Program Synthesis of Highway Practice No. 42,
Transportation Research Board, National Research Council, Washington, D.C, pp. 24-26.