investigating the potential of using off-axis 3d woven ... · pdf fileboth test categories...
TRANSCRIPT

Investigating the Potential of Using Off-Axis 3D WovenComposites in Composite Joints’ Applications
Mohamed Nasr Saleh1 & Ying Wang2 & Arief Yudhanto3 &
Adam Joesbury1,4 & Prasad Potluri1 & Gilles Lubineau3 &
Constantinos Soutis4
Received: 25 August 2016 /Accepted: 26 August 2016 /Published online: 26 September 2016# The Author(s) 2016. This article is published with open access at Springerlink.com
Abstract The effect of circular notch has been evaluated for three different architectures ofthree-dimensional (3D) carbon fibre woven composites (orthogonal, ORT; layer-to-layer, LTL;angle interlock, AI) through open-hole quasi-static tension and double-lap bearing strengthtests in the off-axis (45°) direction. Damage characterisation is monitored using Digital Imagecorrelation (DIC) for open-hole testing and X-ray Computed Tomography (CT) for double-lapbearing strength test. The off-axis notched 3D woven composites exhibits minor reduction(less than 10 %) of the notched strength compared to the un-notched strength. DIC straincontour clearly show stress/strain localisation regions around the hole periphery and stress/strain redistribution away from the whole due to the z-binder existence, especially for ORTarchitecture. Up to 50 % bearing strain, no significant difference in the bearing stress/bearingstrain response is observed. However when ORT architecture was loaded up to failure, itdemonstrates higher strain to failure (~140 %) followed by AI (~105 %) and lastly LTL(~85 %). X-ray CT scans reveal the effect of the z-binder architecture on damage evolution anddelamination resistance. The study suggests that off-axis loaded 3D woven composites,especially ORT architecture, has a great potential of overcoming the current challenges facingcomposite laminates when used in composite joints’ applications.
Appl Compos Mater (2017) 24:377–396DOI 10.1007/s10443-016-9529-9
* Mohamed Nasr [email protected]
* Constantinos [email protected]
1 Northwest Composite Centre, School of Materials, University of Manchester, Manchester M13 9PL,UK
2 Henry Moseley X-ray Imaging Facility, School of Materials, University of Manchester,Manchester M13 9PL, UK
3 Physical Sciences and Engineering Division, COHMAS Laboratory, King Abdullah University ofScience and Technology (KAUST), Thuwal 23955-6900, Saudi Arabia
4 Aerospace Research Institute, University of Manchester, Manchester M1 3NJ, UK

Keywords Three-dimensional (3D)wovencomposites .Digital image correlation (DIC) .X-raycomputed tomography (CT) . Damagemechanics
1 Introduction
Although composite laminates are characterised by high stiffness and strength to weight ratio(high specific stiffness and high specific strength), in real life application where joining structuresmade of composites laminates is essential, the ultimate strength and stiffness of the structure isdetermined by the joint strength and joining efficiency [1]. Mainly there are two different joiningtechniques for composite laminates, namely bonded joints and mechanically fastened joints;which are mainly achieved by bolting. Sometimes both techniques are combined to formbonded-bolted joints [2]. Several requirements for a successful joint design in service include:
– Material ductility/yieldingComposite materials are significantly less ductile than the types of metals used for
similar structural. The stress, usually, cannot be distributed around a stress concentrationregion such as a notch or a hole, which is common in joints.
– Notch insensitivityThe ultimate strength and stiffness of the metallic materials are not significantly
affected by notches or drilling holes. On the contrary, composite laminates exhibitapproximately 50 % reduction in strength as compared to their un-notched strength.
– High strain to failure and energy absorptionAs composite materials are brittle by nature, the energy absorbed up to final failure and
strain to failure is relatively small especially if the material is loaded along the fibre direction.
These previously highlighted challenges make composite materials more susceptible todamage and joint problems once in service especially with regards to inspection. The weak-nesses of composite laminates in the in-plane shear, transverse and inter-laminar shear drivethe design of composites to rely mainly on the notched (reduced) properties instead of utilisingthe un-notched excellent properties. Research has been done to address some of the highlight-ed issues, such as the notch sensitivity and stress redistribution. In order to alleviate the stressconcentration around holes in composite laminates, two methods were proposed and reportedin [1]. The first method is referred to as Softening Strip method [3] in which a strip of arelatively softer composite, several times the hole diameter, is inserted around the hole/notch.In this case, the less stiff inserted material helps reducing the stress concentration around thehole but there is no control on the load redistribution. On the contrary, the second method iscalled Stiffening Strip method [1]. In this method, a relatively stiffer material is inserted awayfrom the hole so that the load is attracted to that specific region. In the following section, typesof composites joints and their design considerations are discussed.
Previous studies focused on evaluating the effect of notches on the fracture toughness,strength as well as damage and failure mechanisms of both laminated [4, 5] and 2D wovencomposites [6, 7]. It was observed that the woven laminates exhibited more resistance todelamination and splitting compared to laminated composites. The undulating nature of thewoven fabric acted as crack stoppers in the sense that it prevented crack propagation within thematrix. This led to a notched strength that is higher for 2D woven laminates, compared tolaminated composites, which can be interpreted as less notch sensitivity [8, 9]. Further
378 Appl Compos Mater (2017) 24:377–396

enhancement for the notch strength and fracture toughness of composites was achieved byreplacing 2D woven by 3D woven composites as reported in [10, 11]. The through-thicknessbinder in 3D woven composites dramatically reduced the notch sensitivity of 3D wovencomposites and improved the fracture toughness and damage tolerance compared to 2D wovenlaminates. One recent study, by Dai et al. [12], investigated the notch sensitivity of CFRPcomposites of 3D orthogonal and 3D angle interlock woven composites tested in quasi-statictension and tension-tension fatigue. Both test categories focused on the on-axis loading; eitheralong the warp or the weft direction. Damage evolution was characterised and monitored usingDIC for quasi-static tension testing and infra-red camera for the fatigue testing. Moreover, theeffect of the notch size was addressed by comparing two different hole sizes with a diameter towidth ratio of 1/6 and 1/2 respectively. The study concluded that regardless of the hole size, thereduction in the strength of the investigated architectures did not exceed 17 % compared to theun-notched strength in the case of on-axis loading. Although 3D woven composites testedalong the warp or weft directions have been proven to be relatively notch insensitive [12, 13],nothing was reported with regards to the behaviour/sensitivity of 3D woven composites loadedalong the off-axis direction.
In spite of many studies investigating the bearing response of 2D laminated composites[14–21], the literature discussing the bearing response for 3D woven composites is quitesparse. Only one recent study by Warren et al. [22] investigated the bearing response of two3D woven architectures namely as layer-to-layer and orthogonal. The study extensivelyinvestigated the single-lap bearing response of these architectures and its dependency on theloading orientation using seven different orientations between warp (0o) and weft (90o)directions. In addition, the study focused on the double-lap bearing response of the samearchitectures along the warp direction. For the layer-to-layer architecture, two sizes of IM7carbon tows were used 12 k and 24 k respectively. The study concluded that 3D wovencomposites fail in non-catastrophic manner and the associated failure mode is bearing failure.The most dominant damage mechanisms were found to be matrix cracking and tow distortionaround the hole which caused some drop in the load. Changing the loading directionorientation in the single-lap bearing strength test led to stiffness reduction in the range of24.7 % to 32.7 % of the on-axis stiffness. The 24 k tow size increased slightly the bearingresponse compared to 12 k layer-to-layer and orthogonal architecture.
Thus, the objective of this study is to investigate the potential of utilising the off-axis loaded3D woven composites in design of composite joints through two main tests (open-hole tensionand double-lap bearing strength). The paper is divided into five sections. Section 2 details the3D woven architectures, composite manufacturing and cutting processes. Section 3 describesthe specimens’ preparation process and test setup (open-hole tensile test and double-lapbearing strength). Section 4 details the results and discusses the significance of the experi-mental observations (effect of z-binder on the notch sensitivity and the bearing response of 3Dwoven composites tested in the off-axis direction as well as damage progression). Finally,section 5 summarises the main concluding remarks of the paper suggesting the potential ofutilising 3D woven composites in composite joints’ applications.
2 Materials and Manufacturing
The carbon fibre, used in this study, is HexTow IM7 (Hexcel), while the epoxy is MTM 57(medium temperature epoxy produced by Solvay). The 3D woven dry fabrics are produced by
Appl Compos Mater (2017) 24:377–396 379

Sigmatex UK. Three architectures are investigated, namely orthogonal (ORT), layer-to-layer(LTL) and angle interlock (AI). Figure 1 shows the schematic architecture of the three 3Dwoven fabrics drawn using TexGen software. Specification of the textile architecture param-eters of 3D woven composites are detailed in Table 1. Warp and weft fibre count for ORT, AIand LTL is 12 k. The z-binder fibre count for ORT, AI and LTL is 6 k, 6 k and 12 k,respectively. The number of warp threads, weft threads and z-binder threads per unit length(centimetre) is specified in Table 1 as ends/cm, picks/cm and binders/cm, respectively. Inaddition, the areal density of the dry 3D woven fabric is also given in Table 1 (unit is g/m2).
To produce 3D woven composite panels, the dry fabrics were infused by MTM 57 epoxymatrix using resin film infusion (RFI) process. Infusion process was carried out at 70 °C for1 h, while curing process was done at 120 °C for 1 H. minimum curing pressure for MTM 57was set to 2.8 bars. Once the 3D woven composite panels with the size of 300 mm × 200 mmwere cured, they were cut at 45° orientation to produce the off-axis specimens for both open-hole and bearing strength tests. Thickness of cured composite panels ranges between 3.2 to3.6 mm depending on the warp and weft number of layers.
3 Testing and Characterisation
3.1 Open-Hole Tension
According to the ASTM standard D5766 BTest Method for Open-Hole Tensile Strength ofPolymer Matrix Composite Laminates^ [23], the suggested specimen dimension is200 × 36 mm2 with a hole diameter of 6 mm. In this case, the diameter-to-width ratio (d/w)is 1/6. However, the suggested specimen dimension is not entirely followed here. The
Fig. 1 Schematics of 3D woven composites: (a) ORT, (b) LTL, (c) AI
380 Appl Compos Mater (2017) 24:377–396

objective of the study is to compare the notched strength of the off-axis 3D woven specimensagainst the un-notched ones. Since the un-notched specimens were standard tensile couponspecimens, the nominal dimension is 250 × 25 mm2, thus, the open-hole tensile specimenswere cut with the same dimension but the ratio between the hole diameter and specimen width(d/w) was kept as 1/6 according to the standard. It is worth mentioning here that this was theonly modification made to the testing method D5766.
3.1.1 Specimen Preparation
Before the drilling process, area to be drilled was ‘sandwiched’ between two small glass/epoxyplates with tapes in order to minimise the damage around the hole rims. The hole of 4.16 mmdiameter was made by CNC lathe machine (VMX42SR, Hurco). The drilling process wascarried out in water-cooled environment at 3000 rpm starting with 2 mm hole. Then, the holewas reamed until the diameter reached 4.16 mm. For Digital Image Correlation (DIC), specklepattern was applied on the area of 50 mm × 25 mm in the middle of specimen. Two coats ofwhite spray paint were applied on the surface. Upon drying, black paint was sprayed over thewhite surface forming the speckle pattern.
3.1.2 Test Setup
The open-hole tensile test was conducted, with a 2 mm/min displacement-controlled rate, forall the off-axis architectures (ORT, LTL and AI). DIC was used, as a non-contact strainmeasurement device, to capture the strain contour map over the specimens’ surface andintensity around the hole. Figure 2 shows the test setup and the speckle pattern around thehole. Strains were acquired using DIC system utilising SensiCam 12-bit CCD camera (PCO)with TC-2336 bi-telecentric lenses (The Telecentric Company) shown in Fig. 2a. CamWareV3.11 software was used to capture the speckle pattern images (exemplified in Fig. 2b)acquired from the CCD camera. All tests were performed in a controlled environment wherethe temperature was 21 °C and the relative humidity (RH) was 45 %. The speckle images werethen processed using Vic 2D. In processing these images, the subset size was 101 × 101 pixels.Similar settings were reported to be adequate for woven specimens [24, 25]. In addition, thestep size (distance between subsets) was set to 5 pixels. The observation window of approx-imately 25 × 22 mm2 produced an image with dimensions of 1040 × 896 pixels. Global meanvalues of strains (εxx;εyy;εxy) are obtained from DIC analysis using Vic 2D.
Table 1 Specification of textilearchitecture of 3D wovencomposites
Parameter ORT LTL AI
Warp fibre count 12 k 12 k 12 k
Weft fibre count 12 k 12 k 12 k
z-binder fibre count 6 k 12 k 6 k
Ends/cm (warp) 31.52 17.73 31.52
Picks/cm (weft) 38.00 36.00 34.00
Binders/cm (z-binder) 3.94 17.73 3.94
Areal density (g/m2) 3353 3260 3044
Appl Compos Mater (2017) 24:377–396 381

3.2 Double-Lap Bearing Strength
3.2.1 Testing Procedure
The single-fastener double-lap bearing strength test is conducted according to BProcedure A^of the ASTM standards D5961 BBearing Response of Polymer Matrix Composite Laminates^.The specimen dimensions are (135 × 36 mm2) with a hole diameter of 6 mm and an enddistance of 18 mm; so the diameter to width ratio (d/w) is (1/6). The drilling was carried outwith a steel-tipped drill bit. The fastening torque applied is 2.8 N.m which is again within therecommended range of the ASTM standard (2.2 N. M to 3.4 N.m). With a 2 mm/mindisplacement-controlled rate, the test was conducted for all the off-axis architectures (ORT,LTL and AI). Axial Video Extensometer (AVE) was used, as a non-contact strain measurementdevice, to capture the strain throughout the whole test. A schematic of the test setup is shownin Fig. 3. All tests were performed in a controlled environment where the temperature was21 °C and the relative humidity (RH) was 45 %. It is recommended by the standards to stop thetest at 50 % strain in order not to mask the failure mode of the specimens. However, in thisstudy, there was an interest in calculating the energy absorption up to final failure of the joint.Thus, five specimens were tested for ORT, LTL and AI resulting in fifteen specimens in total.Three of those five were tested only up to 50 % strain to be able to evaluate the failure modewhile the other two were tested up to final failure.
3.2.2 X-Ray CT Setup
The damaged 3D woven composite samples (ORT, LTL and AI) were examined using X-rayCT. Dye penetrant was employed to enhance the contrast between damaged volume (air) andthe bulk composite prior to X-ray CT imaging. The dye penetrant consisted of 250 g zinciodide, 80 ml distilled water, 80 ml isopropyl alcohol and 1 ml Kodak photoflow. The sampleswere soaked in the dye penetrant solution for 24 h in order to allow sufficient penetration intoall connected damage. X-ray CT scanning was performed on the Nikon XTH 225 CT scannerin Henry Moseley X-ray Imaging Facility. Tungsten target was used and the acceleratingvoltage and current were set to 100 kV and 70 μA respectively. The exposure time for each
Fig. 2 Open hole tension (a) Test setup (the hole has been highlighted for clarification), (b) Typical specklepattern around the hole
382 Appl Compos Mater (2017) 24:377–396
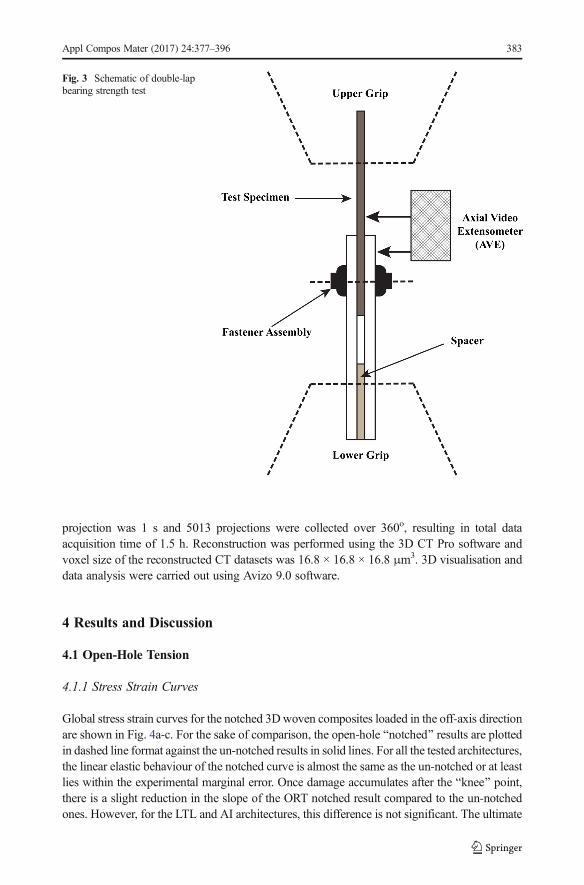
projection was 1 s and 5013 projections were collected over 360o, resulting in total dataacquisition time of 1.5 h. Reconstruction was performed using the 3D CT Pro software andvoxel size of the reconstructed CT datasets was 16.8 × 16.8 × 16.8 μm3. 3D visualisation anddata analysis were carried out using Avizo 9.0 software.
4 Results and Discussion
4.1 Open-Hole Tension
4.1.1 Stress Strain Curves
Global stress strain curves for the notched 3Dwoven composites loaded in the off-axis directionare shown in Fig. 4a-c. For the sake of comparison, the open-hole Bnotched^ results are plottedin dashed line format against the un-notched results in solid lines. For all the tested architectures,the linear elastic behaviour of the notched curve is almost the same as the un-notched or at leastlies within the experimental marginal error. Once damage accumulates after the Bknee^ point,there is a slight reduction in the slope of the ORT notched result compared to the un-notchedones. However, for the LTL and AI architectures, this difference is not significant. The ultimate
Fig. 3 Schematic of double-lapbearing strength test
Appl Compos Mater (2017) 24:377–396 383
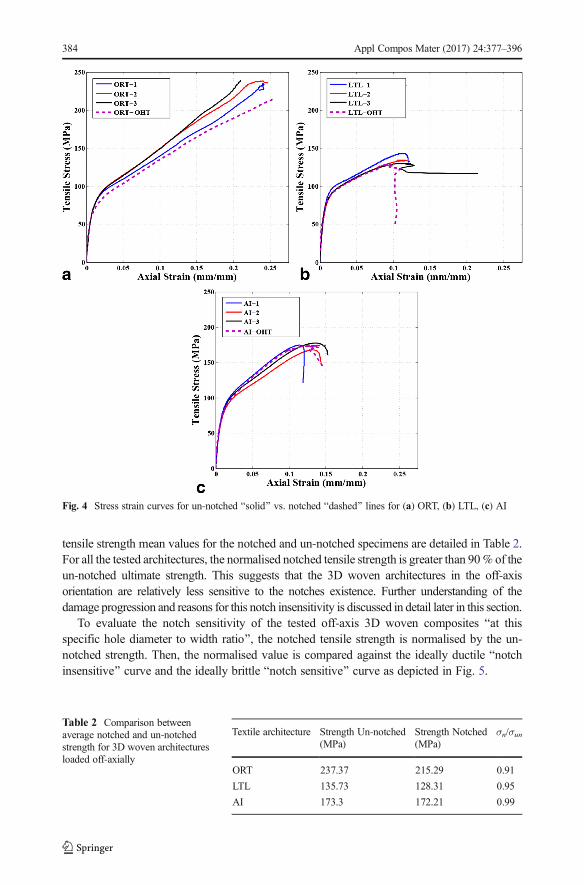
tensile strength mean values for the notched and un-notched specimens are detailed in Table 2.For all the tested architectures, the normalised notched tensile strength is greater than 90% of theun-notched ultimate strength. This suggests that the 3D woven architectures in the off-axisorientation are relatively less sensitive to the notches existence. Further understanding of thedamage progression and reasons for this notch insensitivity is discussed in detail later in this section.
To evaluate the notch sensitivity of the tested off-axis 3D woven composites Bat thisspecific hole diameter to width ratio^, the notched tensile strength is normalised by the un-notched strength. Then, the normalised value is compared against the ideally ductile Bnotchinsensitive^ curve and the ideally brittle Bnotch sensitive^ curve as depicted in Fig. 5.
Fig. 4 Stress strain curves for un-notched Bsolid^ vs. notched Bdashed^ lines for (a) ORT, (b) LTL, (c) AI
Table 2 Comparison betweenaverage notched and un-notchedstrength for 3D woven architecturesloaded off-axially
Textile architecture Strength Un-notched(MPa)
Strength Notched(MPa)
σn/σun
ORT 237.37 215.29 0.91
LTL 135.73 128.31 0.95
AI 173.3 172.21 0.99
384 Appl Compos Mater (2017) 24:377–396

Equations for calculating the notch sensitive and notch insensitive responses [26] are detailedas follows:
& Notch insensitive (ductile materials)
σn=σun ¼ 1− D=Wð Þ ð1Þ
Where:
(σn) The notched tensile strength(σun) The un-notched tensile strength(D) The hole diameter(W) The specimen width& Notch sensitive (brittle materials)
σn=σun ¼ 1− D=Wð Þ½ �=KT ð2ÞWhere:
KT ¼ 2þ 1− D=Wð Þ½ �3 ð3Þ
It is clear from the comparison shown in Table 2 that all the three 3D woven architecturesare notch insensitive when loaded in the off-axis orientation for this specific diameter to widthratio. This behaviour can be attributed to two reasons. The first reason is common even forlaminated composites which is the lay-up orientation in that case. And the fact that the testedarchitectures are 3D woven composites is not significantly affecting the behaviour. However,the second reason is the effect of the binder existence which typically distinguishes 3D wovencomposites from their 2D laminated counterparts. To elaborate more on those two reasons, thechange of the lay-up orientation from (0/90) to (±45) directly affects the Stress Concentration
Fig. 5 Notch sensitivity/normalised strength in off-axiscomposites
Appl Compos Mater (2017) 24:377–396 385

Factor (SCF) at the notch Bhole^. For an isotropic material, the SCF of a hole in an infinite plate[27] is approximately 3. Composites are not isotropic in nature; actually they are anisotropicmaterial systems in which the material response is completely dependent on the lay-up. Fororthotropic laminates loaded at an angle from their principal directions [1], the SCF variesbetween (0 to 8) times the global stress applied. This is explained further by applying the stresstransformation tensor to the global stress taking into consideration the angle between theloading direction and the lamina principal directions. The off-axis (±45) orientation reducesthe global stress concentration to approximately 1.7 times the global stress; which means lesssensitivity to the notch Bhole^ presence. In addition, 3D woven composites are characterisedby out-of-plane binding yarns that holds the in-plane yarns. In the case of notched specimensthose binding yarns play a major role in supressing delamination and damage evolution as wellas stress redistribution on wider areas as reported previously in [25] and will be elaborated morein the following section.
Remark:
& The relative notch Bsize/diameter^ to the unit-cell size of 3D woven architectures is animportant parameter that should be investigated as it may affect the response of thosematerial systems. Due to material shortage, only one notch size was considered in thisstudy and it was less than the unit-cell size for all architectures ORT, LTL and AI.
4.1.2 Damage Evolution
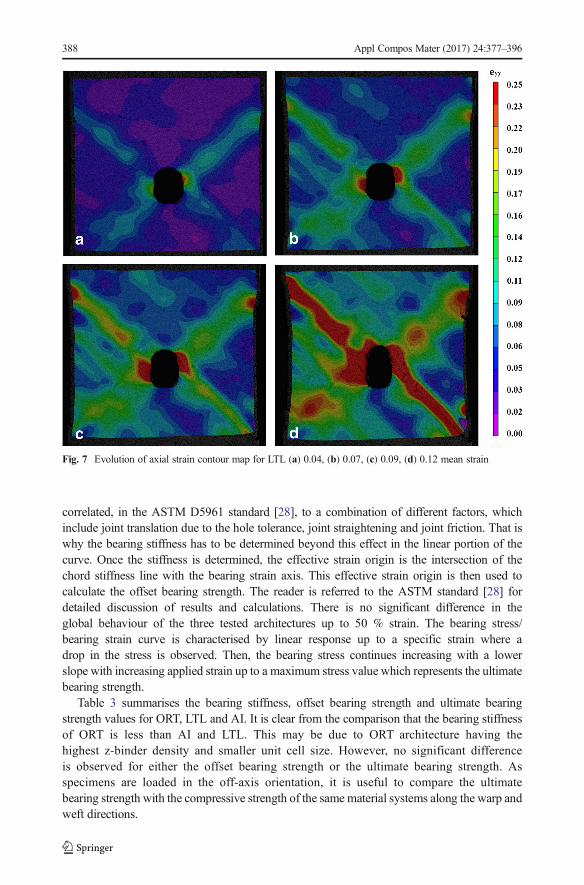
Analysis of the DIC images Figs. 6, 7 and 8 better explains the strain/ stress distribution anddamage evolution in all the notched 3D woven architectures loaded in the off-axis direction atvarious loading levels. At the very early loading levels ~5 % strain (Figs. 6a, 7a and 8a), thestrain distribution shows that the localised strain/stress regions do not only exist around thehole edge but also at the interlacement points between the binding yarns and the weft yarns ofthe 3D woven composites. Regions of localised strain in all architectures lie on the (±45o)directions.
When the load is increased, the stress concentration regions in all the architectures can befound only at the notch Bhole^ tip. This is clear in (Figs. 6b, 7b and 8b) where the red regionsare highlighted. Due to this stress concentration, damage and cracking initiates in the formof matrix cracking. Although at that stage the global strain applied does not exceed 10 %,very high strain values (> 25 %) is observed around the hole edge which indicates theregions of stress concentration and eventually the premature damage. It is worth mentioninghere that those strain/stress concentration regions captured by the DIC suggests that thelevel of damage is even higher than the induced damage due to the free-edge cracking at thatstage of loading.
Upon load increase, the damage zone expands along the (±45) direction (Figs. 6c, 7c and 8c)in the form of matrix cracking and delamination until they are arrested by binding yarns. This isone major difference in the damage evolution between 3Dwoven and laminated composites. Inlaminated composites, those (±45) matrix cracking and delamination extend across the speci-men width and lead to final fracture of the specimens in an instantaneous catastrophic manner[26] while in 3D woven composites, the damage evolution is more progressive damage anddoes not lead to catastrophic fracture. Finally before failure (Figs. 6d, 7d and 8d), the ORTarchitecture is different from the other architectures in the sense that strain/stress is redistributed
386 Appl Compos Mater (2017) 24:377–396

over a larger area of the specimen unlike the AI and LTLwhere the damage spans along a (±45)degree line and causes final fracture without being arrested by the binders. To be more precise,damage progression and cracking cause the binder to fracture which leads to the final failure ofthose architectures. Through the whole test, the hole elongation is properly captured by the DICsystem as shown in (Figs. 6, 7 and 8).
Optical images for the surfaces of the three tested architectures (Fig. 9a-c), just rightbefore fracture, demonstrate excessive hole elongation, matrix cracking and inter-yarndelamination in the form of ply separation and free-edge cracking around the hole andat the edges of the specimens. Again, it is clear that due to the higher binders densityin the ORT architecture, the matrix cracking and delamination are arrested and do notextend along the whole span of the specimens’ width as is the case in the LTL and AIarchitectures.
4.2 Double-Lap Bearing Strength
4.2.1 Stress Strain Curves
The global bearing stress/bearing strain curves for the 3D woven composites loaded in the off-axis direction, up to 50 % strain, are shown in Fig. 10a-c. The initial portion of the bearingstress/bearing strain curves, for all architectures, exhibits a non-linear behaviour which is
Fig. 6 Evolution of axial strain contour map for ORT (a) 0.05, (b) 0.09, (c) 0.11, (d) 0.18 mean strain
Appl Compos Mater (2017) 24:377–396 387
correlated, in the ASTM D5961 standard [28], to a combination of different factors, whichinclude joint translation due to the hole tolerance, joint straightening and joint friction. That iswhy the bearing stiffness has to be determined beyond this effect in the linear portion of thecurve. Once the stiffness is determined, the effective strain origin is the intersection of thechord stiffness line with the bearing strain axis. This effective strain origin is then used tocalculate the offset bearing strength. The reader is referred to the ASTM standard [28] fordetailed discussion of results and calculations. There is no significant difference in theglobal behaviour of the three tested architectures up to 50 % strain. The bearing stress/bearing strain curve is characterised by linear response up to a specific strain where adrop in the stress is observed. Then, the bearing stress continues increasing with a lowerslope with increasing applied strain up to a maximum stress value which represents the ultimatebearing strength.
Table 3 summarises the bearing stiffness, offset bearing strength and ultimate bearingstrength values for ORT, LTL and AI. It is clear from the comparison that the bearing stiffnessof ORT is less than AI and LTL. This may be due to ORT architecture having thehighest z-binder density and smaller unit cell size. However, no significant differenceis observed for either the offset bearing strength or the ultimate bearing strength. Asspecimens are loaded in the off-axis orientation, it is useful to compare the ultimatebearing strength with the compressive strength of the same material systems along the warp andweft directions.
Fig. 7 Evolution of axial strain contour map for LTL (a) 0.04, (b) 0.07, (c) 0.09, (d) 0.12 mean strain
388 Appl Compos Mater (2017) 24:377–396

The 2D stress transformation for a plane-stress case (see Fig. 11a) is used here to transformthe global (x, y) ultimate bearing strength into the local Bwarp and weft^ directions (1, 2).
σ1
σ2
τ12
9=; ¼ T1½ �
σx
σy
τ xy
9=;
8<:
8<: ð4Þ
where [T1] is the stress transformation matrix (a second-order tensor)
Fig. 9 Optical surface images at failure for (a) ORT, (b) LTL, (c) AI
Fig. 8 Evolution of axial strain contour map for AI (a) 0.06, (b) 0.10, (c) 0.12, (d) 0.15 mean strain
Appl Compos Mater (2017) 24:377–396 389

T 1½ � ¼m2 n2 2mnn2 m2 −2mn−mn mn m2−n2
24
35 ð5Þ
where: m = cos (θ) , n = sin (θ) and θ = 45o. Substituting Eq. 5 equation into Eq. 4 leads to thefollowing system of equations (Eq. 6) for the stresses in principal Blocal^ coordinate systemwhich are the warp and weft directions respectively.
σ1 ¼ m2σx þ n2σy þ 2mnτxyσ2 ¼ n2σx þ m2σy−2mnτ xyτ12 ¼ −mnσx þ mnσy þ m2−n2
� �τxy
ð6Þ
Fig. 10 Bearing stress vs. bearing strain curves up to 50 % strain for (a) ORT, (b) LTL, (c) AI
Table 3 Summary of bearing stiffness and strength for ORT, LTL and AI
Textile architecture Bearing stiffness (GPa) Offset bearing strength (MPa) Ultimate bearing strength (MPa)
ORT 3.48 ± 0.02 429.63 ± 57.53 658.67 ± 27.62
LTL 5.32 ± 0.23 466.97 ± 33.06 677.33 ± 22.95
AI 5.26 ± 0.09 456.90 ± 38.33 683.33 ± 9.39
390 Appl Compos Mater (2017) 24:377–396

In the case of bearing strength test, the global applied load is only axial (σx ≠ 0) whichreduces Eq. 6 to Eq. 7 in the local coordinate system (1, 2) as follows:
σ1 ¼ m2σx
σ2 ¼ n2σx
τ12 ¼ −mnσx
ð7Þ
Then, the transformed stress obtained are compared against the ultimate compressive strength(see Fig. 11b) of the same material systems tested experimentally along the warp and the weftdirections in a standard compression test according to ASTMD3410 BCompressive Properties ofPolymer Matrix Composite Materials with Unsupported Gage Section by Shear Loading^. Forall the tested architectures, the stress at failure in the local coordinate system Bwarp/weft^exceeds the strength of the material either in the warp or the weft directions (see Table 4).
The next step was to investigate the bearing response of ORT, LTL and AI up to final failure.Global bearing stress/ bearing strain curves are depicted in Fig. 12. Although there is nosignificant difference between all the architectures up to 50 % strain, the response is differentup to failure. It is obvious that the LTL architecture fails first (~85 % strain) followed by the AI(~105 % strain) and finally ORT (~140 % strain). This higher strain to failure is associated withhigher energy absorption for ORT (~760 MJ/m3) as opposed to AI (~590 MJ/m3) and finallyLTL (~490MJ/m3). This suggests that the damage progression is different depending on the 3D
Fig. 11 Transformed bearing strength: (a) schematic of coordinate system transformation, (b) comparison withcompressive strength in warp and weft directions
Table 4 Comparison of transformed bearing strength against warp and weft compressive strength for ORT, LTLand AI
Textile architecture Warp compressive strength(MPa)
Transformed bearing strength(MPa)
Weft compressive strength(MPa)
ORT 310 ± 4.18 329.33 ± 13.81 365.33 ± 4.5
LTL 302 ± 26.9 338.67 ± 11.48 335 ± 27.3
AI 333 ± 22.4 341.67 ± 4.70 372 ± 54.42
Appl Compos Mater (2017) 24:377–396 391
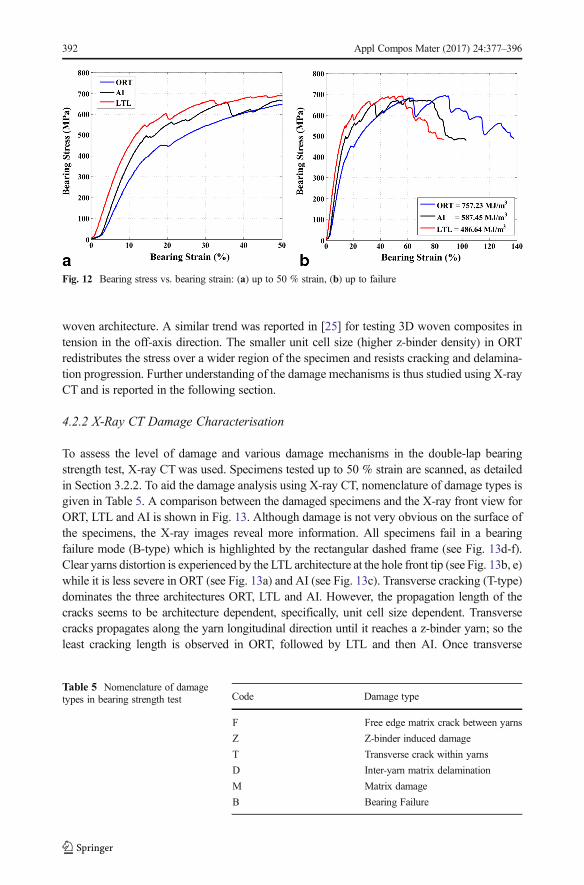
woven architecture. A similar trend was reported in [25] for testing 3D woven composites intension in the off-axis direction. The smaller unit cell size (higher z-binder density) in ORTredistributes the stress over a wider region of the specimen and resists cracking and delamina-tion progression. Further understanding of the damage mechanisms is thus studied using X-rayCT and is reported in the following section.
4.2.2 X-Ray CT Damage Characterisation
To assess the level of damage and various damage mechanisms in the double-lap bearingstrength test, X-ray CT was used. Specimens tested up to 50 % strain are scanned, as detailedin Section 3.2.2. To aid the damage analysis using X-ray CT, nomenclature of damage types isgiven in Table 5. A comparison between the damaged specimens and the X-ray front view forORT, LTL and AI is shown in Fig. 13. Although damage is not very obvious on the surface ofthe specimens, the X-ray images reveal more information. All specimens fail in a bearingfailure mode (B-type) which is highlighted by the rectangular dashed frame (see Fig. 13d-f).Clear yarns distortion is experienced by the LTL architecture at the hole front tip (see Fig. 13b, e)while it is less severe in ORT (see Fig. 13a) and AI (see Fig. 13c). Transverse cracking (T-type)dominates the three architectures ORT, LTL and AI. However, the propagation length of thecracks seems to be architecture dependent, specifically, unit cell size dependent. Transversecracks propagates along the yarn longitudinal direction until it reaches a z-binder yarn; so theleast cracking length is observed in ORT, followed by LTL and then AI. Once transverse
Fig. 12 Bearing stress vs. bearing strain: (a) up to 50 % strain, (b) up to failure
Table 5 Nomenclature of damagetypes in bearing strength test Code Damage type
F Free edge matrix crack between yarns
Z Z-binder induced damage
T Transverse crack within yarns
D Inter-yarn matrix delamination
M Matrix damage
B Bearing Failure
392 Appl Compos Mater (2017) 24:377–396

cracking is suppressed by the z-binder yarns, another damage mechanism is observed in theform of z-binder induced damage (Z-type).
After reconstruction of the 2D scanned slices, the 3D volume of the damage specimens isvisualised in (Fig. 14b–f). The size of the B-type damaged region is the largest in the LTLarchitecture, smaller in AI and the smallest in ORT. Although all specimens are deformed withthe same strain level, Fig. 14b–f suggests that ORT has the highest resistance to deformationfollowed by AI and finally LTL. This supports the argument that the smaller unit cell size ofthe ORT fibre architecture (higher z-binder density) redistributes the stress over a wider regionand resists cracking and delamination propagation.
The next step is to virtually cut a sectioning plane along the warp direction to reveal thedamage along the z-binder path (see Fig. 14b–f) in the 3D reconstructed volume. In allarchitectures, bearing failure with extensive matrix crushing and damage (type-M) is observedat the hole periphery in the loading direction Bbearing plane^. In addition, free edge cracking(type-F) is common in all architectures. In case of ORT (see Fig. 14a) and AI (see Fig. 14e),the through-thickness binder prevents the delamination (type-D) from growing across thewidth of the specimen. On the contrary, the z-binding yarns in LTL (see Fig. 14c) guide thedelamination (type-D) along their path. In regions where z-binding yarns do not exist,delamination (type-D) grows across the specimen width, even in ORT and AI architectures.This indicates that the z-binder architecture plays a major role in determining the damage pathin 3D woven composites and consequently their damage resistance and global stress/strainresponse.
5 Concluding Remarks
The notched response of 3D woven composites, in the off-axis orientation, has been studied byopen hole tension and double-lap bearing strength tests. For open hole test, the global stress
Fig. 13 At 50 % strain: (a, b, c) damaged specimens, (d, e, f) X-ray front view for ORT, LTL and AIrespectively
Appl Compos Mater (2017) 24:377–396 393

strain response suggests that all 3D woven architectures (ORT, LTL, and AI) are notchinsensitive. The final failure of all the 3D woven architectures in the off-axis direction isprogressive failure not catastrophic brittle fracture. Out of all the tested architectures, ORTarchitecture in the off-axis orientation exhibits higher ultimate strength and strain to failure as itwas the case for the un-notched specimens. From the DIC analysis, the ORT architectureredistributes the stress over a wider region away from the hole which reduces the stressconcentration at the notch periphery. In addition, the higher intensity of binding yarns actsas crack stoppers for delamination and matrix cracking. For double-lap bearing strength test upto 50 % strain, no significant variation in the global bearing stress/bearing strain response wasobserved as all of them failed in a bearing failure mode. However, X-ray CT damagecharacterisation revealed the effect of the z-binder architecture on the damage mechanismsand delamination propagation. The dominant damage mechanisms include matrix crushing,extensive delamination, transverse cracking and z-binder induced damage. Loading specimens
Fig. 14 X-ray CT scans: (a, c, e) virtual sectioning along the warp direction, (b, d, f) isometric 3D volume forORT, LTL and AI respectively
394 Appl Compos Mater (2017) 24:377–396
up to failure showed that the ORT architecture in the off-axis direction resists deformation anddamage progression followed by AI and finally LTL. This suggested that in addition to the unitcell size effect, having a through-thickness binder (ORT and AI) can suppress delaminationand delay final failure. On the contrary, delamination progression is guided by the z-bindingyarns between layers which led to final failure of LTL architecture. This is reflected on theenergy absorption of ORT being the highest, followed by AI and finally LTL. Thus, 3D wovencomposites in the off-axis orientation, especially ORT, demonstrate a potential of overcomingsome of the major challenges facing composite joints’ applications which are: high energyabsorption, stress redistribution away from the notch and notch insensitivity.
Acknowledgements Authors would like to acknowledge the financial support from University of Manchester(UoM) and from Baseline Research Funds fromKing Abdullah University of Science and Technology (KAUST).We also acknowledge the technical support from the National Composites Certification and Evaluation Facility(NCCEF).
Open Access This article is distributed under the terms of the Creative Commons Attribution 4.0 InternationalLicense (http://creativecommons.org/licenses/by/4.0/), which permits unrestricted use, distribution, and repro-duction in any medium, provided you give appropriate credit to the original author(s) and the source, provide alink to the Creative Commons license, and indicate if changes were made.
References
1. Jones, R.: Mechanics of composite materials. (1998)2. Kelly G.: Load transfer in hybrid (bonded/bolted) composite single-lap joints. Compos. Struct. 69, 35–43
(2005)3. Sun C.T., Luo J.: Failure loads for notched graphite/epoxy laminates with a softening strip. Compos. Sci.
Technol. 22, 121–133 (1985)4. Awerbuch J., Madhukar M.S.: Notched strength of composite laminates: predictions and experiments &
mdash - a review. J. Reinf. Plast. Compos. Reinf. 4, 3–159 (1985)5. Wang J., Callus P.J., Bannister M.K.: Experimental and numerical investigation of the tension and compres-
sion strength of un-notched and notched quasi-isotropic laminates. Compos. Struct. 64, 297–306 (2004)6. Yudhanto A., Watanabe N., Iwahori Y., Hoshi H.: The effects of stitch orientation on the tensile and open
hole tension properties of carbon/epoxy plain weave laminates. Mater. Des. 35, 563–571 (2012)7. Yudhanto A., Iwahori Y., Watanabe N., Hoshi H.: Open hole fatigue characteristics and damage growth of
stitched plain weave carbon/epoxy laminates. Int. J. Fatigue. 43, 12–22 (2012)8. Naik N.K., Shembekar P.S., Verma M.K.: On the influence of stacking sequence on notch sensitivity of
fabric laminates. J. Compos. Mater. 24, 838–852 (1990)9. Shembekar P.S., Naik N.K.: Notched strength of fabric laminates. II: Effect of stacking sequence. Compos.
Sci. Technol. 44, 13–20 (1992)10. Cox B.N., Dadkhah M.S., Morris W.L.: On the tensile failure of 3D woven composites. Compos. Part A
Appl. Sci. Manuf. 27, 447–458 (1996)11. Tsai K.H., Chiu C.H., Wu T.H.: Fatigue behavior of 3D multi-layer angle interlock woven composite plates.
Compos. Sci. Technol. 60, 241–248 (2000)12. Dai S., Cunningham P.R., Marshall S., Silva C.: Open hole quasi-static and fatigue characterisation of 3D
woven composites. Compos. Struct. 131, 765–774 (2015)13. Mubeen, A.: Damage Tolerance of 3D Woven Composites with Weft Binders. (2014).14. Ataş A., Soutis C.: Strength prediction of bolted joints in CFRP composite laminates using cohesive zone
elements. Compos. Part B Eng. 58, 25–34 (2014)15. Ataş A., Soutis C.: Subcritical damage mechanisms of bolted joints in CFRP composite laminates. Compos.
Part B Eng. 54, 20–27 (2013)16. Atas, A.: Strength Prediction of Mechanical Joints in Composite Laminates Based on Subcritical Damage
Modelling. (2012)17. Kelly G., Hallström S.: Bearing strength of carbon fibre/epoxy laminates: effects of bolt-hole clearance.
Compos. Part B Eng. 35, 331–343 (2004)
Appl Compos Mater (2017) 24:377–396 395
18. Khashaba U.A., Sebaey T.A., Alnefaie K.A.: Failure and reliability analysis of pinned-joints compositelaminates: Effects of stacking sequences. Compos. Part B Eng. 45, 1694–1703 (2013)
19. Öndürücü A., Esendemir Ü., Tunay R.F.: Progressive failure analysis of glass-epoxy laminated compositepinned-joints. Mater. Des. 36, 617–625 (2012)
20. Pisano A.A., Fuschi P.: Mechanically fastened joints in composite laminates: Evaluation of load bearingcapacity. Compos. Part B Eng. 42, 949–961 (2011)
21. Thoppul S.D., Finegan J., Gibson R.F.: Mechanics of mechanically fastened joints in polymer-matrixcomposite structures - a review. Compos. Sci. Technol. 69, 301–329 (2009)
22. Warren K.C., Lopez-Anido R.A., Goering J.: Behavior of three-dimensional woven carbon composites insingle-bolt bearing. Compos. Struct. 127, 175–184 (2015)
23. ASTM D5677: Standard Test Method for Open-Hole Tensile Strength of Polymer Matrix Composite. (2013)24. Saleh M.N., Lubineau G., Potluri P., Withers P.J., Soutis C.: Micro-mechanics based damage mechanics for
3D orthogonal woven composites: experiment and numerical modelling. Compos. Struct. 3–12, (2016)25. Saleh, M.N., Yudhanto, A., Potluri, P., Lubineau, G., Soutis, C.: Characterising the loading direction
sensitivity of 3D woven composites: effect of z-binder architecture. Compos. Part A Appl. Sci. Manuf. 90,577–588 (2016)
26. Callus P.J.: The effects of hole-size and environment on the mechanical behaviour of a quasi-isotropic AS4 /3501–6 laminate in tension. Compression and bending. DSOT (Defence Science and TechnologyOrganization) Austrlaian Government Department of Defence, Victoria. http://dspace.dsto.defence.gov.au/dspace/handle/1947/9030 (2007). Accessed 11 April 2016
27. Yang Q.Q., Gao C.F., Chen W.T.: Stress concentration in a finite functionally graded material plate. Sci.China Phys. Mech. Astron. 55, 1263–1271 (2012)
28. ASTMD5961: Standard Test Method for Bearing Response of Polymer Matrix Composite Laminates. (2003)
396 Appl Compos Mater (2017) 24:377–396