investigating laser scanner accuracy · 2005-01-31 · investigating laser scanner accuracy...
TRANSCRIPT

INVESTIGATING LASER SCANNER ACCURACY
ORIGINALLY PRESENTED AT THE XIXth CIPA SYMPOSIUM AT ANTALYA, TURKEY, 30 SEP – 4 OCT 2003UPDATED FOR WEB PRESENTATION OCTOBER 2003
W. Boehler, M. Bordas Vicent, A. Marbs
i3mainz, Institute for Spatial Information and Surveying Technology, FH Mainz, Holzstrasse 36, 55116 Mainz, Germany,[email protected]
Working Group 6
KEY WORDS: Laser Scanning, 3D Scanning, Close Range, Instruments, Accuracy, Calibration, Architectural HeritageConservation,
ABSTRACT:
Laser scanners have become very popular for cultural heritage documentation. A main advantage as compared to close range photo-grammetry is the availability of near real time 3D coordinates for irregular surfaces. The striking capability of collecting hundreds oreven thousands of points per second is praised by producers and operators. On the other hand, questions concerning the quality andaccuracy of the recorded points receive little attention. Specifications stated by the producers are not comparable. In a researchproject, i3mainz has installed a number of different test targets that allow an investigation in the quality of points recorded by laserscanners and the geometric models derived from the point clouds. The standardized tests also allow a comparison betweeninstruments of many different manufacturers for the first time. The test procedures include scans of plane surfaces of differentreflectivity in different distances. When these point clouds are replaced by a best fitting plane, the same measurements can be used toget an indication of the noise of the range measurements. In a similar set-up, a test is performed to find out if different materialscause a systematic range offset. Several test fields using white spheres as targets have been installed to get information about theaccuracy of distances in scanning direction and across. Short distances are verified using an interferometric comparator; the truevalues of longer distances rely on precision surveying methods. Due to different grid widths and spot sizes, not all 3D scanners havethe same abilities to resolve small object details. They are also known to produce errors at edges. Both phenomena are tested withappropriate targets in order to find out how different instruments deal with these problems. The tests are still available and producersand users are invited to have their instruments examined.
1. INTRODUCTION
Surveying results must meet certain specifications in order toprovide the necessary accuracy standards for a certainapplication. On the other hand, if instruments and methods areused which yield an accuracy far above the needed standard,this will result in unnecessary cost and expenditure. Therefore,any geometric surveying task comprises not only the derivationof the relative positions of points and objects but also anestimation of the accuracy of the results. Least squaresadjustment based on overdetermination usually yields a reliableinformation concerning the accuracy of the results as well as theaccuracy of the observations. If the number of observations isnot sufficient for an adjustment, one may estimate the accuracyof the results by propagating the errors of the observationinstruments to the results. In this case, the accuracy of themeasurement device has to be known.
In the case of laser scanners, a large number of 3D coordinateson an object’s surface is measured in a very short time.Important object features, such as corner points or edges, arenot directly recorded; instead they have to be modeled from thepoint clouds in a separate process. While it is possible to recordthe same object several times from different observation points,it is impossible to record the very same points in these repeatedsurveys. Therefore, deviations can only be noticed after objectshave been extracted from the point clouds and modeled. If thegeometric properties of the object are known, however, the
deviation of single points from the object’s surface may be anindication for the accuracy. Using a plane surface would be thesimplest case, but cylinders or spheres can also be considered.
2. ACCURACY OF LASER SCANNERS
2.1 General remarks
The accuracy specifications given by laser scanner producers intheir publications and pamphlets are not comparable. Ex-perience shows that sometimes these should not be trusted andthat the accuracy of these instruments which are built in smallseries varies from instrument to instrument and depends on theindividual calibration and the care that has been taken inhandling the instrument since.
Every point cloud produced by a laser scanner contains aconsiderable number of points that show gross errors. If thepoint cloud is delivered as a result of surveying, a qualityguarantee, as possible for other surveying instruments, methods,and results, cannot be given.
Many institutions have already published methods and resultsconcerning accuracy tests with laser scanners (e.g. Balzani et.al. 2001, Johansson 2002, Kern 2003, Lichti et. al. 2000, 2002).Based on this knowledge a comprehensive test program wasdeveloped at i3mainz and as many different scanners as possibleare compared using the same installations.

2.2 Angular accuracy
The laser pulse is deflected by a small rotating device (mirror,prism) and sent from there to the object. The second angle,perpendicular to the first, may be changed using a mechanicalaxis or another rotating optical device. The readings for theseangles are used for the computation of the 3D point coordinates.Any deviations will result in errors perpendicular to the propa-gation path. Since the positions of single points are hard to beverified, few investigations of this problem are known. Errorscan be detected by measuring short horizontal and verticaldistances between objects (e.g. spheres) which are located at thesame distance from the scanner and comparing those tomeasurements derived from more accurate surveying methods.
2.3 Range accuracy
In the case of ranging scanners, range is computed using thetime of flight or a phase comparison between the outgoing andthe returning signal. Ranging scanners for distances up to 100 mshow about the same range accuracy for any range. Tri-angulation scanners solve the range determination in a triangleformed by the instrument’s laser signal deflector, the reflectionpoint on the object’s surface and the projection center of acamera, mounted at a certain distance from the deflector. Thecamera is used to determine the direction of the returningsignal. In contrast to the ranging scanners, the accuracy ofranges acquired with triangulation scanners diminishes with thesquare of the distance between scanner and object (Boehler,Marbs, 2002).
Ranging errors can be observed when known distances in rangedirection are measured with the scanner. If scanners are notequipped with a defined reference point (such as forcedcentering), it is only possible to measure range differencesbetween targets. Plane, cylindrical or spherical targets may beused if their precise positions are surveyed with instruments andmethods more accurate than the laser scanner.
Whereas a systematic scale error will be present in any spatialdistance measured, a systematic constant (zero) error will beeliminated when distance differences in range direction aredetermined. The constant error will influence distances betweentwo points which are located in different directions as seen fromthe scanner, however. If both points are located in the samedistance from the scanner, the deviation of their distance willamount to the zero error when the direction difference is 60°; itwill amount to twice the zero error when the directiondifference is 180° (e.g. when scanning all walls with apanoramic scanner from one single observation point in thecenter of a room).
A very fast and easy check for the noise (accidental error) ofrange measurements can be achieved when a plane targetperpendicular to the observation direction is scanned and thestandard deviation of the range differences of the points from anintermediate plane through the point cloud is computed. As anadditional result, this test also detects if range is internally onlyprovided with a certain resolution (e.g. 1 cm) which is the casefor some instruments (Kern, 2003).
2.4 Resolution
The term “resolution” is used in different context when theperformance of laser scanners is discussed. From a user’s pointof view, resolution describes the ability to detect small objects
or object parts in the point cloud. Technically, two differentlaser scanner specifications contribute to this ability, thesmallest possible increment of the angle between two successivepoints and the size of the laser spot itself on the object. Mostscanners allow manual settings of the increment by the user.
Since the combined effects of increments and spot sizedetermine object resolution, a test object comprising smallelements or small slots in front of a plane can serve to determineapplication related resolution information.
2.5 Edge effects
Even when well focused, the laser spot on the object will have acertain size. When the spot hits an object edge, only a part of itwill be reflected there. The rest may be reflected from theadjacent surface, a different surface behind the edge, or not atall (when no further object is present within the possible rangeof the scanner). Both, ranging scanners and triangulation scan-ners produce a variety of wrong points in the vicinity of edges.The wrong points are usually to be found on the ray from thelaser deflection point to the edge point, behind the edges (whenlooking from the scanner). The range error may vary from just amillimeter to values of several decimeters.
Obviously, wrong points are inevitable since the laser “spot”cannot be focused to point size. It can be assumed that wellfocused lasers will show better results. When using a standardtarget with different types of edges, the performance of differenttypes of scanners can be compared.
A systematic effect can be observed when cylindrical andspherical targets are observed from a close distance (Lichti et.al. 2002). In this case, at the peripheral parts of the object, thecenter of the reflecting surface area is not identical with thecenter of the transmitted spot.
2.6 Influence of surface reflectivity
Laser scanners have to rely on a signal reflected back from theobject surface to the receiving unit in case of ranging scannersand to the camera in case of triangulation scanners. In eithercase, the strength of the returning signal is influenced (amongother facts such as distance, atmospheric conditions, incidenceangle) by the reflective abilities of the surface (albedo). Whitesurfaces will yield strong reflections whereas reflection is weakfrom black surfaces. The effects of colored surfaces depend onthe spectral characteristics of the laser (green, red, near infra-red). Shiny surfaces usually are not easy to record.
It has been observed that surfaces of different reflectivity resultin systematic errors in range. For some materials these errorsmay reach amounts several times larger than the standarddeviation of a single range measurement. Some scanners whichprovide some type of aperture adjustment show errors in thefirst points after the laser spot has reached an area of areflectivity differing considerably from the previous area, and itcan be observed that the correct range is achieved only after afew points have been measured. For objects consisting ofdifferent materials or differently painted or coated surfaces, onehas always to expect serious errors. These can only be avoidedif the object is temporarily coated with a unique material which,of course, is not applicable in most cases.
If the effect has to be examined and evaluated, one may useplane white targets and apply the material in question to the
center part of the target. When the intermediate planes are com-puted for the coated center part only and then for the rest of the(white) target without using the center part, the differencebetween those planes will give an indication of this effect.
2.7 Environmental conditions
Temperature. Any scanner will only function properly whenused in a certain temperature range. Even within this range,deviations may be observed, however, especially in the distancemeasurement. It should be noted that the temperature inside thescanner may be far above the temperature of the surroundingatmosphere due to internal heating or heating resulting fromexternal radiation (sun).
Atmosphere. Since short distances only are measured, thechange of the propagation speed of light due to temperature andpressure variations will not seriously affect the results. Manyusers report however that measurements in surroundings wheredust or steam is present lead to effects similar to the edge effectsdescribed above.
Interfering radiation. Lasers operate in a very limitedfrequency band. Therefore filters can be applied in the receivingunit allowing only this frequency to reach the receiver resp. thecamera. If the radiation of the illumination source (sunlight,lamps) is strong as compared to the signal, enough of thisambient radiation will pass the filter and influence the accuracyor prevent any measurements at all.
2.8 Specifications and considerations besides accuracy
This article concentrates on accuracy considerations. Of course,other scanner specifications influence their applicability as well(Boehler, Marbs, 2002). Among these are measuring speed,range limits, field of view, laser class, registration devices forthe combination of several scans and the transformation to acontrol network, the availability of imaging cameras which canwork in combination with the scanner, weight and ease of trans-portation, power supply (battery operation), ruggedness whenoperated in bad weather or hostile environments, availabilityand quality of software.
Besides, the quality of the user support and the guaranteeconditions are not the same for all producers. These should bechecked carefully in addition to the technical specificationsbefore a decision is made to favor one product or another.
3. TESTING INSTALLATIONS AT i3mainz
3.1 General remarks
When the decision was made to start a research program withthe aim to compare the accuracy and performance of differenttypes of laser scanners, new testing installations had to bedeveloped. In order to reduce measuring time and expenses, aset of targets was designed using standard materials, and allexperiments were installed in two buildings of FH Mainz,University of Applied Sciences. Most experiments can berepeated at any other location provided the same type of targetsand surface paints are used.
Since single points of scans cannot be analyzed and compared,ball type targets (white spheres with a diameter of 76.2 mm on amagnetic ground plate as produced by MENSI) are used for
most distance determinations. Scanners proposed for a varietyof different application tasks should be able to detect and modela sphere of this size. Plane boards are used for experimentsconcerning range noise and investigations concerning the be-havior of surfaces with different reflectivities. Some additionalspecial objects, described below, were constructed for furtherinvestigations.
It should be noted that these arrangements do not allow to findthe mechanical, optical or electronic sources of errors in theinstruments; instead they show the effects of such an error on acertain measurement under practical measurement conditions.When, for example, a short distance between two spheres whichare at the same distance from the scanner, is derived after theircenter points have been modeled from the point clouds, this willgive a general indication of the angular accuracy of the scannerbut does not really tell everything about the accuracy of theangular position of a single point. Since the same proceduresand targets were used for all instruments examined, thisprovides a reliable method to compare the performance of thoseinstruments under practical application conditions.
On spheres, a point grid of 4 mm spacing was aimed at. If thiswas not possible, a value as close as possible was chosen.Accordingly, the grid spacing for planes was 5 mm or as closeto this value as possible. Tests concerning resolution and edgeeffects were carried out with 1 mm grids, if possible. All objectswere recorded once, using one measurement per point andrecording tenths of millimeters (if possible).
Modeling points and spheres was accomplished using leastsquares adjustment. Known geometric object properties(planarity of planes, diameter of spheres) were introduced asfixed values. Mensi’s 3Dipsos software was used after it wasverified that it yields the same results for these tasks as othersoftware.
When modeling intermediate planes, points near the edges weremanually removed. When spheres were modeled for distanceevaluations in range direction, points near the circumferencewere also removed manually (they were kept, however, whendistances orthogonal to range direction were determined). Allmodeling and computation tasks were carried out by the sameperson.
3.2 Angular accuracy
Errors in the angles between two rays can be detected when ashort distance between two spheres located at equal distancesfrom the scanner is determined. Modeling the spheres will resultin a low pass filtering. Therefore the results will not allowdetecting small arbitrary angular variations.
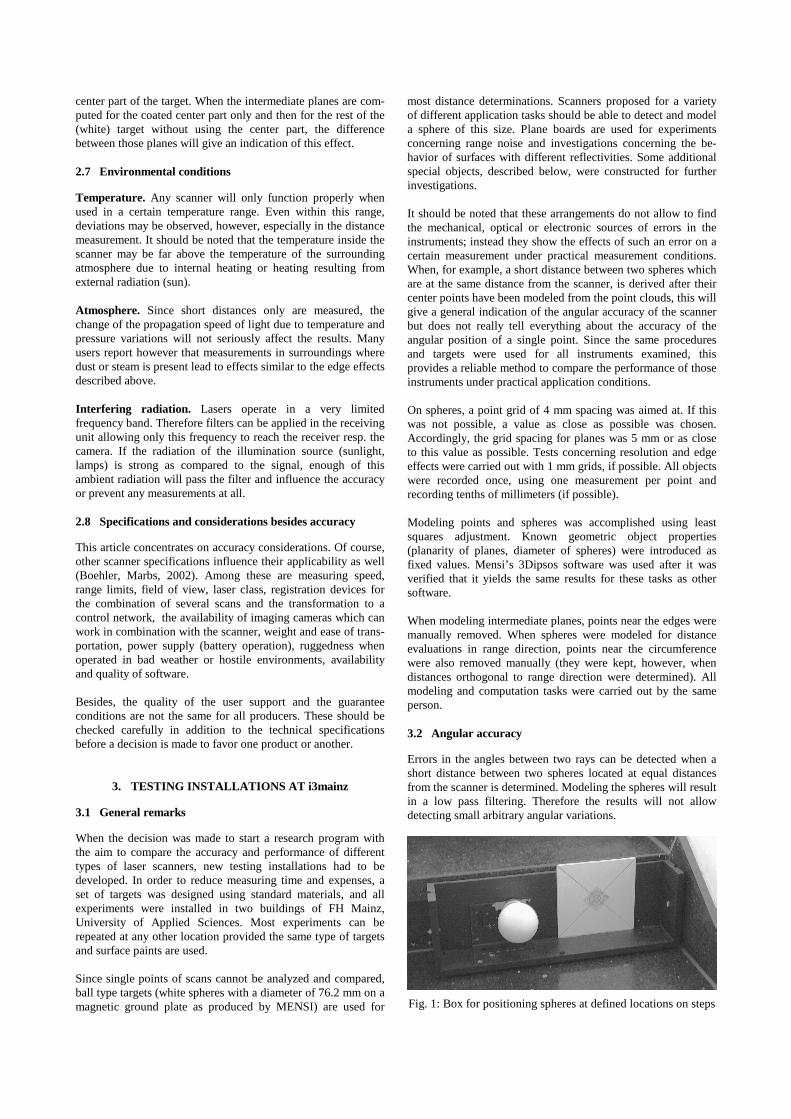
Fig. 1: Box for positioning spheres at defined locations on steps

A first test installation uses white spheres in a box that can bepositioned at well defined points on a stone stairway at the endof a 60 m corridor. The box (fig. 1) allows repositioning thespheres within some tenths of millimeters with respect to thestone steps when the tips of six bolts protruding from thebottom and the sides are brought in contact with the stone facesof the steps. Thus, the precise position, acquired with geodeticmethods can be re-established any time. The targets are used oneither side of six steps at a distance of about 1 m (fig. 2). Thisallows the calculation of six independent short distances inhorizontal and six in vertical direction.
Fig. 2: Sphere positions on stairway
Fig. 3: Steel plate for positioning sphere at a wall
Fig. 4: Location of spheres at a wall and observation stations
In a different room, four spheres are installed at a vertical wallat the corners of a rectangle 3.5 m high and 5 m wide. Sincespecial steel plates with two defined mechanical contacts for themagnetic ground plates of the spheres are used (fig. 3), thespheres can be re-positioned precisely to the original positionwhich was determined by geodetic methods. This arrangementis scanned from a distance of up to 15 m from three observationpoints as indicated in figure 4. This again yields six independent
distances in horizontal and six in vertical direction which can becompared to their calibrated values.
3.3 Range accuracy
Measuring noise. A very simple test to get an indication of thearbitrary deviations of the range measurements can be per-formed when a plane surface is scanned and modeled. Theresulting deviations of the single points are a reliable source ofinformation for the relative accuracy of range measurements.Three different surface paints are used: white, gray and blackwith reflectivities of about 80, 40 and 8 %.
Known range differences. Three different experiments areinstalled in order to compare known range differences with theones measured by the scanners. Spheres were used in either casefor the end points of the distances. In the set-up shown in figure2, where small range differences can be measured fromdistances up to 60 m, the horizontal components in rangedirection are used to form six independent distances. Inaddition, the faces of steel lockers in this long corridor wereused to place spheres at well defined known locations thusallowing the comparison of 4 range differences in mid-range.Finally, for close ranges between 3 and 8 m, a sphere is placedon an interferometric comparator and moved to six positionswith 1 m spacing, thus providing another 3 independent rangedifferences.
Since all these measurements concern differences in rangedirection, a systematic constant (zero) error would not bedetected. This error will show up in the measurements of longerdistances orthogonal to range direction, as the set-up shown infigure 4. Distance deviations in this case would be caused byboth, an angular and a constant range error.
3.4 Resolution
Since values for increments and spot sizes in the manufacturer’sspecifications do not give much indication about the ability of ascanner to reach a certain resolution, a practical approach ischosen in order to achieve resolution information. A box about300 mm x 300 mm was constructed (fig. 5). The front panel hasslots which are about 30 mm wide at the outside becomingsmaller towards the center. If a scanner has a high resolution(small angular increments and a small laser spot) there shouldbe reflections not only from the front panel but also from thebottom of the box which is about 55 mm behind the front panel.If the resolution is very good, these reflections from the bottomshould not only be present in the outer regions but also near thecenter. This target can be used to detect resolution informationfrom different ranges.
Fig. 5: Target with slots of varying widths for resolution tests.

3.5 Edge effects
Edges. A board (fig. 6) is used to get an indication how manypoints are recorded at wrong locations due to edge effects. Theboard is placed against a sky background when scanned. Thus,the measurement of the outer edges will not be influenced byobjects behind the board whereas the front edges of the attachedsmaller board simulate the effect of reflections from two dif-ferent objects. The evaluation is based on a plot of the resultingpoint cloud (see fig. 10).
Fig. 6: Board used to study edge effects
Cylinder. A vertical pipe with a diameter of 100 mm is scannedfrom a distance of 3 m. A cylinder is modeled from the pointcloud and its diameter compared to the known value. Also, tovisualize the effect, the resulting point cloud is plotted andcompared graphically with the known diameter.
3.6 Influence of surface reflectivity
Boards showing a wide white frame and a square center part ofdifferent reflectivity (fig. 7) are scanned. Separate planes aremodeled through the frame and the center part (excluding pointsat the edges). The range difference between the two planesindicates the error which has to be expected in similar cases.The following colors and materials are used:• White dull spray paint, reflectivity 90%• White dull spray paint, reflectivity 80%• Gray dull spray paint, reflectivity 40%• Black dull spray paint, reflectivity 8%• Spray paint with metallic appearance• Polished aluminum foil• Blue retro foil, as used on CYRAX targets
Fig. 7: Board with white frame and different surface coatings
Since large deviations were observed on a rubber traffic conewith orange and white stripes, this object (not a plane) was alsoadded to the test procedure. Similar effects can be observedwhen range poles coated with “warning” color are scanned.
3.7 Environmental conditions
As mentioned above, there are further conditions that caninfluence the accuracy of laser scanner measurements. Thesehave to be examined in further investigations.
4. RESULTS
4.1 Important preliminary remarks
Accuracy tests comparing different instruments have to bestandardized in some way. We chose the approach to measureobjects once with a defined grid spacing. (Alternatively,Considering the fact that some scanners record a much largernumber of points in a certain time period, one could also usethis time as a standard and allow a certain time period toachieve an object scan. Even more realistic, a relation betweenaccuracy and cost could be used, considering different purchaseand operating costs in addition.)
The following results were achieved solving certain tasks undercertain preconditions as described above.
IF A SCANNER SHOWS “BETTER” RESULTS THANANOTHER ONE, THIS DOES NOT NECESSARILYMEAN THAT IT IS THE BETTER INSTRUMENT FOR ACERTAIN TASK DIFFERENT FROM THE ONESPERFORMED IN OUR TESTS.
For example, the fine grids of 4 resp. 5 mm could not beachieved with some instruments, therefore the results in ourtests look poor, although these instruments would be perfectlysuitable for certain other tasks (see also sections 2.8 and 4.8).
For the tests we selected all laser scanners (working either onthe time-of-flight or triangulation principle) that are able torecord points at a 10 m range and claim to be applicable fordifferent scanning tasks. According to the list supplied by ourweb site (WWW, 2003) this comprises about one dozendifferent instruments. Manufacturers and users were asked toco-operate in the tests. We are very grateful that many gave usthe opportunity to test their instruments and others promised toco-operate in the near future. The following list shows theinstruments tested so far. Updates will be published on thisWEB site.
Manufacturer Typealreadytested
Callidus Precision Systems Callidus 2(u)Cyra Technologies Cyrax 2500a 1(o),1(m)Mensi S25 1(o)Mensi GS100 1(m)Riegl LMS-Z210 1(u)Riegl LMS-Z420i 1(m)Zoller+Fröhlich Imager 5003b 1(m)
Total Number 9
Table 1: Scanners in the tests (o = owned by i3mainz,m = instrument made available by manufacturer, u = by user)a now referred to as Leica HDS 2500b identical in construction: Leica HDS 4500

Fig. 8: Measuring noise in range direction (std. dev. for a single point) for different scanners on gray surface (40% reflectivity).
4.2 Distances orthogonal to range
Manufacturer Typevert.dist.
horiz.dist.
max.diff.
Callidus Precision Syst. Callidus (1) 5.6a 4.3a 12,2a
Callidus Precision Syst. Callidus (2) 9.9a 2.5a 18.3a
Cyra Technologies Cyrax2500 (1) 0.8 0.8 1.6Cyra Technologies Cyrax2500 (2) 0.5 0.5 1.1Mensi S25 3.8b 3.4b 9.2b
Mensi GS100 1.9 2.3 3.3Riegl LMS-Z210 10.2a 16.8a 27.1a
Riegl LMS-Z420i 1.7 2.1 4.1Zoller+Fröhlich Imager 5003 2.9 7.5 11.1
Table 2: Standard deviations (mm) of at least 12 independentvertical and 12 independent horizontal distances (orthogonal torange) between two spheres.a Because of coarse grid tested for short ranges only!b Influenced by low range accuracy due to triangulation principle at farrange. Much better for close ranges (e.g. 0.8 mm vert. and 0.2 mmhoriz. at 4 m range)
4.3 Distances in range direction
Manufacturer Typeclose<10m
far10-50m
max.diff.
Callidus Precision Syst. Callidus (1) 1.5 - a 2.6Callidus Precision Syst. Callidus (2) 2.8 - a 5.9Cyra Technologies Cyrax2500 (1) 0.6 1.1 2.3Cyra Technologies Cyrax2500 (2) 0.4 0.5 0.9Mensi S25 1.4b 4.6c 7.7c
Mensi GS 100 2.6 2.0 8.2Riegl LMS-Z210 19.7 - a 40.4Riegl LMS-Z420i 2.6 2.7d 5.9Zoller+Fröhlich Imager 5003 1.6 0.7e 12.3
Table 3: Difference between known and scanned distancedifferences in range direction. Std. dev. (mm) of at least 12independent short distances between two spheres in close rangeand 14 independent short distances in far range.a Modeling of spheres not possible for far ranges due to coarse grid .b But 0.2 mm at 4 m range, 0.5 mm at 6 m range. c At 22m ranged only 4 measurements at far range e only 2 measurements
0
5
10
15
20
25
30
35
0 10 20 30 40 50 60 70 80 90 100
Range (m)
No
ise
(mm
)
Callidus(1) Callidus(2) Cyrax(1)
Cyrax(2) Mensi GS100 Mensi S25
Riegl Z210 Riegl Z420i Z+F

4.4 Resolution
Scanning results of the target shown in figure 5 give a goodindication of the resolution that can be achieved. The resultingpoint clouds for different scanners are shown in figure 9.
Figure 9a: Results of the resolution test using the target shown in figure 5. Scanned at 6m range.Left: Cross section of point cloud. Right: Points on back plane of target (in smaller scale).
Callidus
Cyrax 2500
Mensi S25
Mensi GS100
Riegl LMS-Z210
Riegl LMS-Z420i
Z+F Imager 5003
no points on backplane measured
point qualitytoo low

Figure 9b: Results of the resolution test using the target shown in figure 5. Scanned at 22m range.Left: Cross section of point cloud. Right: Points on back plane of target (in smaller scale).The point increments for the Callidus and the Riegl LMS-Z210 were too large to resolve the object at this distance.
4.5 Edge effects
Edges. Results for edge detection shown in table 4. Typicalexamples are shown below. Edge quality can also be judgedfrom the results shown in figure 9.
Manufacturer TypeEdge
quality
Callidus Prec. Syst. Callidus lowCyra Technologies Cyrax2500 averageMensi S25 averageMensi GS 100 averageRiegl LMS-Z210 lowRiegl LMS-Z420i averageZoller+Fröhlich Imager 5003 low
Table 4: Evaluation of edge quality. Fig. 10: Typical examples for edge quality (see fig. 6).Upper: High quality (not achieved with any scanner).
Center: average quality. Lower: low quality.
Cyrax 2500
Mensi S25
Mensi GS100
Riegl LMS-Z420i
Z+F Imager 5003

4.6 Influence of surface reflectivity
The results of the experiments described in section 3.6 areshown in table 5.
Typewhite90%
white80%
gray40%
black8%
metalpaint
alufoil
bluefoil
orangecone
Callidus(1) 0 0 0 0 0 0..-100 +7 -10
Callidus(2) 0 0 +4 +3 0..-10 0..-15 +5 -20
Cyrax (1) 0 0 0 0 0 0..+10 +22 -40
Cyrax (2) 0 0 0 0 0 0 +17 -70
S25 0 0 0 0 0 0 0 0
GS 100 0 0 0 +8 0 0 n.a.a 0
Riegl Z210 0 0 +13 +3 0..-100 0..-250 0 -100
Riegl Z420 0 0 0 0 0 0 0 -20
Z+F 0 0 0 0 0 0..+30 -18m -20
Table 5: Distance correction in mm due to different surfacematerials. Positive sign = Distance is measured too short ascompared to white surface.a Scanner did not record any points on this surface
4.7 Environmental conditions
All tests were conducted under favorable conditions, predo-minantly inside of buildings.
4.8 Specifications and considerations besides accuracy
As pointed out in sections 2.8 and 4.1, accuracy is not the onlyfact that should be considered when choosing between differentlaser scanners. Selling prices are important, too, and maydepend on different specifications. Support and warrantyconditions differ considerably! It should be checked how oftenthe instrument has to be calibrated, where this has to beaccomplished, how long this will take and what kind ofexpenses (service contracts, transportation, fees) this will causefor the user.
The quality of the included scanning software has to beconsidered, and it should be decided if modeling software has tobe purchased separately from other companies (Boehler, Heinz,Marbs, Siebold, 2002).
In the following tables the authors report some majoradvantages and disadvantages of scanners. This is based onmany reports from users, experience and subjective impressionsand not on systematic research.
Type
Callidus Very large field of view.Cyrax2500 Good accuracy.S25 Very high accuracy for short ranges.GS100 Large field of view.Riegl Z210 High ranges possible. Large field of viewRiegl Z420i Very high ranges possible. Large field of viewZ+F Very high scanning speed. Large field of view
Table 6. Major advantages of some laser scanners.
Type
Callidus Very coarse vertical resolution (0.25°)Cyrax2500 Small scanning window (40° x 40°)S25 Does not work in sunlight. Not suited for long ranges.GS 100 Large noise.Riegl Z210 Low accuracy.Riegl Z420i Large noiseZ+F Low edge quality.Limited angular resolution (0.018°)
Table 7. Major disadvantages of some laser scanners.
5. CONCLUSIONS
Laser scanners show considerable errors under certainconditions. Even when accuracy is not of much importance incertain applications, the resulting strain between neighboringpoints can be cumbersome when surfaces have to be modeled orwhen small details have to be detected. The results of our testsmay help the producers to compare the performance of theirinstruments to those of their competitors. For the users, thispublication and the associated web site (WWW 2003) may helpto select the appropriate instruments for their projects.
6. OUTLOOK
With the targets installed at FH Mainz, the authors are trying totest as many types of scanners as possible. Users andmanufacturers are invited to have their instruments tested.Details about booking and fees can be found in the Internet(WWW, 2003).
7. ACKNOWLEDGEMENTS
We would like to thank all institutions who brought theirscanners to Mainz for testing. The tests are part of a researchproject “More efficient documentation in architecture, culturalheritage conservation and archaeology using 3D scanners“funded by the German Federal Government (BMBF) in its aFuEprogram (grant 170 26 02).
8. REFERENCES
Balzani, M., Pellegrinelli, A., Perfetti, N., Uccelli, F., 2001:A terrestrial 3D laser scanner: Accuracy tests. Proc. 18th Int.Symp. CIPA 2001, pp. 445-453.
Boehler, W., Heinz, G., Marbs, A., Siebold, M., 2002:3D scanning software: an introduction. Proc. of the CIPA WG6Int. Workshop on scanning for cultural heritage recording.http://www.isprs.org/commission5/workshop/
Boehler, W., Marbs, A., 2002: 3D Scanning instruments. Proc.of the CIPA WG6 Int. Workshop on scanning for cultural heri-tage recording. http://www.isprs.org/commission5/workshop/
Johansson, M., 2002: Explorations into the behavior of threedifferent high-resolution ground-based laser scanners in thebuilt environment. Proc. of the CIPA WG6 Int. Workshop onscanning for cultural heritage recording.http://www.isprs.org/commission5/workshop/
Kern, F., 2003: Automatisierte Modellierung vonBauwerksgeometrien aus 3D-Laserscannerdaten. GeodätischeSchriftenreihe der Technischen Universität Braunschweig, Nr.19, ISBN 3-926146-14-1
Lichti, D.D., Stewart, M.P., Tsakiri, M., Snow, A.J., 2000:Calibration and testing of a terrestrial laser scanner. Int. Arch.of Photogrammetry and Remote Sensing, Vol. XXXIII, Part B5,pp. 485-492.
Lichti, D.D., Gordon, S.J., Stewart, M.P., Franke, J., Tsakiri,M., 2002: Comparison of digital photogrammetry and laserscanning. Proc. of the CIPA WG6 Int. Workshop on scanningfor cultural heritage recording.http://www.isprs.org/commission5/workshop/
VDI/VDE Guideline , 2002: Optical 3-D measuring systems/Optical systems based on area scanning. Beuth Verlag GmbHBerlin.
WWW, 2003: http://scanning.fh-mainz.de