inventory management. introduction the inventory management conflict the inventory management...
TRANSCRIPT

Inventory ManagementInventory Management
IntroductionIntroduction
• The Inventory Management ConflictThe Inventory Management Conflict
– Minimize Inventory Carrying CostMinimize Inventory Carrying Cost
– Maximize Service LevelsMaximize Service Levels
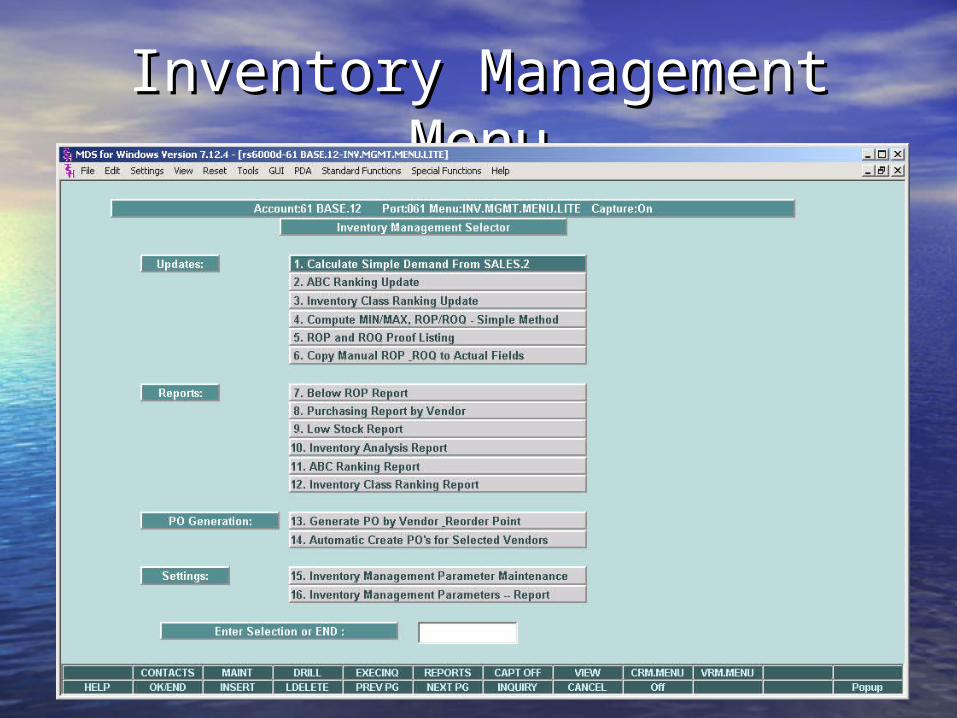
Inventory Management Inventory Management MenuMenu
Inventory ManagementInventory Management
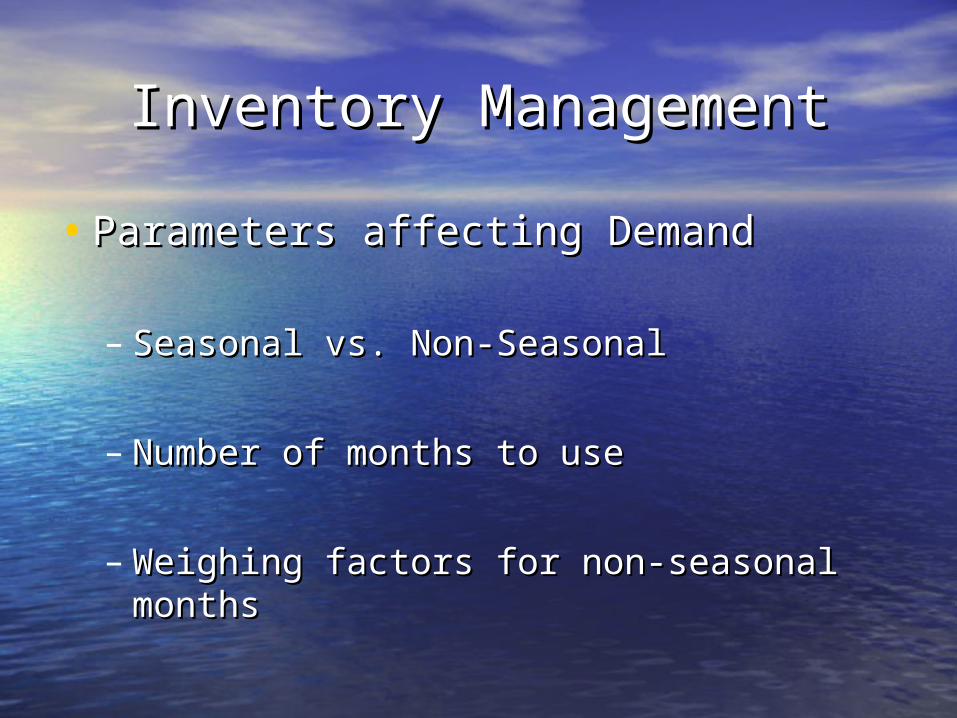
• Parameters affecting DemandParameters affecting Demand
– Seasonal vs. Non-SeasonalSeasonal vs. Non-Seasonal
– Number of months to useNumber of months to use
– Weighing factors for non-seasonal Weighing factors for non-seasonal monthsmonths
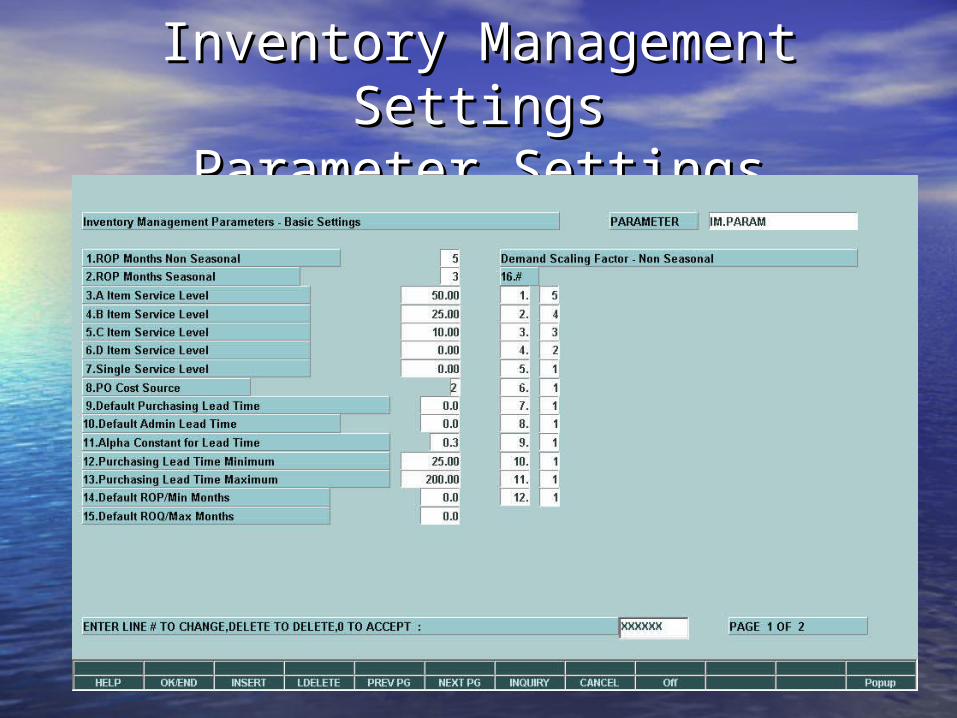
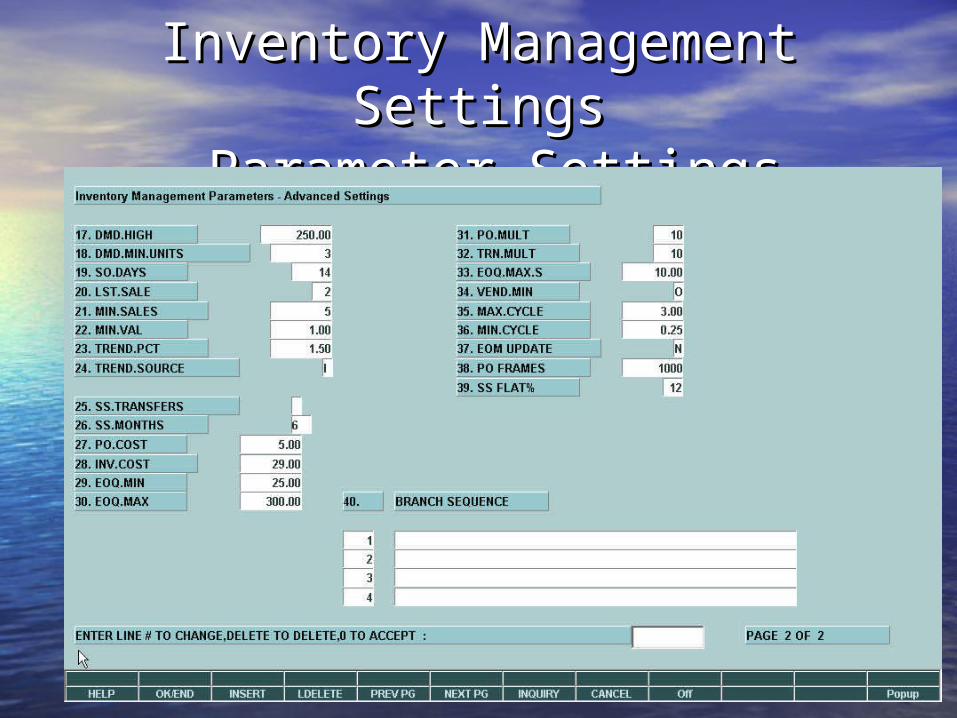
Inventory Management Inventory Management SettingsSettings
Parameter SettingsParameter Settings
Non-Seasonal DemandNon-Seasonal Demand
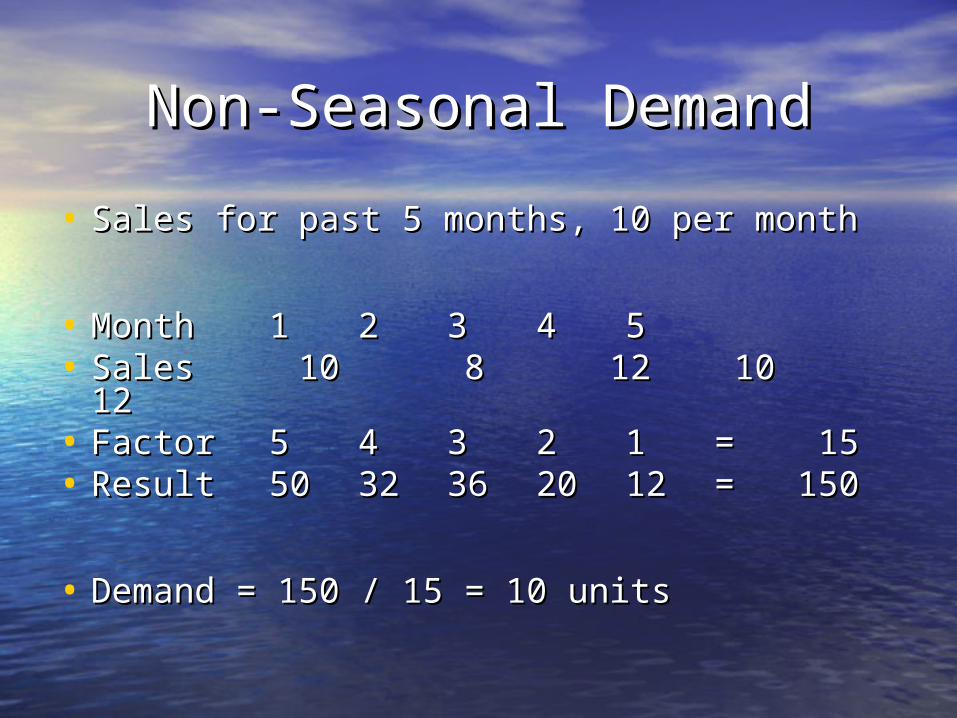
• Sales for past 5 months, 10 per monthSales for past 5 months, 10 per month
• MonthMonth 11 22 33 44 55• Sales 10 8 12 10 12Sales 10 8 12 10 12• FactorFactor 55 44 33 22 11 = 15= 15
• ResultResult 5050 3232 3636 2020 1212 = 150= 150
• Demand = 150 / 15 = 10 unitsDemand = 150 / 15 = 10 units
Inventory Management Inventory Management SettingsSettings
Parameter Settings Parameter Settings
Seasonal DemandSeasonal Demand
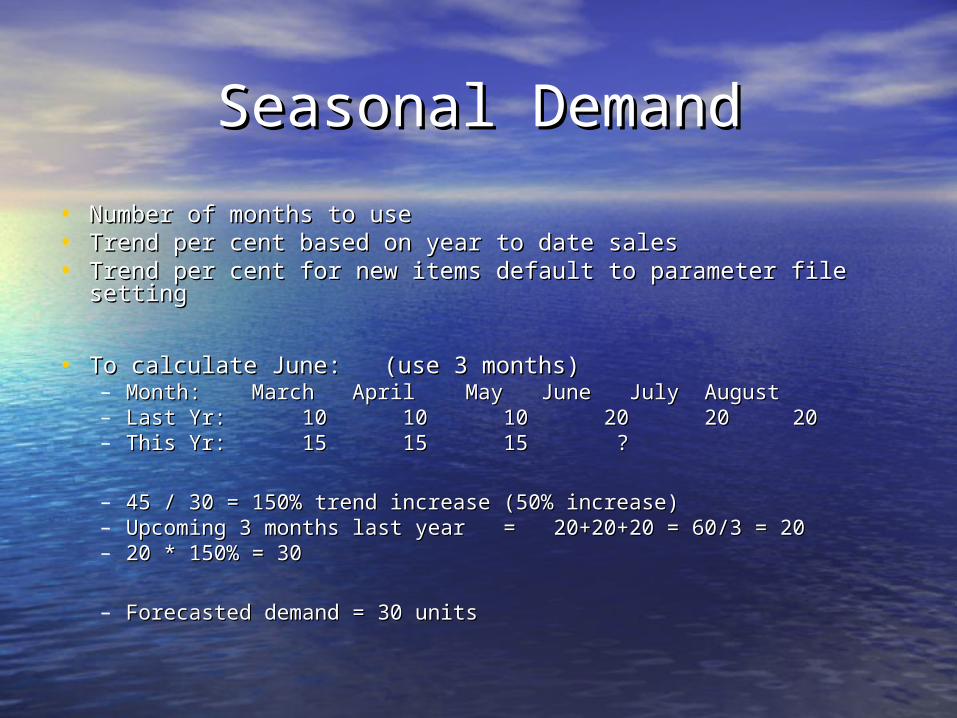
• Number of months to useNumber of months to use• Trend per cent based on year to date salesTrend per cent based on year to date sales• Trend per cent for new items default to parameter file settingTrend per cent for new items default to parameter file setting
• To calculate June: (use 3 months)To calculate June: (use 3 months)– Month: March April May June July AugustMonth: March April May June July August– Last Yr: 10 10 10 20 20 20Last Yr: 10 10 10 20 20 20– This Yr: 15 15 15 ?This Yr: 15 15 15 ?
– 45 / 30 = 150% trend increase (50% increase)45 / 30 = 150% trend increase (50% increase)– Upcoming 3 months last year = 20+20+20 = 60/3 = 20Upcoming 3 months last year = 20+20+20 = 60/3 = 20– 20 * 150% = 3020 * 150% = 30
– Forecasted demand = 30 unitsForecasted demand = 30 units
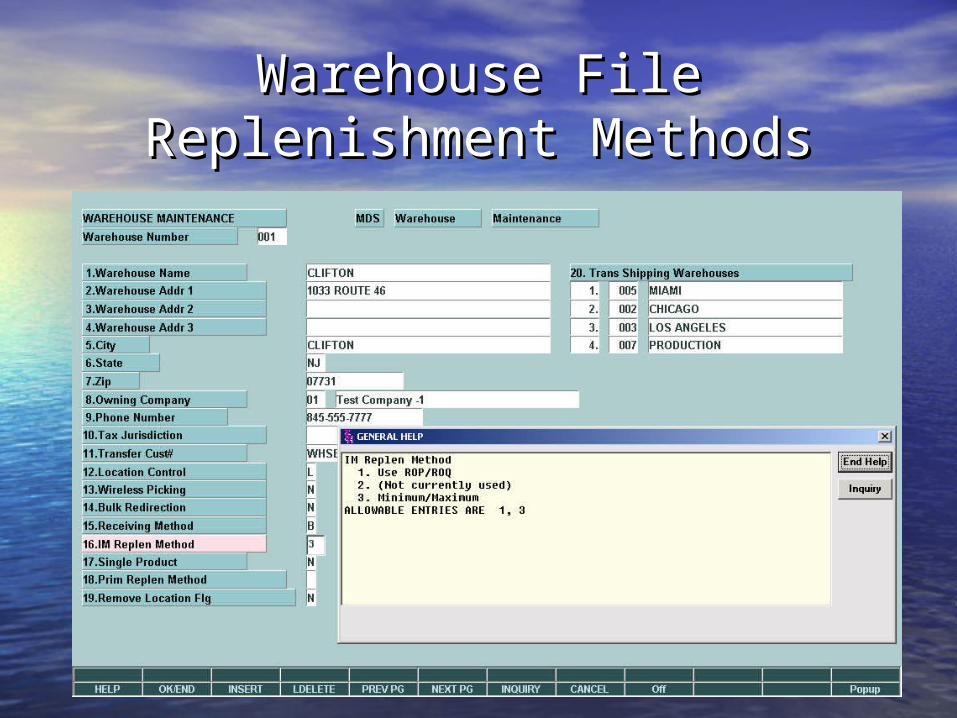
Warehouse FileWarehouse FileReplenishment MethodsReplenishment Methods
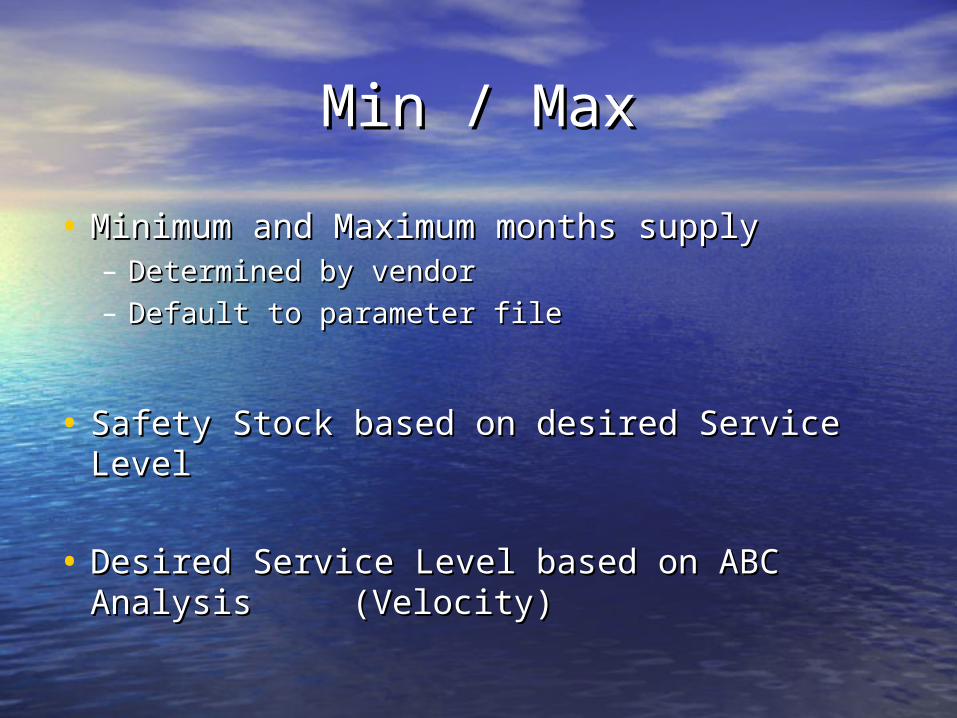
Min / MaxMin / Max
• Minimum and Maximum months supplyMinimum and Maximum months supply– Determined by vendorDetermined by vendor– Default to parameter fileDefault to parameter file
• Safety Stock based on desired Service LevelSafety Stock based on desired Service Level
• Desired Service Level based on ABC Desired Service Level based on ABC Analysis Analysis (Velocity)(Velocity)
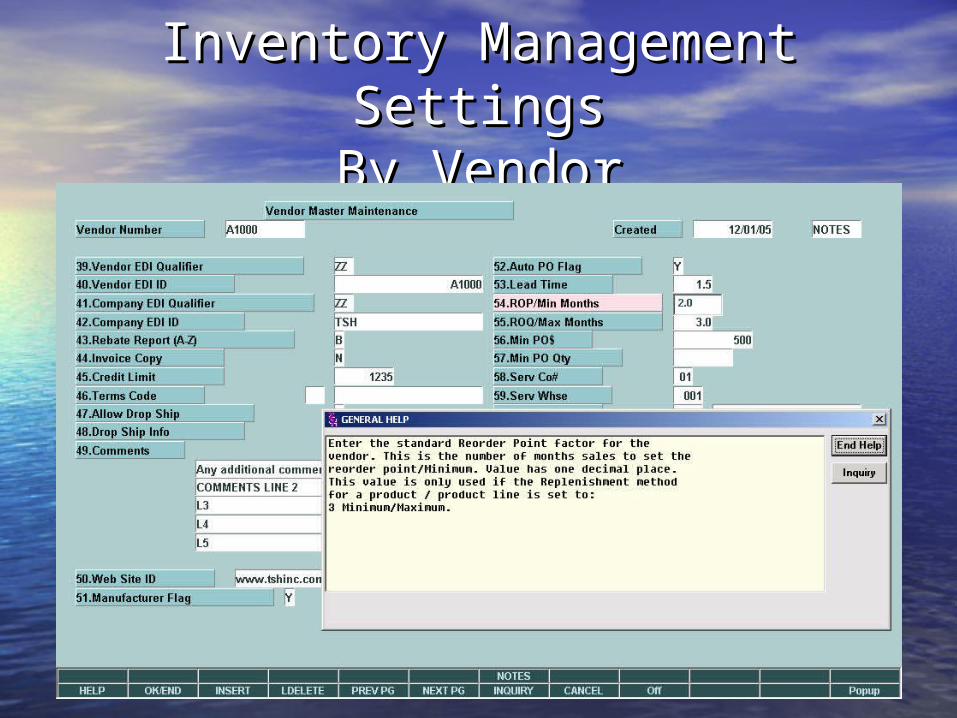
Inventory Management Inventory Management SettingsSettings
By VendorBy Vendor
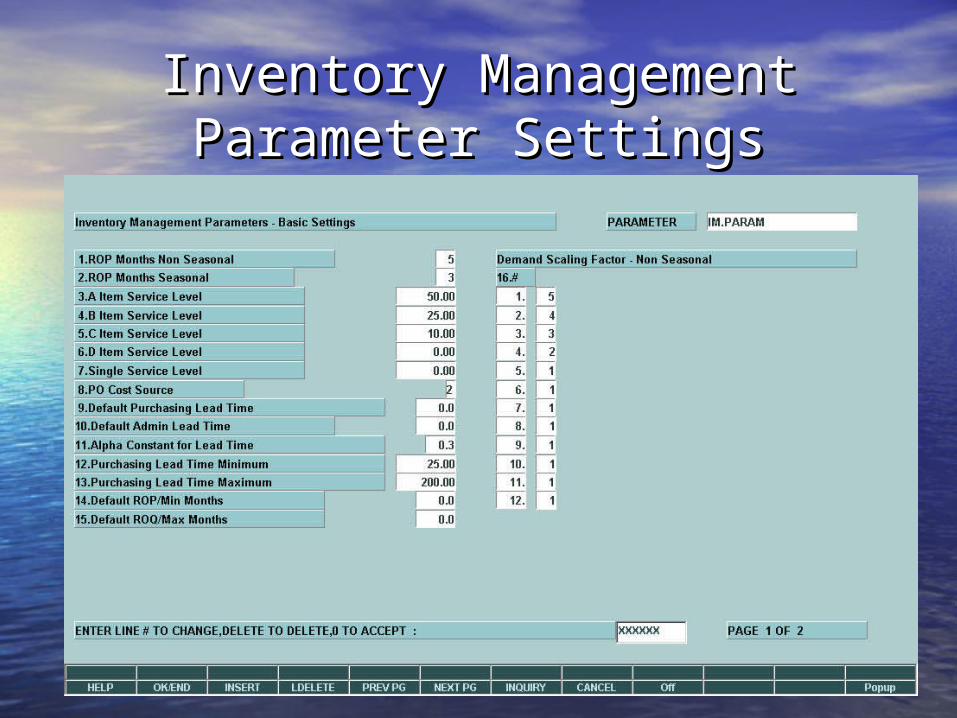
Inventory Management Inventory Management Parameter SettingsParameter Settings
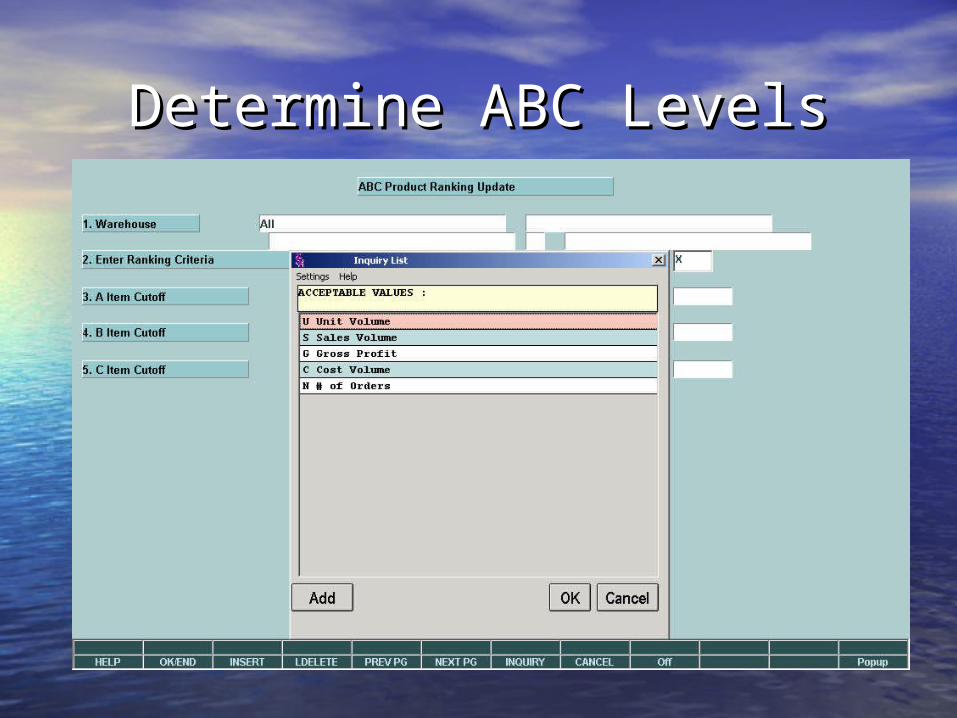
Determine ABC LevelsDetermine ABC Levels
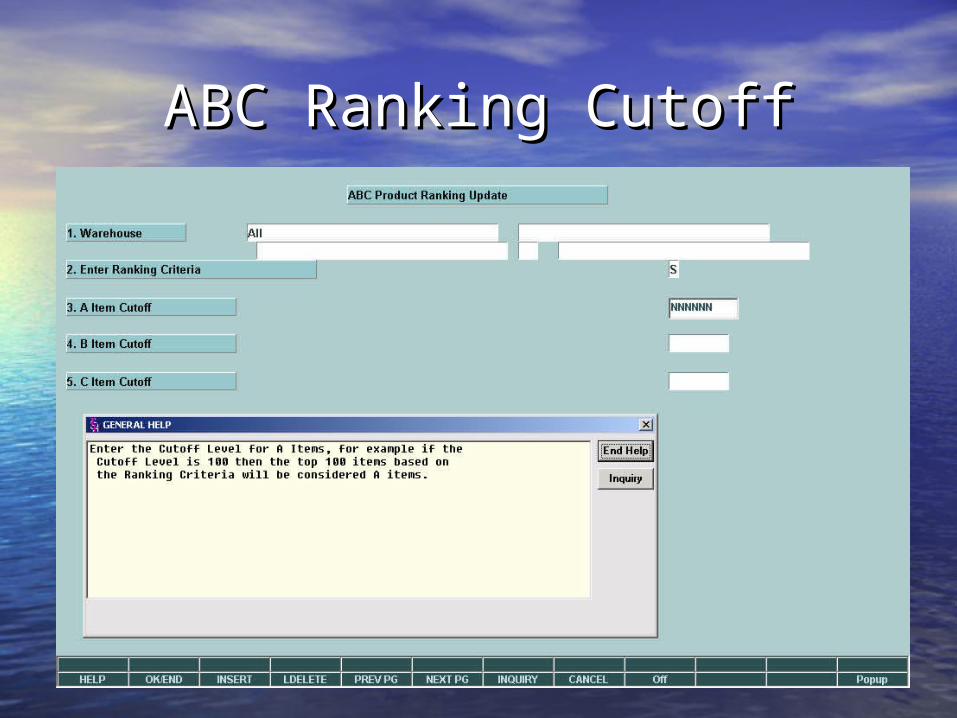
ABC Ranking CutoffABC Ranking Cutoff
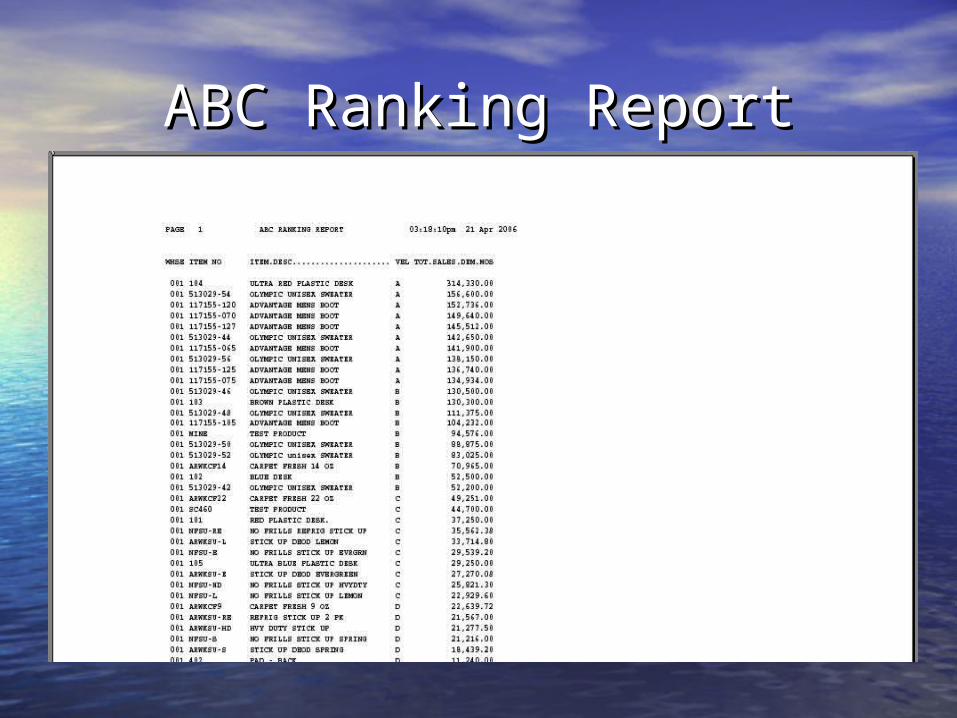
ABC Ranking ReportABC Ranking Report
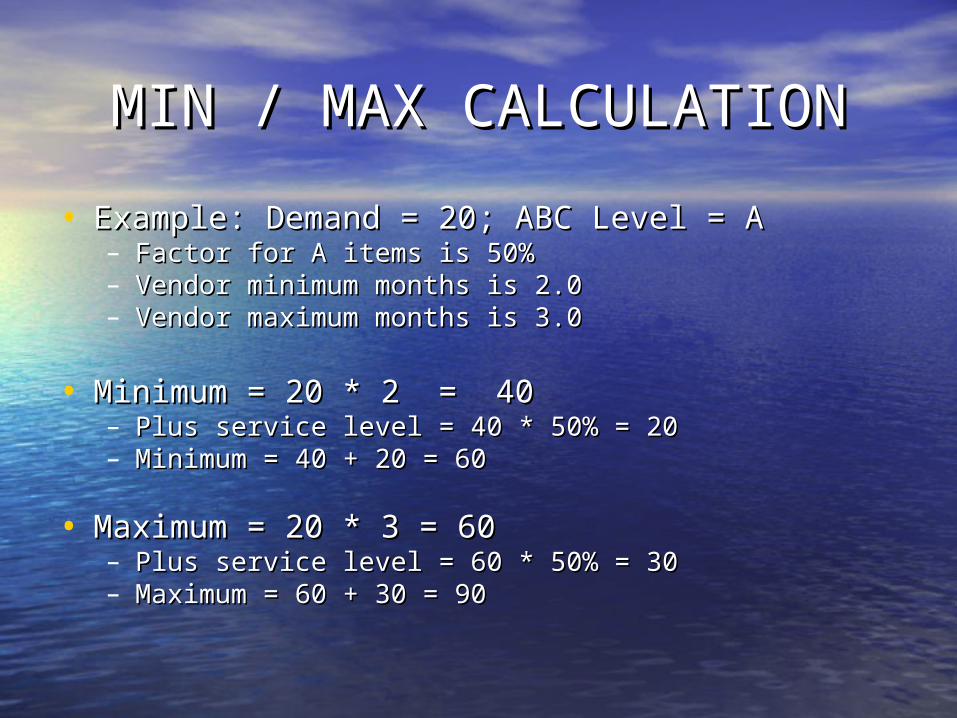
MIN / MAX CALCULATIONMIN / MAX CALCULATION
• Example: Demand = 20; ABC Level = AExample: Demand = 20; ABC Level = A– Factor for A items is 50%Factor for A items is 50%– Vendor minimum months is 2.0Vendor minimum months is 2.0– Vendor maximum months is 3.0Vendor maximum months is 3.0
• Minimum = 20 * 2 = 40Minimum = 20 * 2 = 40– Plus service level = 40 * 50% = 20Plus service level = 40 * 50% = 20– Minimum = 40 + 20 = 60Minimum = 40 + 20 = 60
• Maximum = 20 * 3 = 60Maximum = 20 * 3 = 60– Plus service level = 60 * 50% = 30Plus service level = 60 * 50% = 30– Maximum = 60 + 30 = 90Maximum = 60 + 30 = 90
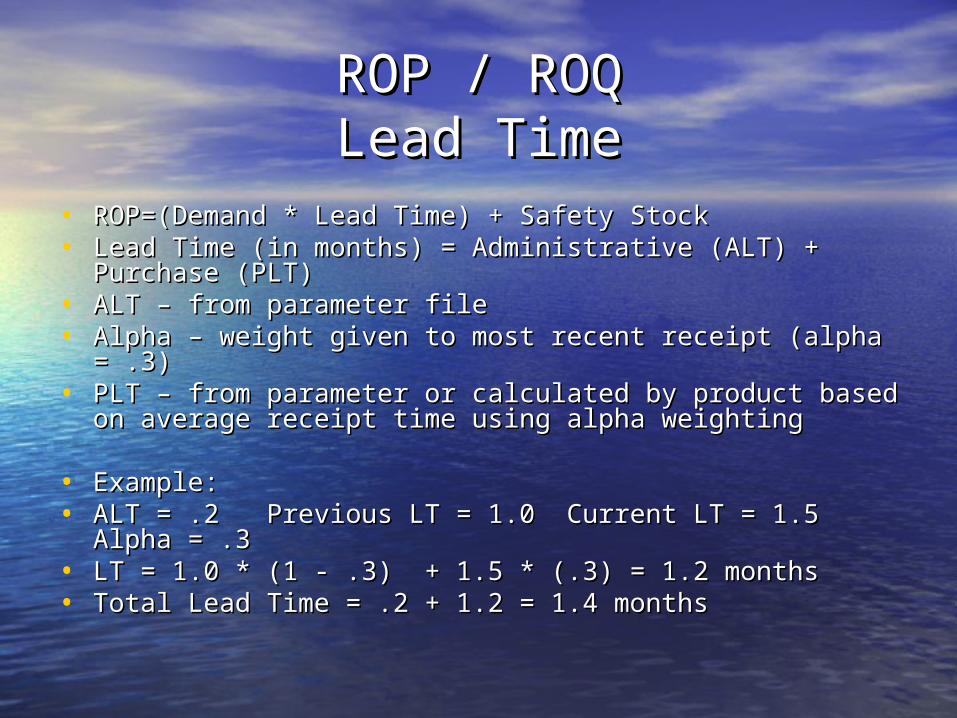
ROP / ROQROP / ROQLead TimeLead Time
• ROP=(Demand * Lead Time) + Safety StockROP=(Demand * Lead Time) + Safety Stock• Lead Time (in months) = Administrative (ALT) + Purchase Lead Time (in months) = Administrative (ALT) + Purchase
(PLT) (PLT) • ALT – from parameter fileALT – from parameter file• Alpha – weight given to most recent receipt (alpha = .3)Alpha – weight given to most recent receipt (alpha = .3)• PLT – from parameter or calculated by product based on PLT – from parameter or calculated by product based on
average receipt time using alpha weightingaverage receipt time using alpha weighting
• Example:Example:• ALT = .2 Previous LT = 1.0 Current LT = 1.5 Alpha = .3ALT = .2 Previous LT = 1.0 Current LT = 1.5 Alpha = .3• LT = 1.0 * (1 - .3) + 1.5 * (.3) = 1.2 monthsLT = 1.0 * (1 - .3) + 1.5 * (.3) = 1.2 months• Total Lead Time = .2 + 1.2 = 1.4 monthsTotal Lead Time = .2 + 1.2 = 1.4 months
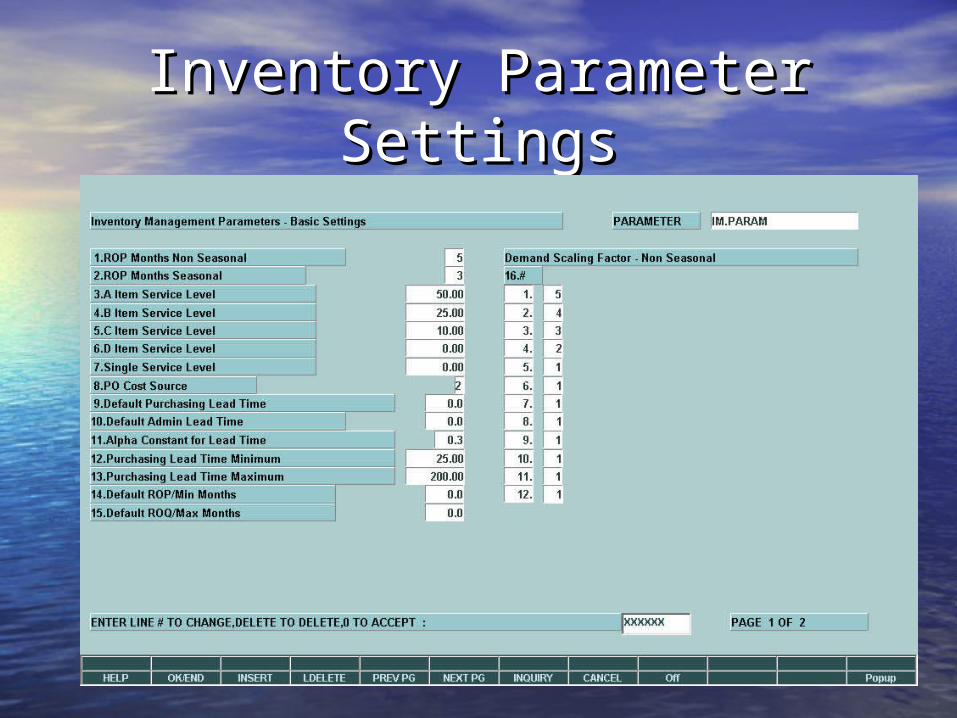
Inventory Parameter Inventory Parameter SettingsSettings
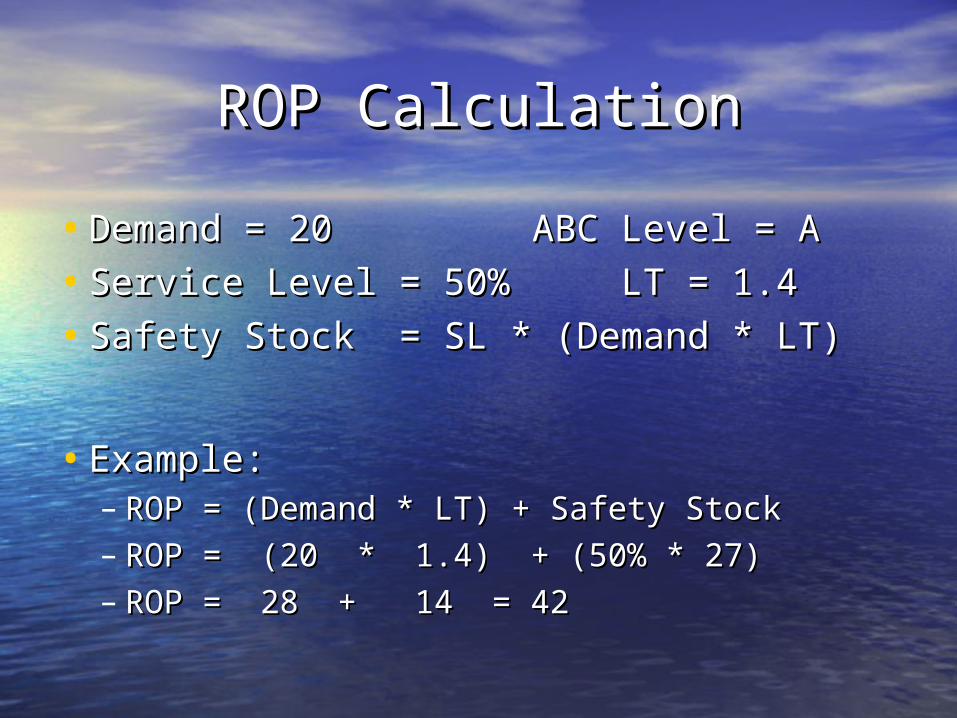
ROP CalculationROP Calculation
• Demand = 20 ABC Level = ADemand = 20 ABC Level = A
• Service Level = 50% LT = 1.4Service Level = 50% LT = 1.4
• Safety Stock = SL * (Demand * LT)Safety Stock = SL * (Demand * LT)
• Example:Example:– ROP = (Demand * LT) + Safety StockROP = (Demand * LT) + Safety Stock– ROP = (20 * 1.4) + (50% * 27)ROP = (20 * 1.4) + (50% * 27)– ROP = 28 + 14 = 42ROP = 28 + 14 = 42
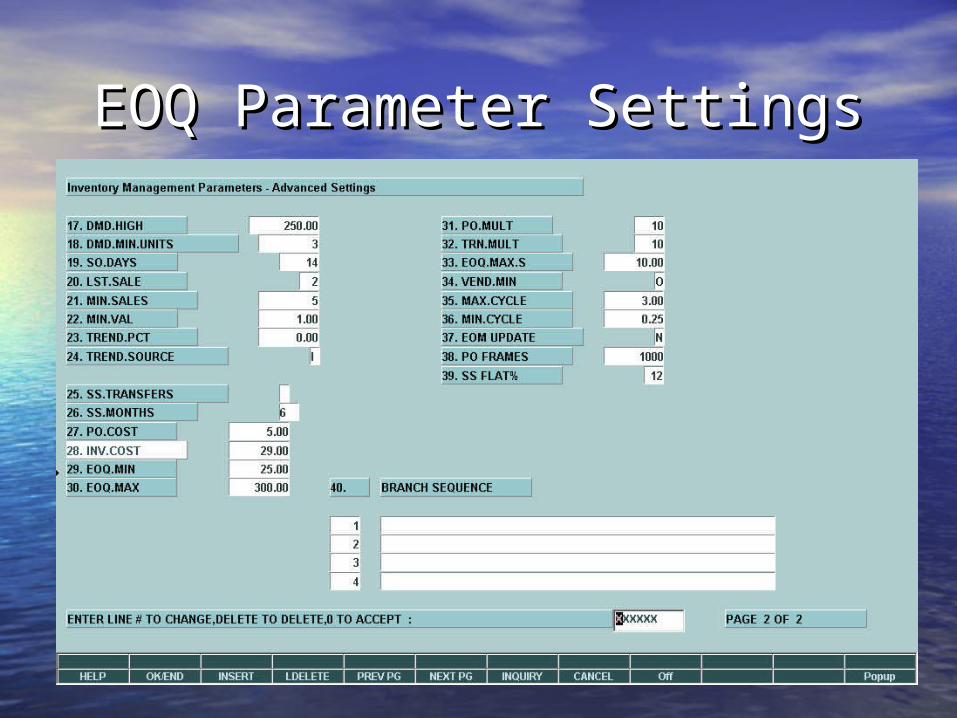
EOQ Parameter SettingsEOQ Parameter Settings
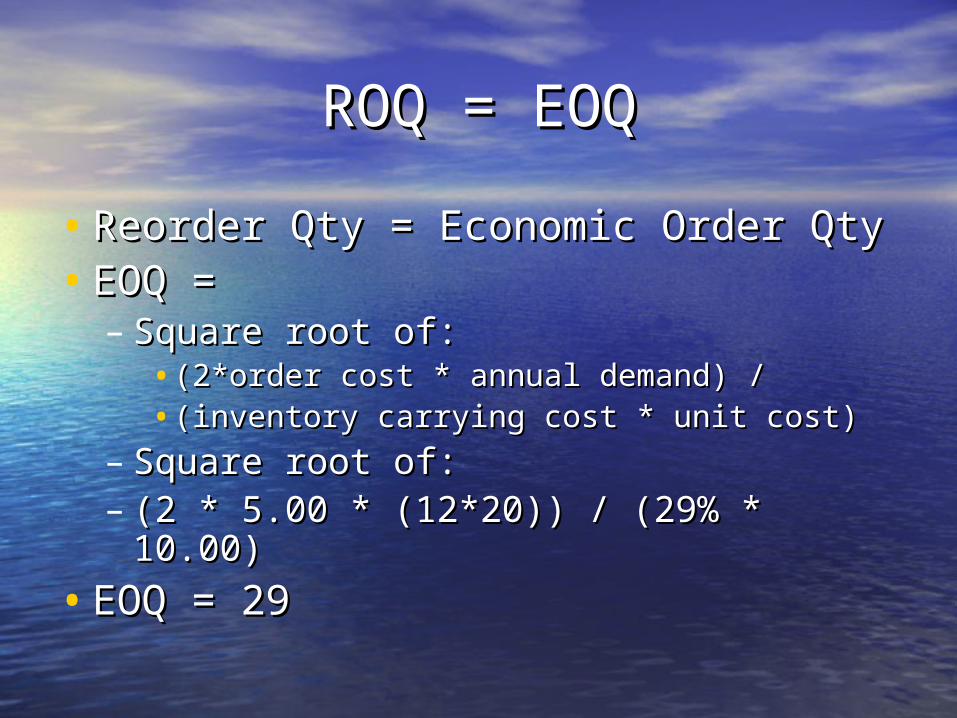
ROQ = EOQROQ = EOQ
• Reorder Qty = Economic Order QtyReorder Qty = Economic Order Qty• EOQ = EOQ =
– Square root of:Square root of:•(2*order cost * annual demand) /(2*order cost * annual demand) /•(inventory carrying cost * unit cost)(inventory carrying cost * unit cost)
– Square root of:Square root of:– (2 * 5.00 * (12*20)) / (29% * 10.00)(2 * 5.00 * (12*20)) / (29% * 10.00)
• EOQ = 29EOQ = 29
Automatic PO GenerationAutomatic PO Generation
• Two methodsTwo methods
– By vendorBy vendor– For all vendors flagged for Auto POFor all vendors flagged for Auto PO
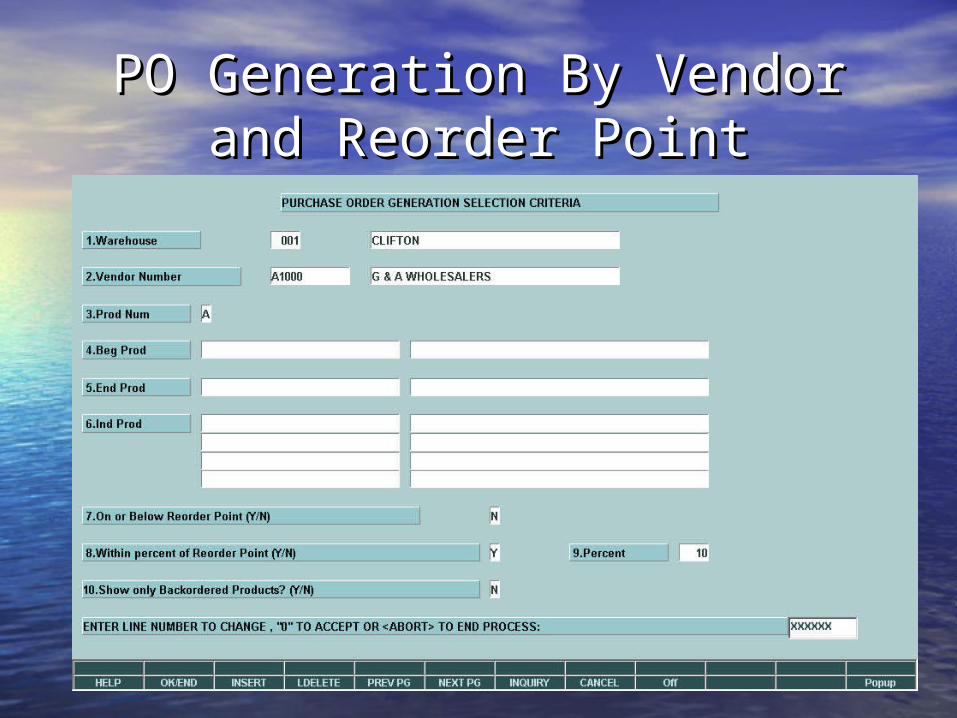
PO Generation By Vendor and PO Generation By Vendor and Reorder PointReorder Point
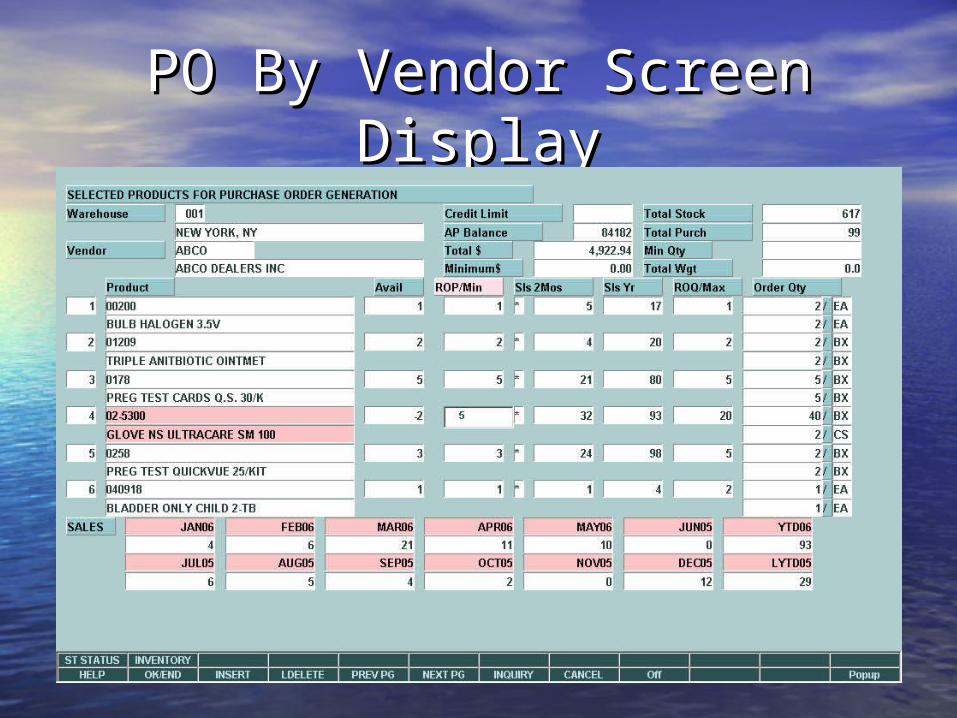
PO By Vendor Screen PO By Vendor Screen DisplayDisplay
Automatic PO Generation forAutomatic PO Generation forFlagged VendorsFlagged Vendors
• Select WarehouseSelect Warehouse
• Create Purchase OrdersCreate Purchase Orders
• Put on hold for reviewPut on hold for review

Inventory Management Inventory Management MenuMenu
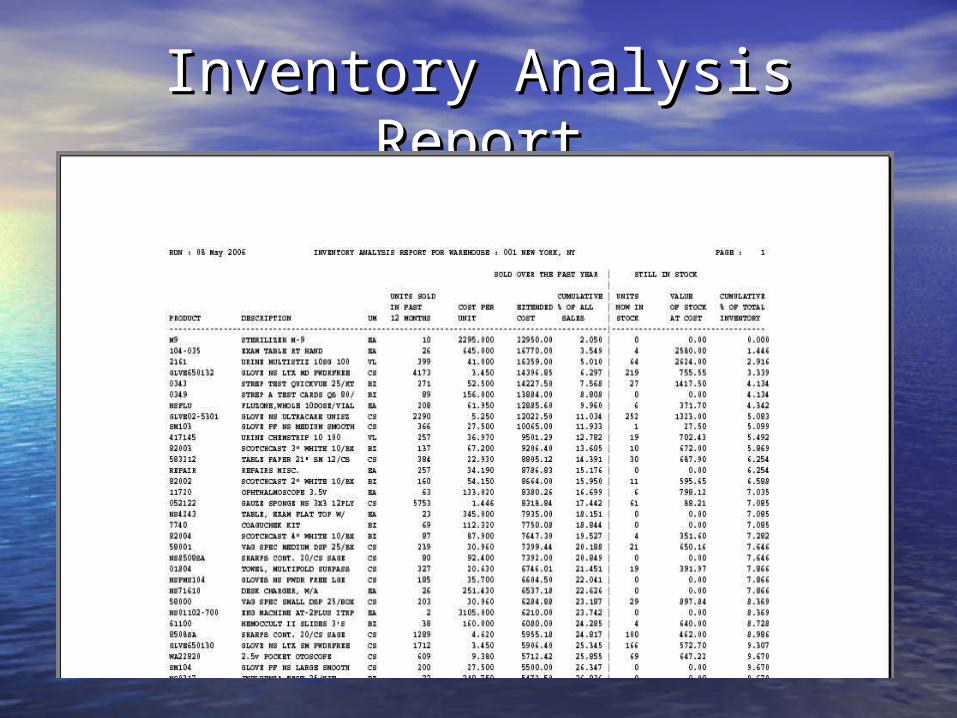
Inventory Analysis ReportInventory Analysis Report