introduction to wildland fire behaviro calculations s-390
TRANSCRIPT

NFES 2931
Introduction to WildlandFire Behavior CalculationsS-390
Student WorkbookSEPTEMBER 2006

Student WorkbookSEPTEMBER 2006
NFES 2931
Sponsored for NWCG publication by the NWCG Training Working Team. The use of trade, firm,or corporation names in this publication is for the information and convenience of the reader anddoes not constitute an endorsement by the National Wildfire Coordinating Group of any productor service to the exclusion of others that may be suitable.
Comments regarding the content of this publication should be directed to:National Interagency Fire Center, Fire Training, 3833 S. Development Ave., Boise, Idaho 83705.E-mail: [email protected].
Additional copies of this publication may be ordered from National Interagency Fire Center,ATTN: Great Basin Cache Supply Office, 3833 South Development Avenue, Boise, Idaho 83705.Order NFES 2931.
Introduction to WildlandFire Behavior CalculationsS-390

i
PREFACE
Introduction to Wildland Fire Behavior Calculations, S-390, is identified training inthe National Wildfire Coordination Group’s (NWCG), Wildland and Prescribed FireCurriculum. This course has been developed by an interagency development groupwith guidance from the National Interagency Fire Center (NIFC), Fire TrainingGroup under authority of the NWCG, with coordination and assistance of personnelfrom the following agencies:
Bureau of Land ManagementRobert Means
California Department of Forestry and Fire ProtectionJohn Craney
National Park Service Jim Kitchen
U.S. Fish and Wildlife ServiceChuck Maxwell
Bureau of Land Management Bradley Washa
Bureau of Land ManagementKato Howard
Michigan Department of Natural ResourcesRobert Ziel
USDA Forest ServiceRobert Heinsch
NWCG Training Development UnitNoble Dunn, Deana Parrish, Sue Hickman

ii

iii
CONTENTS
PREFACE.................................................................................................................. i
UNITS OF INSTRUCTION
Unit 0: Introduction .......................................................................................... 0.1
Unit 1: Topography .......................................................................................... 1.1
Unit 2: Weather ................................................................................................. 2.1Lesson A: Atmospheric Stability .............................................................. 2A.1Lesson B: Winds ...................................................................................... 2B.1Lesson C: Weather Information and Forecasts ........................................ 2C.1
Unit 3: U.S. Fire Behavior Prediction System (USFBPS) Models .............. 3.1
Unit 4: Fuel Moisture ................................................................................... 4.1
Unit 5: Fire Behavior Models ...................................................................... 5.1Lesson A: Non-Electric Wildland Fire Behavior Processors .............. 5A.1Lesson B: Spotting Model ................................................................. 5B.1Lesson C: Safety Zone Calculations .................................................. 5C.1
Unit 6: Fire Growth ..................................................................................... 6.1Lesson A: Plotting Fire Size and Shape ............................................. 6A.1Lesson B: Point Source ..................................................................... 6B.1
Unit 7: Extreme Fire Behavior ..................................................................... 7.1
Unit 8: Documentation, Briefings, and Monitoring for Fireline Safety ......... 8.1
Unit 9: Final Group Exercise ....................................................................... 9.1

iv

0.1
Introduction to Wildland Fire Behavior Calculations, S-390
Unit 0 – Introduction
OBJECTIVES:
During this unit the cadre will:
1. Introduce the instructors and students.
2. Discuss administrative concerns.
3. Explain course purpose and course objectives.
4. Discuss expectations for the course.
5. Review the evaluation process.
6. Explain how this course fits in the fire behavior curriculum.

0.2

0.3
I. INTRODUCTION
II. COURSE PURPOSE
To provide the student with wildland fire behavior knowledge applicable forsafe and effective wildland fire management activities.
This course builds upon the Intermediate Wildland Fire Behavior Course,S-290. The materials in this course, as well as in S-290, are elements of thefire behavior curriculum.
Students will be introduced to various methods of calculating fire behaviorcharacteristics, such as how fast the fire is spreading and how hot the fire is.
Students will be shown how such information can be applied by utilizing twomethods: Nomograms and Appendix B of the Fireline Handbook.
III. COURSE OBJECTIVES
Course objectives are stated in broad terms that define what the student willdo upon completion of the course.
• List the assumptions, limitations, and appropriate uses of fire behaviorprediction models.
• Describe how environmental factors and processes affect fire behaviorpredictions and safety.
• Define and interpret fire behavior prediction model inputs.
• Calculate fire behavior outputs using available fire behaviorprocessors.
• Interpret, communicate, apply, and document wildland fire behaviorand weather information.

0.4
IV. EXPECTATIONS
A. Student Expectations
What are your expectations for the course?
B. Instructor Expectations
• Attendance at all sessions.
• Be prepared to start on time.
• Participate and share ideas.
V. EVALUATIONS
A. Student Evaluation
• Final group exercise on Thursday worth 10 points.
• Final exam on Friday worth 90 points.
• 70 total points required to pass the course.
B. Course and Instructor Evaluation
This is an opportunity for students to comment on the course (and theinstructors) for the purpose of improving future training sessions.

0.5
VI. WHERE DOES THIS COURSE FIT IN THE FIRE BEHAVIORCURRICULUM?
A. Introduction to Wildland Fire Behavior, S-190
This course is the entry-level course designed around the basics offuel, weather, and topography.
It examines how these factors affect fire behavior in terms of safetyand fire suppression actions.
The course is presented to all individuals who will or could beinvolved with fire management activities.
B. Intermediate Wildland Fire Behavior, S-290
This course builds upon the basics learned in S-190 with more detailedtreatments of fuels, weather, and topography.
It provides a better basis for analyzing variables and understandinghow they interact and affect fire behavior for safety purposes.
A good example of the target audience is a tractor/plow operator orsingle resource boss.
C. Introduction to Wildland Fire Behavior Calculations, S-390
This course introduces fire behavior calculations by manual andelectronic methods such as tables, nomograms, and BehavePlus.
It gives students an in depth understanding of the determinants of firebehavior by discussing input (wind, slope, fuels, fuel moisture, etc.) tothe prediction process.
Interpretations of the fire behavior outputs are taught to enhance thestudent’s ability to understand fire behavior and provide “tools” tohelp in fire management decisions.

0.6
D. Advanced Wildland Fire Behavior Calculations, S-490
This course is designed to give state of the art capability to determineinputs for fire behavior determination. It provides students with an indepth knowledge of interpretations of model outputs.
The course teaches students to project fire perimeter growth based onweather predictions and knowledge of fuels and topography.
A variety of fire scenarios is presented for students to make firebehavior calculations and interpretations.
1.1
Introduction to Wildland Fire Behavior Calculations, S-390
Unit 1 – Topography
OBJECTIVES:
Upon completion of this unit, students will be able to:
1. Identify the different elements referenced in the legend of topographic maps.
2. Identify significant topographic features on a map.
3. Determine map scale and contour interval without the map legend.
4. Determine slope percentages for given slope on a USGS topographic mapgiven scale and contour interval.

1.2
1.3
I. IDENTIFY THE DIFFERENT ELEMENTS REFERENCED IN THELEGEND OF TOPOGRAPHIC MAPS
A. Map Legend
Legends are usually found at the bottom of a map.
B. Elements of the Legend
1. Map scale
Map scale is the relationship between distance on a map and thecorresponding distance on the ground.
Scale is expressed as a ratio, such as 1:24,000, and showngraphically by bar scales marked in feet and miles, or in metersand kilometers.
a. 1 inch on the map equals 24,000 inches on the ground.
b. 1 inch on the map equals 2000 feet on the ground.
c. 2.64 inches on the map equals 1 mile on the ground.
d. There are 80 chains to a mile and 66 feet to a chain.
e. Approximately 3 chains for every 1/10 inch on the map.

1.4
2. Contour interval
a. The distance in elevation between two adjacent contourlines.
b. Usually given in feet.
c. Contour interval is usually found directly under the mapscale.
II. IDENTIFY SIGNIFICANT TOPOGRAPHIC FEATURES ON A MAP
Contour Lines:
• Never cross.
• Don’t end at the edge of the map.
• V-shaped contours pointing up hill indicate a drainage or valley.
• V- or U-shaped contours pointing downhill indicate a ridge.
• Complete circle contours indicate the top of hills.
• Complete circle contours with hatcher lines inside indicatedepressions.
• Closely spaced contours indicate steep slope.
• Contours spaced far apart indicate gentle or flat terrain.
• Every fifth contour line is printed in a darker color or thicker line.
– This is called an Index Contour.
– On most of the index contours, the elevation will be written in.

1.5
III. DETERMINE MAP SCALE AND CONTOUR INTERVAL WITHOUT ALEGEND
A. Check the Contour Interval
Contour interval is the distance in feet between two adjacent contours.
1. Find two adjacent index contours with the elevations printed onthem.
• Index contours are every fifth contour line.
• Index contours are printed thicker for easy identification.
2. Find the difference between the two index contours bysubtracting the lower number from the higher number.
• Divide that number by 5; this gives the contour interval.
B. Determine the Map Scale
Sections are typically 1 mile square; however, not all sections are 1mile square. It is important to measure several sections lines.
• Remember: The map you receive may have been copied andreduced in size.
• Checking the size of a section will verify the map distance.

1.6
IV. DETERMINE SLOPE PERCENTAGES FOR A GIVEN SLOPE ON AUSGS TOPOGRAPHIC MAP GIVEN MAP SCALE AND CONTOURINTERVAL
A. Calculating Slope: Calculate the Elevation Difference
1. Count the number of contour lines between the two points andmultiply by the contour interval 19 contours x 40 foot interval =760 feet rise.
2. A better way would be to make your measurement of the twopoints from one index contour to another index contour.
a. Subtract the lower elevation from the higher number.
b. The result would be the elevation change.
c. Make sure the two points you are calculating for do not:
• Cross a ridge or drainage.
• Go across slope.
3. Measure the distance between two points in the area for whichyou are calculating slope.
For example:
• Measure from point A to point B. You should getapproximately 1 inch. Multiply 1 (inch) by 2000 (feet perinches); the distance is 2000 feet.
4. Use the formula:
RISERUN x 100

1.7
B. Review
1. Two adjacent index contours have the following elevationsprinted on them: 2300 and 2500
• 2500 – 2300 = 200 feet
• 200/5 = 40 foot contour interval
2. There are 19 contour lines between points A and B.
• 19 x 40 = 760 foot elevation difference (RISE)
3. The measured distance is 1 inch.
• 1 x 2000 = 2,000 feet (RUN)
4. Calculate the slope.
• 760 ÷ 2000 x 100 = 38%
Remember: When using a calculator, enter in the top numberfirst, then divide by the bottom number, then multiply the totalby 100.

1.8
Exercise 1 - Slope Calculations
Use the Hellroaring map on the next page to calculate slope percent for each of thethree areas (A-B, C-D, E-F).
INPUT
0 Projection Point A-B C-D E-F
1 Contour Interval _____ _____ _____
2 Map Scale _____ _____ _____
3 Conversion Factor _____ _____ _____
4 # of Contour Intervals _____ _____ _____
5 Rise in Elevation _____ _____ _____
6 Map Distance, in (btwn pts) _____ _____ _____
7 Horizontal ground Dist, ft _____ _____ _____
OUPUT
1 Slope, % _____ _____ _____
01-01-S390-SR

1.9 01-01-S390-SR

1.10
2A.1
Introduction to Wildland Fire Behavior Calculations, S-390
Unit 2 – Weather
Lesson A – Atmospheric Stability
OBJECTIVES:
Upon completion of this lesson, students will be able to:
1. Define stable and unstable conditions using lapse rates.
2. Assess the effects of stability of instability on wildland fires.
3. Identify measures of stability and describe how they are computed.
4. Estimate atmospheric stability and probable fire behavior based uponidentification of visual indicators.

2A.2

2A.3
I. INTRODUCTION
Atmospheric stability has a significant influence on the wildland fire behaviorenvironment, but is not as easily assessed or measured as temperature, windand humidity.
This lesson examines the relationship between stability and fire behavior, andmethods of assessing stability.
II. STABILITY AND TEMPERATURE LAPSE RATES
Stability is the degree to which vertical motion in the atmosphere is enhancedor suppressed.
A. Stable
A condition of the atmosphere in which a parcel if displaced, either upor down, will tend to return to its original level. Vertical motion isrestricted.
B. Unstable
A condition of the atmosphere in which a parcel of air, if displacedeither up or down, will tend to continue in the direction ofdisplacement. Vertical motion is enhanced.
Stability is related to buoyancy, or the tendency or capacity of air torise. There are degrees of stability; the atmosphere is composed oflayers of differing stability.
The stability of an atmospheric layer can be determined by examiningthe difference in temperature between the top and bottom of the layer.This is compared to the rate at which rising air would cool in the sameenvironment.
2A.4
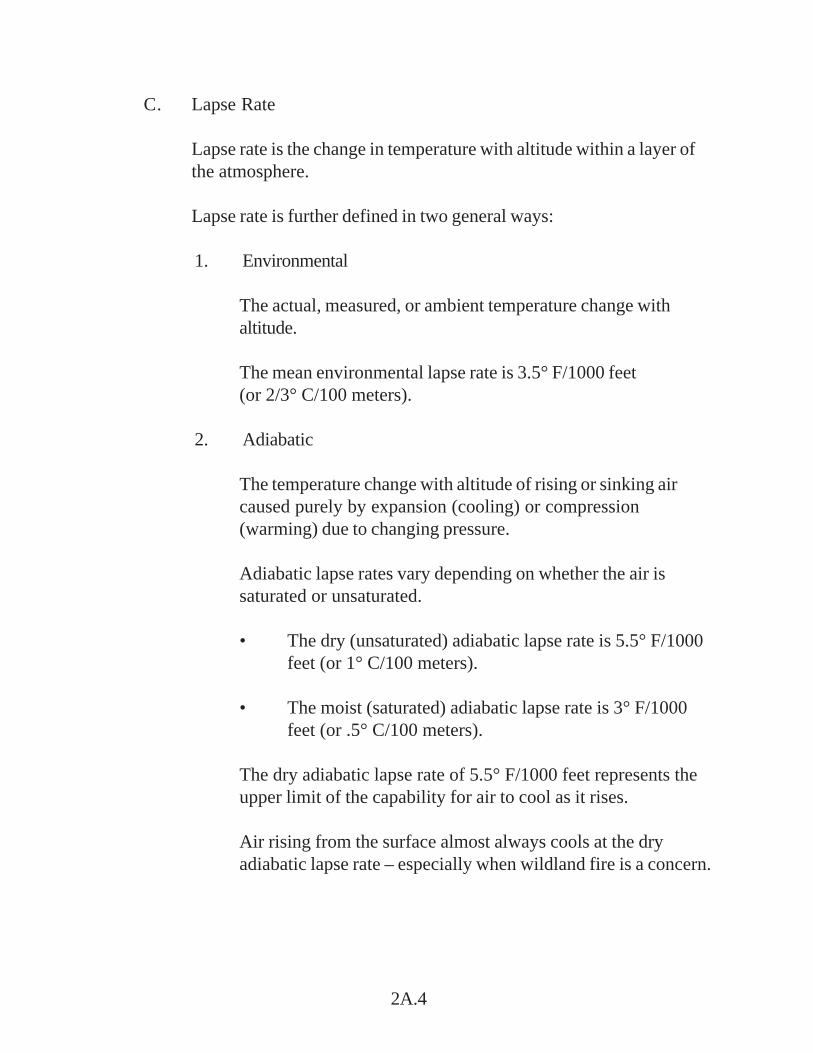
C. Lapse Rate
Lapse rate is the change in temperature with altitude within a layer ofthe atmosphere.
Lapse rate is further defined in two general ways:
1. Environmental
The actual, measured, or ambient temperature change withaltitude.
The mean environmental lapse rate is 3.5° F/1000 feet(or 2/3° C/100 meters).
2. Adiabatic
The temperature change with altitude of rising or sinking aircaused purely by expansion (cooling) or compression(warming) due to changing pressure.
Adiabatic lapse rates vary depending on whether the air issaturated or unsaturated.
• The dry (unsaturated) adiabatic lapse rate is 5.5° F/1000feet (or 1° C/100 meters).
• The moist (saturated) adiabatic lapse rate is 3° F/1000feet (or .5° C/100 meters).
The dry adiabatic lapse rate of 5.5° F/1000 feet represents theupper limit of the capability for air to cool as it rises.
Air rising from the surface almost always cools at the dryadiabatic lapse rate – especially when wildland fire is a concern.

2A.5
For these reasons, atmospheric stability is defined byenvironmental lapse rate as follows:
• Unstable: Environmental lapse rate greater than5.5° F/1000 ft.
Air rising at the dry lapse rate will remain warmer than theenvironment and continue to rise on its own.
• Stable: Environmental lapse rate less than 5.5° F/1000 ft.
Air rising at the dry lapse rate will remain cooler than theenvironment and will want to return to its original level.
• Neutral: Environmental lapse rate equal to 5.5° F/1000feet.
This state is usually a short-lived transition periodbetween stable and unstable conditions.
Air rising at the dry lapse rate will remain in equilibriumwith the environment.

2A.6
III. EFFECTS OF STABILITY ON WILDLAND FIRE ENVIRONMENT
Stability and changes in stability are related to weather processes andparameters important to the fire environment.
A. General Assumptions Regarding Stability and Associated WeatherParameters and Processes
1. Pressure
High pressure produces stable conditions through subsidence.This can ultimately lead to an inversion.
Conversely, low pressure is usually associated with unstable air.
2. Lifting
Lifting an air mass layer will make it become more unstable.Lifting can be accomplished through:
• Convection• Frontal lifting• Orographic lifting
Typically, air masses are stable far ahead of a front, unstablenear the front, and stabilize behind the front.
3. Winds
Sudden increases in winds can destroy inversions and increasethe instability of the air mass.
During a hot unstable afternoon, winds can be quite light, but areoften erratic and gusty. In this case, under the calm conditions,the degree of instability would usually be greater.
2A.7
After the mixing action by the winds, the lower levels could verywell be unstable. However, the degree of instability would beless than the calm wind situation.
The effect of winds on the fire environment is dramatic.Unstable and/or windy conditions contribute to rapid rates ofspread and potentially violent fire behavior.
4. Temperature
Heating from below and/or cooling from above will increaseinstability, while cooling from below and/or heating from abovewill make the atmosphere more stable.
For example, hot sunny days result in high surface temperaturesand thus make the lower levels of the atmosphere unstable.Clear, cool nights produce the opposite effects (inversions).
5. Topography
Topography effects heating/cooling of slopes and valleys, andthus the stability.
For example, south facing slopes are generally warmer and havegreater instability above them than north facing slopes.
Be aware that superheated air may build up in poorly ventilatedvalleys.
Triggering mechanisms such as inversion breakup or a suddenincrease in winds could release this instability with violentresults.

2A.8
6. Relative humidity
Normally, relative humidity neither directly affects nor is affectedby the stability of the atmosphere.
On the local scale, relative humidity can drop dramatically as theatmosphere destabilizes with the breakup of morning inversions.
B. Daily and Seasonal Changes in Stability
Normal daily changes in stability are related to temperature changes.
Assuming a typical summer day with clear skies and light winds, thelowest layers of the atmosphere are stable at night (greatest stabilityjust before sunrise) and unstable during the late morning and afternoon.
The greatest instability is during the late afternoon (hottest part of theday).
Two important points to remember:
1. When inversions lift, there is usually a pronounced transition tomore unstable conditions (visibility quickly improves and windsbegin to stir).
2. The greater instability of the air mass above the inversion, themore pronounced the transition is likely to be.
Beware of days when the Haines Index is 5 or 6.

2A.9
Normal seasonal variations in stability are related to the seasonalvariations in temperature. Winter has more stable conditions than theother seasons due to colder temperatures and longer nights.
Conversely, summer is most unstable due to warmer temperatures andlonger hours of sunlight. Spring and fall are harder to define due togreater variability across the country and the fact that these aretransition months between winter and summer.
Stability changes frequently and those changes are directly related tosurface temperature. The most unstable conditions are associated withthe warmest surface temperatures and the atmosphere becomes moreunstable as surface temperatures increase.
The local fire weather meteorologist should be consulted for insightinto expected changes in stability that could impact your decisionmaking process in the wildland fire environment.
C. Effects of Stability on Wildland Fire Behavior
1. Fires burning under unstable conditions have:
a. Stronger, more vertically developed smoke/convectioncolumns.
b. Greater potential to move from surface to aerial fuels (tobecome three-dimensional).
c. Greater potential for extreme fire behavior includingcrowning, long-range spotting and firewhirls.
d. Better ventilation, so air quality problems are usuallyminimized.
e. Normally, more complete fuel consumption due to highersurface and fuel temperatures, stronger winds, and lowerfuel moisture.
2A.10
2. Fires burning under stable conditions have:
a. Less potential for extreme fire behavior (except in caseswhere fires burn in poorly ventilated canyons that allowdangerous buildup of gasses and preheat and dry fuels).
b. Poor ventilation, so air quality may be a significantproblem.
c. The potential for hindering detection of other fires due toreduced visibility by smoke. Air operations may bedelayed or precluded by inversions.
d. The potential for impacting prescribed burns due tooverloading areas with smoke.
The bottom line: The potential for extreme fire behaviorincreases dramatically when the atmosphere is unstable.
IV. MEASURES OF STABILITY AND HOW THEY ARE COMPUTED
There are several indices used by the fire management community thatattempt to put a number, adjective term, or category on stability and thepotential for fire behavior to increase and/or smoke to disperse readily.
All of these indices account for temperature lapse rate to one degree oranother.
A. Davis Stability Index (Ref. Atmospheric Stability Forecast and FireControl, R. T. Davis)
1. Looks at temperature lapse rate in the lowest 5000 ft. aboveground level.
2. Correlates lapse rate to large (Class E or greater) fireoccurrence looking at 70 fires in Alabama (most active firebehavior occurs when lapse rate > 5.5°F/1000 ft.).

2A.11
3. Applicability limited because lapse rate > 5.5°F/1000 ft. occursroutinely below 5000 ft. AGL across most of the U.S. duringthe active fire season.
4. Used currently in portions of the southeast U.S.
B. Haines Index (Ref. The Haines Index and Idaho Wildfire Growth,Werth & Ochoa)
1. Looks at temperature difference and moisture in a layer of theatmosphere above the fire.
2. Three elevation layers (Low, Mid, High) used to account fordiffering terrain across the country.
a. Much of the eastern U.S., excluding the AppalachianMountains, uses a low elevation index computed from alayer approximately 2,000-5,000 ft. MSL.
b. A mid-elevation index was developed for the Great Plainsand Appalachian Mountains using a layer 5,000-10,000 ft.MSL.
c. A high elevation index is used for the mountainouswestern U.S. using a layer approximately 10,000-18,000ft. MSL.

2A.12
3. Correlates dryness and instability to “worse fire situations” on74 fires across the country.
4. Has been shown to have application nationwide, though regionalinterpretation sometimes necessary.
5. Has been shown to relate to higher rates of spread, strongconvection columns and extreme fire behavior on going fires.
6. Stability term is directly related to lapse rate.
Stability Term (1 to 3) + Moisture Term(1 to 3) = Haines Index (2 to 6)1 = Stable/Moist to 3 = Unstable / Dry
C. Pasquill Stability Index (or Pasquill-Gifford-Turner Stability Index)
1. Looks at combination of surface heating (solar radiation) andsurface wind speed.
2. Surface heating based on solar radiation and amount of cloudcover.
3. Used in smoke management, such as Simple Approach SmokeEstimation Model (SASEM) as a quantifier of verticaldispersion potential.

2A.13
4. Ranges from A (Very Unstable/Excellent Dispersion) to G(Moderately Stable/Poor Dispersion).
5. Dispersion and stability decrease as wind increases.
6. Lapse rate is inferred directly from the amount of incomingsolar radiation.

2A.14
D. Lavdas Dispersion Index (or Lavdas Atmospheric Dispersion Index)
1. More comprehensive index that involves stability, mixing height,and transport winds.
2. Uses Pasquill Stability Index (in a numeric format) as an input,thus surface heating and surface wind speed are considered.
3. Quantifies combination of vertical and lateral dispersion, asopposed to just vertical with Pasquill.
4. Dispersion increases as transport wind increases.
5. Ranges from near zero to over 100.
6. Has been shown to have some correlation to large fire growth inFlorida.

2A.15
7. Lapse rate is included as part of the Pasquill Stability Indexinput.

2A.16
E. Review and Comparison of Stability Indices
These indices provide simple, quantifiable means for looking atstability related factors in the wildland fire environment.
It is important to recognize that all utilize lapse rate in one way oranother and that all have strengths and weaknesses specific to theirdevelopment and application.
It would be a mistake to believe that any one index held all the answersregarding something as complex as stability.

2A.17
V. ESTIMATE ATMOSPHERIC STABILITY AND PROBABLE FIREBEHAVIOR BASED UPON IDENTIFICATION OF VISUALINDICATORS
A. Best Method
Contact the local fire weather forecaster or consult fire weatherforecast.
B. Visual Indicators
C. Other Data Sources
1. Aircraft temperature profiles.
If available, temperature readings every 500 feet above groundlevel will provide a very detailed temperature profile.
Apply the 5.5° F /1000 feet rule to determine stability. Relay thedata to a fire weather meteorologist who will be able to predict ifand when any inversions will lift.

2A.18
2. Lookouts, RAWS/NFDRS stations, fireline personnel, and airoperations.
These are all good sources of information with regard to thepresence or absence of inversions, when inversions begin tobreak, tops of smoke layer, etc.
Fireline observations taken at different elevations on the sameaspect can also be used to estimate lapse rate and stability.
3. The Fireline Handbook has a basic reference to observablefireline conditions that indicated instability.
4. Upper Air data from Internet.
VI. SUMMARY
Atmospheric stability plays a significant role in the wildland fire environment,and can be assessed both objectively and subjectively using computedindices and visual indicators.
Unstable conditions can lead to extreme fire behavior, but excellent smokedispersion. Stable conditions can lead to subdued fire behavior, but poorsmoke dispersion and possible air quality standards violations.
Giving these offsetting concerns, and the fact that stability is alwayschanging, it is critical that fire managers have the ability to assess stability.

2B.1
Introduction to Wildland Fire Behavior Calculations, S-390
Unit 2 – Weather
Lesson B – Winds
OBJECTIVES:
Upon completion of this lesson, students will be able to:
1. Describe the winds generated on different meteorological scales.
2. Describe both General Winds and Local Winds that are defined as CriticalWinds.
3. Describe the effects of atmospheric stability and instability on 20 ft. winds.
4. Estimate 20 ft. winds given General Winds, Local Winds, and stability.
5. Given the 20 ft. wind speed, determine mid-flame wind speed using the windadjustment tables.

2B.2

2B.3
I. INTRODUCTION
Through lecture, demonstration, and exercises, students will be instructedhow to determine surface wind speed and direction. Students will beexpected to complete a written proficiency exercise on the objectives.
A. Wind – The Problem
The variability of wind both in time and space presents a difficultproblem. Mathematically speaking, the wind field is “continuous,” inthe field.
There are many inconsistencies that are difficult to explain oranticipate. In certain locales, winds behave quite predictably, but whenfires become large, it is often because of an unusual or unpredictedwind situation.
This lesson will help students understand the basic principles that drivelocal surface winds, and provide tools to help make estimates ofprobable wind speeds and directions.
B. Wind Direction
The wind direction definition has caused some participants problemsin the past. Even simple concepts at times need to be restated andemphasized.
Wind direction is the direction the wind is blowing from. For example,a north wind is blowing out of the north.

2B.4
II. WIND PATTERNS
A. General Winds
All winds blow in response to pressure differences.
In the very broad (Synoptic) scale, the winds that are produced arecalled “General Winds.”
General Winds can be separated into two distinct zones:
1. Winds aloft
These are the winds that blow in the “Upper Atmosphere,”unaffected by friction caused by the terrain or other surfacecharacteristics.
The jet stream at 30,000 ft. MSL is an example of a wind aloft.
2. Free Air (or gradient) winds
Free Air or gradient winds are those caused by the circulationbetween large-scale high and low pressure systems.
Depending on the stability and the surface roughness, thesewinds can be constrained to 10,000 ft. MSL or higher, or canextend downward to near the surface.
The southerly wind in advance of an approaching low pressuresystem is an example of a gradient wind.

2B.5
B. The Friction Layer
The surface of the earth is characteristically rough and will disrupt theGeneral Wind due to frictional effects.
This creates a turbulent zone, or friction layer, next to the earth’ssurface that varies in thickness with the roughness of the surface andthe speed of the wind.
The average depth or thickness of this layer may be quite shallow overuniform, flat terrain; or it could be as deep as 2,000 to 3,000 feetabove ground level in complex, mountainous terrain.
The friction layer also varies in depth from day to night.
The term “General Wind” will be used to describe the winds at the topof the friction layer, which are the combined result of the winds aloftand the gradient winds.
The winds that may be observed at any given point on the surface ofthe earth are a combination of many factors.
The General Wind will most often contribute to the wind observed at agiven locale, thus knowledge of the General Wind is imperative tomaking a total assessment of the strength and direction of the surfacewind.

2B.6
C. Local Winds
If the effects of the General Wind are ignored, then local winds may begenerated totally by small-scale pressure gradients produced bytemperature differences.
This type of wind is most pronounced in areas of discontinuoustopography. The most significant local winds are:
1. Slope winds
a. Upslope winds begin soon after the suns direct rays beginto warm a slope.
They begin first on east slopes, but are normally strongerin the afternoon on southwest and west aspects.
Upslope winds alone are normally in the range of 3 to 8mph, and are usually gusty.
It is important to know the local area because typical windspeed values may vary considerably between areas.
b. Downslope winds begin soon after a slope loses thedirect solar radiation in the afternoon or evening.
There is normally a transition on any given slope thatconsists of:
• Dying of the upslope wind.
• A transition period of relative calm.
• The onset of a gentle laminar flow down the slope.
Downslope winds are typically in the range of 2 to 5 mphand are normally quite steady.

2B.7
c. Slope wind profiles
The strength, duration, and transition period of wind onany slope is a function of its aspect.
It is important to remember the onset, strength, andduration of slope winds on every aspect as this will affectnot only fire behavior, but possibly tactics and strategy.
2. Valley winds
a. Up-valley wind
Up-valley winds normally begin later in the morning thanthe upslope winds, and are the result of slightly larger-scale convective processes.
The up-valley winds normally reach maximum speeds of10 to 15 mph in the mid- to late-afternoon.
b. Down-valley wind
Down-valley winds normally undergo a transition much asthe downslope flow, and usually begins within a fewhours after dark.
Down-valley flow seldom exceeds 10 mph, but as in mostother weather related phenomena, there are exceptions.

2B.8
c. Combination of valley and slope wind
The combination of valley and slope wind results in adiurnal turning of the wind on valley sidewalls.
Mid-morning winds on valley sidewalls blow directlyupslope before the development of the valley wind.
As the up-valley wind develops and becomes established,it gradually overpowers the slope wind.
Upslope winds begin to blow at an angle, and by mid-afternoon may blow directly across the slope.
This “cross slope” wind continues to shift during theevening, and eventually blows directly downslope afterdark.
The up-valley wind then ends and a shallow down-valleywind begins.
After midnight, the down-valley wind becomes deepenough to gradually shift the downslope wind to a “crossslope” wind, this time blowing directly down-valley.
This wind continues until after sunrise when the upslopewind again develops.
This completes a diurnal cycle on the valley sidewall inwhich the wind direction changes a full 360° during the24-hour period.

2B.9
3. Sea/land breezes
a. Sea breezes
Sea breezes are the result of differential heating of thewater and land surfaces.
They normally begin around mid-morning on the eastcoast of the United States, but closer to midday on thewest coast.
These winds strengthen during the day and end aroundsunset, relative to the difference in temperature betweenthe land and water.
The onshore breeze may reach speeds of 10 to 15 mph,but can attain speeds of 20 to 30 mph along theWashington, Oregon, and California coasts.
A period of notably hot, dry, and still conditions canprecede the onset of the sea breeze and cause asubstantial increase in fire behavior.
b. Land breezes
Land breezes result from the differential cooling rates ofthe land and water surfaces.
They normally begin 2 to 3 hours after sunset, and areusually on the order of 3 to 10 mph.
2B.10
D. Critical Winds
Critical Winds are of most concern to firefighters as they are definedas winds that would totally dominate the fire environment.
These are the moderate to strong winds that fan fires out of control,threatening life and property.
These winds include:
1. Frontal winds
Frontal winds are produced by large scale pressure gradientsand may be classified in the General Wind category.
The effects of the strong and shifting winds associated with afrontal passage may totally dominate the fire environment.
Since frontal systems may be accompanied by various otherweather factors (thunderstorms), it is not possible to quantifywind speeds with frontal passages.
Be aware of the timing of expected frontal passages. Also bealert to the potential of the variable winds that normally areassociated with this event.
2. Thunderstorm winds
Thunderstorm winds can be strong and quite gusty.
Strongest winds are usually associated with the mature anddissipating stages of the thunderstorm and speeds of 40 to 60mph are not uncommon.
Lighter winds are noted in the formative stages of the storm,with inflow winds of 5 to 10 mph.

2B.11
3. Foehn winds
Foehn winds are associated with major mountain ranges andspecific large-scale weather patterns.
These winds can reach speeds in excess of 50 mph and aregenerally warm and dry.
Some examples of foehn winds are the Chinook, Santa Ana, andEast Winds.
4. Glacier winds
Glacier winds are local downslope winds that impact locationsadjacent to the base of glaciers.
Highest wind speeds occur around midday, driven by thedifference in temperature between the air over the ice and theadjacent land.
The distance glacier winds extend across the adjacent land isrelated to this temperature difference, in addition to anychanneling by the valley where the glacier resides.
Downslope winds of up to 50 mph have been noted to extend10 miles from the bases of large glaciers in Alaska.
Glacier winds have been known to catch off guard firefighterswho were expecting upslope winds as valley temperatureswarmed.

2B.12
5. Whirlwinds
Whirlwinds develop as the result of local effects, bothtopographic and atmospheric.
They are formed in a highly unstable lower atmosphere,triggered by some mechanical or other disturbance that initiatesa whirling motion in the wind flow.
There are various scales of whirlwinds, few of which wouldtotally dominate the fire environment.
They can be a very troublesome phenomenon if they occur neara fire’s edge.
6. Reverse wind profiles
Reverse wind profiles are situations where the surface or lowlevel winds are stronger than the winds aloft.
This contrasts to the usual situation where winds increase withaltitude.
The implication for fire behavior is that reverse wind profilesallow a strong convection column to develop directly over a firewithout being sheared away by stronger winds aloft.

2B.13
There are two main types of reverse wind profiles:
a. Low level jet
Low level jet streams are currents of relatively fast movingair near the earth’s surface that affect areas mainly east ofthe Rockies.
They are General Winds caused by large scale forcingmechanisms, usually cold fronts or lee-side troughs.
Peak winds range roughly from 25 to 40 mph, and areusually about 1000 to 2500 feet above the surface.
The main threat is for these winds to surface or affecthigher terrain and cause rapid rates of spread.
b. Local forcing
Under situations where General Winds are light, moderateto strong Local Winds can lead to a reverse wind profile.
These situations are possible across the intermountainwest and also coastal areas, where vigorous Local Windsystems occur under general high pressure.
The strongest winds are at the surface and may only be10 to 20 mph. This type of reverse wind profile is highlylocalized, but has caused some of the most significantblowup fires.

2B.14
III. FACTORS OF STABILITY
The temperature structure in the lower atmosphere changes from day tonight. Stability or instability can be measured by the rate of change of thetemperature with increasing elevation.
The degree of stability or instability affects the mixing potential of the loweratmosphere; it is normally stable at night with light winds.
During the afternoon, the atmosphere becomes more unstable, with a risk thatstronger General Winds aloft could surface. This is because unstableconditions increase the depth of the turbulent friction layer.
Remember: When the atmosphere is stable (inversions), there is usually littlewind. When the atmosphere is unstable, there is the potential for strongersurface winds regardless of the time of day.
It is possible for a large fire to modify the stability of the lower atmosphere ifterrain and fuel conditions are right. This could enhance convection columndevelopment and surface winds.
IV. SOURCES OF WIND INFORMATION
A. Fire Weather Forecaster
The best source of weather information is the fire weather forecaster.
This forecaster may be a direct resource assigned to the project, ormay be a forecaster assigned to the local National Weather Serviceforecast office.
This person can give site-specific wind forecasts.
2B.15
B. Persistent Patterns
Personnel who are on a fire for several days are often able to develop afeel for wind patterns that are consistently the same, day in and dayout.
These are called persistent patterns, and can provide an idea of whatwill happen in future burning periods if the overall synoptic scaleweather pattern does not change.
Use this method of predicting winds only if there is assurance from aknowledgeable fire weather forecaster that the general weather patternis not expected to change.
C. On-Site Measurements
On-site measurements may be used to make an immediate assessmentof what a fire may do.
This technique may be referred to as “Now-casting” and does havelimitations.
Be sure that the wind being measured is not being influenced by thefire. It should be taken in a location that is representative of the fuels,topography, and weather that is or will be controlling the fire’sbehavior.
D. Assessment of Local Conditions
If all else fails, take a general weather forecast from whatever source isavailable and make a best guess as to what the wind will be.

2B.16
V. PROCEDURES FOR ASSESSING SURFACE WINDS
In order to derive the wind input for fire behavior prediction, follow asystematic procedure and arrive at a reasonable estimate.
If there is a fire weather forecaster available, this weather “Expert” shouldprovide the wind data needed. If not, assess the situation and get on with thetask at hand.
The surface or 20-ft wind is the input needed. Recall from S-290 that thewind measured 20 feet above the mean vegetation height is considered as thesurface wind standard for fire behavior purposes.
The 20-ft. wind can be described with this simple diagram:
In the absence of a dominating Critical Wind, the surface wind is acombination of the Local Wind and the General Wind.
2B.17
A. Critical Winds
These winds are defined as those that can totally dominate the fireenvironment. Consider these winds first!
• Review all forecasts for warnings regarding weather events thatmay be accompanied by strong winds.
– Be alert for mention of frontal passages, low level jet,strong glacier winds, thunderstorms, Santa Ana, or otherfoehn type winds, etc.
• Discuss the situation with knowledgeable locals.
– Learn about local problem areas that may spawnwhirlwinds or other local peculiarities.
• If available, review weather observations from the area, find outwhat caused the fire to spread rapidly, and note any unusualwind or weather patterns.
B. Local Wind Factor
Use normal local wind patterns to derive an estimate of direction andspeed by time of day.
Remember:
• Local winds are best developed under clear/sunny skies.
• Upvalley/upslope winds are gusty.
• Downslope/downvalley winds are steady.
• Valley winds, when fully developed, can overpower slopewinds.

2B.18
C. General Wind Factor
Use the general forecast and overlay the forecast General Wind on thefire area map.
Consider the following stability and terrain effects when assessing thecontribution of General Winds at the surface.
• General Winds are more likely to surface when the air isunstable.
• Ridgetop winds are a good indicator of General Winds.
• General Winds have a greater effect on upper slopes than lowerslopes.
• Friction slows General Winds.
• General Winds are more likely to surface when parallel to avalley.
• Light General Winds (less than 10 mph) are unlikely to surface.
• General Winds have little impact on sheltered areas, such as theimmediate downwind or lee side of sharp topographic features.
– In reality, this is a much more complex problemdependent on stability and the specific nature oftopographic features.
– For this class, assume little or no General Wind impact onsheltered areas.
• Depending on the amount of instability and the overall exposure,50 percent or more of the General Wind speed can make it tothe surface.

2B.19
EXERCISE 1.
For this exercise, use pages 2B.29 – 2B.32.
VI. MIDFLAME WIND
Wind data that is required for the computation of fire spread in the USFBPSModel is the “Midflame Wind.”
This is the wind at one-half the flame height. To derive this wind, studentsmust know the 20-foot wind, fuel type, and the degree of sheltering.
The degree of sheltering of the fuels is a function of canopy density and theposition of the fuel bed on the landscape. It is also a function of thedirection and speed of the wind as it relates to the steepness of a slope, aswell as the angle of attack of the wind on the slope.
These factors are much easier to assess in the field, and in most cases, it willbe intuitively obvious if the site can be physically seen.
An important thing to remember is that nighttime 20-foot drainage winds donot need to be reduced to the midflame level. This is because the cool,stable air is sinking towards the surface, such that the 20-foot and midflamewinds are essentially equal. Midflame wind reduction tables are in the FirelineHandbook.
There is some subjectivity involved in figuring midflame winds due todiffering assessments of stand density and sheltering. Usually, there will beone or two reasonable answers using the tables, and both will give similarresults.

2B.20
The following example problems are to ensure we are all on the same track:
1. Fuel Model 8. Site on upper third of slope, fuels beneath standingtimber, wind blowing directly at slope. 20 ft. wind 12 mph.
Midflame Wind = ___________
2. Fuel Model 1. Site on upper third of slope, 100 acre meadow of pinegrass, wind blowing directly at the slope. 20 ft. wind 15 mph.
Midflame Wind =______________
3. Fuel Model 10. Dense stand, fully sheltered, site on lower third ofslope. 20 ft. winds 18 mph.
Midflame Wind =______________
EXERCISE 2.
For this exercise, use pages 2B.33 – 2B.35.
2B.21
VII. REVIEW
Making estimates of local wind patterns is difficult. Even trained andexperienced fire weather forecasters usually do not come up with the sameanswers when looking at problems such as the examples in this unit.
A wind input is necessary to complete the calculations. Firefighters shouldhave a basic knowledge of winds and midflame winds sufficient to make arough forecast of winds, if necessity dictates.
To begin the analysis of wind on a fire, consider the following factors:
• How much time is available to complete the assignment and make aprediction?
• Is the prediction for daytime or nighttime? Is it necessary to considerthe transition from one to the other?
• What is the terrain like?
• Is the fire sheltered beneath standing timber or is it unsheltered to thewind?
• Is there a large body of water or other geographic features that mayinfluence wind speed and direction?
• What has the wind done in previous burning periods?
• What weather data is available?
• Where can additional weather data observed and forecasted beobtained, and how soon?
• Contact knowledgeable locals and check for any unusual wind orweather patterns.
2B.22
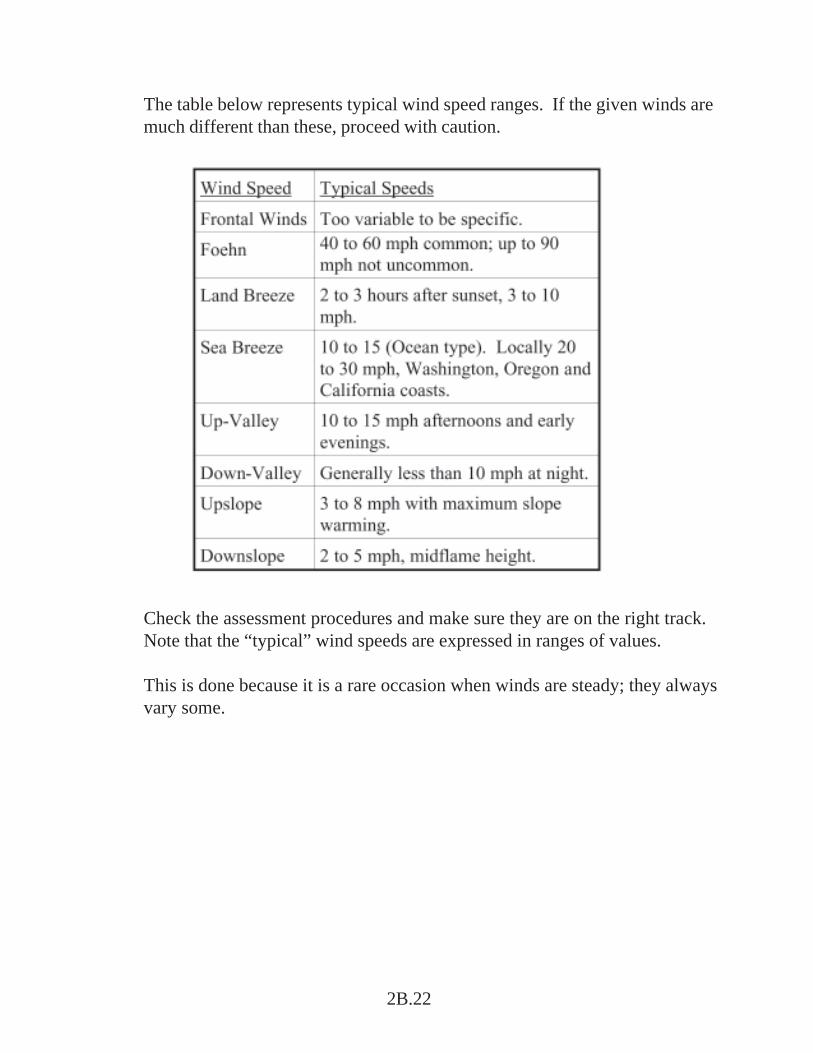
The table below represents typical wind speed ranges. If the given winds aremuch different than these, proceed with caution.
Check the assessment procedures and make sure they are on the right track.Note that the “typical” wind speeds are expressed in ranges of values.
This is done because it is a rare occasion when winds are steady; they alwaysvary some.

2B.23
The following table is the Beaufort Wind Scale. If no other way to measurewind is available, an estimate of speed can be made using the visualindicators described. Become familiar with this scale and have it availablewhen needed.

2B.24
VIII. SUMMARY
The “Guts” of the USFBPS Model have not yet been covered in this course.Nonetheless, there are a few wind-related assumptions of the USFBPS thatare important to know.
• It is assumed that the local environment that would exist without thefire will control the fire’s behavior (the fire’s influence on the wind isignored).
• If a burning prescription relies on fire induced indrafts to producedesired fire behavior (burnout or backfire), the model has limitedapplicability.
• If winds are strong enough (and fuel conditions proper) to produce arunning crown fire, the model does not apply.
The job of the fire prediction specialist is difficult and demanding. Withoutthe services of a fire weather forecaster, the job becomes double-tough.When put into the position of having to assess the local surface winds on aproject, use every trick possible.
Approach the job with respectful caution and do not forget to assess theentire fire situation before starting to work. Do not get sucked into wastingtime on problems that don’t make any difference.
Final reminder: Do not forget which way the wind blows!

2B.25 2B-01-S390-SR

2B.26

2B.27 2B-02-S390-SR

2B.28

2B.29 2B-03-S390-SR
EXERCISE #1
This exercise is an example problem that illustrates how to use the assessmentprocedure. The exercise requires class participation in developing a reasonableassessment of the wind at each point.
Remember: The wind that is developing is the 20-foot wind – that is the wind at 20feet above the average ground cover. The only exception is that the downslopewind at night is considered to be close to the surface.
There is no single correct answer; the procedure will produce a range of reasonablesolutions. You should be able to estimate 20-foot winds within 45 degrees ondirection and 5 mph on speed using the methodology described.
Use the quad map on page 2B.32 to complete the following:
1. With no (calm) free air winds, 3 p.m. midsummer conditions:
Give 20 ft. wind directions at points A, B, C, D, and E. Assign 20 ft. windspeeds for these points at the same time.
A=B=C=D=E=
2. Free air winds are SW 20 mph, all else as in question 1 above:
Determine General Wind Component at all points.
A=B=C=D=E=

2B.30
Show 20 ft. wind directions at all points.
A=B=C=D=E=
Assign 20 ft. wind speeds for these points.
A=B=C=D=E=
3. Free air winds are SE at 20 mph and the airmass is very unstable, all else as inquestion 1:
Determine General Wind Component at C, D, E.
C=D=E=
Show 20 ft. wind direction at these points.
C=D=E=
Assign 20 ft. wind speeds for these points.
C=D=E=
2B-03-S390-SR

2B.31 2B-03-S390-SR
4. Free air winds are SW 20 mph. A vigorous dry cold front is forecast to movethrough the area around 5 p.m.
Give expected 20 ft. wind directions at all points one hour before expectedfrontal passage.
A=B=C=D=E=
Give expected 20 ft. wind directions one hour after frontal passage.
A=B=C=D=E=
When and where would you expect the 20 ft. winds to be the strongestbetween one hour before and one hour after frontal passage?

2B.32 2B-03-S390-SR

2B.33 2B-04-S390-SR
EXERCISE #2
The “No-See-Um” fire (see quad map on page 2B.35) was started by a carelesscamper along the North Fork Trail on August 15. It has grown to about 250 acresand is burning actively in the understory of an open spruce-fir community (FuelModel 8). It has spotted over onto a southwest slope (Point D) into about a 50 acrepatch of red needled blowdown timber (Fuel Model 13).
The general forecast calls for stable morning conditions to give way to hottemperatures and unstable lapse rates in the North Fork canyon this afternoon. Thefree air wind is south 18 mph.
1. For 11 a.m., estimate the surface (20 ft.) wind speed and direction at points A,B, C, and D.
A=B=C=D=
2. Using known methods, determine the “midflame” wind speed for each pointfor 11 a.m.
A=B=C=D=
3. For 4 p.m., estimate 20 ft. wind speed and direction for each point.
A=B=C=D=

2B.34 2B-04-S390-SR
4. Determine “midflame” wind speeds for 4 p.m.
A=B=C=D=
5. For 2 a.m., determine 20 ft. wind speed and direction as well as the“midflame” winds for each point.
A=B=C=D=

2B.35 2B-04-S390-SR

2B.36

2B.37 2B-05-S390-SR
EXERCISE #3 (Optional)
It is late May in northern New Mexico (see quad map on page 2B.38). Daytimetemperatures are quite warm and afternoons are very unstable due to daytimeheating.
1. High pressure is dominant across the region, such that “free-air” winds arevariable at less than 10 mph. Figure 20 ft.wind speed and direction at allpoints for mid-afternoon.
A=B=C=D=E=
2. The high pressure area has moved east, such that “free-air” winds across thearea are now from the southwest at 20 mph. Figure 20 ft.wind speed anddirection at all points for mid-afternoon.
A=B=C=D=E=
3. Using 20 ft. winds from problem 2, figure midflame winds at the followingpoints assuming a dense Pinyon-Juniper stand (FM 6).
A=B=D=

2B.38 2B-05-S390-SR

2C.1
Introduction to Wildland Fire Behavior Calculations, S-390
Unit 2 – Weather
Lesson C – Weather Information and Forecasts
OBJECTIVES:
Upon completion of this lesson, students will be able to:
1. Identify various weather products available to assist the firefighter, whoprovides them, and how to obtain them.
2. Evaluate factors that can affect forecast accuracy and methods to mitigatethem.
3. Describe importance of timely and accurate on-site observations andproviding feedback to local weather office.
4. Identify indicators of significant weather changes and evaluate whether aprovided forecast is valid.
5. Describe methods for adapting forecasts to better reflect local conditions.

2C.2

2C.3
I. INTRODUCTION
With the inception of the National Fire Plan, the fire management agenciesand the National Weather Service (NWS) assumed joint responsibility for theprovision of fire weather services.
In addition to information provided by meteorologists, advancing technologyand the Internet have provided access to a staggering amount of weatherforecast and analysis information.
Tools and information available only to meteorologists 10 or 20 years ago arenow available routinely to anybody in the fire management community.
This lesson will review major sources of weather information and forecastsand how they can be best utilized to meet fire management purposes.
II. WEATHER OBSERVATIONS AND ANALYSIS
A. Surface Observation Data
Surface weather observation data is accessible in real time over theInternet. This includes parameters such as:
• Temperature• Relative humidity• Wind speed and direction• Dew point
Among the information available is the hourly data from the firemanagement agency’s Remote Automated Weather Station (RAWS)network.

2C.4
Hourly airport observations from the NOAA/FAA/DOD AutomatedSurface Observation System (ASOS) are also readily available.
Data from RAWS and ASOS are the most accessible and frequentlyutilized by the fire management community.
1. RAWS observations.
RAWS observations meet specific NWCG standards for theNational Fire Danger Rating System Forecasts (NFDRS).
They are designed and placed accordingly to record weather fordirect application to fire management.
Twenty-foot winds, used as input for NFDRS and the FireBehavior Prediction System (FBPS), are recorded at RAWS.
2. ASOS (Airport) observations.
ASOS observations meet specific NWS, FAA and DODstandards, and are placed almost exclusively at airports.
Information from ASOS stations is used to facilitate the takeoffand landing of aircraft, as well as to maintain a general climaticdatabase of general weather parameters.
3. RAWS and ASOS data access and interpretation.
RAWS data are accessed mostly through web sites hosted byeither BLM or NWS.
In almost all cases, ASOS observations made available to thepublic are fully decoded into a “friendly” format for ease ofinterpretation.

2C.5
B. Comparison of Wind Information Between RAWS and ASOS
Utilizing and comparing wind data from different observation systemsis a complex issue due to the differing standards for measuring windspeed.
The two main sources used for forecasting or observing wind for firemanagement application are ASOS (used at airport locations) andRAWS (used extensively in remote locations).
1. Effect of tower height on observed wind speed.
Because winds aloft decrease exponentially towards the surfacedue to frictional effects, higher towers generally record strongerwind speeds.
Considering tower height only, ASOS will measure strongerwinds than RAWS under a given situation because ASOS unitshave higher towers.
Differences in measured wind speed caused by tower height aregreatest when the surface is rough (forest) and least when thesurface is smooth (grasslands and airport runways).
2C.6
2. Effect of wind averaging on observed wind speed.
The gusty nature of wind is a result of mechanical turbulence,which is a function of surface roughness and atmosphericinstability.
For this reason, winds are gustier over rough surfaces onunstable days and are minimally gusty over smooth surfacesduring stable situations.
The gustier the character of the wind, the stronger windssampled over short time periods (2 minutes) are relative to thosesampled over longer time periods (10 minutes).
Because of wind averaging, sustained winds measured by ASOSare higher than those measured by RAWS stations due to ASOSunits averaging over a shorter time period.
C. ASOS vs. RAWS Wind Speeds
1. Sustained wind speeds measured by RAWS are consistentlyless than those measured by the ASOS network.
This is due to differences in measuring standards between thetwo systems, which exacerbate the differences in station sitingstandards.
2. Differences in measured sustained wind speed are mostpronounced on windy, unstable days, especially whencomparing airport ASOS to RAWS sited in forested areas.
RAWS should have ample clearing to reduce the effects offriction. The cleared area rarely approaches the size orsmoothness of the airport environment where the ASOS unitsare sited.

2C.7
3. Differences in measured sustained wind speed are leastpronounced on smooth surfaces (open rangeland or plains)under stable situations (like downslope winds or winds duringnighttime).
ASOS often measures the general wind, while RAWS are oftensubject to both general and local wind components due to sitingconsiderations (complex terrain).
Due to the complexity involved, there are no hard and fast rulesfor comparing RAWS and ASOS winds that can work acrossthe entire county, under all available fuel types, and any possibleenvironmental conditions.
D. RAWS vs. Eye-level or Midflame Winds
When using 20 ft. wind observational and forecast informationoperationally, it is important to recall the differences between 20 ft.winds and the wind data collected on the fireline.
For example, most fire weather forecasts provide 20 ft. winds, whilefireline wind observations are at eye-level.
In the same way that 20 ft. winds must be reduced to midflame for firebehavior calculations, eye-level (midflame) winds must be increased tobe compared to 20 ft. wind observations or forecasts.
During afternoon burn periods:
1. Eye-level/midflame winds observed on-site will always be lessthan 20 ft. winds (unless there are 40 ft. flame lengths).
2. Depending on sheltering and fuel type, eye-level/midflame windsrange from 10% to 60% of the 20 ft. wind (20 ft. winds at 20mph could be observed anywhere from 2-12 mph at midflame).

2C.8
3. In most cases, eye-level/midflame winds are roughly 30% of 20ft. winds.
Example: An accurate 20 ft. wind forecast of 20 mph would bemeasured at 6-7 mph in the field with a belt weather kit.
III. FIRE WEATHER FORECAST INFORMATION
Under the national interagency agreement, fire weather services are providedjointly by the NWS and the Geographic Area Coordination Center’s(GACCs) Predictive Services.
Predictive Services’ focus is mainly strategic. It combines weather, fuels,and fire danger information into integrated assessments.
NWS’ focus is mainly tactical and contains purely weather information.There is overlap, which varies from region to region.
National level relationship between NWS and Interagency Wildland FireAgencies is defined under the “Interagency Agreement for MeteorologicalServices.”
Regional variability allowed under the national agreement will be defined inGeographic Area Memorandums of Understanding (MOU) and will bereflected in all Fire Weather Annual Operating Plans.
Copies of these should be available from the local NWS office or theappropriate GACC.

2C.9
A. The Fire Weather Annual Operating Plan (AOP)
The AOP is the procedural guide for all fire weather services providedby NWS and GACC Predictive Services.
It contains information such as:
• Which forecasts are available.
• Observation and forecast schedules.
• Communications
• Procedural steps to acquire services.
• A map and description of the areas served.
• Identifies normal seasonal responsibilities and how, where, andwhen products and services will be available.
The AOP is made available to all fire management units each year, ineither hardcopy or electronic format.
All fire management units should have access to the AOP for their area.
B. Predictive Services
Predictive Services is a combination of Fire Intelligence and FireMeteorology with the purpose of providing assessments of the overallfire environment.
Predictive Services monitors, analyzes and predicts fire weather, firedanger/potential and interagency fire management resource impact.This is accomplished through a range of combined fire weather/firedanger outlooks.

2C.10
Products are targeted to aid resource related decision-making at thegeographic area and national levels, and increase safety overall throughan enhanced awareness of expected fire danger.
Each GACC has a Predictive Services group to meet the needs of theGeographic Area, and information from the GACCs is integrated intonational level outlooks by NICC Predictive Services.
All Predictive Services products can be accessed via the NICC website.
Updated information on GACC Predictive Services products can befound in Section 25 of the National Mob Guide at:http://www.nifc.gov/news/mobguide/chapter_20.pdf
1. Weather outlooks for Incident Management Situation Report(IMSR).
Daily: May through the end of October and as activity warrants.
Weekly: November through the end of April.
This report is prepared by NICC from information and data onthe Interagency Situation Report, submitted by the GACCs.
This report will be prepared daily and distributed at 0530 MDT(0800 on weekends and holidays) from May through October,and at 1000 MST on Friday November through April.
When GACCs report large fires and/or very high to extreme firedanger, a brief weather outlook for the Geographic Area will beproduced by GACC Predictive Services for inclusion in thenational situation report.
2C.11
2. Weekly Fire Weather/Fire Danger Outlook.
Weekly: During significant wildland fire activity.
This outlook is to be posted on each GACC website everyTuesday at the close of business.
It contains information on current and projected fire weather, firedanger, and fire management resources.
3. Monthly Fire Weather/Fire Danger Outlook.
Monthly: Year-round
This outlook and map shall be completed for every month byeach GACC, and submitted to the NICC five days prior to thebeginning of that month.
GACCs shall include within their narratives the followinginformation:
a. A brief discussion of predicted general weather / firedanger for the entire GA for the reporting period.
b. A brief discussion on current GA fuel anomalies / fuelmoisture conditions.
c. A brief discussion on predicted temperature ranges andprecipitation for the GA for the reporting period.

2C.12
4. National Wildland Fire Outlook.
Monthly: Year-round
This report is issued on the first days of each month and iscompiled from the GACCs Monthly Fire Weather / Fire DangerOutlook.
It consists of a national map delineating areas of below normal,normal, and above normal fire potential along with narratives foreach Geographic Area.
5. Seasonal assessments
Seasonal: Prior to fire season onset with mid-season update(s).
Seasonal assessments will be issued periodically by GACCs,with the first report issued prior to the onset of their primary fireseason.
A minimum of one update will be completed during their fireseason, or as deemed necessary.
National Seasonal Assessments will be produced by NICC uponrequest by NMAC or the WO.
NICC staff will assist GACCs with seasonal assessments.Content will include:
• Executive Summary
• Introduction and Objectives
• Current Situation (leading up to time report is written)
2C.13
• Comparison of Current and Historical Conditions
• Climate, Weather, Fire Forecasts/Outlooks
• Predicted Fire Occurrence and Resource Needs
• Future Scenarios and Probabilities
• Considerations, Concerns and Management Implications
• Summary and Recommendations
6. Other products and services
Different GACCs provide a variety of other products andservices that may be useful such as:
• Internet weather briefing pages.
• Daily summaries of NWS fire weather forecasts, bothgraphical and text.
• Long term precipitation monitoring.
• Smoke management summaries.
• Technical Specialists support by GACC meteorologists.
C. National Weather Service Fire Weather Program
Updated information on the NWS Fire Weather Program and servicescan be found in NDS 10-4 at:http://www.nws.noaa.gov/directives/010/010.htm
The NWS Fire Weather Program is the operational program thatprovides specialized forecasts, warnings, and consultation services.

2C.14
These services are for the prevention, suppression, management offorest and rangeland fires, and land management activities.
1. Current Structure of the NWS Fire Weather Program.
The NWS core product suite includes a variety of localforecasts issued by local NWS offices, as well as severalnational outlooks produced by NWS national centers.
Most all NWS fire weather products are available online fromthe NWS National Fire Weather Page as well as the internethome pages of local NWS Weather Forecast Offices (WFOs)nationwide.
a. Guidance and weather model data are generated fromnational centers.
• Guidance products during the fire season areissued daily by the Storm Prediction Center.
• The guidance products are used by the local WFOas a heads up for the next several days for potentialsevere fire weather in their area.
b. Meteorologists at WFOs issue fire weather products fortheir area of responsibility, focusing on potential red flag.
• Zone forecasts are issued twice a day with updatesas needed.
• SPOT forecasts are issued upon request.
• Fire Weather Watches and Red Flag Warnings areissued as needed.

2C.15
c. On-site meteorological support, by the NWS, consists ofan Incident Meteorologist (IMET).
• The NWS has over 60 IMETs across the country,with over two-thirds positioned along and west ofthe Rocky Mountains.
• The Fire Weather Annual Operations Plan containscomplete information on available NWS productsand services, including procedures for ordering anIMET and IMET support equipment.
2. Regional Fire Weather Program.
3. Routine WFO Fire Weather Forecasts (FWF).
a. Fire weather (pre-suppression) forecasts (fire weatherzones).
A zone-type product used by land management personnelprimarily for input in decision-making related to pre-suppression and other planning.
Issued at least once daily during the local fire season.
Updated when a Fire Weather Watch or a Red FlagWarning is issued or when the meteorologist feels thecurrent forecast has become unrepresentative of expectedweather conditions.
• Contains any Fire Weather Watches or Red FlagWarnings in effect, headline, discussion, weather,temperature, and humidity; 3-7 day outlook.
• Issued in either tabular or narrative format.

2C.16
b. National Fire Danger Rating System Forecasts (NFDRS).
Coded forecast issued for valid NFDRS observations toprovide weather elements necessary for computation ofnext day fire danger indices.
c. Spot Forecasts
This is a site-specific 24-36 hour forecast that is availableon request for:
• Wildfires• Prescribed burns• Spray projects• Tree planting• Search and Rescue• HAZMAT incidents• Other special projects
Emphasis is placed on forecast elements in the first 12-24hours.
An interactive web-based program called NWS Spot isthe national standard for requesting and issuing spotforecasts and should be used when possible.
NWS Spot requires entry of a variety of informationabout the forecast location, including a complete on-siteweather observation.
The spot forecast should include:
• Time period for which the forecast is valid
• Brief weather discussion
• Forecast weather/sky conditions

2C.17
• Temperature
• Relative humidity
• Wind speed and direction(20-foot or eye level)
• Stability and smoke dispersal potential (optional)
d. Red Flag Warnings / Fire Weather Watches.
Issued based on locally/regionally established criteriaindicating when the combination of dry fuels and weatherconditions support extreme fire behavior.
This criteria is determined each spring at the AOPmeetings. Also if ignition is occurring or expected tooccur.
Criteria includes:
• Fire danger
• Lightning after an extended dry period
• Significant dry frontal passage
• Strong winds
• Very low relative humidity
• Dry thunderstorms
• Initial Attack

2C.18
When the established criteria are met, it is know as a“Red Flag Event.”
(1) Fire Weather Watch
Issued when there is a high potential for thedevelopment of a Red Flag Event.
A Fire Weather Watch should be issued 24 to 72hours in advance of the expected onset of criteria.
A Watch may be issued (or continued) in the first12-hour time period for dry thunderstorm events.
(2) Red Flag Warning
Used to warn of an impending or occurring RedFlag Event.
Its issuance denotes a high degree of confidencethat Red Flag Event criteria will occur in 24 hoursor less.
e. Land Management Forecast.
A general-purpose, miscellaneous-type product withcontent, format, issuance, etc., determined per locallyestablished requirements.
f. Smoke Management Forecast Product.
WFO meteorologists issue smoke management forecastsat the request of land management agencies.
They may be issued on a routine or as needed basis, andmay be narrative or tabular in format, or a combination ofboth.

2C.19
Meteorologists may include the smoke managementforecast as part of another weather product (for instance,the FWF) or as a separate product.
The requester and the responsible NWS office shouldestablish the content, format, frequency of issuance,dissemination method, etc.
This product may contain:
• Forecasts of the transport winds.
• Variability of transport winds with height and time.
• Air mass stability.
• Air dispersion.
• Measures of dispersion.
• Mixing depths and variations with time.
• Other smoke management related parameters.
g. Rangeland/Grassland Fire Danger Statement.
A miscellaneous product which provides advisoryinformation on rangeland and/or grassland fire potential orconditions.
Land management and NWS personnel should establishthe contents, format, frequency of issuance,dissemination, etc.
This product may be issued on a routine or non-routinebasis.

2C.20
4. Routine National Level Forecast Services.
a. Storm Prediction Center (SPC) Fire Weather Outlook.
The SPC will issue routine one and two Day Fire WeatherOutlooks (Day 1 and Day 2) for the lower 48 states on theInternet.
These outlooks describe large-scale meteorologicalconditions which favor the rapid growth and spread of afire, should a fire ignition occur.
b. Monthly and Seasonal Outlooks.
These forecasts are issued for the next 30 or 90 dayperiod by the Climate Prediction Center.
The monthly forecast is issued twice a month, around the1st and 15th, for the next 30 day period.
Seasonal outlooks are issued the first of each month forthe next three month period.
5. On-site incident support.
Certified IMETs can be requested to provide on-site firesupport for Incident Command Teams.
IMETs issue detailed incident specific forecasts written only forthe immediate area of the incident.
These forecasts include all the meteorological parameters ofother forecasts but with the added emphasis on time andlocation differences.
In the field, the meteorologist can personally observe theinfluence fuels and topography have on the weather at the site.As a result, this is the most specific and accurate type offorecast available.

2C.21
D. Fire Weather Forecast Flow Chart
The “Fire Weather Forecast Flow Chart” illustrates how forecasts aredeveloped, the relationship between forecasts, and for what purposethey should be used.
1. Emphasis on short range (tactical) planning.
National Weather Service forecast offices provide informationappropriate for local operational decision making in the 1 to 3day time period, and local planning out to about 7 days.
This includes routine fire weather forecasts, spot forecasts, andRed Flag Warnings/Fire Weather Watches.
2. Emphasis on mid to long term (strategic) planning.
GACC Predictive Services integrates all available forecastinformation, including NWS local and national level forecasts,and outlooks appropriate for regional and national scale strategicplanning on weekly, monthly, and seasonal time frames.
IV. FACTORS AFFECTING FORECAST ACCURACY
A. Verification of Forecast Products
Verification of NFDRS forecasts by a number of fire weather officesindicates accuracy within the following ranges:
Improvement overForecast Element Range Persistence
Temp 3-5° F 25-40%RH 5-10% 15-25%Wind 3-5 mph 10-20%10 hr. FM 1-2% 15-20%

2C.22
B. Interpretation of Forecast Accuracy and What to Expect
Meteorologists have strengths and weaknesses when it comes toweather forecasting.
Temperature and fuel moisture forecasts are the most accurate,followed by wind and RH; however, with every weather element thereis substantial improvement over persistence.
Meteorologists do extremely well in forecasting trends.
C. Factors That Can Affect Forecast Accuracy
1. Forecast time range
Accuracy decreases the further out in time one goes. Generally,the first 24 hours of a forecast are more accurate than theforecast for days 5 through 7.
2. Size of forecast area
Accuracy for a small area such as a particular ridge or canyondecreases as the area for which the forecast is created increases.
A zone forecast is a general forecast that covers a large area. Aspot forecast is for a specific place.
3. Variable terrain
Major variations in terrain, such as elevation or aspect changescan affect the forecast.
4. Changing weather pattern
A transition period, such as from high pressure to low pressurecan produce challenges in forecasting timing and strength of thetransition.

2C.23
5. Timing of significant features
The exact time of day the front passes can have a dramaticimpact on wind, temperature and humidity.
6. Availability of Data and Observations
In order to make an accurate forecast, a meteorologist needsdata and observations from that area to gain a baselineunderstanding of what is going on locally with the weather.
Without this data, it becomes more difficult to apply localeffects to a general forecast.
For the reasons above, short-term/site-specific spot and onsiteincident forecasts are generally the most accurate fire weatherforecasts available.
V. RECEIVING BETTER SPOT FORECASTS
Of the various types of fire weather forecasts, fire managers have the greatestimpact on the accuracy of spot forecasts.
Unlike other larger scale forecast products, spot forecast accuracy restslargely on specific information provided to the meteorologist from on-site.
To a significant extent, you control your own destiny with regard to thequality of spot forecasts received. You have the maximum opportunity tomitigate the factors that can affect forecast accuracy.

2C.24
A. Requesting Spot Forecasts
In recent years, development of an Internet based spot forecastrequest program has helped smooth and speed up the process.
Essentially, the required elements of the spot request page arecompleted and then submitted.
A nice feature of the web-based spot request system is that itautomatically checks for vital information and gives notification of anyomissions.
The information required is rather basic and there are steps that willensure more accurate forecasts.
B. Establish Effective Communications with Forecast Office
1. Notify the forecast office as far in advance as possible ofplanned prescribed fire activity that will require spot forecastsupport.
This could include sending a topographic map and a portion ofthe burn plan to the appropriate office.
This lets the office know in advance where the burn will be andwhat weather elements and scenarios are most critical.
2. Establish a spot forecast schedule with the local forecast office.
This can be done with either wildfires or prescribed fires, but isprobably most applicable to prescribed fires.
If the forecast office knows when to expect spot forecastactivity, staffing may be adjusted so that more time can bededicated to preparing the forecast.
Normally, spot forecasts should be returned to the requestorwithin 30 to 60 minutes.

2C.25
3. Ensure that good communications between the meteorologist,the dispatcher, and the forecast office are established.
When information is relayed for the spot forecast request to thedispatcher, ask the dispatcher to read the information back tomake sure it is correct.
It is frustrating to receive a request where the legal descriptiondoes not match the elevation or aspect, or to have anobservation that is obviously out of line with the rest of thearea’s weather.
4. Communicating with NWS offices.
a. Ask for specific information when needed.
Don’t assume the meteorologist knows exactly what isneeded.
b. It is your responsibility to get an updated spot forecast ifyou feel the forecast is unrepresentative.
Many times the spot is for an area that has no nearbyobservations; therefore, the meteorologist is counting onyou to supply the observation data necessary in order togive you a quality product.
c. Due to staffing, you may not deal with the sameforecaster on consecutive days.
The bottom line: YOU have more responsibility and haveto be more proactive.

2C.26
C. Provide Quality On-site Weather Observations
1. The field observation taken for the spot forecast request shouldbe quality controlled.
Make certain the observation is taken according to standardprocedures and that it is representative of the fire or burn.
Make sure the wet bulb temperature is read at its lowest point.
2. The wind is a critical element.
If using the hand-held meter to measure the wind, be sure tostand there long enough to capture both the lulls and peak gustsin the wind.
This will provide the meteorologist with a true measure of thewind.
3. Remarks to the observation (cumulus cloud development, peakwind gusts, and percentage of cloud cover), can be extremelyhelpful to the meteorologist.
4. Observations taken the day before the initial spot request,especially during the peak burning period, can be the mostimportant information provided with the spot forecast request.
They can help meteorologists do two things:
• Fit the site’s weather into the large-scale weather pattern.
• Establish a trend for the site.

2C.27
D. Provide Forecast Feedback and Validation of Accuracy
With more strict policies in recent years, spot forecasts are requiredfor a more extensive scope of fire operations and the number of spotforecasts done by some forecast offices has more than doubled.
Your feedback on NWS forecasts is very important and muchappreciated. The NWS uses this in validating their products andensuring that you receive the best service possible.
1. Meteorologists have no means to improve day-to-day forecastaccuracy without knowing what happened the previous day.
• Recurring forecast inaccuracies that cause operational firemanagement problems are a liability if communicatingfireline conditions to the people who are forecasting themare not effective.
• At the bare minimum, extremes of temperature, humidity,and wind on the fireline need to be communicated to theforecasters.
• The mandatory feedback requirement from the SouthwestArea AOP is offered below as an example of what isrequired and how it can be provided.
Requirement: The character of temperature, humidity, and windduring the burn period made available to NWS within 12 hoursof forecast issuance (before issuance of next spot forecast).

2C.28
2. At a minimum, the following must be included (assumingdaytime burn):
• Maximum temperature
• Minimum relative humidity
• Significant afternoon winds (speed and direction)
Example of minimum required feedback for daytime period:
• Maximum temp = 61
• Minimum RH = 18 %
• Afternoon winds = South 2-4G8 (eye-level), shifting towest at 1500.
In the event of nighttime burning, conditions affecting the burnperiod could include minimum temperature and maximumrelative humidity.
3. Acceptable methods of providing feedback:
• Submission of required information (see above) via“Feedback” section of Internet spot forecast.
• Faxed copies of fireline (belt weather) observations.
• Phone call to appropriate NWS office.
• Faxed or electronically transmitted copies of hourlyweather data from an on-site portable weather station.
• Notification of deployment of a portable GeostationaryOperational Environmental Satellite (GOES) telemeteredRAWS onsite, so NWS can download data from theInternet.
2C.29
E. Use Portable Weather Stations (RAWS)
Many units now directly own or have access to portable RAWS.
These can be set up on an important project weeks in advance andmonitored by both the fire management unit and the appropriate NWSforecast office before, during and after the project.
Having a portable RAWS properly sited and deployed at a projectlocation provides:
1. Observations prior to ignition to assist in establishing weathertrends.
2. Continuous, quality observations throughout the project whichcan be used when requesting spot forecasts.
3. Automatic forecast feedback, since forecasters can access thepast 36 hours of weather observations.
4. An automatic archive of weather information that can be usedfor documentation.

2C.30
VI. KNOWING WHEN TO ADAPT OR REQUEST A NEW SPOTFORECAST
A. Changes to the Forecast
Do not attempt major changes in fire weather forecasts. Leave it to themeteorologist who has the scope of information to make a forecast.However, due to local weather variability, minor changes to theforecast can be successfully made by a person at the site by:
1. Adjusting temperature or humidity for changes in elevation oraspect.
• Average lapse rate of 3.5° F per 1,000 feet of elevation.
• North aspect coolest, south and west aspects warmestand driest.
• Use adjusted temperatures to recalculate humidity.
• Compare current reading with previous day to show atrend.
2. Adjusting wind direction and speed to correspond with terrain.
• Slope and valley.
• Saddles or passes that can channel winds.
The specific information provided in spot forecasts is based onthe location where the fireline observation is taken.
Especially in complex terrain, differences from forecast valuesshould be expected at slopes, aspects, and elevations that varyfrom that specific location.
Other times, local terrain effects cannot explain differences fromthe forecast.

2C.31
B. General Rule for Adapting Spot Forecasts or Requesting New Ones
• Adapt if differences from forecast values can be attributed tolocal terrain effects (elevation, aspect, slopes/valleys, saddles/passes).
• Request an update if forecast values differ significantly from theobserved weather and cannot be attributed to local terraineffects (a changing weather pattern).
VII. VISUAL CLUES THAT INDICATE WHEN A FORECAST NEEDS TO BEUPDATED
Clouds are one of the best indicators of what type of weather to expect.
• Cumulus clouds that begin to build may mean a threat ofthunderstorms.
• Lenticular clouds are a sign of strong winds aloft, which may surfacelater.
• Cirrus clouds are the forerunners of fronts.
• Altocumulus castellanus indicate moisture and instability aloft, whichusually develop into thunderstorms later in the day.
Clouds also shade the sun, resulting in cooler temperatures, higher humidity,and higher fuel moistures.
Know the visual signs of a stable or unstable atmosphere. The sudden anddramatic break-up of an inversion is a sure sign that fire behavior is going toincrease.
The smoke column and its shape can tell a great deal about the winds aloftand the stability of the atmosphere. Changes in the column can indicatecoming wind shifts or increases in wind speed.
2C.32
EXERCISE.
This exercise involves a number of spot forecasts. The problem is to evaluate thespots and determine whether or not the forecast can be adapted or if an updatedforecast should be requested. Give reasons for the action taken, possible reasonswhy the forecaster missed the forecast, and information that may have helped theforecaster.
VIII. SUMMARY
While the Internet and GACC Predictive Services offer new weatherinformation to aid in decision making, much of the information presented inthis lesson is not new.
• Be informed of the services available through the National WeatherService fire weather program.
• Know which types of forecasts are available from the appropriate fireweather office and how to obtain them.
• Know which type of forecast is best suited for the purpose. At times,you may have to adapt a general or spot forecast for your needs.
• Know when you can safely adapt a forecast and when it is better torequest an updated forecast.
Remember: Cooperative interaction between you and the forecasters willalways result in the best service to you.

2C.33
DATA FROM NWS SITE:
Station GOES ID Elev Lat Long===========================================================TX SAN BERNARD 837544E8 21 28:51:53 095:34:04
Dew Fuel Peak Bat Fuel Day/Time Tmp Pt Wind Pcpn Rh Temp Wind Volt Moist=============================================================================TX SAN BERNARD 12/0107Z 58/ 55/0606/ 39.54 RH 92 FT 58/ 06G09 12.4 FM 17TX SAN BERNARD 12/0007Z 57/ 54/0605/ 39.54 RH 90 FT 57/ 07G11 12.4 FM 17TX SAN BERNARD 11/2307Z 56/ 52/0606/ 39.54 RH 89 FT 56/ 07G18 12.4 FM 17TX SAN BERNARD 11/2207Z 58/ 53/0806/ 39.54 RH 85 FT 57/ 06G15 12.5 FM 16TX SAN BERNARD 11/2107Z 59/ 52/0909/ 39.54 RH 80 FT 60/ 07G20 12.5 FM 16TX SAN BERNARD 11/2007Z 61/ 53/0714/ 39.54 RH 75 FT 65/ 08G23 12.8 FM 16TX SAN BERNARD 11/1807Z 60/ 50/0813/ 39.54 RH 72 FT 68/ 07G22 12.9 FM 18TX SAN BERNARD 11/1707Z 62/ 52/0712/ 39.54 RH 70 FT 73/ 08G18 12.9 FM 19TX SAN BERNARD 11/1607Z 56/ 50/0608/ 39.54 RH 83 FT 64/ 05G13 12.9 FM 22
Most of this is self explanatory, but a few things require clarification.
Day = Day of the current month.Time = Time of latest observation relative to Universal Time Coordinated(formerly Greenwich Mean Time or Zulu Time).Wind/Peak Wind = Direction and speed in tens of degrees and mph.0605 = Direction of 060 degrees (east-northeast), speed of 5 mph.2312 = Direction of 230 degrees (southwest), speed 12 mph.23G25 = Gust direction 230 degrees (southwest), peak gust 25 mph.Fuel Temp/Fuel Moist = Measured fuel temperature and 10 hr. fuel moisture.Bat Volt = Battery voltage of battery powering the RAWS.
Decode of 11/1607Z (11th day of month/1007 AM CST) observation fromSan Bernard:
Temp 56, dewpoint 50, wind NE 8 mph gusts to 13 mph, RH 83%,fuel temp 64, fuel moisture 22%
2C-01-S390-SR
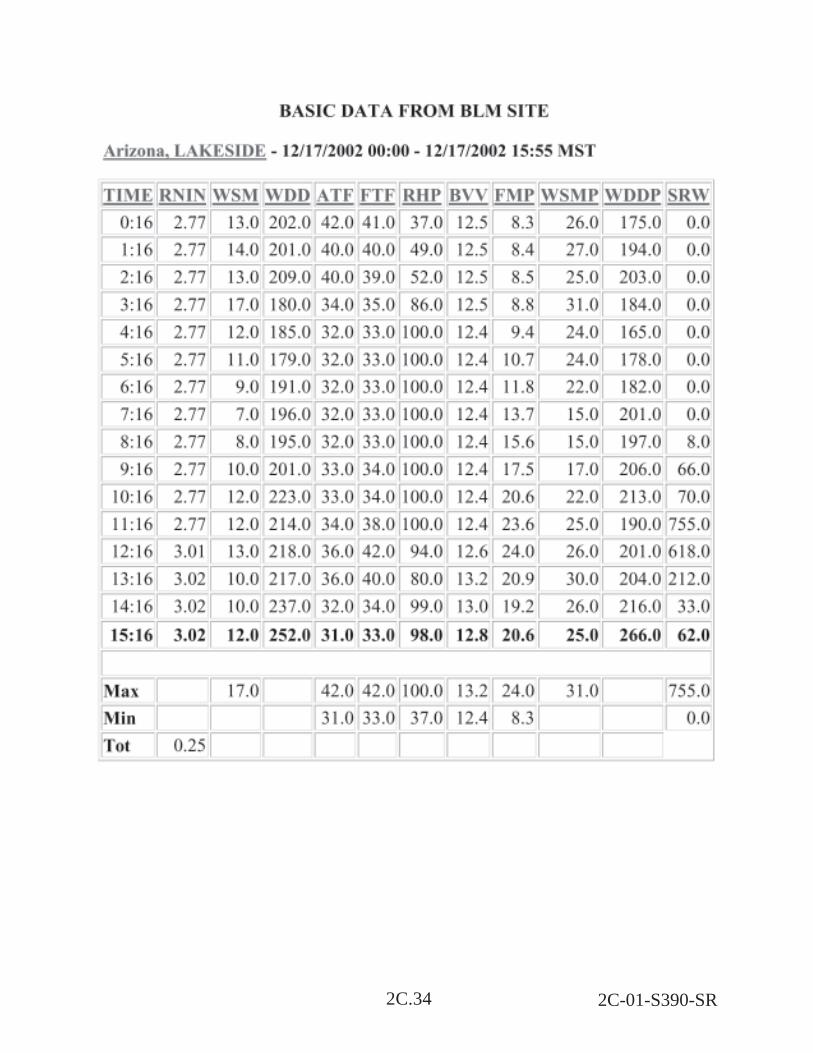
2C.34 2C-01-S390-SR

2C.35 2C-01-S390-SR
• TIME is the time of day that the measurement was taken (15:16 = 3:16 pmMST).
• RNIN is the data element abbreviation for rain accumulation in inches(3.02 = 3.02 inches total accumulation since last reset).
• WSM is the data element abbreviation for sustained wind speed in miles perhour (12 = 20 ft wind of 12 mph).
• WDD is the data element abbreviation for sustained wind direction in degrees(252 = WSW).
• FTF is the data element abbreviation for air temperature in degrees Fahrenheit.
• FTF is the data element abbreviation for fuel temperature in degreesFahrenheit.
• RHP is the data element abbreviation for relative humidity in percent.
• BVV is the data element abbreviation for battery voltage in volts (12.8 volts).
• FMP is the data element abbreviation for fuel moisture in percent. This is ameasured fuel moisture, rather than a calculated value.
• WSMP is the data element abbreviation for wind speed in miles per hour forthe hourly peak (high).
• WDDP is the data element abbreviation for wind direction in degrees for thehourly peak (high) speed.
• SRW is the data element abbreviation for solar radiation in watts per metersquared.
• MAX, MIN and TOT are for respective elements over indicated time period.

2C.36

2C.37 2C-02-S390-SR

2C.38 2C-02-S390-SR

2C.39 2C-03-S390-SR
25 PREDICTIVE SERVICES
The GACC predictive service units are responsible for preparing and submittingdata and reports to NICC regarding current and projected information on wildlandfire, weather, fuels, fire danger, and resource status. NICC uses this information toprepare and distribute the Incident Management Situation Report, National WildlandFire Outlook, and other reports and products.
25.3 INCIDENT MANAGEMENT SITUATION REPORT
Daily: May through the end of October and as activity warrants.Weekly: November through April.
The Incident Management Situation Report is prepared by NICC from informationand data on the Interagency Situation Report, submitted by the GACCs. Thisreport will be prepared daily and distributed at 0530 MDT (0800 on weekends andholidays) from May through October, and at 1000 MST on Fridays, Novemberthrough April.
When GACCs report large fires and/or very high to extreme fire danger, a briefweather outlook is required to be submitted (e-mail: [email protected]) toNICC for inclusion in the IMSR outlook section. See exhibit 28.10 for requiredformat; a copy of the form may also be found on the NICC web site.
25.5 WEEKLY FIRE WEATHER / FIRE DANGER OUTLOOK
Weekly: During significant wildland fire activity.
The Weekly Fire Weather / Fire Danger Outlook is to be posted on each GACC website every Tuesday at the close of business (see Chapter 20, Section 28.11 forcontent and format). This product contains information on current and projectedfire weather, fire danger and resources. A copy of the form may be found on theNICC web site.

2C.40 2C-03-S390-SR
25.5 MONTHLY FIRE WEATHER / FIRE DANGER OUTLOOK
Monthly: Year-round
The Monthly Fire Weather / Fire Danger Outlook and map shall be completed byeach GACC and submitted to NICC five working days prior to the end of eachmonth. The monthly outlook will be prepared for the next month (see Chapter 20,Section 28.12 for content and format). GACCs shall include within their narrativesthe following information:
1. A brief discussion of predicted general weather / fire danger for the entiregeographic area for the reporting period.
2. A brief discussion on geographic area current fuel anomalies / fuel moistureconditions.
3. A brief discussion on geographic area predicted temperature and precipitationfor the reporting period.
4. A map delineating areas of below normal, normal and above normal firepotential (with respect to expected fires/acres) for the reporting period. Forexample, above normal fire potential means the anticipated number of firesand/or acres in the geographic area will exceed that normally occurring for thereporting period. Map templates may be found on the NICC web site.
25.6 SEASONAL FIRE WEATHER / FIRE DANGER OUTLOOK
Seasonal: Prior to fire season onset with mid-season update(s)
Seasonal Outlooks will be issued periodically by the GACCs, with the first reportissued prior to the onset of their fire season. A minimum of one update will becompleted during their fire season, or as deemed necessary. The NICC staff willassist GACCs with seasonal assessments as needed.
2C.41 2C-03-S390-SR
25.7 NATIONAL WILDLAND FIRE OUTLOOKS
Monthly Outlook: Year-roundSeasonal Outlook: As needed
The monthly National Wildland Fire Outlook Report is prepared and distributed byNICC on the first day of each month and is compiled from the GACCs MonthlyFire Weather / Fire Danger Outlook. This report consists of a national mapdelineating areas of below, normal, and above normal fire potential along withnarratives for each Geographic Area. Similarly, National Wildland Fire Outlooks willbe issued seasonally as needed and utilize information from GACC PredictiveServices as well as other sources of weather and fire danger data.

2C.42 2C-03-S390-SR

2C.43 2C-03-S390-SR
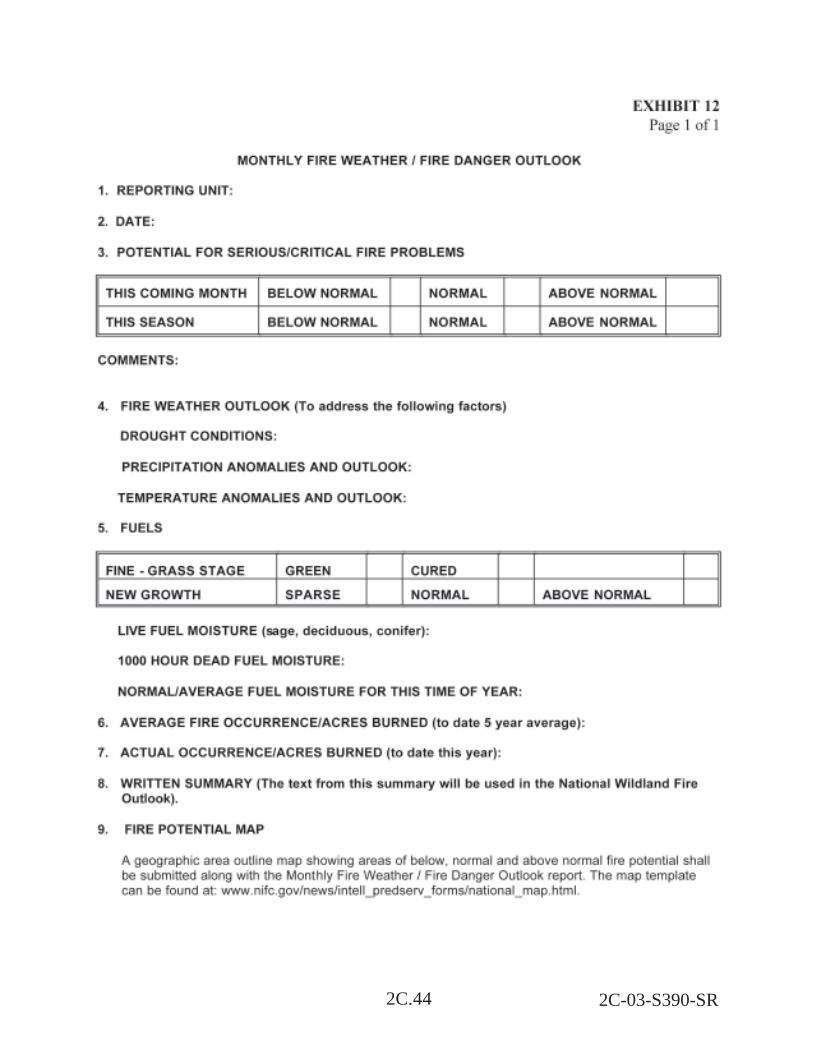
2C.44 2C-03-S390-SR
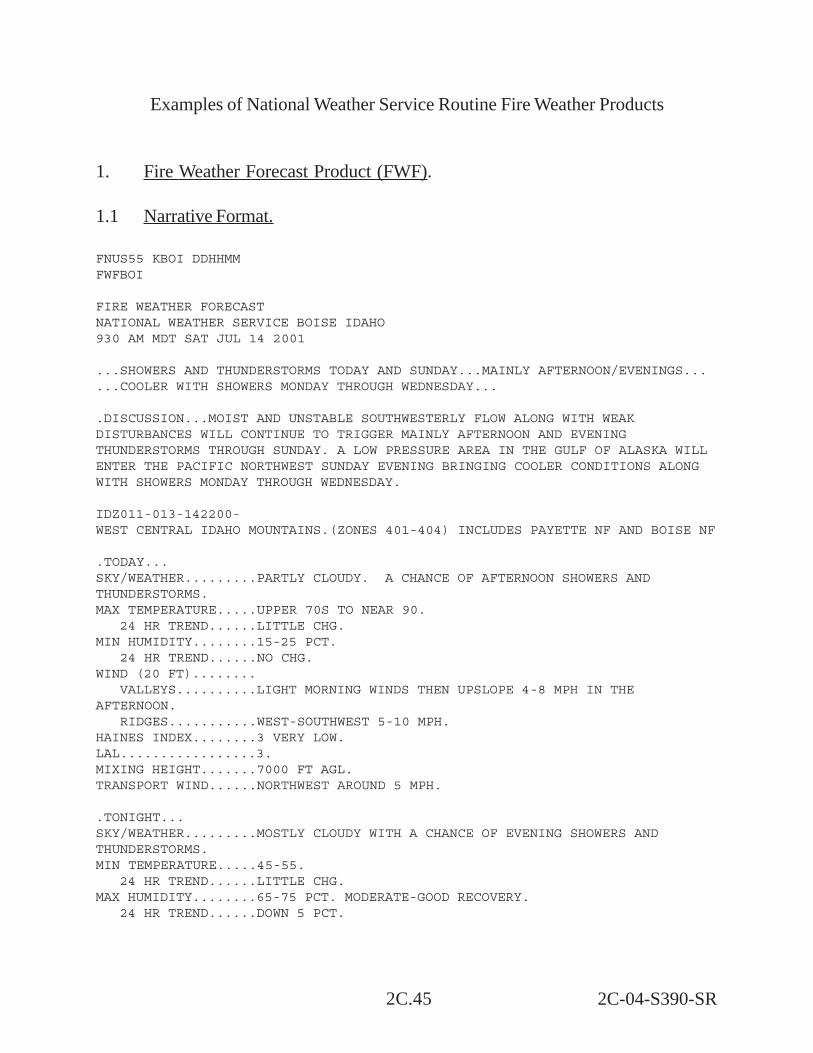
2C.45 2C-04-S390-SR
Examples of National Weather Service Routine Fire Weather Products
1. Fire Weather Forecast Product (FWF).
1.1 Narrative Format.
FNUS55 KBOI DDHHMMFWFBOI
FIRE WEATHER FORECASTNATIONAL WEATHER SERVICE BOISE IDAHO930 AM MDT SAT JUL 14 2001
...SHOWERS AND THUNDERSTORMS TODAY AND SUNDAY...MAINLY AFTERNOON/EVENINGS...
...COOLER WITH SHOWERS MONDAY THROUGH WEDNESDAY...
.DISCUSSION...MOIST AND UNSTABLE SOUTHWESTERLY FLOW ALONG WITH WEAKDISTURBANCES WILL CONTINUE TO TRIGGER MAINLY AFTERNOON AND EVENINGTHUNDERSTORMS THROUGH SUNDAY. A LOW PRESSURE AREA IN THE GULF OF ALASKA WILLENTER THE PACIFIC NORTHWEST SUNDAY EVENING BRINGING COOLER CONDITIONS ALONGWITH SHOWERS MONDAY THROUGH WEDNESDAY.
IDZ011-013-142200-WEST CENTRAL IDAHO MOUNTAINS.(ZONES 401-404) INCLUDES PAYETTE NF AND BOISE NF
.TODAY...SKY/WEATHER.........PARTLY CLOUDY. A CHANCE OF AFTERNOON SHOWERS ANDTHUNDERSTORMS.MAX TEMPERATURE.....UPPER 70S TO NEAR 90. 24 HR TREND......LITTLE CHG.MIN HUMIDITY........15-25 PCT. 24 HR TREND......NO CHG.WIND (20 FT)........ VALLEYS..........LIGHT MORNING WINDS THEN UPSLOPE 4-8 MPH IN THEAFTERNOON. RIDGES...........WEST-SOUTHWEST 5-10 MPH.HAINES INDEX........3 VERY LOW.LAL.................3.MIXING HEIGHT.......7000 FT AGL.TRANSPORT WIND......NORTHWEST AROUND 5 MPH.
.TONIGHT...SKY/WEATHER.........MOSTLY CLOUDY WITH A CHANCE OF EVENING SHOWERS ANDTHUNDERSTORMS.MIN TEMPERATURE.....45-55. 24 HR TREND......LITTLE CHG.MAX HUMIDITY........65-75 PCT. MODERATE-GOOD RECOVERY. 24 HR TREND......DOWN 5 PCT.

2C.46 2C-04-S390-SR
WIND (20 FT)........ VALLEYS..........DOWNSLOPE 3-7 MPH AFTER SUNSET. RIDGES...........SOUTH TO SOUTHWEST 5-10 MPH.HAINES INDEX........3 VERY LOW.LAL.................3.MIXING HEIGHT.......LOWERING TO 1000 FT AGL.TRANSPORT WIND......NORTHWEST 5 TO 10 MPH.
.SUNDAY...SKY/WEATHER.........MOSTLY CLOUDY AND COOLER WITH A CHANCE OF SHOWERS.MAX TEMPERATURE.....75-85.MIN HUMIDITY........28-38 PCT.WIND (20 FT)........ VALLEYS..........LIGHT MORNING WINDS THEN SOUTHWEST 10-15 MPH IN THEAFTERNOON. RIDGES...........SOUTHWEST 10 TO 15 MPH.HAINES INDEX........3 VERY LOW.LAL.................3.MIXING HEIGHT.......LOWERING TO 1000 FT AGL.TRANSPORT WIND......NORTHWEST 5 TO 10 MPH.
[forecast for next geographical descriptor and fire weather zone group]
.FORECAST DAYS 3 THROUGH 7...
.MONDAY THROUGH WEDNESDAY...COOLER WITH SHOWERS. LOWS IN THE 40S TO NEAR 50.HIGHS IN THE 70S TO NEAR 80. AFTERNOON NORTHWEST WINDS 10 TO 20 MPH..THURSDAY AND FRIDAY...PARTLY CLOUDY AND WARMER. LOWS NEAR 50. HIGHS IN THE80S..OUTLOOK FOR SATURDAY JULY 21 2001 THROUGH FRIDAY JULY 27 2001...TEMPERATURESAND PRECIPITATION ARE EXPECTED TO REMAIN NEAR NORMAL THROUGH THE PERIOD.
NAME (OPTIONAL)
1.2 Tabular Format.
FNUS52 KTBW 051200FWFTBW
FIRE WEATHER FORECASTNATIONAL WEATHER SERVICE TAMPA BAY AREA RUSKIN FL730 AM EST TUE FEB 5 2002
...A FIRE WEATHER WATCH IS IN EFFECT TODAY ACROSS THE ENTIRE AREA FOR LOWAFTERNOON RH DURATION...
.DISCUSSION...HIGH PRESSURE WELL NORTH OF THE AREA TODAY WILL GRADUALLY SHIFTEASTWARD ALLOWING LOW LEVEL NORTHEAST WINDS TO BECOME EAST BY AFTERNOON. ASTORM SYSTEM WILL DEVELOP OVER THE NORTHERN GULF AND WESTERN FLORIDAPANHANDLE BY WEDNESDAY AFTERNOON RESULTING IN SOUTHEAST FLOW...HIGHERHUMIDITIES AND WARMER TEMPERATURES. WEAK SHOWER CHANCES WILL RETURN OVER THENORTH NEAR A DEVELOPING WARM FRONT AS WELL AS OVER THE INTERIOR PORTIONS OFTHE CENTRAL AND SOUTH WEDNESDAY AND THURSDAY.

2C.47 2C-04-S390-SR
FLZ042-043-048-052030-CITRUS-HERNANDO-SUMTER-730 AM EST TUE FEB 05 2002
...A FIRE WEATHER WATCH IS IN EFFECT TODAY FOR LOW AFTERNOON RH DURATION...
PARAMETER TODAY TONIGHT WEDNESDAYCLOUD COVER PCLDY MCLDY MCLDYCHANCE PRECIP (%) NONE NONE 20PRECIP TYPE NONE NONE RAINTEMP (24H TREND) 64 (-2) 49 (-3) 72RH % (24H TREND) 30 85 4620FT WND MPH E 11 E 6 SE 9PRECIP DURATION NONE NONE 1PRECIP BEGIN NONE NONE 4 PMPRECIP END NONE NONE CONTINUINGPRECIP AMOUNT NONE NONE 0.25MIXING HGT (MSL) 2400 700 3100TRANSPORT WIND(KTS) E 15 E 8 SE 10
REMARKS...NONE.
[forecast for next geographical descriptor and fire weather zone group]
.FORECAST FOR DAYS 3 THROUGH 7...
.THURSDAY AND FRIDAY...CLOUDY AND COOLER WITH SCATTERED SHOWERS. LOWS 45 TO50. HIGHS IN THE MID 60S. WINDS BECOMING NORTH 15 TO 25 MPH THURSDAYAFTERNOON..SATURDAY THROUGH MONDAY...PARTLY CLOUDY AND WARMER. LOWS IN THE 50S. HIGHSIN THE 70S TO NEAR 80. WINDS GENERALLY BELOW 15 MPH.
2. National Fire Danger Rating System Product (FWM).
FNUS85 KBOI DDHHMMFWMBOI
ZONE,403,011027,13,1,-3,0,1,1,0,0,,,,,0,0,NZONE,404,011027,13,0,3,0,1,1,0,0,,,,,0,0,NZONE,408,011027,13,0,4,-5,1,1,-3,0,,,,,0,0,NFCST,102709,011027,13,0,4,-5,1,1,-3,0,,,,,0,0,N
3. Spot Forecasts for a Wildland Fire (FWS).
FNUS75 KBOI DDHHMMFWSBOI
SPOT FORECAST FOR THE ROUGH DIAMOND FIRE...BOISE DISPATCHISSUED BY NATIONAL WEATHER SERVICE BOISE IDAHO113 PM MDT MON AUG 27 2001VALID UNTIL 913 PM MDT MON AUG 27 2001IF CONDITIONS BECOME UNREPRESENTATIVE, CONTACT THE NATIONAL WEATHER SERVICE.

2C.48 2C-04-S390-SR
...HOT AND DRY WITH AFTERNOON HUMIDITY BELOW 10 PCT...
DISCUSSION...UPPER RIDGE WILL KEEP CONDITIONS AT THE FIRE SITE HOT AND DRYAGAIN TODAY. WINDS WILL GENERALLY BE WEST TO NORTH...BUT SOME ERRATIC EDDIESMAY OCCUR IN THE LOWEST VALLEY BOTTOMS WHERE UPSLOPE WINDS WILL CONFLICT WITHTHE FLOW ALOFT. AFTERNOON HUMIDITIES WILL BE VERY LOW...DROPPING BELOW 10PERCENT.
REST OF TODAYSKY/WEATHER.........SUNNY AND CONTINUED HOT.TEMPERATURE.........HIGH 92-95.HUMIDITY............MIN 7-9 PCT.WIND - EYE LEVEL....NORTH 5-10 MPH WITH GUSTS TO 15 MPH IN VALLEYS. RIDGETOPAND UPPER SLOPE WINDS NORTHWEST TO NORTH 10-15 MPH WITH GUSTS TO 20 MPHPOSSIBLE. ERRATIC EDDIES POSSIBLE IN VALLEY BOTTOMS.HAINES INDEX........5 MODERATE.
TONIGHTSKY/WEATHER.........CLEAR.TEMPERATURE.........LOW 50-55.HUMIDITY............MAX NEAR 30 PCT.WIND - EYE LEVEL....VALLEYS: DOWNSLOPE 5-10 MPH. RIDGETOP/UPPER SLOPES:NORTHWEST TO 10 MPH AFTER EVENING GUSTS TO 20 MPH.HAINES INDEX........4 LOW.
TUESDAYSKY/WEATHER.........SUNNY AND A LITTLE COOLER.TEMPERATURE.........HIGH 86-89.HUMIDITY............MIN 11-13 PCT.WIND - EYE LEVEL....VALLEYS: NORTH 7-13 MPH. RIDGETOP/UPPER SLOPES:NORTHWEST 10-20 MPH WITH AFTERNOON GUSTS TO 25 MPH.HAINES INDEX........4 LOW.
FORECASTER...(optional)
4. Fire Weather Watch/Red Flag Warning. Examples are located inExhibits 2-6 and 2-7.
Exhibit (2-6) - Format/example of a FIRE WEATHER WATCH MESSAGE (RFW):
WWUS85 KSLC DDHHMMRFWSLC
FIRE WEATHER WATCHNATIONAL WEATHER SERVICE SALT LAKE CITY, UT0830 MDT TUE SEP 02, 2001
UTZ002>005-015>017-019-020-DDHHMM
...FIRE WEATHER WATCH FOR STRONG SOUTHWEST WINDS AND LOW HUMIDITIES WEDNESDAYAFTERNOON FOR WESTERN UTAH...(headline of what, where, when)

2C.49 2C-04-S390-SR
FIRE WEATHER ZONES (or COUNTIES) INCLUDED IN THIS WATCH ARE (optional):
429...431...435...WEST PORTIONS 433...436...437
DISCUSSION: A STRONG COLD FRONT WILL BE APPROACHING THE STATE LATE WEDNESDAY.VERY LOW HUMIDITIES AHEAD OF THE FRONT AND STRONG WINDS ACCOMPANYING THEFRONT COULD REACH RED FLAG CRITERIA. (Focus on adverse weatherconditions; comments on fuels are not recommended)
PLEASE ADVISE THE APPROPRIATE OFFICIALS OR FIRE CREWS IN THE FIELD OF THISFIRE WEATHER WATCH. (optional call to action)
Exhibit (2-7) - Format/example of a RED FLAG WARNING MESSAGE (RFW):
WWUS85 KSLC DDHHMMRFWSLC
RED FLAG WARNINGNATIONAL WEATHER SERVICE SALT LAKE CITY, UT0830 AM MDT TUE SEP 02 2001
UTZ002>005-015>017-019-020-DDHHMM
...RED FLAG WARNING FOR STRONG SOUTHWEST WINDS AND LOW HUMIDITIES FROM NOONUNTIL SUNSET FOR WESTERN UTAH... (headline of what, where, when)
FIRE WEATHER ZONES (or COUNTIES) INCLUDED IN THIS WARNING ARE (optional):
429...431...435...WEST PORTIONS 433...436...437
DISCUSSION: A STRONG COLD FRONT WILL MOVE INTO NORTHWEST UTAH BETWEEN 1700-1900 MDT AND THROUGH THE WASATCH FRONT BETWEEN 2000- 2300 MDT. THE STRONGESTWINDS WILL BE ON SOUTHERN ASPECTS AND FLAT TERRAIN IN THE WESTERN UTAHDESERTS DURING THE LATE AFTERNOON. WIND SPEEDS WILL INCREASE IN THEAFTERNOON TO 15-30 MPH WITH GUSTS TO 45 MPH. (Focus on adverse weatherconditions; comments on fuels are not recommended)
PLEASE ADVISE THE APPROPRIATE OFFICIALS OR FIRE CREWS IN THE FIELD OF THISRED FLAG WARNING. (optional call to action)
Exhibit (2-8) - Format example of text version of SPC Fire Weather OutlookProduct.
FNUS21 KWNS 021909STORM PREDICTION CENTER...NWS/NCEP...NORMAN OK400 AM CDT MON JUL 02 2001
DAY 1 FIRE WEATHER OUTLOOK...REF AWIPS GRAPHIC PMWE98 KWNSVALID 021200-031200

2C.50 2C-04-S390-SR
...EXTREMELY CRITICAL FIRE WEATHER AREA FOR - ERN AZ...
...CRITICAL FIRE WEATHER AREA FOR - ID / WRN MT...
...CRITICAL FIRE WEATHER AREA FOR - OK
...SYNOPSIS...(TEXT)
...EXTREMELY CRITICAL FIRE WEATHER AREA 1 - AZ...
PRIMARY CONDITIONS: STRONG WINDS AND EXTREMELY LOW HUMIDITY(TEXT)
...CRITICAL FIRE WEATHER AREA 2 - ID AND WRN MT...
PRIMARY CONDITIONS: DRY THUNDERSTORMS.(TEXT)
CRITICAL FIRE WEATHER AREA 3 - OK...
PRIMARY CONDITIONS: STRONG WINDS AND LOW HUMIDITY(TEXT)
(TEXT)
..FORECASTER..
SPC FIRE WEATHER OUTLOOKS ARE AVAILABLE AT WWW.SPC.NOAA.GOV/FIRE
2.8.2 Content. The outlooks (text and graphic) will highlight:
a. Significant Dry Thunderstorm Critical Fire Weather Areas (areas of numerous cloud-to-groundlightning strikes with generally less than one-tenth inch or rain across the area, scalloped lines ongraphic).
b. Critical Fire Weather areas (based on fuel conditions and forecast weather, hatched area ongraphic).
c. Extremely Critical Fire Weather areas (issued infrequently for only the most severe forecast andfuel conditions, hatched area on graphic).
The Day 1 and Day 2 text and graphics should be similar. Areas that are a marginalthreat (lacking one critical element) should be depicted by SEE TEXT on thegraphic and discussed last in the text message.

3.1
Introduction to Wildland Fire Behavior Calculations, S-390
Unit 3 – United States Fire Behavior Prediction System (USFBPS) Fuel Models
OBJECTIVES:
Upon completion of this unit, students will be able to:
1. Identify inputs needed for a fuel model.
2. Identify the characteristics of the standard United States Fire BehaviorPrediction System fuel models.
3. Identify appropriate fuel models using resource materials.

3.2

3.3
I. FUEL MODEL
Actually measuring fuel properties is too slow and laborious for wildland firepredictions. An alternate method is to use predetermined fuel arrangementscalled fuel models.
A fuel model is a series of mathematical fuel bed inputs needed by aparticular wildland fire behavior or fire effects processor.
Although identified by biological names, fuel models are mathematicalmodels. The goal is to select the mathematical model that best predictsobserved or experienced wildland fire behavior.
The biological name of the model may not reflect the vegetation, but themodel’s mathematics reflects the wildland fire behavior when that vegetationburns.
Fuel models are simply tools to help the user realistically estimate wildlandfire behavior.

3.4
A. Inputs Needed for a Fuel Model
• Fuel loading or mass of fuel per unit area, live and dead,grouped by particle size classes – tons per acre.
• Fuel moisture content (discussed more in Unit 4).
• Surface area to volume ratio of each size group.
• Fuel bed depth – ft.
• Compactness or bulk density – lb/ft3.
• Heat content of fuel – Btu/lb.
• Moisture of extinction – upper limit of fuel moisture contentbeyond which the fire will no longer spread with a uniform front.
• Vertical arrangement.
• Horizontal continuity.
• Chemical content, ash, and volatiles.

3.5
B. Various Fuel Modeling Systems
1. NFDRS – National Fire Danger Rating System
• 20 fuel models
– Identified by an alpha character (A, L, S, C).
– Are part of a computer data processing system thatpresently is not suited to real-time, in-the-fieldprediction of wildland fire behavior.
– Differences in calculations require the use ofdifferent fuel models than those used for wildlandfire behavior predictions.
– Will work with these fuel models in S-491Intermediate National Fire Danger Rating System.
2. CFFDRS – Canadian Forest Fire Danger Rating System
• 16 fuel models
– Identified by alpha-numeric characters (C1, S3,M4).
– Fuel models are used in the Canadian Forest FireBehavior Prediction (FBP) System, a sub-systemof the CFFDRS.
– Are being used in Alaska, several Great Lake States(Michigan and Minnesota), and some othernorthern states.

3.6
3. USFBPS – United States Fire Behavior Prediction System
• 255 fuel models are now possible
– Identified by a numeric character (1, 13, 100, 219).
– Used as fuel model inputs to Rothermel’s surfacefire spread model, as exemplified in BehavePlus,Fire Behavior Nomograms, and Fireline HandbookAppendix B.
– Simulates surface wildland fire behavior at theflaming front only, not residual combustion thattakes place after the flaming front has passed.
– The fuel model parameters presented by this setshould not be used as fuelbed characteristics forfuel consumption models.
– Fuelbed assumptions of homogeneity andcontinuity apply to these models.
– Assumes steady state weather and topography forthe prediction period.

3.7
II. FUEL MODELS FOR UNITED STATES WILDLAND FIRE BEHAVIORPREDICTION SYSTEM (USFBPS) – STANDARD 13 FUEL MODELS
A. Fuel Models
• Were developed by Rothermel and Albini in the 1970s.
• Are for the severe period of the fire season when wildland firespose greater control problems.
• Works well for predicting spread rate and intensity of active firesat peak of fire season, in part because the associated dryconditions lead to a more uniform fuel complex, an importantassumption of the underlying model.
1. Fuel models have deficiencies for:
• Other purposes such as prescribed fire and wildland fireuse for resource benefit.
• Simulating the effects of fuel treatments on potentialwildland fire behavior.
• Simulating transition to crown fire using crown fireinitiation models.
2. Classified into four types
• Grass (3 fuel models)
• Shrub (4 fuel models)
• Timber Litter (3 fuel models)
• Logging Slash (3 fuel models)

3.8
B. Description of Fuel Models
1. Dead and live fuel components
• For a particular model, fuel loading is fixed; it does notchange with time or location.
• Fuel loading does change between models in a group, andbetween groups.
This is reflected in wildland fire behavior outputs such asHeat per Unit Area and Fireline Intensity.
• Five fuel models have a live fuel component. Which onesare they?
• The standard 13 models are static; the fuel model doesnot change to account for curing or greening ofherbaceous fuels.
For instance, as live fuel moisture drops, loading is nottransferred from live fuel loading to dead fuel loading. Agrass fuel model may not work well when the grass isgreen, but will work well when the grass is cured.
2. Moisture of extinction
• Moisture content of fuels is directly related to theirpotential to ignite.
• Moisture of extinction is the moisture content of aspecific fuel type above which a fire will not propagateitself, and a firebrand will not ignite a spreading fire.
• Only a few of these models are applicable for fuelbeds inhigh humidity (> 35%) areas that burn well at relativelyhigh dead fuel moistures. Fuel Model 7 is a classicexample.

3.9
III. FUEL MODELS FOR UNITED STATES WILDLAND FIRE BEHAVIORPREDICTION SYSTEM (USFBPS) – DYNAMIC 40 FUEL MODELS
A. Dynamic Fuel Models
1. The standard 13 USFBPS fuel models stand alone; they are notrepeated in this new set.
2. All fuel models with an herbaceous component are dynamic.
• With lowering or curing of the live herbaceous moisturecontent, live herbaceous fuels are transferred to dead.
• It transfers to a newly created dead herbaceous classinstead of the 1-hour time-lag class to preserve thesurface area to volume ratio.
• The effect of live herbaceous moisture content on rate ofspread and fireline intensity is very strong.
3. Wildland fire behavior modeling processors are being changedto use the dynamic fuel models.
4. Grouped by fire-carrying fuel types
• (NB) Non-burnable• (GR) Grass• (GS) Grass-shrub• (SH) Shrub• (TU) Timber-understory• (TL) Timber litter• (SB) Slash-blowdown
Note the unique category of Non-burnable Fuel Type Models.It is included to provide consistency in fuel model maps; notintended to be used in a wildland fire behavior or fire effectsprocessor.
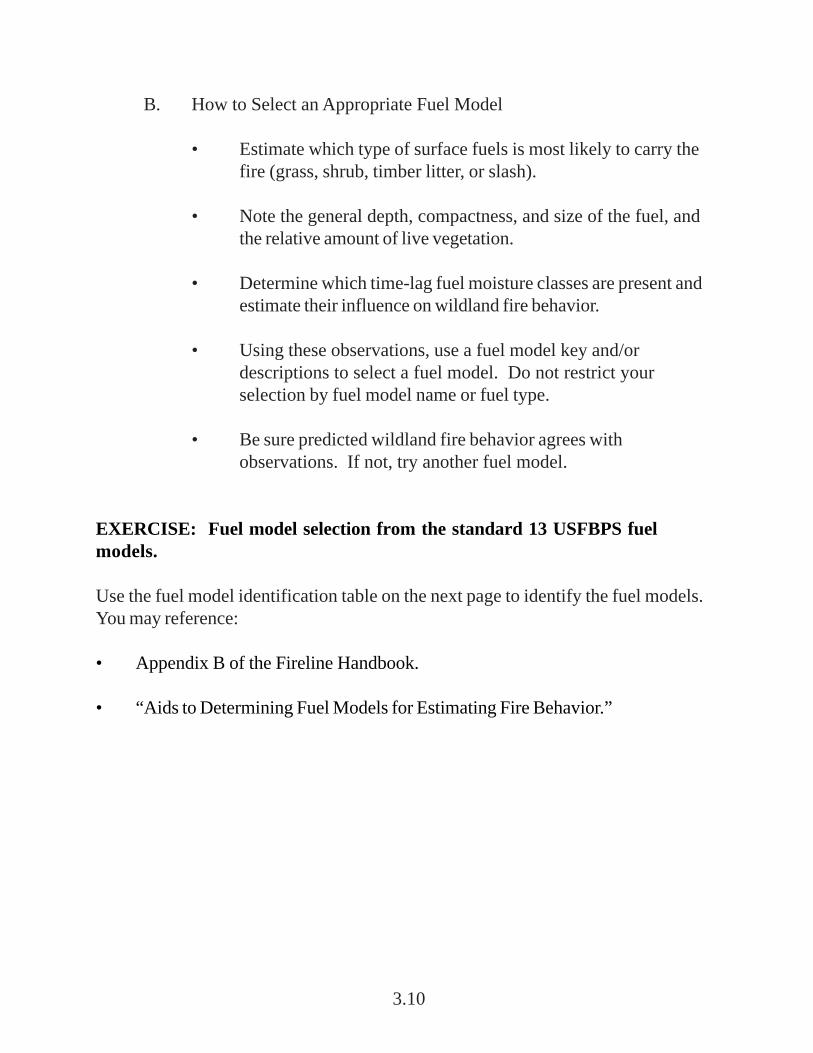
3.10
B. How to Select an Appropriate Fuel Model
• Estimate which type of surface fuels is most likely to carry thefire (grass, shrub, timber litter, or slash).
• Note the general depth, compactness, and size of the fuel, andthe relative amount of live vegetation.
• Determine which time-lag fuel moisture classes are present andestimate their influence on wildland fire behavior.
• Using these observations, use a fuel model key and/ordescriptions to select a fuel model. Do not restrict yourselection by fuel model name or fuel type.
• Be sure predicted wildland fire behavior agrees withobservations. If not, try another fuel model.
EXERCISE: Fuel model selection from the standard 13 USFBPS fuelmodels.
Use the fuel model identification table on the next page to identify the fuel models.You may reference:
• Appendix B of the Fireline Handbook.
• “Aids to Determining Fuel Models for Estimating Fire Behavior.”

3.11 03-01-S390-SR

3.12

4.1
Introduction to Wildland Fire Behavior Calculations, S-390
Unit 4 – Fuel Moisture
OBJECTIVES:
Upon completion of this unit, students will be able to:
1. Define and characterize fuel moisture.
2. Discuss the importance of dead fuel moisture, the time lag concept, andmoisture of extinction. Estimate inputs used by NFDRS and USFBPS.
3. Evaluate live fuel moisture and estimate inputs for NFDRS and USFBPS.
4. Identify alternative methods for measuring and estimating moisture contentsof various fuels.
5. Describe drought, its relationship to wildland fire behavior, and someimportant drought indices.
6. Compare and contrast the NFDRS and CFFDRS methods of estimating fuelmoisture and drought.

4.2

4.3
I. INTRODUCTION
The FLAME method of fire behavior assessment emphasizes the “BigChange” factors in estimating the changes in fire behavior during the burningperiod.
Changes in fuel, wind, and terrain are the factors that can dramatically changefire growth and flame lengths during the day. As a result, these are thefactors considered during the initial FLAME assessment.
Fuel moisture is only a secondary consideration, because its influence on thespread model is much less dramatic. However, it plays a critical role inunderstanding the fire potential on any given day or week, or month.
At extremely low fuel moisture, extreme fire behavior becomes more likelyand needs to be factored into any assessment.
Assess the moisture(s) in the fuels of concern and make sure that thosedevising and implementing strategy and tactics understand what it may meanto fire behavior.
II. DEFINE AND CHARACTERIZE FUEL MOISTURE
Fuel moisture content is the weight of water present in a fuel expressed as apercent of the dry weight of that fuel.

4.4
III. DEAD FUEL MOISTURE
The fuel moisture content in dead fuels is governed by the size and shape ofthe fuel as well as several external factors:
• Temperature• Relative humidity• Precipitation• Solar radiation• Wind
Generally, dead fuels acquire and give up moisture to the atmospheredepending on the current state of those external factors.
The longer that atmospheric conditions remain constant or the smaller therelative changes in those conditions, the moisture content of dead fuelsapproaches a conceptual value called the Equilibrium Moisture Content(EMC).
A. Equilibrium Moisture Content
Equilibrium moisture content is the moisture content dead fuels reachwhen subjected to constant atmospheric conditions until there is nomore exchange of moisture.
The EMC is rarely reached in the real world because atmosphericconditions such as temperature and relative humidity rarely remainconstant enough over long enough periods for most dead fuels toreach equilibrium.
Only the smallest dead fuels, such as fine cured standing grasses, everapproach EMC under normal conditions.
Because the size and shape of dead fuel is so important to the moisturecontent they exhibit at any time, a classification system based on sizewas developed to track the variability associated with it.
This classification is based on a concept called time lag.

4.5
B. Time Lag
Time Lag is the time it usually takes a dead fuel to reach 63% of thedifference between the current moisture content and the conceptualequilibrium moisture content.
This time lag is dependant on fuel size and for the purpose of wildlandfuels is characterized by the diameter of fuels.
In general, as dead fuels increase in diameter they require more time toreach equilibrium with the atmosphere.
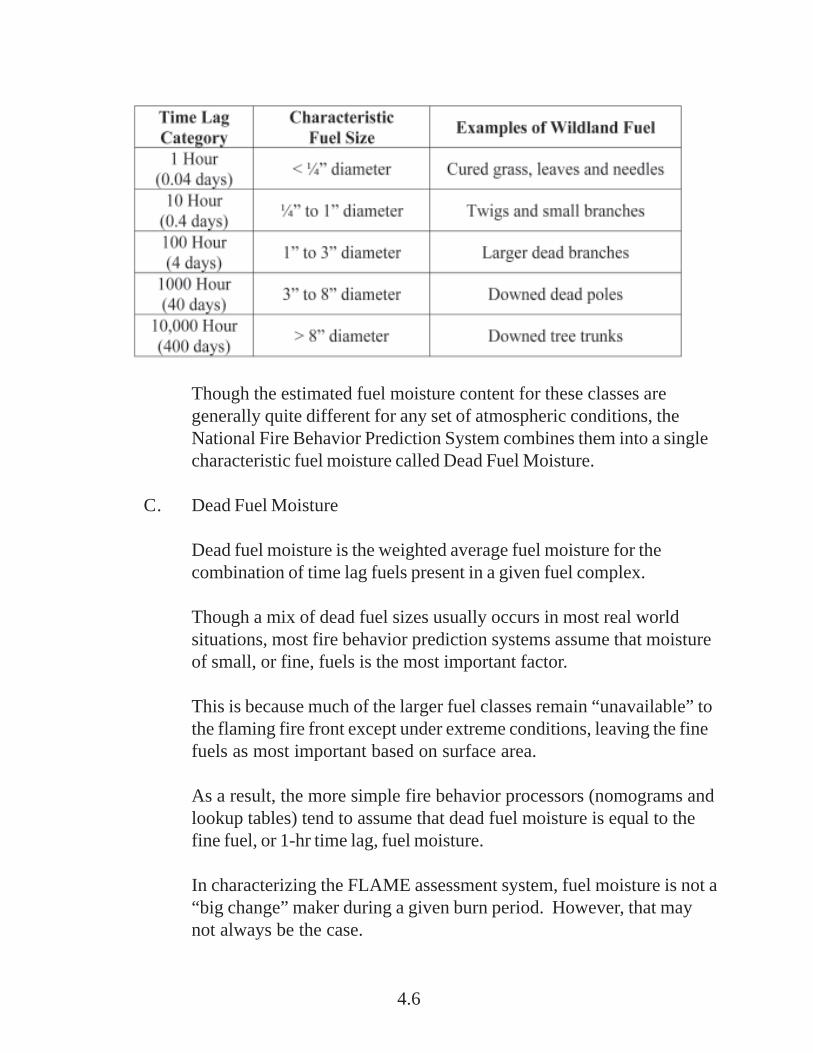
4.6
Though the estimated fuel moisture content for these classes aregenerally quite different for any set of atmospheric conditions, theNational Fire Behavior Prediction System combines them into a singlecharacteristic fuel moisture called Dead Fuel Moisture.
C. Dead Fuel Moisture
Dead fuel moisture is the weighted average fuel moisture for thecombination of time lag fuels present in a given fuel complex.
Though a mix of dead fuel sizes usually occurs in most real worldsituations, most fire behavior prediction systems assume that moistureof small, or fine, fuels is the most important factor.
This is because much of the larger fuel classes remain “unavailable” tothe flaming fire front except under extreme conditions, leaving the finefuels as most important based on surface area.
As a result, the more simple fire behavior processors (nomograms andlookup tables) tend to assume that dead fuel moisture is equal to thefine fuel, or 1-hr time lag, fuel moisture.
In characterizing the FLAME assessment system, fuel moisture is not a“big change” maker during a given burn period. However, that maynot always be the case.

4.7
Look again at the upper right quadrant of the fire behavior nomogram,where the influence of dead fuel moisture is captured.
D. Moisture of Extinction (MOE)
Moisture of extinction is the moisture content of a specific fuel typeabove which a fire will not propagate itself, and a firebrand will notignite a spreading fire.
Each fuel model has its characteristic MOE.
As these values are examined for each fuel model, consider that thosewith higher MOE are “hotter” fuel models (the greater the differencebetween dead fuel moisture and MOE, the greater the predictedintensity).

4.8
E. Fine Fuels
Fine Fuels are the 1-hr time lag fuels that exist in a given fuel complex.They generally consist of grasses, leaves, needles, and the smallesttwigs.
In nearly all fire situations, fires are “carried” through the landscape inthese fine fuels. The loading and arrangement of these fine fuels areprimary determinants of ignition, spread, and intensity of most fires.
The importance of fine fuel moisture is highlighted in the fire severitychart shown here and in the Fireline Handbook, Appendix B.
Note that the one here includes both the corresponding probability ofIgnition and CFFDRS Fine Fuel Moisture Code (FFMC).

4.9
To estimate fine fuel moisture, or 1-hr time lag fuel moisture, referencethe Lookup tables and the Fine Dead Fuel Moisture worksheet in theFireline Handbook, Appendix B.

4.10
1. Determine Reference Fuel Moisture.
Be careful to avoid mixing the lookup values for temperatureand relative humidity.
2. Determine Fuel Moisture Correction Value.
Once the Reference fuel moisture is determined, the remaininginputs for your situation need to be collected.
All of the following items reference the fire location, not the sitewhere the weather data was collected:
• Month and Time of Day: Make sure to go to the righttable based on the month (3, 4, or 5 in Appendix B).
• Aspect and Slope: Consider the area that is expected toburn during the projection period.
• Shading is based on a combination of tree and cloudshading.
• Fire Site Location: Is the fire above, below, or within1000 ft of weather observation elevation. If difference ismore than 2000 ft, get a better weather observation.
3. Estimate Adjusted Fine Dead Fuel Moisture (1-hr TL FuelMoisture) by combining the Reference Fuel Moisture andCorrection Value.

4.11
EXERCISE 1.
After reading the scenario, use the worksheet on page 4.13 to answer the questions.
Scenario:
You are assigned to a fire in northern California. The fire is burning in acombination of dense white fir (Fuel Model 10) and manzanita brush fields (FuelModel 4). As you make your first fire behavior projections, you find that you needa number of dead fuel moisture values for both fuel types. You have taken theweather at your location near the fire perimeter at 5,000 feet elevation and recordedthe following values:
Dry bulb temperature: 80º FRelative humidity: 20%Slope percent: 35%Aspect: SouthSite exposure: OpenMonth: AugustTime: 1500Sky: Clear
1. You want to verify rate of spread in the brush field at your location. What isthe dead fuel moisture?
2. You wish to determine the probability of ignition of a location 800 feet higheron the same slope. What is the 1-hour timelag fuel moisture?
3. You would like to determine the crowning potential of the white fir stands on anorth slope directly opposite you. What is the 1-hour timelag fuel moisture ofthe fine dead fuels under the forest canopy?
4. What is the fine dead fuel moisture on a shaded east-facing slope 1,500 feetbelow you? The slope is 70 percent.
5. You wish to determine flame length in a brush field at 7,500 feet on a southeast-facing slope. Determine the fine dead fuel moisture.

4.12
Use the map and the worksheet to answer questions 6 and 7.
6. You’ve helitacked a fire and are on the ridge top next to Point B on the map.Your weather at 1030 is DBTemp 79º F, WBTemp is 59º F, the sky is clear, andthe fire is in a dense closed stand. What is your fine fuel moisture?
7. Time is now 1430. Your location is the same. There is a new smoke downhillfrom your fire at about the 4320 foot contour level (at the X on the map). Yourweather is DBTemp 92º F, WBTemp 63º F, Sky has 15% cloud cover and thefire is in an open grassy area. What is your 1-hr TL Fuel Moisture?

4.13
4.14
IV. LIVE FUEL MOISTURE
Fuel moisture in live fuels is controlled by the physiological processes withinthe plant itself. These live fuel moistures are lowest during dormant periods,especially in cold winter months leading into early spring.
Plants integrate seasonal and long term moisture conditions, being one of thefirst visible indicators of developing drought conditions.
Moisture content related to the stage of plant development during growingseason, affected by bud flush, flowering, senescence, and other periodicdevelopments.
Elevation affects plant development, with higher elevations generally havingshorter period of high live fuel moisture beginning later in the spring.
Live fuel moisture is measured in the same way that dead fuel moisture is,using the fuel moisture formula described at the beginning of the lesson.
For the purposes of NFDRS and USFBPS, there are three categories of livefuel moisture:
A. Herbaceous Fuel Moisture
Herbaceous fuel moisture is the moisture content of live portions ofgrasses and forbs, generally the first live plants to respond to moisturestress with lowered moisture levels.
B. Woody Fuel Moisture
Woody fuel moisture is the moisture content of live portions of woodyplants. These include small stems, branches, and foliage of shrubsand tree seedlings found in the surface fuel complex.
Though these surface shrubs and seedlings may include some maturefoliage (if evergreen), the estimated fuel moisture is generallydominated by current season foliage and its developmental stage.

4.15
C. Foliar Moisture
Foliar moisture is the moisture content of small stems, branches andfoliage of aerial fuels, including trees and tall shrubs.
With respect to evergreen plants that retain leaves for several years,this fuel moisture is based on a mixture of mature and immaturefoliage. Consider what portion of the foliage is immature and at whatstage of maturation that portion is before making the final estimate.
Among the fuel models described in the last lesson, live fuel moistureis an input when using fuel models 2, 4, 5, 7, and 10. Note thedifference between these two upper right quadrants of FM 9 and FM10 nomograms respectively.
However, with the advent of 40 additional fuel models, herbaceous fuelmoisture will become a much more important input.
NFDRS has long had dynamic fuel models, using the herbaceous fuelmoisture to indicate a transfer of a portion of the herbaceous fuel loadto the dead fuel category.

4.16
Many of the 40 new models will also have this feature, using theestimated fine fuel moisture instead of the live fuel moisture for theportion transferred.
V. OTHER MEANS OF ESTIMATING AND MEASURING FUELMOISTURE
To this point we have discussed methods to estimate fuel moisture indirectly.However, it is possible to collect fuels and measure their fuel moisturecontent. Further, it is possible to take advantage of field observations toimprove these indirect measures. Remote Sensing techniques can also beimportant.
At times, in the field, it may not be possible to conduct any of the formalestimates. At that time, rough estimates may be the best available. Some ofthose rely on field observations, perhaps being better than any calculatedvalue.
Approximation # 1:Fine Fuel Moisture = Relative Humidity ÷ 5
Approximation # 2:Visual Cues for Live Fuel Moisture

4.17
Many live fuels have been studied over the years, with fuel moistures relatedto growth and development processes.
Many of these growth processes have visual cues such as color changes toindicate some critical moisture levels.
Examples:
• Chamise - red leaf tips/begins to drop leaves at 60%
• Buckeye - begins to drop leaves at 80%
• Poison Oak - turns red/gold at 60%
• Some manzanita develops yellow stems and the leaves turn dirty greenat 80%
Approximation # 3: Ponderosa Pine Needle Moisture

4.18
Direct measurement of any of the fuel moistures discussed to this point ispossible. Drying ovens are used to remove the moisture within fuels.
Fuels are measured before drying and again afterward. With those twovalues, the fuel moisture content is calculated with the formula mentioned atthe beginning of the lesson.
Electronic probes have been used by sawmills and kiln operators for years tosample the moisture content of wood products.
These same tools can be used to directly measure fuel moisture of anywoody fuels, generally more than ¼ inch in diameter.
With both techniques, multiple samples are necessary to minimize any biasbased on the condition of any particular sample.
Remote Sensing allow for subjective evaluation of live fuel moistureconditions. These techniques involve both satellite imagery and RAWSweather data.
The primary satellite imagery tool is the Normalized DifferentialVegetation Index (NDVI).
The NDVI data is collected each day, averaged for seven day periods, anddistributed on the Wildland Fire Assessment System (WFAS) managed bythe U.S. Forest Service.
There are five different images produced from the data collected:
• NDVI – Current Condition.
• Visual Greenness – related to theoretical overall maximum value.
• Relative Greenness – related to maximum value for that location.
• Experimental Live Moisture – estimate of live fuel moisture.
• Departure from Average – related to historic normal (average).

4.19
Departure from Average Greenness: 2000 and 2002.Which year was drier?

4.20
There is an historic record of NDVI sampling dating back to 1991. Amongthose, the experimental live moisture image produces an estimate of liveshrub moisture contents and will give best estimates in plant communities thatare dominated by shrubs.
With many RAWS being established throughout the country, many firesituations will have one or more stations nearby.
These stations, and the associated NFDRS outputs calculated each day,provide indications of both dead and live fuel moistures that may be used tocalibrate estimates used for fire behavior calculations.
VI. DROUGHT AND FIRE BEHAVIOR
Drought conditions are NOT a prerequisite for fires to occur and spread, butthere is a close association between drought conditions and extremelydifficult fire suppression.
Observation shows that relatively few large and destructive fires or severe fireseasons occur without drought being a significant factor.
Though not a direct input into the fire spread model, most fire managersagree that drought increases the potential for extreme fire behavior by causingabnormally low moisture levels in both dead and live fuels.
A. Drought
Drought is a protracted period of deficient moisture, based upon anestablished climatological normal, which has a significant social,environmental, or economic effect.
Drought is a normal, recurrent feature of climate, although manyerroneously consider it a rare and random event.

4.21
Three main types of drought are commonly referenced:
1. Meteorological drought
Meteorological drought is usually defined on the basis of thedegree of dryness (in comparison to some “normal” or averageamount), and the duration of the dry period.
It may relate actual precipitation departures to average amountson monthly, seasonal, or annual time scales.
Definitions of meteorological drought must be regionalized dueto wide ranges in precipitation patterns.
For example, a rainfall deficiency of five inches in the year mightpass unnoticed in a moist climate, but could have significance inan arid climate.
2. Hydrological drought
Hydrological drought is associated with the effects of periods ofprecipitation shortfalls on surface or subsurface water supplysuch as:
• Streams• Reservoirs• Lake levels• Ground water
In essence, hydrological drought is the impact of meteorologicaldrought on water supply.
Hydrological drought usually lags behind meteorological andagricultural drought, since it takes longer for precipitationdeficiencies to show up in the water supply.

4.22
3. Agricultural drought
Agricultural drought links various characteristics ofmeteorological or hydrological drought to agricultural impacts.
The focus is on the moisture available from precipitation and/orthe water supply in relation to plant water demand.
Plant water demand depends on prevailing weather conditions,biological characteristics of the specific plant, its stage ofgrowth, and the physical and biological properties of the soil.
Notice the relative “time lag” for these three types of drought. As thegraph indicates, drought can take several years to develop and severalto be mitigated.
However, wildland fuels and the associated fire behavior respond morequickly than indicated by this graph, frequently within weeks ormonths. Consider the historic record and how to use it whenevaluating the current situation.
The value of any measure, whether it is accumulated rainfall orparticular fuel moisture, can be evaluated only if it can be compared toother values in a meaningful way.

4.23
This referencing to historic data is called climatology.
When comparing current measures of drought to the historic record,there are four objective measures to make the comparison:
• The actual measure, such as inches of rainfall in the past 30days.
This can be informative if it is a starkly abnormal amount, suchas “0.0 inches of rain in the last month in Florida.”
• The anomaly (departure from average) helps the user byidentifying the difference between current value and normal.
However, it does not inform the user how important thatdeparture is. Five inches departure out of 10 inches is muchmore important than 5 inches out of 40 inches.
• The percent of normal (average) gives the user an idea ofhow important the departure is.
However, 20% of 10 inches is much less (2 inches) than 20% of40 inches (8 inches).
• The ranking or percentile of the current year when comparedthe set of historic years indicates how significant historically thedeparture is.
“The 6 inches of rainfall received this year is the lowest totalrecorded in the last 30 years.”
These objective measures require specific knowledge of the itemmeasured and how it responds to local conditions. The user isresponsible for developing the thresholds for the local area.

4.24
Though each of these ways of presenting climatology associated withthe current situation, none of them provide a means of comparingdifferent parts of a large management area, such as the United States.
Though they will be discussed later, NFDRS and CFFDRS outputsare good examples of objective measures of drought conditions.
Drought indices are objective measures of net moisture deficiency.Indices provide a simple number or category to aid in analyzing thecomplex drought process.
Regarding agricultural drought, John Keetch and George Byram say:
“A drought index can be defined as a number representing thenet effect of evapotranspiration and precipitation in producingcumulative moisture deficiency in deep duff or upper soillayers.”
B. What Makes a Good Drought Index for Fire Managers?
• Available historic record (Climatology) to reference andcompare with current values.
• Geographic Reference to “localize” it. Not all indices are goodfor all climates.
• Captures seasonal trends rather than day to day variations.Consider its “timelag.”
• Changes in the index correlate to changes in fire potential. Arethere valuable thresholds?

4.25
C. Normalized Index
To compare different parts of the country, drought indices must benormalized. A normalized index expresses drought relative to what isnormal for each analysis area and time period.
These normalized indices make it much easier to compare conditionsin dry climates to conditions in wet climates by eliminating the unit ofmeasure.
Good examples are the Palmer Drought Severity Index (PDSI) and theStandardized Precipitation Index (SPI).
As a normalized index, a PDSI of -4 should mean the same level ofdrought whether it is recorded in Alaska or Wyoming.
D. Objective Measure
Objective Measure indices require specific knowledge of responses tolocal conditions.
• Thresholds are developed for a specific area.
• Not as useful for comparing parts of a large area (U.S.).
• NFDRS and CFFDRS outputs.
E. Drought Monitor
Further, no single normalized index alone tells the entire story. TheNational Oceanographic and Atmospheric Administration (NOAA)produce the Drought Monitor each week.
Knowledgeable and experienced climatologists evaluate a number ofdrought indices and produce an interpreted map of overall droughtseverity.

4.26
The Drought Monitor includes data from five different indices andmeasures throughout the year including:
• Palmer Drought Severity Index• Standardized Precipitation Index• Weekly Streamflow• Percent of Normal Precipitation• Satellite Vegetative Health Index
Others used in the summer include:
• Keetch-Byrum Drought Index• Crop Moisture Index• Topsoil Moisture Index
Most important and familiar among these are:
1. Palmer Drought Severity Index (PDSI):
Considered a meteorological drought index, updated weekly bythe Climate Prediction Center, it is based on rainfall,temperature, and historic data.

4.27
It is computed base on a complex formula devised by W.C.Palmer in 1965. Although the Palmer is the main drought indexused by the U.S. Government, it is slow to detect fast-emergingdroughts.
It also does not reflect snow pack, an important component ofwater supply in the western United States.
Interpretation and Products:
• PDI of 6+ means extremely moist, -6 means extremedrought.
• Many PDI products are available from the NationalClimatic Data Center.
• Weekly updates available from NOAA Climate PredictionCenter.
• Considered a Normalized Index.
2. Standardized Precipitation Index (SPI):
Precipitation deficits have different impacts on groundwater,reservoir storage, soil moisture, snow pack, and Streamflow.
Soil moisture conditions respond to precipitation anomalies on arelatively short scale. Groundwater, streamflow, and reservoirstorage reflect the longer-term anomalies.
The SPI was designed to quantify the precipitation deficit formultiple time scales to help assess these resources.
A meteorological index based on the probability of precipitationfor any time scale, it can provide early warning of drought andhelp assess drought severity.

4.28
Interpretation and Products:
• Index ranks from –3.0 to +3.0
• Wetter and drier climates can be compared with SPI.
• National Climatic Data Center has SPI for 1, 2, 3, 6, 9, 12month and multi-year time periods.
• Considered a Normalized Index.
VII. DANGER RATING AND EVALUATING FUEL MOISTURE
Fire Order # 1: Base all actions on current and expected fire behavior.
How can drought be incorporated into fire behavior assessment?
In making fire behavior calculations, the first challenge is to estimate and/orpredict dead and live fuel moisture inputs for the fire model. However, ifdrought is to be effectively considered, it needs to be at least subjectivelyincorporated in the fire behavior calculation.
When fighting fires in North America, firefighters will encounter two sets ofdanger rating tools. Both the NFDRS and the CFFDRS produce both a setof fuel moisture values and fire behavior indices.
Outputs from these representative stations (RAWS) can be used toapproximate the fuel moistures and interpret fire potential for the firesituation. Both systems assume that daily inputs have been made, and thatweather observations are accurate and representative.
Their outputs represent peak burning conditions for that day at that location.It may even be valuable to combine outputs from several representativestations.
None of the danger rating fuel moisture values and fire behavior indices isconsidered normalized indices.

4.29

4.30
NFDRS includes several fuel moisture tools that may be effective inassessing drought in a local area:
A. 1000 hour Fuel Moisture (1000 hr)
Used to indicate the slowly changing fuel moisture of larger dead fuelclasses.
Inputs include max/min temp, max/min RH, precipitation duration andday length over the last 7 days. These are used to adjust yesterday’s1000-hr fuel moisture.
NFDRS developers noticed that the 1000-hour moisture showed aseasonal fluctuation similar to that of live fuels. Therefore, the “driver”in the model that causes changes in calculated live fuel moisture valuesis the 1000-hour fuel moisture.
In other words, if the 1000-hour fuel moisture value stays up, it meansthere has been adequate moisture throughout the season, which alsokeeps the herbaceous and woody vegetation growing.
If the 1000-hour moisture drops throughout the season, it meansreduced moisture, which also tends to cause the live vegetation tomove toward a cured or fall “dormant” condition.
In more humid areas of the eastern U.S., RH minimums seldom dropbelow 15 percent and nighttime recovery generally produces RHmaximums of greater than 80 percent.
Thus, even though there may be no rainfall, the 1000-hr fuel moisturerarely drops below the mid-range even though there may have been noprecipitation for several months.
As a result, the user must interpret smaller variations in 1000-hr values,which are more subject to bias of weather inputs.

4.31
B. Keetch-Byrum Drought Index (KBDI)
KBDI is a numerical model representing the net effect of evapo-transpiration and precipitation in producing cumulative moisturedeficiency in deep duff and upper soil layers.
It relates to the flammability of organic material in the ground. Inputsinclude average annual precipitation amount, daily maximum temp and24 hour rainfall amount. These are used to adjust yesterday’s KBDIvalue.
Ranges from 0 to 800 and expresses the NET rainfall needed for fullsoil moisture recharge (KBDI = 650 means 6½ inches needed).
Cool temps and short summers of north keep KBDI lower than hotand dry summers of southwest, indicating that it is not to beconsidered a normalized index.
C. Energy Release Component (ERC)
ERC is a dimensionless number related to the 24-hr potential worstcase total energy released per unit area within the flaming combustionstage.
It is based on a loading-weighted reaction intensity rather than surfacearea weighted. This gives the larger fuels more influence than theyhave in fire behavior predictions that focus on energy released only inthe flaming front.
In the flaming front, energy released is assumed to be only from thequickly burning fine fuels. ERC relates to the amount of fuel availableto burn, using the load of the selected fuel model and dryness of thosefuels in the calculation.
Moisture content of large fuels changes very slowly, so ERC in fuelmodels containing large fuels, such as fuel model G, change slowlywith the fuel availability. As a result, ERC-G is a fairly good indicatorof moisture deficits over one to several weeks.

4.32
D. Canadian Forest Fire Danger Rating System (CFFDRS)
The Canadian Fire Weather Index (FWI) was developed using weatherand fire data in northern boreal forests dominated by coniferous treessuch as spruce, fir, and pine.
Values are not normalized climatologically and are not adjusted forparticular fuel models. It is up to the user to determine which of thevalues are important and what thresholds are important for the localsituation.
Duff moisture code (DMC), drought code (DC), and buildup index(BUI) will all have lower overall values in the cool, short summers ofnorthern climates.

4.33
E. Fine Fuel Moisture Code (FFMC)
Because fires usually start and spread in fine fuels, the FFMC is usedto indicate ease of ignition, or ignition probability. The FFMC scaleranges from 0-99 and is the only component of the FWI System whichdoes not have an open-ended scale.
Generally, fires begin to ignite at FFMC values near 70, and themaximum probable value that will ever be achieved is 96. At the highend of the scale, a general rule of thumb is that the fuel moisturecontent is 101 minus the FFMC value.
Of importance is the fact that fire starts increase exponentially with anincrease in FFMC values at the high end of the scale. In the borealforest, a high potential for fire starts exists once the FFMC reaches 86-89.

4.34
F. Duff Moisture Code (DMC)
The DMC fuels have a slower drying rate than the FFMC fuels, with atimelag of 12 days or nearly 300 hours.
There really is no timelag analog for the DMC in NFDRS. Althoughthe DMC has an open-ended scale, the highest probable value is in therange of 150.
Inputs include noon observations for temperature, relative humidityand 24 hour precipitation total. These are used to adjust yesterday’sDMC. Due to the slower drying rate, a seasonal day-length factor hasbeen incorporated into the drying phase of the DMC.
G. Drought Code (DC)
The DC is an indicator of moisture content in deep, compact organiclayers. It is analogous to 1000-hr fuel moisture and KBDI fromNFDRS.
Temperature and rain affect the DC, although wind speed and relativehumidity do not because of the depth of this fuel layer.
The DC fuels have a very slow drying rate, with a timelag of 52 days.Therefore, a seasonal day-length factor is also incorporated in thedrying phase. The DC scale is open-ended, although the maximumprobable value is about 800.

4.35
H. Buildup Index (BUI)
The BUI is a weighted combination of the DMC and DC to indicatethe total amount of fuel available for combustion by a moving flamefront.
Like the DMC, it is an open-ended index with a realistic maximumvalue of 200. It has a similar track to the DMC for the same location,though values are somewhat higher.
BUI is frequently compared the NFDRS ERC. However, unlike ERC,fine fuel moisture plays no role in it, making it less sensitive to day today variations.
Because it combines DMC and DC, its timelag is assumed to besomewhere between 12 and 52 days, probably representing a timelagof between 2 and 3 weeks.

4.36
I. Interpreting Drought and Fire Danger Indices
Both the NFDRS and CFFDRS-FWI Systems produce relativenumerical ratings of fire potential over a large area – often representedby weather observations from a single weather station.
Unlike the NDVI remote sensing tool, which collects data from manypoints in the area of concern, extrapolation of fuel conditions from asingle weather observation can lead to some obvious biases.
Consider the situation where a local thunderstorm drops precipitationover a localized area around the weather station with most of the arearemaining dry. Similarly, the single daily observation is based on theassumption of regular diurnal changes in temperature and relativehumidity.
If a frontal system passes either just before or just after the dailyobservation, rapid swings in temperature and humidity can result. Inboth cases, the outputs will be biased and perhaps critically in error.Keeping this in mind will prevent misinterpretation.
Danger rating outputs can be more valuable than the frequentlyreferenced tools such as PDSI and SPI because the user can select thedata set and pick the particular index that represents the fire situation.Software tools like Fire Family Plus gives complete control of the dataand calculations.
Because these values are not normalized, tracking and comparingcurrent fuel moistures with other locations and corresponding timesfrom other years is important to understanding how critical the burningconditions are. It is especially important for those fuels that changemore slowly, responding over days, weeks, months and even years.
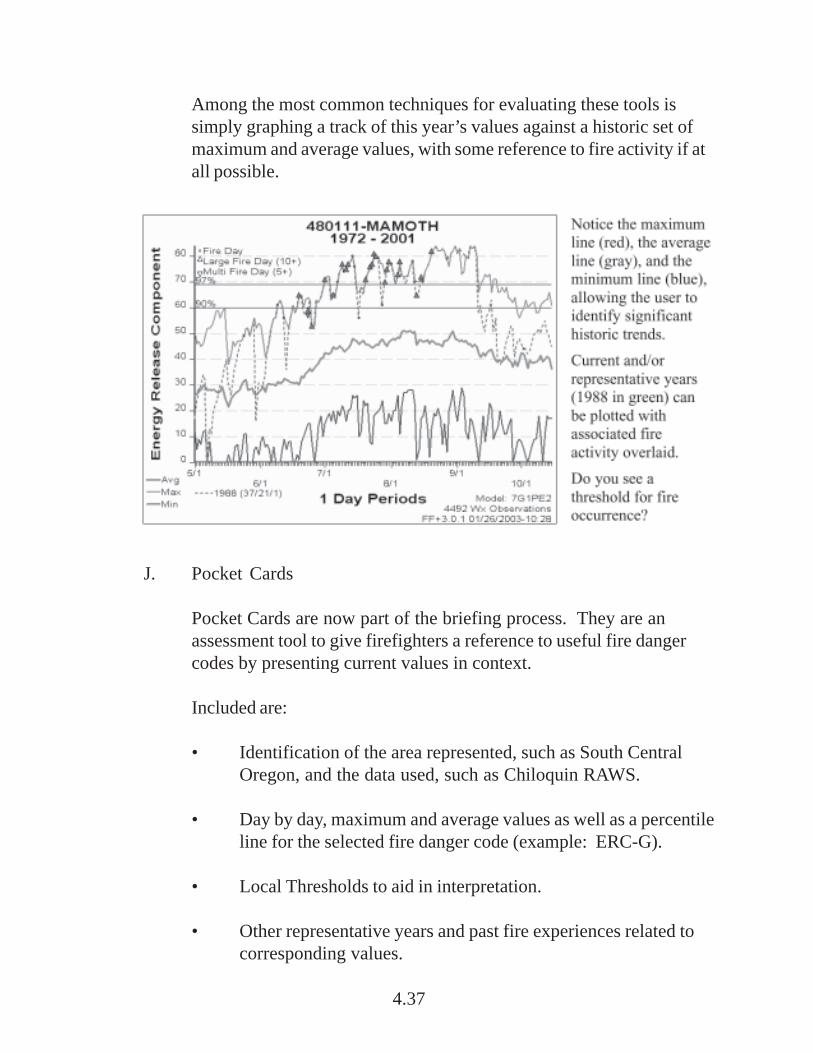
4.37
Among the most common techniques for evaluating these tools issimply graphing a track of this year’s values against a historic set ofmaximum and average values, with some reference to fire activity if atall possible.
J. Pocket Cards
Pocket Cards are now part of the briefing process. They are anassessment tool to give firefighters a reference to useful fire dangercodes by presenting current values in context.
Included are:
• Identification of the area represented, such as South CentralOregon, and the data used, such as Chiloquin RAWS.
• Day by day, maximum and average values as well as a percentileline for the selected fire danger code (example: ERC-G).
• Local Thresholds to aid in interpretation.
• Other representative years and past fire experiences related tocorresponding values.

4.38

4.39
K. Adjusting Fire Behavior Calculations
In the end, any of this information can be used subjectively to alertfirefighters to safety concerns.
However, if the goal is to calculate fire behavior, fuel moistureconsiderations can only influence the model in three ways:
1. Adjustments to dead and live fuel moisture inputs can be basedon:
• Direct measurements
• Lookup tables or danger rating outputs
• Subjective evaluation of drought
2. Different fuel models may be selected using an evaluation ofdrought conditions.
Drought conditions can influence fire behavior by adding fuelload and transferring live loads to dead categories, resulting ingreater intensity.
Consider switching to fuel models that have a higher Moisture ofExtinction and/or lower live fuel loading.
3. Consider the potential for extreme fire behavior.
Will spotting be a problem? Can crown fire be expected? Howwould these be predicted? Both of these will increase growthrates and fireline safety.

4.40
There are a number of indicators of drought that provide informationrelevant to extreme fire behavior potential. All have strengths andweaknesses, but none accurately reflect drought under allcircumstances.
There is no single drought index that can fully reflect both the shortand the long-term changes in fire potential. Select the best indicatorfor characterizing the fire’s potential today.

5A.1
Introduction to Wildland Fire Behavior Calculations, S-390
Unit 5 – Fire Behavior Models
Lesson A – Non-Electronic Wildland Fire Behavior Processors
OBJECTIVE:
Upon completion of this lesson, students will be able to:
• Use Appendix B of the Fireline Handbook and Fire Behavior Nomograms tocalculate rate of spread, fireline intensity, heat per unit area, and flame length.

5A.2

5A.3
I. INTRODUCTION
This lesson introduces two tools for predicting surface wildland firebehavior. Students will be given the tools to become proficient usingAppendix B and Fire Behavior Nomograms.
We will not be using BehavePlus; however, there is a tutorial for BehavePlusthat can be downloaded from: http://www.fire.org.
A. Rothermel’s Surface Fire Spread Model
A mathematical model primarily intended to describe the flaming front,advancing steadily in surface fuels within six feet of, and contiguousto, the ground.
B. Assumptions/Limitations of the Surface Fire Spread Model
1. Fuels are uniform and continuous.
2. Fire is free burning, and is no longer affected by the source ofignition.
3. Severe wildland fire behavior is not predicted by the model.
4. Describes behavior at the head of the fire where fine fuels carrythe fire.

5A.4
C. Aids in Calculations
Several wildland fire behavior processors have been developed to aidin calculations. All are based on the same mathematical algorithms.
1. Fireline Handbook Appendix B2. Fire Behavior Nomograms3. BehavePlus
The various processors give slightly different numerical outputs basedon their assumptions and physical methods of determining thenumbers.
II. APPENDIX B OF THE FIRELINE HANDBOOK
The tables in Appendix B represent the same outputs that can be foundthrough other wildland fire behavior processors. The mathematical modelsbehind the numbers are the same.
A. Needed Inputs
1. Standard USFPBS Fuel Model (1 – 13).
2. Slope Class – 0%, 30%, 45%, 60%, or 90%.
3. 1-Hour Time Lag Fuel Moisture.
4. Mid-flame wind speed – the wind should be blowing within ±30 degrees of upslope.
5. Live Fuel Moisture for those models that have that component.
In these examples, the needed inputs are given. In real life, the inputswill have to be obtained or calculated.

5A.5
B. Slope
Can use the slope class that is closest to the actual recorded slope orinterpolate between slope classes.
C. Live Fuel Moisture
1. Needed for Fuel Models 2, 4, 5, 7 and 10.
2. Using a range of 120% to 90% for each 1-Hour Time Lag FuelMoisture value.
3. Note corresponding range of both Rate of Spread and FlameLength.
4. Can interpolate if warranted.
D. Outputs
1. Rate of Spread (Chains/Hour)
2. Flame Length (Feet)
3. Fireline Intensity (Btu/Foot/Second)
By using the tables, one can visualize the effect of fuel moisture, mid-flame wind speed, slope, and fuel loading (Fuel Model) on wildlandfire behavior.
5A.6
EXERCISE 1.
Determine what information you have and what information you need to obtain orcalculate. It is OK to mark in Appendix B; it is only a tool. Document on the FireBehavior Worksheet.
Given: FM 3, 1-Hr – 6%, LFM – None,MFWS – 6, SLP – 0%
Outputs: Table 25Rate of Spread – 148 Chains per hourFlame Length – 14.9 Feet
Table 14Fireline Intensity – 1,000+
EXERCISE 2.
Do Exercise 1 again, but increase SLP to 90%.
Outputs: Table 29Rate of Spread – 278 Chains per hourFlame Length – 19.9 Feet
Table 14Fireline Intensity – 1,000+
Can see the effect of slope on effective wind speed, closeto doubling the predicted rate of spread.

5A.7
EXERCISE 3.
Given: FM 4, 1-Hr – 9%, LFM – 120%,MFWS – 1, SLP – 0%,
Outputs: Table 30Rate of Spread – 11.5 Chains per hourFlame Length – 7.4 Feet
Table 14Fireline Intensity – 100 - 500
EXERCISE 4.
Given: FM 2, 1-Hr – 3%, LFM – 120%,MFWS – 4, SLP – 10% (student needs to interpolate)
Outputs: Table 20 (at 0% slope)Rate of Spread – 28 Chains per hourFlame Length – 6.2 Feet
Table 14Fireline Intensity – 100 - 500
Table 20 (at 10% slope, interpolated)Rate of Spread – 30 Chains per hourFlame Length – 6.4 Feet
Table 14Fireline Intensity – 100 - 500

5A.8
III. NOMOGRAMS
A. What is a Nomogram?
A nomogram is a group of interconnecting graphs that can be used tosolve a mathematical equation or series of equations.
The surface wildland fire behavior nomogram allows us to predictwildland fire behavior by this method.
The magic is in the nomogram itself, not in working the solution. It isa relatively simple process.
How to Predict the Spread and Intensity of Forest and Range Fires(NFES 1573) is an excellent reference on working nomograms (pages43 – 49).
B. Needed Inputs
1. Standard USFBPS Fuel Model (1 – 13).
2. Mid-flame windspeed – the wind should be flowing within ± 30degrees of upslope.
3. Fine Dead Fuel Moisture (1-Hr Time-lag).
4. Live fuel moisture, if needed for that particular fuel model.
5. Maximum slope.
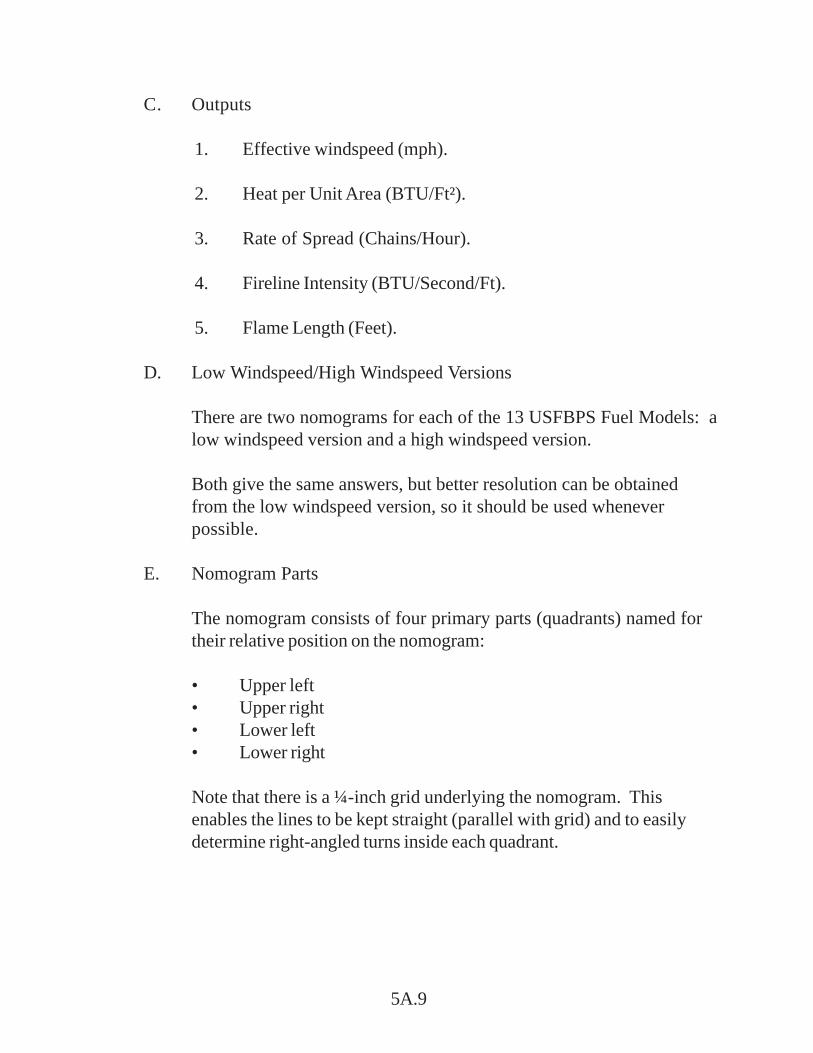
5A.9
C. Outputs
1. Effective windspeed (mph).
2. Heat per Unit Area (BTU/Ft²).
3. Rate of Spread (Chains/Hour).
4. Fireline Intensity (BTU/Second/Ft).
5. Flame Length (Feet).
D. Low Windspeed/High Windspeed Versions
There are two nomograms for each of the 13 USFBPS Fuel Models: alow windspeed version and a high windspeed version.
Both give the same answers, but better resolution can be obtainedfrom the low windspeed version, so it should be used wheneverpossible.
E. Nomogram Parts
The nomogram consists of four primary parts (quadrants) named fortheir relative position on the nomogram:
• Upper left• Upper right• Lower left• Lower right
Note that there is a ¼-inch grid underlying the nomogram. Thisenables the lines to be kept straight (parallel with grid) and to easilydetermine right-angled turns inside each quadrant.

5A.10
After initial preparation, a continuous line is drawn in a clockwisedirection, starting and finishing in the upper right quadrant.
In each quadrant the line makes a right-angled turn at a determinedpoint. Upon reentering the upper right quadrant, all output values willhave been identified.
A clear plastic ruler allows the grid to be seen as the lines are drawn. Itis important to keep the drawn lines straight but do not be concernedwith exact values in this course.
IV. NOMOGRAMS WITH ONLY DEAD FUEL MOISTURE
The following scenario illustrates the necessary steps to predict wildland firebehavior, using a fuel model with only fine dead fuel moisture (no live fuelmoisture component).
A. Scenario 1 Inputs:
• Short, dry grass (FM 1)• Slope – 40%• MFWS – 3 mph• Fine Dead Fuel Moisture – 4%
Use of the “Fire Behavior Worksheet” will facilitate keeping track ofthe input and output values as you proceed through the nomograms.
Copy the necessary input values from the scenario to a worksheet.
Next, select the correct nomogram. Always start with the lowwindspeed nomogram unless it is apparent that the effective windspeedrange you need is not included in the lower right quadrant.
5A.11
Work on a flat surface.
The next seven steps are used for all nomograms for fuel models thatdo not use live fuel moisture as part of the calculation (1, 3, 6, 8, 9, 11,12, and 13).
1. Step 1. Determine Effective Windspeed.
In the lower left quadrant, find the percent slope and draw avertical line to the top of the quadrant.
Find the midflame windspeed on the right-hand side of the samequadrant. If the midflame windspeed lies between the indexedvalues on the edge (as they do in our situation), make anapproximation of the location.
Follow the curved line down to the left until it intersects thevertical slope line you have drawn. For approximated values,you will have to establish that curved line.
From this intersection, draw a horizontal line to the left side ofthe lower left quadrant and read the effective windspeed.
Record the effective windspeed on the worksheet.
Effective windspeed for this example is a little over 4 mi/h.Once this value has been determined, the construction linesdrawn in the lower left quadrant will not be used again.
2. Step 2. Prepare Lower Right Quadrant.
Locate the line which represents the effective windspeeddetermined in the first step.
A line may need to be drawn approximating the effectivewindspeed value if it does not appear along the outside edge ofthe lower right quadrant.

5A.12
In most cases, it will need to be drawn. This line will be aturning point in the continuous line drawn around thenomogram.
Notice the dashed, or “high wind limit line” in this quadrant.The note reads:
Wind-driven fires of low intensity may behave erratically. Ifvertical line from chart above intersect effective windspeed lineto the left of the dashed line, rate of spread and fireline intensitymay be overstated.
When you intersect this dashed line before reaching the effectivewindspeed line, stop at the intersection with the dashed line, anduse that as your turning point.
3. Step 3. Prepare the Upper Left Quadrant.
Prior to reaching its ignition point, the fuel requires heat to driveoff moisture. This step takes into account a portion of the heatenergy reduction (called heat sink).
Fuel models with dead fuels only require that we find, orapproximate, a line in the upper left quadrant for the fine deadfuel moisture.
If an approximation is needed, start drawing the line in the lowerright corner of this quadrant and estimate where the moisturevalue lays in relationship to the indexed values along the edge.
This fuel moisture line in the upper left quadrant will serve asanother turning point for the continuous line about to be drawn.
All preparations have now been made, and we can begin our runaround the nomogram.
5A.13
4. Step 4. Begin Continuous Line and Determining Heat Per UnitArea.
Begin the continuous line which will calculate wildland firebehavior outputs.
Starting in the upper right quadrant, draw a horizontal line fromour fine dead fuel moisture content, intersecting the S-shapedcurve in that quadrant.
This curved line is sometimes called the “moisture dampeningcurve.”
Where this curve intersects the lower left-hand corner of thequadrant, the Rate of Spread and Heat Per Unit Area are zero.
Note that the value of the Dead Fuel Moisture is the moisture ofextinction for that fuel model.
At this intersection, turn a right angle and draw a vertical line upto the top of the quadrant and down into the lower rightquadrant, stopping at the effective windspeed line identified inStep 2.
Notice that as the line exited the bottom of the upper rightquadrant, a wildland fire behavior output was obtained.
Heat Per Unit Area is the total amount of heat released in eachsquare foot of the flaming fire front, expressed as Btu persquare foot.
All of the heat given off in the flaming front is included in thisvalue, regardless of the length of time that the flaming frontpersists.
For a given area with a specific amount and distribution of fuel(fuel model), heat per unit area is inversely related to fuelmoisture content.

5A.14
Heat released in flaming combustion that occurs as fuels burnout after the flaming front has passed is not included in the heatper unit area value.
The intersection in the lower right quadrant is determining howmuch of the energy is being transferred by wind and/or slope tothe fuels ahead.
5. Step 5. On to the Lower Left Quadrant.
From the effective windspeed intersection in the previous step,draw a horizontal line to the diagonal line in the lower leftquadrant.
All that is being accomplished in this step is changing directionfor the return into the upper quadrants. Pay no attention to thepreviously constructed lines from Step 1.
6. Step 6. Accounting for the Heat Sink Effect of Fuel Moisture.
Draw a vertical line into the upper left quadrant to theintersection of the fine dead fuel moisture ray identified or drawnin Step 3.
Notice that as fuel moisture increases the rays move lower in thequadrant thereby moving this turning point lower in thequadrant.
7. Step 7. Completion.
Draw a horizontal line from the intersection in Step 6, to the rightand intersecting the vertical line constructed in Step 4, inside theupper right quadrant. Draw a small circle at this intercept.
We have drawn our line through all four quadrants, filled in allinputs, and are ready to read the remaining outputs.

5A.15
Rate of Spread is read at the left hand edge of the upper rightquadrant where the horizontal line from Step 7 enters thequadrant.
Notice that if a higher fuel moisture had been used, the turningpoint in the upper left quadrant would have been lower in thequadrant resulting in a lower rate of spread.
Record rate of spread on the worksheet.
Fireline Intensity is read from the numbers embedded in thecurved rays in the upper right quadrant.
Find the small circle that you drew in Step 7 and estimate thefireline intensity by the location of your circle to the nearestcurved rays.
Record fireline intensity on the worksheet.
Flame Length is read as follows: Find the small circle in theupper right quadrant that you drew in Step 7. Follow the curvedray that lies nearest your circle to the top of the quadrant. Flamelengths are read to the nearest foot at the top of the quadrant.
Record flame length on the worksheet.
With Flame Length and Fireline Intensity both being on the samecurved line in the upper right hand quadrant, you can deducethat there is a mathematical relationship between the two values.
Fireline intensity and its related flame length are the bestindicators of the fire’s destructive force and resistance tocontrol.

5A.16
B. Scenario 1 Outputs:
• Heat per Unit Area – 95 Btu/Ft²
• Rate of Spread – ≈72 Chains/Hour
• Fireline Intensity – 110 Btu/Second/Ft
• Flame Length – 4+ Feet
It is important to always use your experience to check the outputs.This will allow you to begin to gain confidence in the nomogram aswell as become sensitive to the various input factors.
V. CALCULATIONS FOR MODELS THAT HAVE A LIVE FUELCOMPONENT
A. Scenario 2 Inputs:
• Timber with litter and understory (FM 10)
• Slope – 20%
• MFWS – 3 mph
• Fine Dead Fuel Moisture – 4%
• Live Fuel Moisture – 150% (new foliage is almost mature andcomparable to older foliage)
Find the correct nomogram and remember to use the worksheet torecord your inputs and outputs.
You should have selected the low windspeed nomogram for FuelModel 10.

5A.17
It will take seven separate steps to tour through the nomogram. Theaddition of the live fuel moisture to the calculation will change Steps 3and 4 a little. The remainder of the steps is the same as for the deadfuel only models.
These seven steps will remain the same for all fuel models that use livefuel moisture as part of the calculation (Fuel Models 2, 4, 5, 7, and10).
Steps 1 and 2 are the same as for a dead fuel nomogram calculation.
1. Step 1. Determine Effective Windspeed.
Go to the lower left quadrant and enter the slope and midflamewindspeed and read the effective windspeed along the left handmargin.
The effective windspeed for this example is about 3.5 mi/h.Record effective windspeed on the worksheet.
2. Step 2. Prepare Lower Right Quadrant.
Identify by writing the effective windspeed if needed on the rightaxis of the quadrant. Circle the effective windspeed value.
Draw a new ray for the effective windspeed calculated in Step 1.
Remember that the dashed line in this quadrant indicates thelimiting windspeed at which point a faster wind does notnecessarily imply faster spread rates.
This windspeed limit varies with fuel model and fuel moisture.

5A.18
3. Step 3. Prepare the Upper Quadrants.
Fuel models with both live and dead fuels require a horizontalline to be drawn.
Locate the fine dead fuel moisture values on the outer axis ofboth upper quadrants. Draw a horizontal line across bothquadrants.
From where this horizontal line intersects the live fuel moisturecurve in the upper left quadrant draw a straight line to the lowerright corner of that same quadrant. This line is referred to as the“K” line.
A number of live fuel moisture curves will not be curved much,consequently, the line you draw will not vary much from the livefuel moisture curve that was already there.
Note that the dash-dot patterns in the upper right quadrantrepresenting live fuel moisture are patterned the same in theupper left quadrant.
Note: It is possible that the horizontal line you have justconstructed does not intersect the correct live fuel moisturecurve. In this case, the live fuel moisture line should beextended in approximately the same arc until it intersects the finedead fuel line.
Then proceed drawing your line from this intersection to thelower right corner of the quadrant even if the fine dead lineintersects the live line to the left of the quadrant.
This becomes critically important when dealing with nomogramshaving greater curve in the live fuel lines (Fuel Model 5 and 7).
5A.19
Later, when calculating with the nomograms, the intersection ofthe continuous line with the angled “K” line that was constructedin this step will indicate where the continuous line will take theright turn in this quadrant.
4. Step 4. Determining the Heat Energy Output.
Begin the continuous line that will calculate the firecharacteristics desired.
Locate in the upper right quadrant the point where the fine deadfuel moisture line you drew in Step 3 intersects the appropriatelive fuel moisture curve. The live fuel moisture for our situationis 150 percent.
From this point draw a vertical line into the lower right quadrantto intersect the correct effective windspeed ray. Remember tostop if you hit the wind limit (dashed) line.
5. Step 5. On to the Lower Left Quadrant.
From the effective windspeed intersection in the previous step,draw a horizontal line to the diagonal line in the lower leftquadrant.
Again, pay no attention to the previously constructed lines fromStep 1.
6. Step 6. Accounting for the Heat Sink Effect of Moist Fuels.
From the intersection in the lower left quadrant, draw a verticalline into the upper left quadrant intersecting the “K” line drawnin Step 3.

5A.20
7. Step 7. Completion.
Draw a horizontal line, from the intersection in Step 6, to theright and intersecting the vertical line constructed in Step 4inside the upper right quadrant.
Now the nomogram is complete!
We have completed the tour of the nomogram using theappropriate inputs and it’s time to read the outputs.
Rate of Spread is read from the left edge of the upper rightquadrant at the point intersected by the line drawn in Step 7.
Record the rate of spread on the worksheet.
Flame Length is read the same as for dead fuel only models.Locate the curved ray in the upper right quadrant nearest thepoint you circled in step seven. Follow that ray to the top of thepage and record the flame length to the nearest foot on theworksheet.
Fireline Intensity is read from this same point by estimating itsdistance from the nearest curved lines. Fireline intensity valuesare associated with the curved lines.
Record fireline intensity on the worksheet.
Heat Per Unit Area is read at the lower margin of the upper rightquadrant where the line constructed in Step 4 exits. Record heatper unit area on the worksheet.
B. Scenario 2 Outputs:
• Heat per Unit Area – 1,450 Btu/Ft²• Rate of Spread – 4.5 Chains/Hr• Fireline Intensity – 95 Btu/Second/Ft• Flame Length – ≈ 4 Feet

5A.21
NOMOGRAM EXERCISE #1.
Complete the exercise on slide 44. You may refer to your workbook or “How toPredict the Spread and Intensity of Forest and Range Fires” for guidance.
NOMOGRAM EXERCISE #2.
Complete the exercise on slide 46. You may refer to your workbook or “How toPredict the Spread and Intensity of Forest and Range Fires” for guidance.

5A.22
5B.1
Introduction to Wildland Fire Behavior Calculations, S-390
Unit 5 – Fire Behavior Models
Lesson B – Spotting Model
OBJECTIVE:
Upon completion of this lesson, students will be able to:
1. Define the spotting model.
2. Identify the inputs needed for probability of ignition calculations.
3. Calculate the probability of ignition.
4. Identify the limitations, assumptions, and inputs needed for maximumspotting distance.
5. Calculate the maximum spotting distance.

5B.2

5B.3
I. DEFINE THE SPOTTING MODEL
A wildland fire is said to be spotting when it produces sparks or embers thatare carried by the wind and start new fires beyond the zone of direct ignitionby the main fire.
A. Methods for Estimating Severity of the Spotting Problem
1. Probability of ignition.
2. Spotting distance.
B. Factors Related to the Spotting Problem
1. Probability of production of firebrands.
2. Windspeed
3. Fire intensity.
4. Number of firebrands.
5. Type of firebrands.
6. Fuel that is receptive to ignition.
7. Weather and fuel conditions favorable for fire spread.

5B.4
C. Probability of Ignition
1. Definition, assumptions, and use.
a. Probability of ignition is the chance that a firebrand willcause an ignition when it lands on receptive fuels.
b. Values from 0 to 100.
c. Assumes that the right kind of firebrand lands on the rightkind of fuel.
d. If probability of ignition is 80, then 80% of the number of“appropriate” firebrands that land on “receptive” fuel willresult in ignition.
2. Probability of ignition is calculated for the point of ignitionfrom:
a. 1-hour dead fuel moisture.
b. Air temperature.
c. Fuel shading.
3. Use the chart found in the Appendix B of the FirelineHandbook.
a. Shading of the fuels due to cloud cover or canopy cover.
b. Dry bulb temperature in degrees Fahrenheit.
c. 1-hour timelag fuel moisture percent.

5B.5
II. CALCULATE THE MAXIMUM SPOTTING DISTANCE
A. Concept of Optimum Firebrand Size
1. Large enough to sustain fire for a time, yet small and lightenough to be lofted high into the air.
2. Aerodynamic shape aids in downwind transport.
B. Firebrand Source Affects Spotting Distance
1. Source strength affects maximum lofting height. Convectioncolumn strength directly affects the lofting height.
2. Source character affects trajectory of firebrand.
Torching trees loft firebrands from the top of the tree, providingadditional altitude prior to downwind transport.
C. Nomograms Predict Maximum Spotting Distance
1. If a fire produces 80 spots within 2 chains of the fireline andone spot a mile away, the nomogram will predict “one mile.”
2. Nomograms were developed for conditions of intermediate fireseverity in which spotting distances up to a mile or two mightbe encountered. Spotting for short distances of tens of yards isnot considered.

5B.6
3. Other situations not considered are those extreme cases inwhich spotting may occur up to tens of miles from the mainfront as in:
• Running crown fires.
• Fires in heavy slash or chaparral under extreme winds.
• Fires in which firewhirls loft burning material high into theair.
• Multiple torching trees.
4. The spotting distance model does not include:
• The likelihood of firebrand production.
• Availability of optimum firebrand material.
• The probability of spot fire ignition.
• The number of spot fires.

5B.7
D. Spotting Distance Nomograms
1. Required information
• Torching tree height, in feet.
• Torching tree species.
• Torching tree diameter at breast height (DBH iscommonly measured at about 4 feet above the surface), ininches.
• Average treetop height where the firebrand may fall, infeet.
• Windspeed at 20-foot height, in miles per hour.
2. Assumptions
• Level terrain.
• Firebrand source is a single torching tree.
• The firebrand will be transported over uniform forestterrain.
• The torching tree species is from the Intermountain West.
3. The mean treetop height is intended to characterize the generalforest cover of the terrain as it influences the wind field that willtransport a firebrand.
If the area has broken forest cover, use half the treetop height ofthe forest-covered portion.

5B.8
SPOTTING WORKSHEET EXERCISE.
Refer to the spotting worksheet on page 5B.11. Fill in the input information:
• Torching tree height = 150 feet
• Torching tree species = grand fir
• Torching tree DBH = 20 inches
• Average tree cover height = 130 feet
• Windspeed at 20-foot height = 20 mph
NOMOGRAM #1 INSTRUCTIONS
• On nomogram #l, find 20 inches DBH on the horizontal axis.
• Go up until you hit the line for grand fir; the top diagonal dashed line.
• Go to the left to find flame height on the vertical axis.
• Write the flame height (77) on the worksheet in the appropriate box.
• Just to the right of that box a calculation has to be completed. Divide box Aby box B. Write in that number as shown (1.9).
NOMOGRAM #2 INSTRUCTIONS
• On nomogram #2, find 20 inch DBH on the horizontal axis.
• Go up until you hit the GF line; the middle line.
• Go to the left to find flame duration on the vertical axis.
• Write the flame duration (4.6) on the worksheet.

5B.9
NOMOGRAM #3 INSTRUCTIONS
• On nomogram #3, find flame duration of 4.6 on the horizontal axis.
• Since the ratio of tree height to flame height is 1.9, move up to the “Morethan 1.5” line.
• Move to the left to find the ratio of lofted firebrand height to flame height onthe vertical axis.
• Write the answer (7.1) on the worksheet on line (C).
• Divide the value on line (A) by 2.
• Write the answer (150/2 = 75) on line (D). This number represents theaverage height above the ground that a firebrand will start its upward flight.
• Multiply the value on line (B) by the value on line (C). Write the answer(77 X 7.1 = 547) on line (E). This value represents height above the tree towhich a firebrand will be lofted.
• Add the values on lines (D) and (E).
• Write the answer (547 + 75 = 622) on the worksheet. The sum of these twovalues is the expected height above the ground that a firebrand will be lofted.This completes the ascension phase of the model. Now, how far will thisfirebrand travel downwind before landing?
• If the forest is open, divide average tree cover height by 2 and enter effectiveheight; if not, enter the average of the cover height. For this example, we willassume that the forest has a closed canopy. Enter 130 for effective treecover height.
• Multiply the windspeed of 20 feet on line (F) by 2/3. Use the maximumexpected windspeed as you are trying to predict the maximum spottingdistance. Also, the highest likelihood that severe fire behavior will occurresulting in the creation of firebrands is when the wind is at maximum speed.
• Write the answer (20 X 2/3 = 13) on the worksheet.

5B.10
NOMOGRAM #4 INSTRUCTIONS
• On nomogram #4, find the Maximum Firebrand Height of 622, on the rightportion of the horizontal axis.
• Go up to the effective tree cover height of 130. Interpolate between 100 and200.
• Go to the left to the treetop windspeed of Interpolate between 10 and 15.
• Go down to find the maximum spotting distance of 0.36 mile.
• Enter that number in the box on the worksheet.
EXERCISE:
Refer to pages 5B.15 - 5B.29 to complete problems 1-4. Use the following inputs:

5B.11 5B-01-S390-SR
SPOTTING WORKSHEET EXERCISE

5B.12 5B-01-S390-SR

5B.13 5B-01-S390-SR

5B.14

5B.15 5B-02-S390-SR
PROBLEM 1

5B.16 5B-02-S390-SR

5B.17 5B-02-S390-SR

5B.18

5B.19 5B-02-S390-SR
PROBLEM 2

5B.20 5B-02-S390-SR

5B.21 5B-02-S390-SR

5B.22

5B.23 5B-02-S390-SR
PROBLEM 3

5B.24 5B-02-S390-SR

5B.25 5B-02-S390-SR

5B.26

5B.27 5B-02-S390-SR
PROBLEM 4

5B.28 5B-02-S390-SR

5B.29 5B-02-S390-SR

5B.30

5C.1
Introduction to Wildland Fire Behavior Calculations, S-390
Unit 5 – Fire Behavior Models
Lesson C – Safety Zone Calculations
OBJECTIVES:
Upon completion of this lesson, students will be able to:
1. Describe the difference between a safety zone and a deployment zone.
2. Define and describe a safety zone by:
a. Identifying inputs needed for safety zone calculations.
b. Listing assumptions used in safety zone calculation.
3. Identify issues with safety zones on slopes.
4. Examine safety zones in fire entrapments.
5. Determine separation distance and safety zone size.

5C.2

5C.3
I. INTRODUCTION
Safety zones are an integral part of fireline safety. Their size varies greatlydepending fire behavior.
The size of safety zones needed under differing conditions can and shouldimpact fireline tactics.
The purpose of this unit is to give the student the tools to be able todetermine the size of safety zones for their use in the field based on firebehavior.
This unit will not explore the flame physics and other experimental data thatwere used in developing safety zone size criteria.
It will only cover the operational details of determining an appropriate safetyzone size.
II. DEFINITIONS
A. Safety Zone
A safety zone is an area that firefighters can retreat to and not have todeploy fire shelters to remain safe.
B. NWCG Glossary of Wildland Fire Terminology definition:
“An area cleared of flammable materials used for escape in the eventthe line is outflanked or in the case a spot fire causes fuels outside ofthe control line to render the line unsafe. In firing operations, crewsprogress so as to maintain a safety zone close at hand allowing fuelsinside the control line to be consumed before going ahead. Safetyzones may also be constructed as integral parts of fuel breaks; they aregreatly enlarged areas which can be used with relative safety byfirefighters and their equipment in the event of blowup in the vicinity.”

5C.4
C. Deployment Zone
“…used when fire conditions are such that escape routes and safetyzones have been compromised. Deployment zones are the last ditchareas where fire shelters must be deployed to ensure firefighter survivaldue to the available space and/or fire behavior conditions at thedeployment zone location.”
III. SAFETY ZONE CALCULATION
A. Two Inputs Needed for Safety Zone Calculation
1. Flame height (flame length).
2. Number and type of resources using the safety zone.
B. Assumptions
1. Safety zone size calculations are done on the “worst casescenario” that the fire will burn around the safety zone on allsides. Each side of the safety zone will receive the sameamount of heat.
2. Flame Length = Flame Height
3. Safe separation is a straight line from the heat source to thefirefighter.
C. Safety Zone Calculation
1. Separation distance is everything.
a. Minimum Separation Distance = 4 x flame height
b. Total Separation Distance = 4 x flame height + additionaldistances for crews and equipment

5C.5
2. 4 x the flame height rule:
a. Very rough – Minimum Separation Distance.
b. Does not consider personnel or equipment needs.
c. Considers only radiant heat.
d. Convection heat not considered:
• Strong Wind• Chimneys• Slopes
3. Two methods for acquiring the additional distance necessary tofind total separation distance:
• The simplified equation – crew and equipment additionalseparation distance:
4 x flame height + 20 + (4 x # of crews) + (# of pieces ofequipment) = Total Separation Distance.
• The following table:
5C.6
4. Circle safety zone example:
Total separation distance = the radius of the circle.
a. Flame height = 20 feet
b. 202 x 4 = 802 radius
c. 1 crew + 3 vehicles = 27 feet
d. Total separation distance = 107 feet
e. Diameter of circle = 107 X 2 = 214 foot diameter
Butler’s research is based on radii of circles. In real life, circlesand radii are not used on the fireline. Traditionally, a square/parallelogram is used for defining safety zones and clearings.
The square used in the following examples is an adaptation ofButler’s work to meet the field user dimensional descriptions. Aconversion to acres is also included.
Remember: Picture a football field; this is a closeapproximation to an acre.
5. Square safety zone square example:
Total separation distance x 2 = 1 side of the square.
a. Flame height = 20 feet
b. Total separation distance = 80 + 27 for personnel andequipment = 107 feet
c. 107 X 2 = 214 feet
d. Acres = 1

5C.7
6. How to figure acres from the dimensions of a square:
a. Side x side = square feet / 43,560 (sq feet in an acre) =acres in that safety zone.
b. For this example it is:
214 x 214 = 45,796 square feet
45,796/43,560 = 1 acre
7. Total separation distance = the side of the square.
Things not considered in the formula:
a. Heavy slash accumulations built up from safety zoneclearing operations
b. If you change the fuel loading by adding slash around asafety zone, you change fire behavior and flame height.
IV. ISSUES WITH SAFETY ZONES ON SLOPES
A. Safety Zones on Slopes
Consider the following situations:
1. A safety zone midslope above upslope spreading fire.
Intuitively it is expected that when safety zones are locatedabove upward spreading fires that occupants may be exposedto convective energy transfer from the fire.
Recent experimental measurements in large scale crown firesand analytical calculations suggest that convective energytransfer rates can be on the order of the radiant energy transfer.

5C.8
Thus, when safety zones are located above upslope spreadingfires (case 1 and 3), radiant energy transfer may be reduced butthe additional contribution due to convective heating willprobably more than compensate for the decreased radianttransfer.
2. A safety zone midslope with fire moving down the slope abovethe safety zone.
In all cases other than very strong downslope winds, a minimumseparation distance of at least 4 times the flame height should besufficient.
3. A safety zone at the top of the ridge with fire below.
This situation is similar to case 1 and carries the sameassumptions regarding upslope convective energy transfer.
The convective energy transfer may be reduced in case 3 if thesafety zone is located on the lee side of the ridge.
However, if the fire cannot be visually monitored from the safetyzone, provision should be made for communication withlookouts that can monitor weather conditions, fire intensity,flame heights and fire location.
4. A safety zone at the base of the slope below the downslopespreading fire.
This situation assumes:
• Fire stops at edge of safety zone
• No strong downslope winds
4 x flame height applies unless there are strong downslopewinds.

5C.9
B. Summary
1. Upslope convection biggest unknown.
2. 4 x flame height works in most cases.
3. Lesson from 30 Mile — maximize distance from fuels.
4. Allow extra travel time for uphill escape routes.
V. EXAMINATION OF SAFETY ZONES IN FIRE ENTRAPMENTS
Approximate safety zone/deployment area sizes come from the investigationsof these accidents:
A. Mann Gulch
This fire resulted in 10-40 foot flame lengths. The fire lit by WagDodge resulted in a safety zone that may have provided a separationdistance as great as 130 feet, although some estimates put it muchsmaller.
The comparison above indicates that the safety zone rule of thumbgenerally suggests that Dodge was on the “line” as far as burn injury.
The fact that he survived with little or no burn injury lends somecredibility to the model.

5C.10
B. Battlement Creek
Three firefighter fatalities and one serious burn injury on this fire.
Comparing against the safety zone model indicates that the modelpredicts severe injury or fatalities. Again this lends some credibility tothe model.
The crew involved was the Mormon Lake IHC. Although the crewhad fire shelters they were not carried on the line that day. At that time,fire shelters were still an optional use item.
Firing out was done by another crew from below the Mormon Lakecrew.
Communications were also an issue. Basically, the people found awide space in the line to lay down.
C. Butte Fire
Flames reached 200-300 feet in height. Firefighters were required todeploy their fire shelters to prevent injury. This agrees with the model.
The crews were in their shelters for up to two hours. They crawledfrom side to side of the clear-cut they were deployed in to avoid heatas the fire burned around them.
Several hotshot crews refused to go into the area and bailed out to alarger area when the fire started blowup. DIVS and Ops were tellingcrews to go into the area.

5C.11
D. South Canyon
Firefighters died while attempting to deploy in fire shelters on a firelinesurrounded by flames that were 50-90 feet tall.
Others survived while in fire shelters more than 400 feet from crownfires. These data suggest that the safety zone model is qualitativelyaccurate.
VI. EXAMINATION OF REASONS WHY FIREFIGHTERS CAN BECLOSER AND UNINJURED
• Use difference in heat output 7.4 vs. 4.8. Refer back to Butte firewhere crews crawled around to avoid heat as each side burned.
• Real FL/FH’s are hard to estimate accurately, especially whenadrenaline is flowing and the fire is running.
• Fast moving fire/ little residence time, smaller FH.
• Baggy clothing is good – creates an air space between clothing andbody to help dissipate.
• Low emissionability of heat transfer from short flames.

5C.12
A. Reality Checks
1. Reality check # 1
a. Good safety zones are often recognized not built(meadows).
b. Distance to safety zones needs to reflect the ROS of thefire.
c. Situational Awareness – size of safety zones and length ofescape routes change dependent on conditions; continualre-evaluation is a must.
2. Reality check # 2
a. Is the size of the safety zone too large for resourceobjectives?
b. Is the safety zone being used for a parking area / fuelstorage / equipment?
c. Is construction of a large safety zone feasible within timeconstraints?
d. If the safety zone is large do we need to put people in thatarea?
e. What are other tactical options?
5C.13
B. Where Do We put Safety Zones?
1. Meadows
2. Large open areas below the fire.
3. On the lee side of ridges outside of eddy effect when windy.
4. Cross slope from the head of the fire.
5. Areas with good access for personnel.
6. Broad open ridgelines (if windy see #3).
7. In previously burnt areas if it is hard black.
C. Where Not to Put Safety Zones
1. Saddles
2. Chimneys
3. Heavy fuels concentrations.
4. Areas with poor access.
5. Razor back ridges.
6. Windward side of ridge above the fire.
7. Midslope above the fire.
8. Above the fire.
5C.14
SAFETY ZONE EXERCISES.
You will be given three different flame heights, numbers of crews, and equipment.Determine the total separation distance for:
1. Safety zone as a circle.
2. Safety zone as a square.
3. Acres needed for a safety zone.

5C.15
Wildland Firefighter Safety Zones
B.W. Butler and J. Forthofer, USDA Forest Service, Rocky Mountain ResearchStation, Fire Sciences Laboratory, Missoula, MT. Tel: 406-329-4801 or 4874,e-mail: [email protected].
In 1998, a simple rule-of-thumb was proposed as a definition of minimum separationdistance between firefighters and flames to prevent burn injury. The rule stated thatthe safety zone must be large enough to allow the firefighter to be at least 4 flameheights in distance from the fire front.
Since then, safety zone research efforts have focused on obtaining measurements ofenergy emitted by “real” fires. These measurements are needed to evaluate theaccuracy of the theoretical safety zone model. Unfortunately, such measurementsare difficult to make in wildland fires.
To date, measurements have been collected in fires burning through high elevationsage brush in Montana; manzanita, juniper and pinyon pine in northern Arizona; tallgrass prairies in Kansas; crown fires in the boreal forest of Northern Canada; andlodge pole pine forests in eastern Oregon.
The Flame ModelTechnically speaking, wildland fires are composed of turbulent diffusion flames,meaning that the temperature of the flame and the energy released by the flame is afunction of the rate that oxygen in the air can mix with the combustible gasesreleased by heating of the woody fuels. This also explains why wind is the dominantenvironmental factor affecting fire behavior. Any firefighter who has worked on afire has observed the strong influence that wind can play on fire intensity and size.
The effect occurs in two ways: 1) increased wind causes increased mixing of the airand combustible fuels—leading to faster burning and higher temperatures; and 2)wind causes the flames to tilt forward closer to the vegetation ahead of the firefront—leading to increased energy transfer to those fuels and thus faster heating andignition.
5C-01-S390-SR
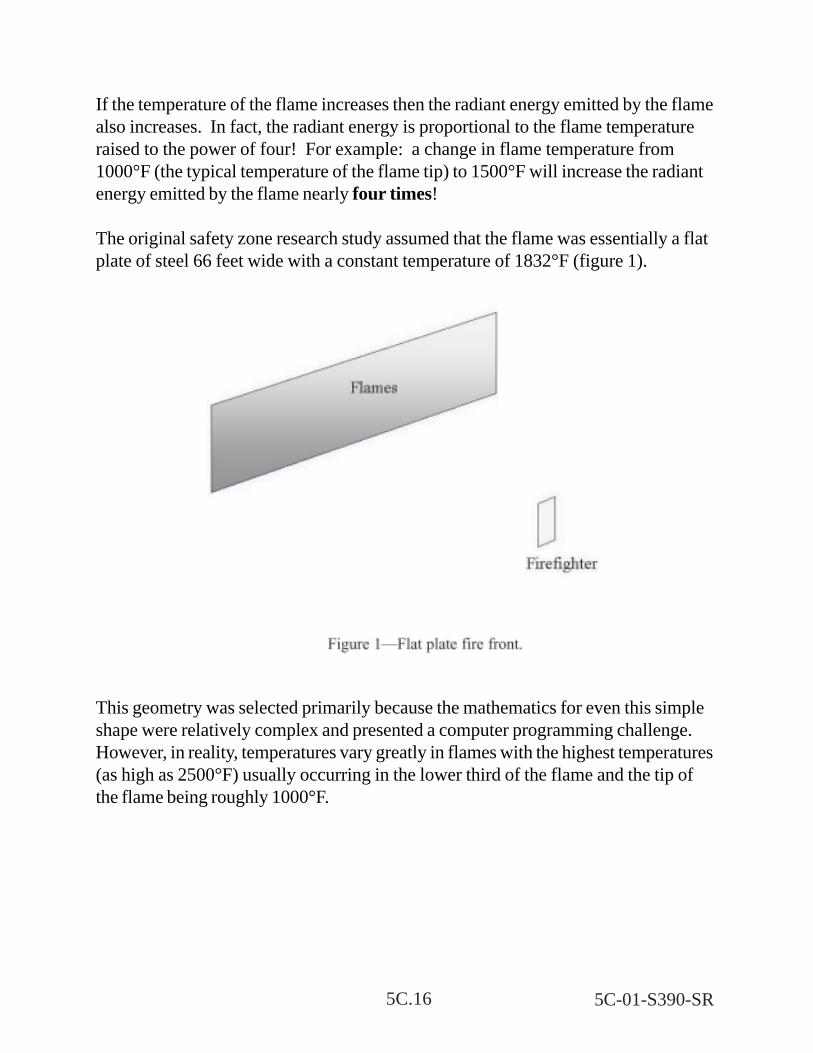
5C.16
If the temperature of the flame increases then the radiant energy emitted by the flamealso increases. In fact, the radiant energy is proportional to the flame temperatureraised to the power of four! For example: a change in flame temperature from1000°F (the typical temperature of the flame tip) to 1500°F will increase the radiantenergy emitted by the flame nearly four times!
The original safety zone research study assumed that the flame was essentially a flatplate of steel 66 feet wide with a constant temperature of 1832°F (figure 1).
This geometry was selected primarily because the mathematics for even this simpleshape were relatively complex and presented a computer programming challenge.However, in reality, temperatures vary greatly in flames with the highest temperatures(as high as 2500°F) usually occurring in the lower third of the flame and the tip ofthe flame being roughly 1000°F.
5C-01-S390-SR
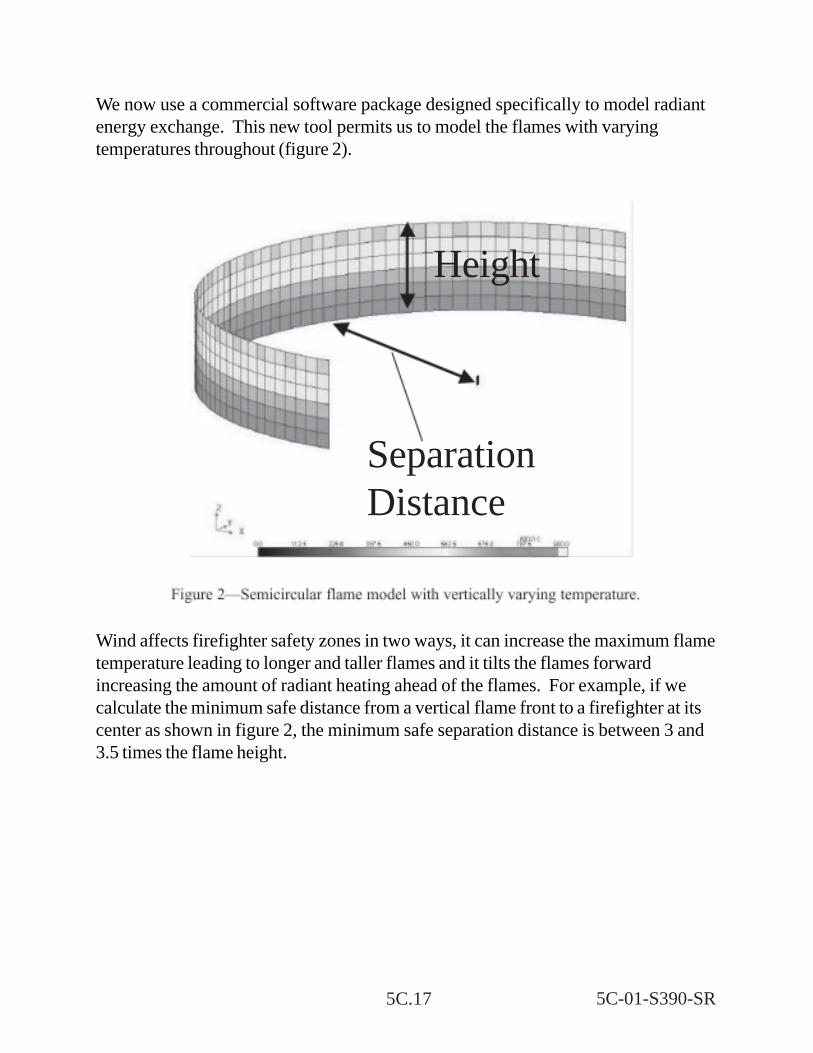
5C.17
We now use a commercial software package designed specifically to model radiantenergy exchange. This new tool permits us to model the flames with varyingtemperatures throughout (figure 2).
Wind affects firefighter safety zones in two ways, it can increase the maximum flametemperature leading to longer and taller flames and it tilts the flames forwardincreasing the amount of radiant heating ahead of the flames. For example, if wecalculate the minimum safe distance from a vertical flame front to a firefighter at itscenter as shown in figure 2, the minimum safe separation distance is between 3 and3.5 times the flame height.
5C-01-S390-SR
Height
SeparationDistance

5C.18
If that flame is now tilted towards the firefighter as would occur if the wind weredriving the flame (figure 3) then the minimum safe separation distance increases tobetween 3.5 and 4-times-the-flame-height.
The tilted semicircular configuration is chosen for the firefighter safety zonecalculations because it represents the “worst case” scenario in terms of heat impacton the firefighter.
Burn Injury LimitsThe effect to the skin is the same regardless of whether the heating occurs byradiation from the fire, conduction from contact with a hot source, or convectionfrom hot air or flames. The heating levels that cause burn injury are not easilydefined; burn injury severity depends on exposure time and heating magnitude.
In other words, exposure to a low level heating source like the sun for a long timewould result in the same effect as exposure to a higher energy source like a fire for ashort time. The type, thickness, number of layers, fit of clothing and even the rate atwhich the person wearing the clothing perspires also are important.
5C-01-S390-SR
Height

5C.19
The Society of Fire Protection Engineering Handbook indicates that exposure ofbare skin to any type of heating greater than 0.23 Btu/ft2-s (2.5kW/m2) for a longperiod will result in burn injury. As a point of comparison, the maximum energy thata person could receive by exposure to the sun is less than 0.09 Btu/ft2-s (1kW/m2).Exposure of unprotected skin to heating levels greater than 4.5 Btu/ft2-s (50kW/m2)will result in severe burn in less than 15 seconds, and if the area of exposure is largeenough, fatality in 40 seconds.
In the original safety zone study, 0.6 Btu/ft2-s (7kW/m2) for 90 seconds was selectedas the level at which a firefighter wearing Nomex clothing would receive seconddegree burn injury. The 0.6 Btu/ft2-s limit is based on an experiment where Nomexcloth was located ½ inch away from the burn sensor. If the cloth is touching theskin then the time to burn injury drops to about 35 seconds.
The bottom line is that severe burn injury to skin covered with one layer of Nomexfrom radiant heating occurs when energy flux levels exceed 0.45 to 0.72 Btu/ft2-s (5to 8 kW/m2) for a minute or two. At this time, there is no clear reason to change theburn injury limit (0.6 Btu/ft2-s after exposure of 80 to 90 seconds) that is being usedto define the firefighter safety zone size.
As a point of comparison, while working on the Monument Fire in eastern Oregonthis summer we stood about 40 feet away from flames that were 15 feet wide and 50feet tall. We were receiving enough heat that it was very uncomfortable and evenpainful forcing us and the firefighters around us to shield our faces. Calculationsassuming a rectangular flame with temperatures similar to those used for the safetyzone model suggest that we were receiving about 0.3 Btu/ft2-s (3 kW/m2); a rateabout one half that selected as the burn injury limit for safety zones.
Given the increased heating for tilted flames and the uncertainty associated withestimating burn injury limits, flame heights, and fire intensity we recommend that the4-times-the-flame-height rule be retained as the minimum separation distance model.We emphasize minimum. At this separation distance, under conditions where theflames are uniformly radiating from two or more sides of the safety zone, firefighterswill probably be subjected to heating levels that require shielding all exposed skin,breathing thick smoke, and likely experience ember showers.
5C-01-S390-SR

5C.20
The mathFor purposes of calculating firefighter safety zone size, we propose the followinggeometrical configuration (figure 4) where the safety zone is a circle. The radius ofthe circle or total separation distance is a combination of 4-times-the-flame-heightand the additional area needed for people and equipment. In other words, theperson closest to the fire must be 4-times-the-flame-height away.
The Safety Zone Size (SZS) can be calculated using equation 1.
5C-01-S390-SR
SZS

5C.21
SZS is total separation distance for a circular safety zone the radius of the circle.FH is flame height or alternatively flame length. AFF is area needed for each firefighter(we suggest 50 ft2 — the space needed to deploy a fire shelter). NFF is the numberof personnel that will be using the safety zone. AE is the area needed by each item ofheavy equipment (a crewcab pickup would require about 200 ft2, a D6 Caterpillarwith blade and ripper attachments requires about 280 ft2, a D8 with attachmentsrequires about 360 ft2). NE is the number of pieces of heavy equipment that areexpected to use the safety zone. The dividing factor of three is an approximation tothe numerical constant pi (actual value 3.14159). This equation is difficult to applywhile working on a fire.
Table 1 presents the solution to equation 1 for a range of numbers of firefightercrews and number of vehicles. The number obtained from the table should beadded to 4-times-the-flame-height to get total minimum separation distance or safetyzone radius.
Finally, a third option is to use the following approximation to equation 1:
The additional distance needed above the four times flame heightfor people and equipment (in feet) = 20 + 4 x (the number of 20person crews) + (the number of pieces of equipment).
This will give an approximation to the solution of equation 1.
5C-01-S390-SR

5C.22
A fourth method is to use the 4-times-the-flame-height rule and simply estimate thearea needed for people and equipment.
The 4-times-flame-height rule represents a very rough approximationbased only on radiant heating and should be taken as a minimum. Itdoes not account for convective heating such as may occur understrong winds, in steep narrow canyons, or on slopes.
What about short flames?There is some evidence that the 4-times-flame-height rule does not hold true forshort flames (less than 5 feet in height). The primary reason for this relates to thedepth or thickness of the flames. Shorter flames are less efficient radiators thantaller flames and thus they give off less energy. However, limited measurements inactual wildland fires indicate that as height or length of the flames increases theflames radiate more energy per unit area.
Another factor is that the model is based on a uniform and continuous flame frontoriented in a semicircle around the front of the firefighter (figure 5). Very seldom isthis actually the case for short flames; they usually are less uniform and continuous,and do not encircle the firefighter. For these basic reasons, we have not modifiedthe 4-times-flame-height rule for short flames.
5C-01-S390-SR
5C.23
What about using water bodies as a safety zone?There are historical accounts of firefighters and others successfully using water as asafety zone. Two different cases can be distinguished. The first case is whenfirefighters are on the water, for example in a boat. For this case, the standard 4-times-the-flame-height minimum separation distance rule applies. Common sensedictates that all personnel on the water should have a personal floatation device.
The second case is when firefighters are in the water (swimming, floating, wading,etc.). For this case the separation distance model we have developed does notapply. The reason is because the water (assuming typical stream and laketemperatures) cools the skin more effectively than air does.
This suggests that the firefighter could be closer than 4 times the flame height andnot be burned from radiant heat. However, there are other factors that should beconsidered in this case such as the risk of drowning and hypothermia. Also, beingcloser to the flames could expose the firefighter to convective heating which couldlead to burning of the airways.
In general, water should not be considered as a safety zone except as a last resort,when escape routes have been cut off and a deployment situation is imminent.Such action should include use of the fire shelter as a heat shield while in the water.
ConclusionIn conclusion, further modeling and field measurements support the 4-times-flame-height rule of thumb for minimum safety zone size. It is important to realize that thisshould be considered a minimum—meaning that in all cases larger is better.
It is also important to remember that the rule of thumb is based on radiant heatingand firefighters should always be cognizant of situations that may lead to convectiveheating.
Future work will focus on characterizing the parameters that influence convectiveheating. Up-to-date summaries of firefighter safety zone information can be foundat www.firelab.org/fbp/reshome.htm.
5C-01-S390-SR

5C.24
Example calculation of safety zone size:
Situation:You are a member of a crew of 20 firefighters that has just arrived at a fire burningsouth of Ely, Nevada. You arrived the previous night. The morning briefing isscheduled for 20 minutes from now and your crew boss asks you to provide himwith some estimates of minimum safety zone sizes that will be needed for themorning and afternoon. He expects that you will be assigned to build and maintainfireline on the southeast flank of the fire. You may have one D4 dozer assigned towork with you.
Solution:Information needed is:
1) Fh—flame height or length for both the morning and afternoon.2) Nff—number of persons that will be using the safety zone.3) NE—number of vehicles and/or heavy equipment that may need
to use the safety zone.
Procedure:You are unfamiliar with the area and fire behavior, so you go to the fire behavioranalyst (FBAN) and ask for estimates of flame lengths given expected weather andfuels in the area you will be working. He says that flames have been 15 to 20 ft inthe mornings and 20 to 25 ft in the afternoon. But today a dry cold front isexpected to pass through about 1430, it will result in higher westerly winds thenprevious days.
The FBAN is predicting flame lengths of 28 to 35 ft during the cold front passage.The FBAN predictions correspond with observations from the previous day’sburning (during initial attack, an FBAN may not be available, but in most cases,other firefighters that have observed fire in similar fuels and under similar conditionscan provide estimates of flame height). With this information you now can calculatethe minimum safety zone size assuming a circular safety zone.
Fh = 20 in the morning and 35 in the afternoonNff = 20 plus 2 (crew plus dozer operator and dozer boss)NE = 4 (2 crew rigs, a dozer boss rig and a D4 dozer)
5C-01-S390-SR

5C.25
Using Equation 1:Safety zone radius = 4 x flame height + [( Nff x 50 + NE x 200)/3]1/2
Safety zone radius = 4 x 20 + [(22 x 50 + 4 x 200)/3]1/2
= 80 + [(1100 + 800)/3]1/2
= 80 + [633]1/2
= 80 + 25= 105 ft for the morning period and (140+25 due to the expectedtaller flames) or 165 ft in the afternoon.
Using Table 1:Safety zone radius = 4 x flame height + (# from table for 1 crew and 4 pieces of
equipment)
Safety zone radius = 4 x 20 + 24= 80 + 24= 104= 104 ft for the morning period and (140+24 due to the expectedtaller flames) or 164 ft in the afternoon.
Using the simplified equation:Safety zone radius = 4 x flame height + 20 + 4 x (# crews) + (# of pieces of
equipment)
Safety zone radius = 4 x 20 +20 + 4 x 1 + 4= 80 + 20 + 4 + 4= 108 ft for the morning and 168 ft (140 + 28) during theafternoon.
You can now tell your crew boss that the safety zones need to be big enough toallow the firefighters to be more than 100 feet from the flames in the morning andmore than 160 feet from the flames in the afternoon. For a circular safety zone,these distances would be the circle’s radius.
5C-01-S390-SR

5C.26

6A.1
Introduction to Wildland Fire Behavior Calculations, S-390
Unit 6 – Fire Growth
Lesson A – Plotting Fire Size and Shape
OBJECTIVE:
Upon completion of this lesson, students will be able to:
• Given an active wildland fire situation, plot on a map the predicted perimeter,shape, and area of a fire originating from a point source.

6A.2
6A.3
I. PLOTTING FIRE SIZE AND SHAPE
A. Area and Perimeter Predictions and Shape Patterns
Fire perimeter, area, and shape may be calculated from a point sourceusing effective wind speed and spread distance.
1. What information is needed for fire perimeter and areacalculation?
a. Effective mid-flame wind speed and spread distance.
b. Effective mid-flame wind speed is derived fromcombining the effects that slope and mid-flame wind haveon the fire front.
2. Where do you get the effective mid-flame with speed?
In the lower left quadrant of the surface fire nomogram, or thefollowing guideline for effective wind speed calculation:
• Mid-flame wind speed (in mph) plus 1 mph per 20%increase in slope.
3. Spread distance – this is the product of ROS multiplied by theprojection time.
B. Solving for Fire Area and Perimeter
1. Appendix B of the Fireline Handbook.
2. Follow the matrix – effective wind speed across the top andspread distance down the left column.
6A.4
EXERCISE 1:
A test fire is started at 1400 hrs. The ROS is estimated at 8 ch/hr with an effectiveMFWS of 5 mph.
Solve:Fire perimeter and area at 1430 and 1500.
EXERCISE 2:
A 900-acre size wildland burn is desired in fuel model 3 in a flat riparian marsh.Normally, the relative humidity rises to a level by 1900 in August so that the fire’sspread will halt. Average afternoon conditions are: 20-foot wind speed is 7 mph,relative humidity is 25 to 29%, and dry bulb temperature is 80 to 90°. Assume 1600for fuel moisture calculations.
Solve: Use nomograms and/or tables to determine the time that the fire should belit to allow for a 900-acre fire at 1900 allowing free burning to occur.

6A.5
C. Fire Shapes
1. Calculate the effective wind speed for the fire.
2. Appendix B of the Fireline Handbook - find the appropriateshape of the fire using the effective wind speed.
D. Plot the Ellipse on a Map
1. Mark the point of origin on the map.
2. Draw a line indicating the direction of the slope.
3. Measure the spread distance on the map and mark the furthestpoint from the point of origin.
4. Using Appendix B of the Fireline Handbook, find theappropriate shape of the fire using the effective wind speed.
5. Draw the shape of the fire on the map.

6A.6

6A.7 6A-01-S390-SR
EXERCISE 3 – FIRE SHAPE
Use the information below and the map on the next page to complete the exercise.
Inputs:
ROS = 15 ch/hrPT = 2 hrsEWS = 8 mi/hr
MAP SPREAD WORKSHEET
INPUT
0 Projection Point ______ ______ ______
1 Rate of Spread, ch/hr ______ ______ ______
2 Projection Time, hr ______ ______ ______
3 Spread Distance, ch ______ ______ ______ (line 1 x line 2)
4 Spread Distance, ft ______ ______ ______ (line 3 x line 66 ft/ch)
5 Map Scale ______ ______ ______
6 Conversion Factor, ft/in ______ ______ ______ (see map scale conversion)
OUTPUT
1 Map Spread Distance, in ______ ______ ______ (line 4 divided by line 6)

6A.8 6A-01-S390-SR

6B.1
Introduction to Wildland Fire Behavior Calculations, S-390
Unit 6 – Fire Growth
Lesson B – Point Source
OBJECTIVES:
Upon completion of this lesson, students will be able to:
1. List the situations where basic fire behavior and point source projections areappropriate.
2. Identify concepts, limitations, and assumptions for Point Source.

6B.2

6B.3
I. SITUATIONS WHERE BASIC FIRE BEHAVIOR AND POINT SOURCEPROJECTIONS ARE APPROPRIATE
Point source refers to a fire that is very small at origin in relation to its size atthe end of the burning time.
The fire spread occurs from a “point” or “spot” as opposed to a line of fire,such as:
• Lighting strike• Spot fire• Prescribed fire ignition points
The fire spreads in a relatively constant fire environment where:
• Fuel and fuel moistures are constant
• Weather conditions are constant
• Topography is constant
II. CONCEPTS, LIMITATIONS, AND ASSUMPTIONS FOR POINTSOURCE
A. Basic Assumption
Point source can only be used when:
1. The fire is originating from a point source and burning on flatground or straight upslope.
2. The wind is blowing in the direction of maximum slope plus orminus 30°.
3. The period of burning time is usually short, up to 1 hour, butcould be longer.

6B.4
4. Calculations of fire area and perimeter with effective mid flamewind speeds less than 2.5 mph are generally too low.
Better predictions result with wind speeds greater than 2.5 mphbecause the shape of the fire will probably be more uniformlycontrolled by the stronger wind speed.
5. Fire perimeter and shapes are based on smooth ellipses. Theactual perimeter of the fire edge would likely be a greater lengthand follow topographic relief.
6. All the assumptions made in fuel models, the fire behaviormodel, and the application of the fire behavior model, are madein this procedure.
B. Uses of Point Source Predictions
Keeping in mind the assumptions and limitations of the models, tables,charts, and other tools used in calculating point source predictions, thefollowing could be useful in fire behavior outputs, perimeter, area, andshape predictions.
• Crew locations
• Equipment locations
• Helispot locations
• Fuel break locations
• Development of the Wildland Fire Situation Analysis (WFSA)

6B.5
1. Pre-suppression planning
a. Personnel requirements.
b. Need for retardant before the fire can be staffed.
c. Attach priorities in multiple-fire situations.
2. Prescribed burning
a. Distance between point ignitions to accomplish theobjective.
b. Calculating timing of ignition to take advantage of diurnalweather patterns (humidity recovery).
c. Managing wilderness fires.
d. Development of the escaped fire contingency plan.

6B.6
POWERPOINT EXERCISE 1:
Given: A prescribed burn escapes at 1200 hours in fuel model 5.
Inputs:
• Fine fuel moisture is 5%• Mid flame wind speed 4 mph• Slope 35%• Live fuel moisture is 100%• A patrol with hand tools will arrive by 1230.• A dozer can be on the fire by 1300.
Use nomograms and/or tables to solve.
What will rate of spread, flame length, fire perimeter and area be when:
• The patrol arrives:
• The dozer arrives:

6B.7
POWERPOINT EXERCISE 2:
Given: A wildfire starts on September 1 at 1200. The ignition point is shown onthe map.
Inputs:
• Fuels – model 2
• Live fuel moisture 150%
• Temperature 89°
• RH 30%
• Dead fuel moisture – use table. Assume the readings were taken at yourlocation.
• 20 foot winds SW at 12 mph
Use nomograms and/or tables to solve.
Calculate area and perimeter of the fire by 1300.
Sketch approximate shape of the fire at 1300.
Plot fire behavior outputs on a fire characteristics chart.

6B.8

7.1
Introduction to Wildland Fire Behavior Calculations, S-390
Unit 7 – Extreme Fire Behavior
OBJECTIVES:
Upon completion of this unit, students will be able to:
1. Describe environmental conditions and key indicators under which crownfires are likely to occur.
2. Describe the characteristics of plume dominated fires.
3. Describe the reverse wind profile and effects on fires.
4. Describe pyrocumulus cloud development.
5. Describe the warning signs and the potential hazards of a collapsing column.

7.2

7.3
I. ENVIRONMENTAL CONDITIONS AND KEY INDICATORS UNDERWHICH CROWN FIRES ARE LIKELY TO OCCUR
A. Crown Fire
Crown fire is a critical element of overall fire behavior. Increased fireintensity is typically experienced after the transition.
B. Favorable Conditions for Crown Fire
• Dry fuels
• Low humidity, high temperatures
• Heavy accumulations of dead and down fuels.
• Ladder fuels such as conifer reproduction and brush.
• Steep slopes
• Strong winds
• Instability in the atmosphere.
• High percentage canopy cover and continuous forest cover.
These conditions will vary over time and space.
Their interaction can cause an increase in intensity of the surface firewhere the flames will reach the crowns and the foliage will ignite.
This will create torching and spotting. As this activity increases thestage is set for an active crown fire.
Crown fires can be either wind driven or plume dominated.
7.4
C. Canopy Bulk Density and Crown Fire
• Canopy bulk density is an important factor affecting crown fireoccurrence.
• Canopy bulk density is the amount of needles and small twigsper unit of volume.
• Canopy bulk density is analogous to fuel load in surface fuels.
D. Crown Fire Initiation
C. E. Van Wagner’s research into crown fire in Canada shows thatcrown fire initiation can be boiled down to essentially three majorcomponents.
1. Crown fire is a function of:
• Canopy base height• Surface fire intensity• Foliar moisture content
2. Van Wagner’s Crown Fire Initiation Model
Foliar Moisture Content (FMC) has only a small effect oncrown fire initiation relative to Canopy Base Height (CBH) andFireline Intensity (flame length).
For most purposes, assume a FMC of 100% is good.
The flame height = base height is included to show how theflame heights above 6 feet do not need to be actually touchingthe crowns to ignite them. This is a function of the heat outputof the fire.
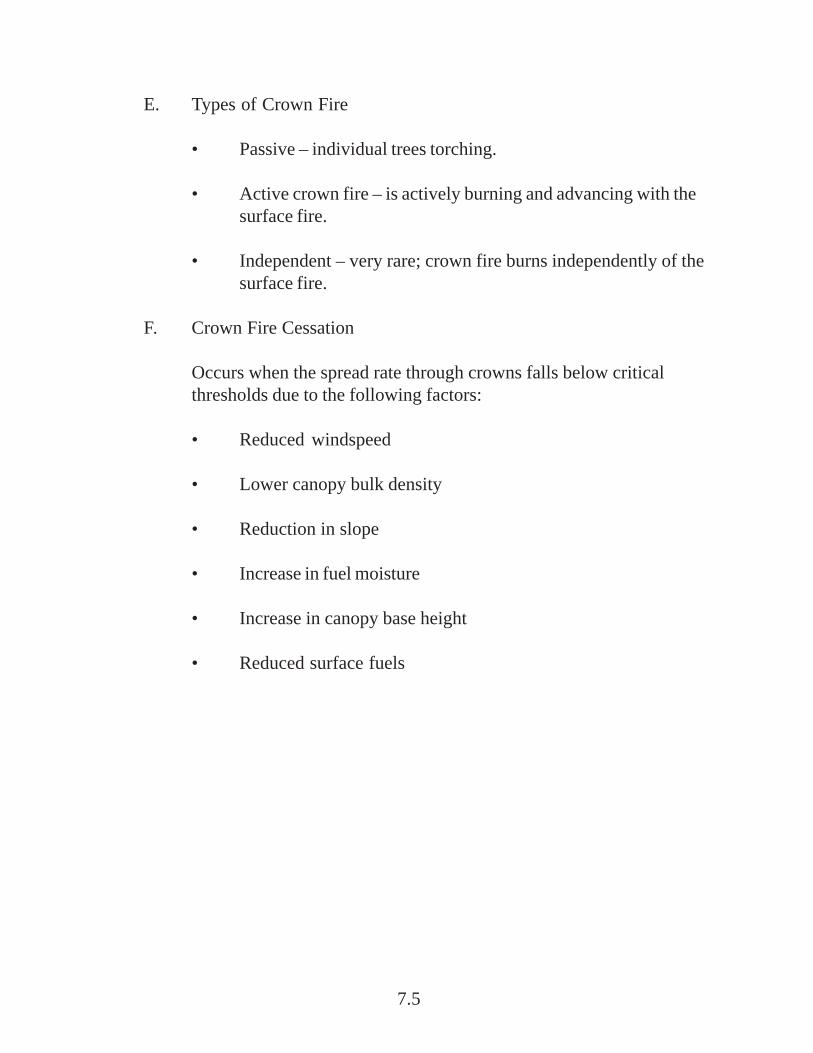
7.5
E. Types of Crown Fire
• Passive – individual trees torching.
• Active crown fire – is actively burning and advancing with thesurface fire.
• Independent – very rare; crown fire burns independently of thesurface fire.
F. Crown Fire Cessation
Occurs when the spread rate through crowns falls below criticalthresholds due to the following factors:
• Reduced windspeed
• Lower canopy bulk density
• Reduction in slope
• Increase in fuel moisture
• Increase in canopy base height
• Reduced surface fuels

7.6
II. CHARACTERISTICS OF PLUME DOMINATED FIRES
A. Description of Plume Domination
Plume domination occurs when the energy release of the fire is greatenough to overpower its environment.
• It is associated with relatively low windspeeds. The 20 footwindspeeds are usually less than 20 mph.
• Atmospheric conditions such as reverse wind profile can makethe atmosphere conducive to plume domination.
• A fire can change from wind driven to plume dominated andback again dependent on environmental conditions.
• Although plume domination is often mentioned, it is a very rareevent.
B. Characteristics of Plume Dominated Fires
• Strong convection column towering directly over the fire – notleaning over before the wind.
• Pyrocumulus cloud development over the fire – with nodownwind drift of the cloud.
• Very high intensity fire.

7.7
C. How Plume Dominated Fires Spread
There are at least two mechanisms for movement:
1. Momentum from the column – the column keeps building onitself, increasing intensity and spreading outwards.
2. Downburst of winds blowing outward near the ground from thebottom of a convection cell (pyrocumulus).
The spread of both of these can be extremely dangerous, fast moving,and erratic in direction.
III. REVERSE WIND PROFILE
The reverse wind profile is the occurrence of winds decreasing in speed inthe atmosphere as the altitude increases.
“A reverse wind profile allows a strong vertical column to develop directlyover the fire without being sheared away by winds aloft.”
– Richard C. Rothermel, 1991.
For the purpose of this class, reverse wind profile will be defined as:
Any weather pattern that results in the surface winds (or jet pointwinds) being higher than the winds aloft.
A. Necessary Wind Conditions
• Surface winds of approximately 10-24 mph.
• Jet point winds within 1,000 to 2,500 feet of the surface of 18-28mph.
• Lower wind speeds in the layers above these.

7.8
This can happen at various times. Some examples are:
• Pre or post cold front passage.
• In late afternoon or evening when winds start stabilizing from thesurface up.
• When thermal surface troughs develop.
1. Daytime
• Daytime – jet point within 100 feet of ground or missing(most dangerous, least common).
• This is the most dangerous, but the least common.
2. Late afternoon and night
• Jet point within 1,000 to 2,500 feet of fire.
• Second most dangerous, more frequent.
B. Reverse Wind Profile
Rare but potentially lethal.
• 1976 survey of 62 fires only showed this happening in 8% of thefires.
• Butte Fire – 73 shelter deployments.
• Mack Lake Fire – one fatality.
• 2002 in Colorado – this weather pattern was a frequentoccurrence that coincided with their largest fire season inhistory.

7.9
IV. PYROCUMULUS CLOUD DEVELOPMENT
Pyrocumulus is a cloud development over a fire that closely resembles thedevelopment of a thunder cell. The differentiation is the method of lifting.
A. Pyrocumulus
1. The heat of the fire produces the lifting for pyrocumulusdevelopment.
Normal cumulus development is caused by three processes:
• Orographic (terrain)
• Frontal (cold front moving under a warmer layer)
• Thermal (heat from the surface of the earth)
2. Any intense wildland fire can produce a pyrocumulus cloud.
3. Pyrocumulus development does not necessarily mean plumedomination.
4. Intense wind driven fires also produce pyrocumulus clouds
5. Wind driven pyrocumulus drift downwind of the fire.
B. Incipient Phase
Phase where heat from fire is building enough to produce a convectivecolumn and the beginning of a cloud is forming.
C. Pyrocumulus Building Thunder Cell (the mature stage)
More heat, larger convective column, continues inflow from bottomsand sides of the cloud/column.

7.10
D. Pyrocumulus / Thunder Cell Dissipation / Downdrafts
Downbursts from the mature and dissipating stages of a pyrocumuluscloud can be extremely dangerous.
Downbursts come from outflow from the bottom of the convectioncell and can have very strong winds. Winds such as these occurred onthe Dude Fire in 1990 when six firefighters were killed.
E. Pyrocumulus Dissipation
• Most intense wildland fires produce a pyrocumulus cloud.
• Most pyrocumulus clouds move with the wind away from thefire – wind driven.
• Most pyrocumulus clouds dissipate without the outflowaffecting the fire.
• For those that stay over the fire (plume dominated) then thedissipation can become a convection column collapse. This is avery dangerous event.

7.11
V. COLLAPSING CONVECTION COLUMN
One of the major hazards with a plume dominated fire is the collapse of theconvection column and its associated pyrocumulus cloud. Warning signs ofa potential convection column collapse:
• Rapid development of a strong convection column.
• Anvil head forming on the pyrocumulus.
• Virga or any precipitation.
• Calm created when inflow winds have subsided – outfow winds maysoon begin.
A. Column Collapse (extremely hazardous)
• Outflow of winds from dissipating column and pyrocumuluscell.
• The winds can be greater than 60 mph, and spread horizontallyat ground level – up and down hill.
• Topography can funnel these winds changing direction andincreasing the windspeed.
• Can cause unanticipated spotting of the fire.
• Contributed to six fatalities on the Dude fire in 1990.

7.12
B. Plume Reading
What do we see? What does it mean on the ground?
What to look for:
1. Smoke color
• Light = dead dry or light fuels
• Dark = live fuels
2. Smoke volume
• Light = low intensity
• Dense = high intensity
3. Drift smoke
• None = initial run, unstable air
• Vertical angle = wind driven, direction of spread
4. Column height
• High = high intensity, possible plume domination,pyrocumulus
• Moderate = new run, moderate intensity
• Low = low intensity, light fuels
Identify what the smoke plumes are telling you.

7.13
PLUME READING EXERCISE.
Record the plume description for each photo.
PLUME #1 DESCRIPTION:
Division fire in 1996 from 25-30 miles away in Jackpot, Nevada. Shows both thewind driven convection column and the building pyrocumulus at higher altitude.This is about one hour prior to it becoming plume dominated. Fuels burning werepinyon-juniper and sagebrush.
Smoke Color:
Smoke Volume:
Drift Smoke:
Column Height:
Pyrocumulus:
PLUME #2 DESCRIPTION:
Picture from West Yellowstone during 1988, showing the pyrocumulus buildupduring a wind driven event.
Smoke Color:
Smoke Volume:
Drift Smoke:
Column Height:
Pyrocumulus:

7.14
PLUME #3 DESCRIPTION:
From the angle of the sunlight and shaded ridge, it is late afternoon; just when theatmosphere starts to stabilize and winds aloft start dying down. Also, the threeprominent puffs of cumulus are normal parts of any strong convection column.The frequency of their puffing is predictable and part of the fluid dynamics of thecloud.
Smoke Color:
Smoke Volume:
Drift Smoke:
Column Height:
Pyrocumulus:
PLUME #4 DESCRIPTION:
Sagebrush and grass on the lower slopes transitioning to pinyon-juniper on theupper slopes.
Smoke Color:
Smoke Volume:
Drift Smoke:
Column Height:
Pyrocumulus:

7.15
PLUME #5 DESCRIPTION:
From the angle (too close to the fire) cannot tell if it is plume dominated or not, ithas the potential. It looks like updrafts are causing the interesting smoke. The partof the column towards the top and sides of the image are curling back into thestrong updraft in the center. This is a normal fluid dynamics feature of fires with astrong convection column.
Smoke Color:
Smoke Volume:
Drift Smoke:
Column Height:
Pyrocumulus:
PLUME #6 DESCRIPTION:
Cerro Grande fire in 2000. A good illustration of the high winds that effected firegrowth.
Smoke Color:
Smoke Volume:
Drift Smoke:
Column Height:
Pyrocumulus:

7.16
PLUME #7 DESCRIPTION:
Clear Creek Complex in Montana in 2000.
Smoke Color:
Smoke Volume:
Drift Smoke:
Column Height:
Pyrocumulus:
PLUME #8 DESCRIPTION:
South Cricket Complex in Nevada in 2000. Fire activity is just picking up as theinversion is starting to break up. Smoke column is building a couple of thousandfeet then hitting the remaining inversion layer and rolling back down. Theatmosphere is still stable.
Smoke Color:
Smoke Volume:
Drift Smoke:
Column Height:
Pyrocumulus:

8.1
Introduction to Wildland Fire Behavior Calculations, S-390
Unit 8 – Documentation, Briefings, and Monitoring for Fireline Safety
OBJECTIVES:
Upon completion of this unit, students will be able to:
1. Identify weather, fire behavior, and fuels information requiringdocumentation.
2. Identify critical environmental and fire factors for monitoring.
3. Identify fireline briefing needs.

8.2

8.3
I. INTRODUCTION
Accurately recording fire behavior and fire weather are critical factors informulating safe and effective operation plans on wildland fire incidents.
Fireline briefings must include these critical factors to be effective and toprovide for firefighter safety.
There are four Fire Orders based on this critical information:
• Keep informed on fire weather conditions and forecasts.
• Know what the fire is doing at all times.
• Base all actions on current and expected behavior of the fire.
• Identify escape routes and safety zones, and make them known.
II. CRITICAL OBSERVATIONS
A. Critical Weather Observations
• Temperature – wet and dry bulb
• Relative humidity
• Dew point
• Wind speed and direction
• Cloud type and cloud cover

8.4
B. Critical Fire Behavior/Fuels Observations
• Flame length
• Rate of Spread
• Current fuel model
• Fuel model in areas of concern
• Continuity of fuels
• Freezekill and insect/disease areas
C. Critical Topographic Observations
• Aspect
• Slope
• Special features such as:
– Chimneys– Chutes– Saddles
D. Documentation Forms
• Fire Weather Observer’s Record
• Spot Weather Forecast
E. Fire Behavior/Topographic Documentation
• Use your notepad, map, and Unit Log.
• Make sure your observations are written down.

8.5
F. Fire Behavior Calculation Documentation
Use your Fire Behavior worksheet to document the expected:
• Rate of Spread
• Direction of Spread
• Flame Length
• Probability of Ignition
• Spotting Distance
III. FIRELINE MONITORING NEEDS
Specifics will vary from region to region and between fuel types. The basicsare:
• Fire Weather – take the weather hourly or as it changes.
• Fire Behavior – record what the fire is doing through the day – whendoes it change?
Why monitor?
• Changes in weather often occur before the fire behavior changes.
• Changes in fire behavior often necessitate changes in tactics.
• Re-evaluate and reassess strategies and tactics based on thesechanges.
• Firefighter safety requires constant monitoring of environmental andfire behavior factors.

8.6
IV. FIRELINE BRIEFING NEEDS
A. Spot Weather Forecast
Fire Order #1 – Keep informed of fire weather conditions andforecasts.
B. Safety Zone Calculations
Fire Order #4 – Identify escape routes and safety zones and makethem known.
C. Basic Fire Behavior Calculations
1. Flame length
2. Rate of spread
3. Probability of ignition
4. Spotting distances
Fire Order # 2 – Know what your fire is doing at all times.
Fire Order # 3 – Base all actions on current and expectedbehavior of the fire.

8.7
V. ELEMENTS OF A FIRELINE BRIEFING
• Current and expected weather
• Fuels and terrain
• Observed fire behavior
• Predicted fire behavior
– Rate of spread
– Flame length
– Probability of ignition
– Spotting distance
• Areas of highest concern
• Safety concerns
– Safety zones
– Fire behavior driven tactics

8.8

9.1
Introduction to Wildland Fire Behavior Calculations, S-390
Unit 9 – Final Group Exercise
OBJECTIVES:
Upon completion of this unit, students will be able to:
1. Prepare basic fire behavior calculations given basic information.
2. Give a basic fireline briefing.

9.2

9.3
Final Group Exercise
Instructions:
Refer to the Fireline Briefing Checklist on page 9.5. Everyone will present a briefingbased on this checklist.
There will be four groups. Each group is responsible for completing theworksheets and presenting a briefing to the class and instructors on each part oftheir assigned exercise.
The elements of the briefing will include:
• Current and Expected Weather
• Fuels and Terrain
• Observed Fire Behavior
• Predicted Fire Behavior which includes:
– Rate of Spread– Direction of Spread– Flame Length– Probability of Ignition– Spotting Distance
• Areas of Highest Concern
• Safety Concerns which includes:
– Safety Zones includes Safety Zone size
– Fire Behavior Driven Tactics
• Map showing point source projections and safety zones

9.4
Grading/Points:
Each student must participate in the briefing for the group to receive all possiblepoints.
• 3 points for a completed documentation package:
– Current and expected fire behavior (½ point)– Current and expected weather conditions (½ point)– Safety issues (½ point)– Strategy and tactics (½ point)– Your point source prediction plotted correctly on the map (1 point)
• 2 points for the presentation:
– If all the basic information is covered, you receive 2 points. Everyone inthe group needs to participate. The entire group will lose 1 point foreach person not participating in either Part 1 or Part 2 Briefing.
Part 1
After receiving Part 1, you will have approximately 40 minutes to complete yourdocumentation package. You will then have 5 minutes to “Brief” the resources onscene.
Part 2
After receiving Part 2, you will have approximately 40 minutes to complete yourdocumentation package. You will then have 5 minutes to “Brief” the resources onscene.
Each group needs to fill out a “Spot Weather Forecast Request.” As soon as it isturned in to the mentoring instructor or the meteorologist, you will receive the actualspot weather forecast.
9.5
Fireline Briefing Checklist
• Fire behavior forecast or notes
• Fire weather forecast or notes
• IAP if available
• Map of the area(s) to be discussed (if available)* Big enough for your audience to read
1. Don’t read directly off the forecasts, discuss only the highlights.
2. Be brief but concise.
3. Emphasize any areas of concern:* Fireline safety* Fire behavior* Weather conditions* Topographic influences
4. Use the map to correlate discussion points.
5. Be ready to answer questions or discuss concerns.
6. Don’t guess! If you don’t know just say so!
09-01-S390-SR

9.6