introduction to university tech transfer fall 2013 @columbia_tech columbia technology ventures ...
TRANSCRIPT
Introduction to University Tech TransferFall 2013
@Columbia_Tech
Columbia Technology Ventures
Columbia Technology Ventures
www.techventures.columbia.edu

2
What Is Academic Tech Transfer?
Academic research
Practical applications
Benefit society on a local, national and global basis

3
Beware the Valley of Death
“Somewhere between invention and commercialization, there’s a desolate
place where new technologies go to die alone. It’s called the Valley of Death,
and it’s littered with the decaying corpses of technologies that never get
to realize their potential. Too many technologies will be left to rot on the
lonely, dusty road.”

4
What is “The Valley of Death”
Commercial value
Government & Foundation Grants
Industry & VC Funding
EarlyFeasibility
StudiesBasic
Research
Technical Validation
& Prototyping
Product Development,Marketing, and
SalesEarly MarketTesting
The Valley
5
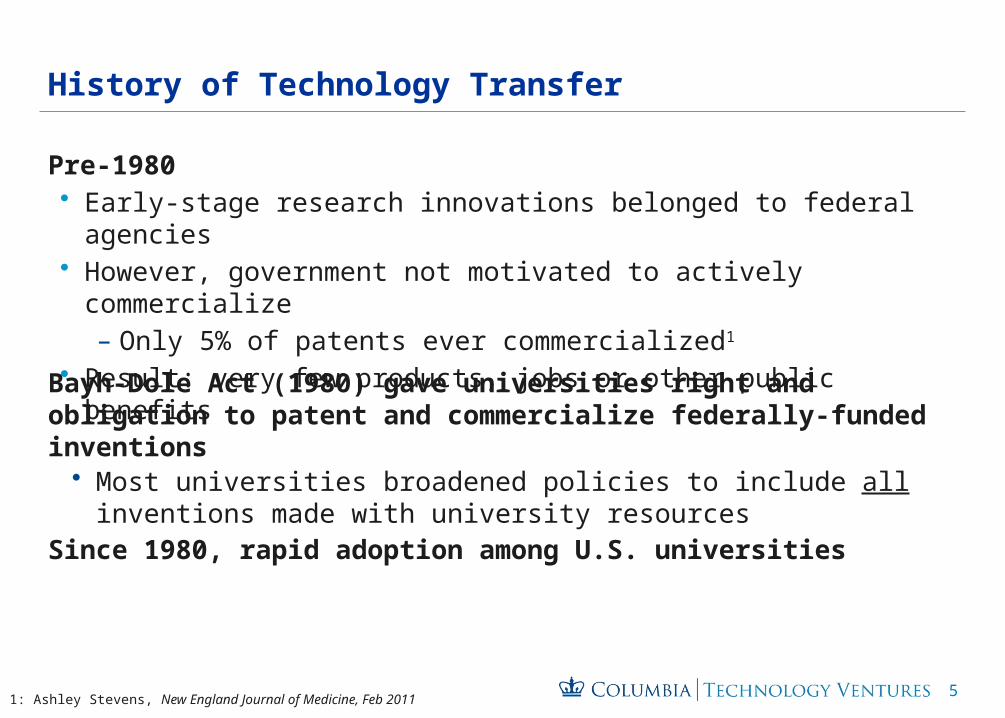
Pre-1980• Early-stage research innovations belonged to federal agencies• However, government not motivated to actively commercialize
– Only 5% of patents ever commercialized1
• Result: very few products, jobs or other public benefits
History of Technology Transfer
Bayh-Dole Act (1980) gave universities right and obligation to patent and commercialize federally-funded inventions
• Most universities broadened policies to include all inventions made with university resources
Since 1980, rapid adoption among U.S. universities
1: Ashley Stevens, New England Journal of Medicine, Feb 2011
6
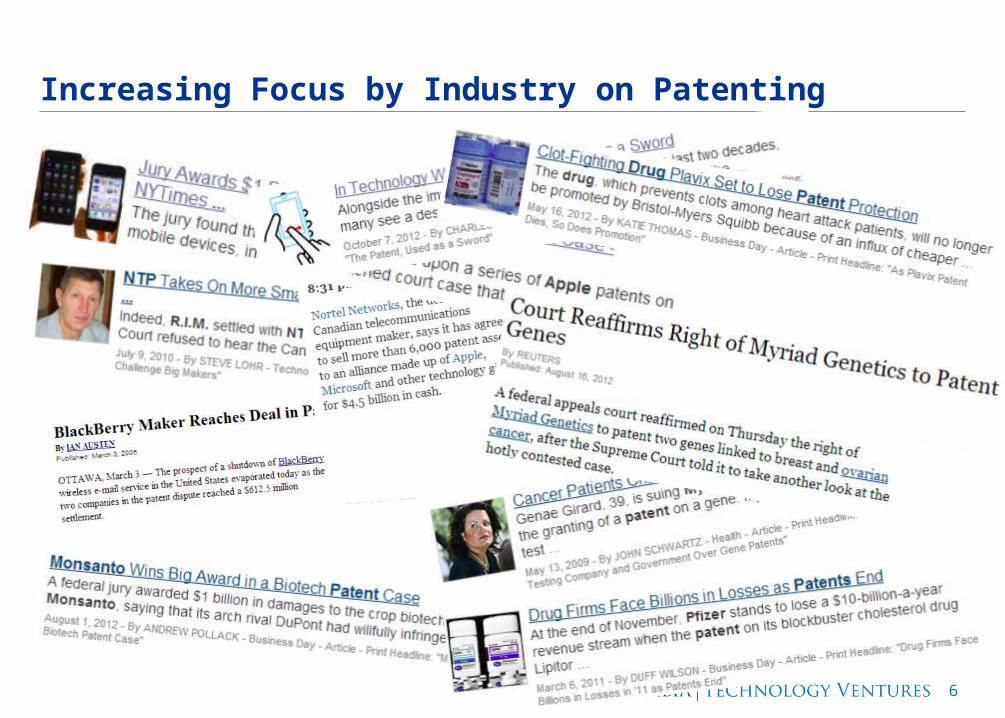
Increasing Focus by Industry on Patenting

7
300% Increase in Overall Patent Applications Since 1990
1990
1992
1994
1996
1998
2000
2002
2004
2006
2008
2010
0
100,000
200,000
300,000
400,000
500,000
600,000
Patent AppsPatent Awards
USPTO Activity, 1990 - 2011
8
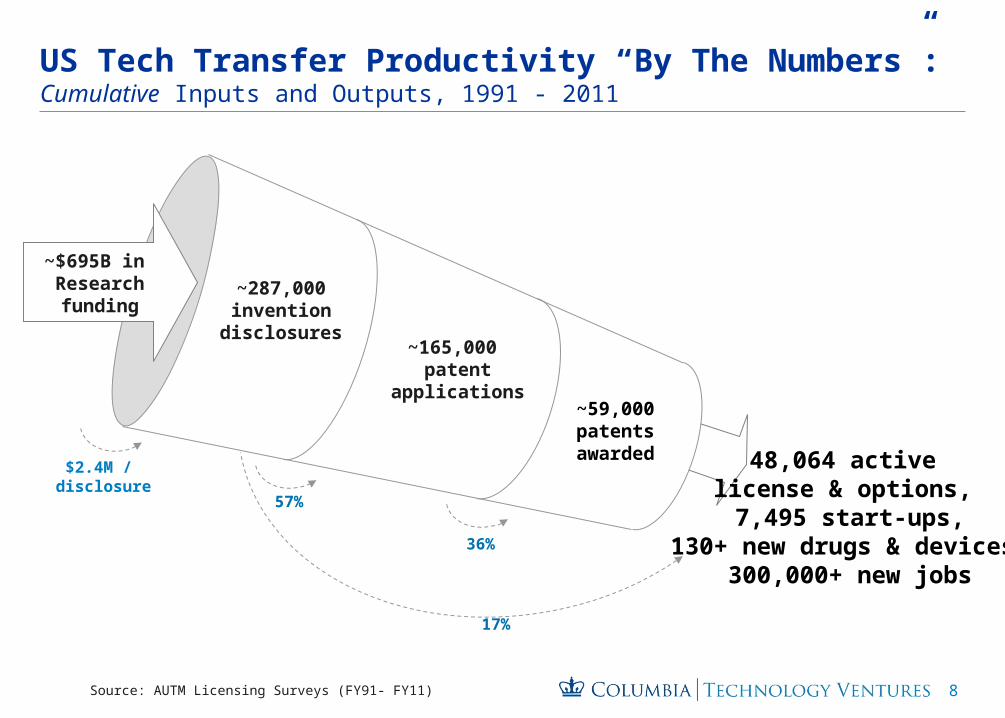
US Tech Transfer Productivity “By The Numbers”:Cumulative Inputs and Outputs, 1991 - 2011
~$695B in Researchfunding
Source: AUTM Licensing Surveys (FY91- FY11)
~165,000 patent
applications~59,000patentsawarded
57%
36%
~287,000invention
disclosures
$2.4M / disclosure
48,064 active license & options,
7,495 start-ups,130+ new drugs & devices,
300,000+ new jobs
17%
9
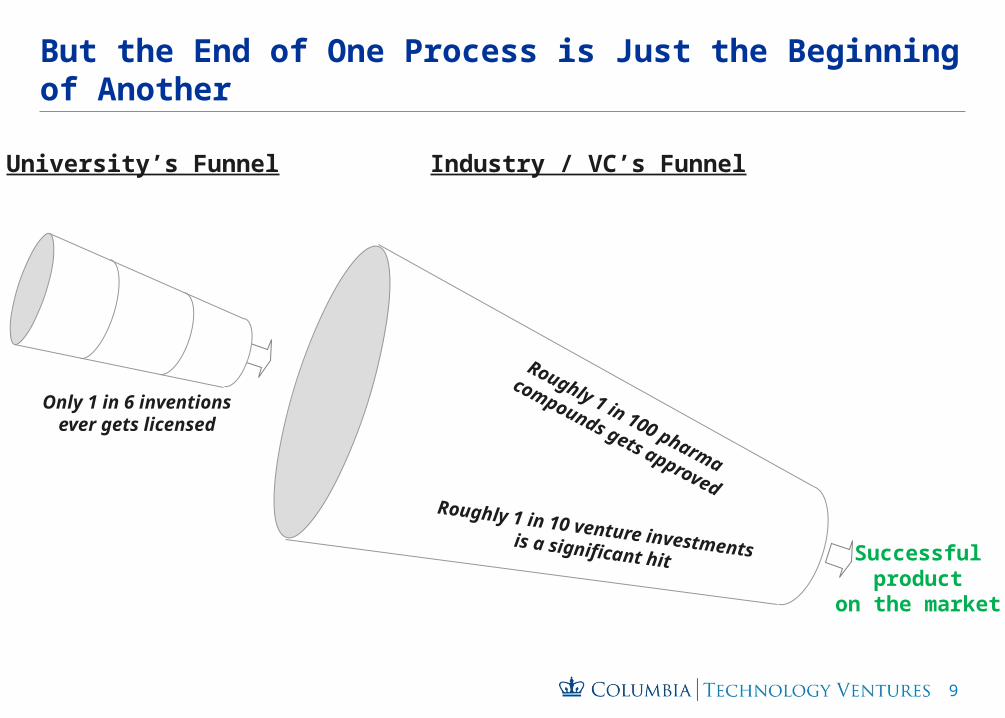
But the End of One Process is Just the Beginning of Another
Only 1 in 6 inventionsever gets licensed
Roughly 1 in 100 pharma
compounds gets approvedRoughly 1 in 10 venture investmentsis a significant hit
University’s Funnel Industry / VC’s Funnel
Successfulproduct
on the market
10
$0
$50
$100
$150
$200
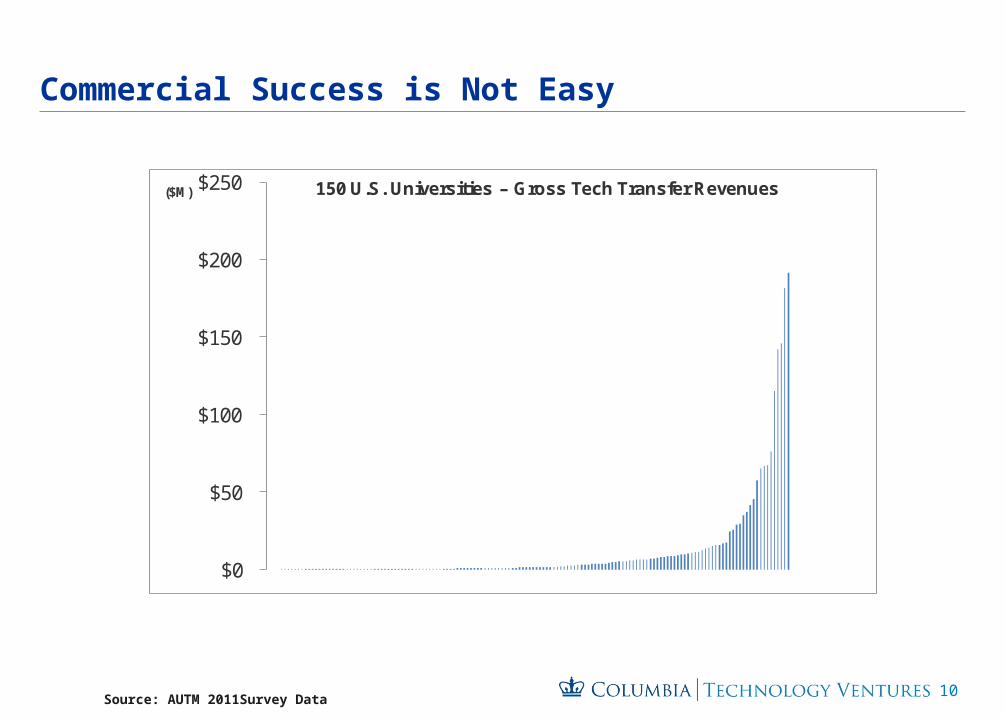
$250 ($M) 150 U.S. Universities – Gross Tech Transfer Revenues
Commercial Success is Not Easy
Source: AUTM 2011Survey Data
Columbia

11
Who Else Does Well, Commercially?
(FY2011)Name of Institution
License Income
($M)
Research Expenditures
($M)Invention
Disclosures
Northwestern $192 $484 195Univ. of California System $182 $5,419 1581Columbia $146 $714 335New York Univ. $142 $431 167Princeton $115 $193 84MIT $76 $1,490 603U Washington $67 $967 356Stanford $67 $806* 504University of Texas System $65 $2,547 719UW-Madison/WARF $58 $1,112 357
Source: AUTM 2011 data except * AUTM 2010 data
12
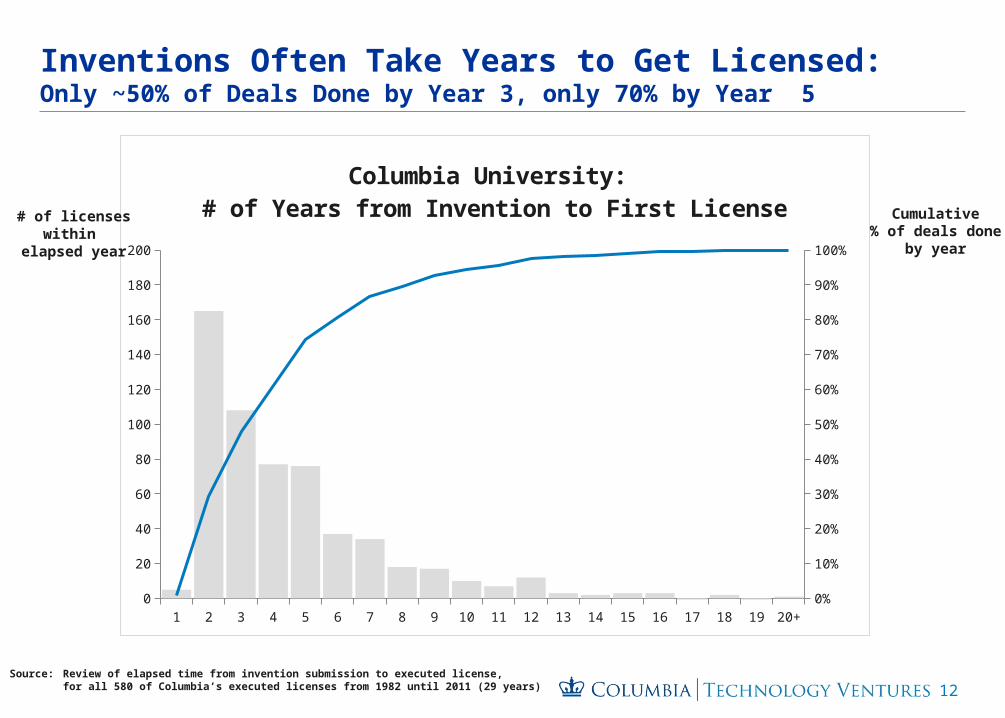
Inventions Often Take Years to Get Licensed:Only ~50% of Deals Done by Year 3, only 70% by Year 5
1 2 3 4 5 6 7 8 9 10 11 12 13 14 15 16 17 18 19 20+0
20
40
60
80
100
120
140
160
180
200
0%
10%
20%
30%
40%
50%
60%
70%
80%
90%
100%
Columbia University: # of Years from Invention to First License
# of licenseswithin
elapsed year
Cumulative% of deals done
by year
Source: Review of elapsed time from invention submission to executed license, for all 580 of Columbia’s executed licenses from 1982 until 2011 (29 years)
13
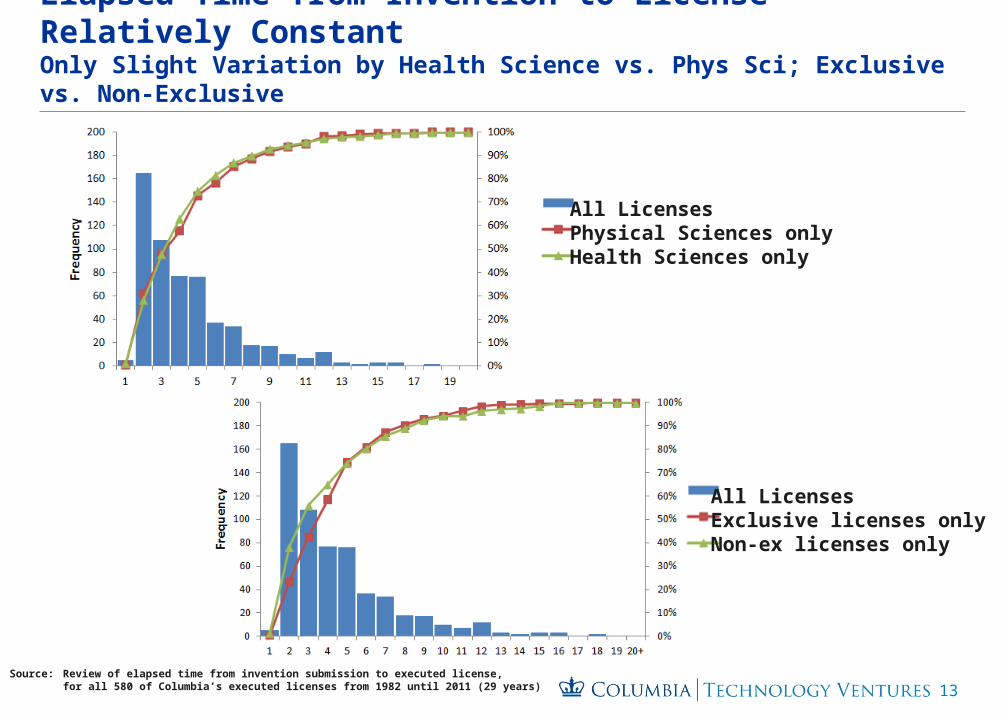
Elapsed Time from Invention to License Relatively ConstantOnly Slight Variation by Health Science vs. Phys Sci; Exclusive vs. Non-Exclusive
Source: Review of elapsed time from invention submission to executed license, for all 580 of Columbia’s executed licenses from 1982 until 2011 (29 years)
All LicensesPhysical Sciences onlyHealth Sciences only
All LicensesExclusive licenses onlyNon-ex licenses only

14
Columbia’s Experience Mirrors that of Other Institutions
National Cancer Institute’s Licenses# of Years from Patent Filing to License (1995 – 2009)
15
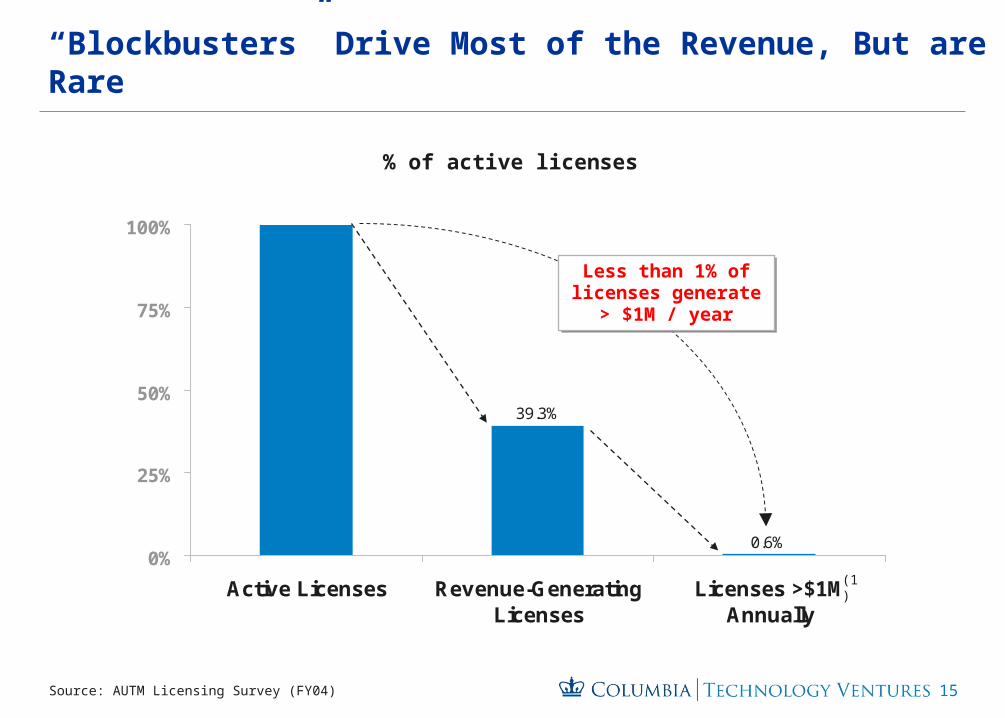
“Blockbusters” Drive Most of the Revenue, But are Rare
% of active licenses
0.6%
39.3%
0%
25%
50%
75%
100%
Active Licenses Revenue-GeneratingLicenses
Licenses >$1MAnnually
Less than 1% of licenses generate >
$1M / year
Less than 1% of licenses generate >
$1M / year
Source: AUTM Licensing Survey (FY04)
(1)

16
And “Big Winners” Take Many Years To Develop ... And Aren’t Always Obvious at the Time
Columbia’s Four Biggest Revenue Producers(Revenue per Year)

1717 CONFIDENTIAL
Additionally, Patent Costs are Large and Incurred Early
Source: Columbia University, Patent & Licensing Group
18
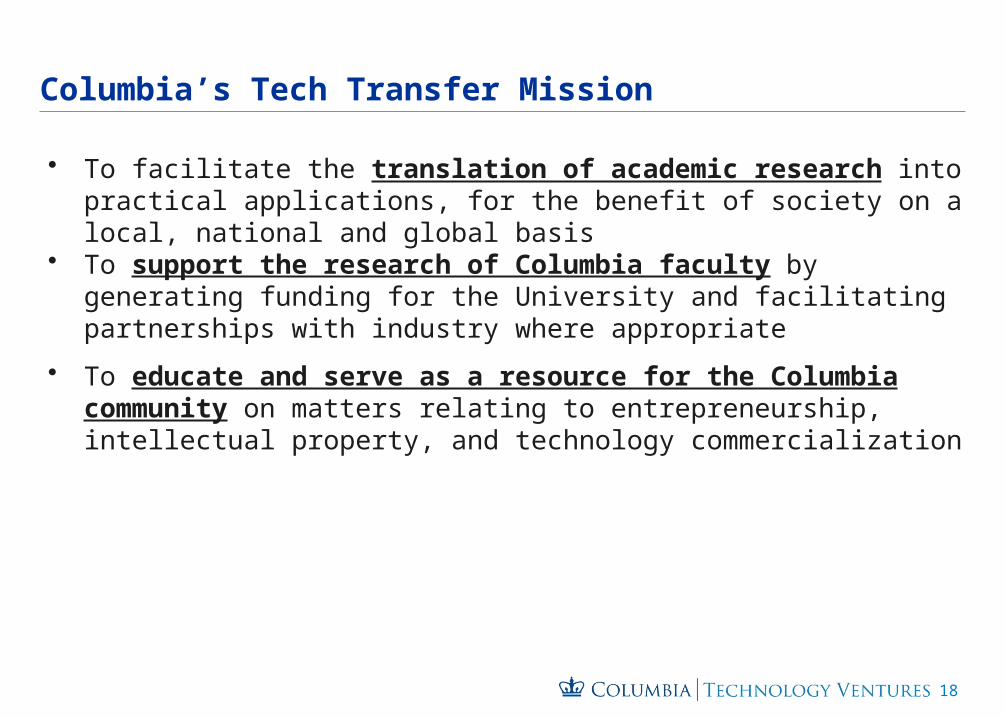
Columbia’s Tech Transfer Mission
• To facilitate the translation of academic research into practical applications, for the benefit of society on a local, national and global basis
• To support the research of Columbia faculty by generating funding for the University and facilitating partnerships with industry where appropriate
• To educate and serve as a resource for the Columbia community on matters relating to entrepreneurship, intellectual property, and technology commercialization

19
Columbia Technology Ventures Key MetricsFY08 – FY13
2008 2009 2010 2011 2012 20130
50
100
150
200
250
300
350
400
Inventions
2008 2009 2010 2011 2012 20130
102030405060708090
100
Licenses & Options
2008 2009 2010 2011 2012 201302468
1012141618
Start-ups
+24% vs. 2008 +68% vs. 2008
+60% vs. 2008

20
Columbia Technology VenturesAnnual Activity Metrics
Columbia Technology
Ventures
~350 new inventions from University research
~70 licenses & options
~15 start-up companies
~$140M in gross IP revenues

21
Wait, Does the University Own Student Inventions?http://bit.ly/TDZoiy

22
Good Start… But Lots More to Do!
~400 technologiesare currently
licensed
But ~1400 technologies
are still available!
Source: CTV database, Fall 2013
23
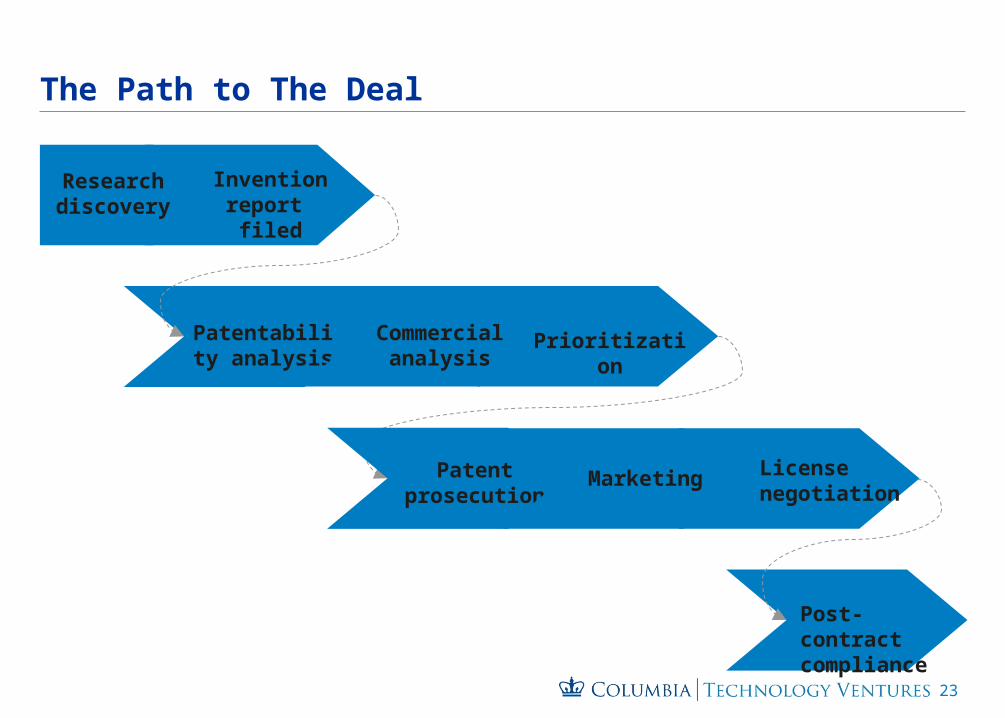
The Path to The Deal
Researchdiscovery
Invention report
filed
Patentprosecution
Marketing License negotiation
Patentability analysis
Commercial analysis
Prioritization
Post-contractcompliance
24
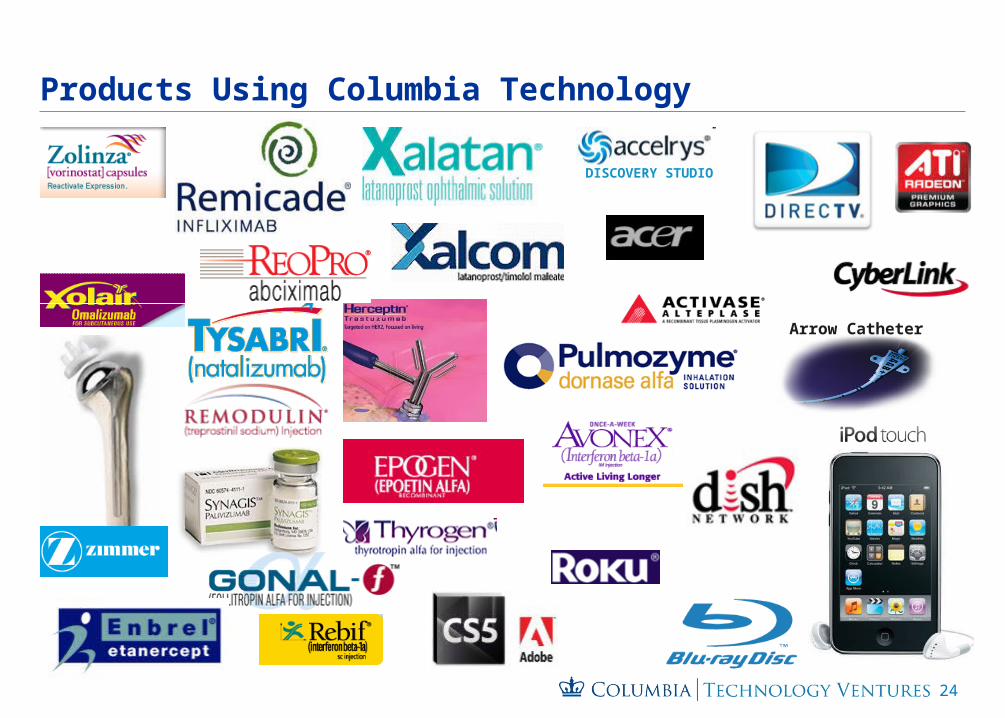
Products Using Columbia Technology
Arrow Catheter
DISCOVERY STUDIO
25
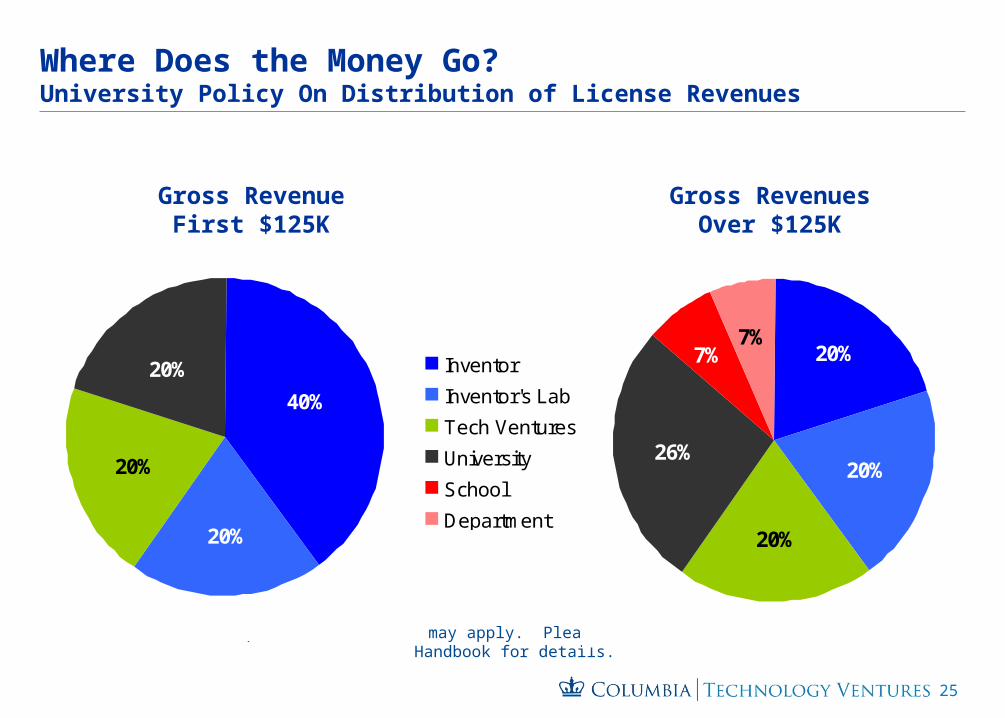
Where Does the Money Go?University Policy On Distribution of License Revenues
Gross RevenueFirst $125K
Gross RevenuesOver $125K
20%
20%
20%
26%
7%7%Inventor
Inventor's Lab
Tech Ventures
University
School
Department
40%
20%
20%
20%20%
20%
20%
26%
7%7%
Note: Certain caps and deductions may apply. Please refer to Appendix D of the Faculty Handbook for details.
26
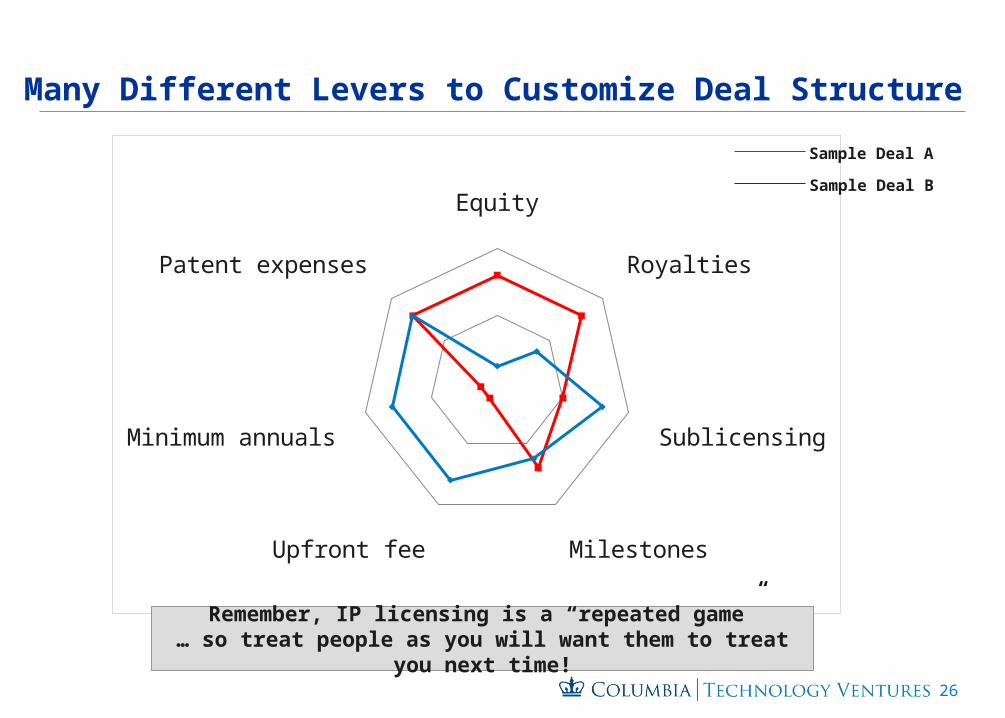
Many Different Levers to Customize Deal Structure
Equity
Royalties
Sublicensing
MilestonesUpfront fee
Minimum annuals
Patent expenses
Sample Deal A
Sample Deal B
Remember, IP licensing is a “repeated game”… so treat people as you will want them to treat you next time!
27
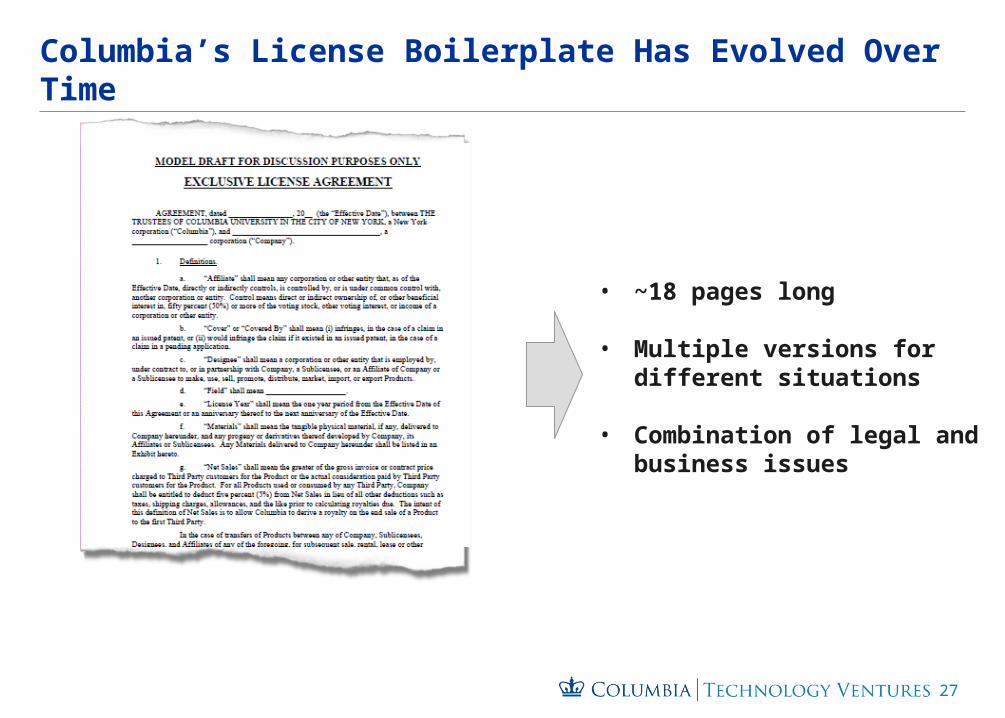
Columbia’s License Boilerplate Has Evolved Over Time
• ~18 pages long
• Multiple versions for different situations
• Combination of legal and business issues

28
150+ Startups Spun Out of Columbia in 20 YearsOf those, 90+ still active, 40+ VC-backed, 9 gone public, 18 acquired
System Management ARTS (SMARTS)
Health Analytics Communications
Cybersecurity & Corporate Computing
Cleantech
Media & Fashion
Pharma & Devices
29
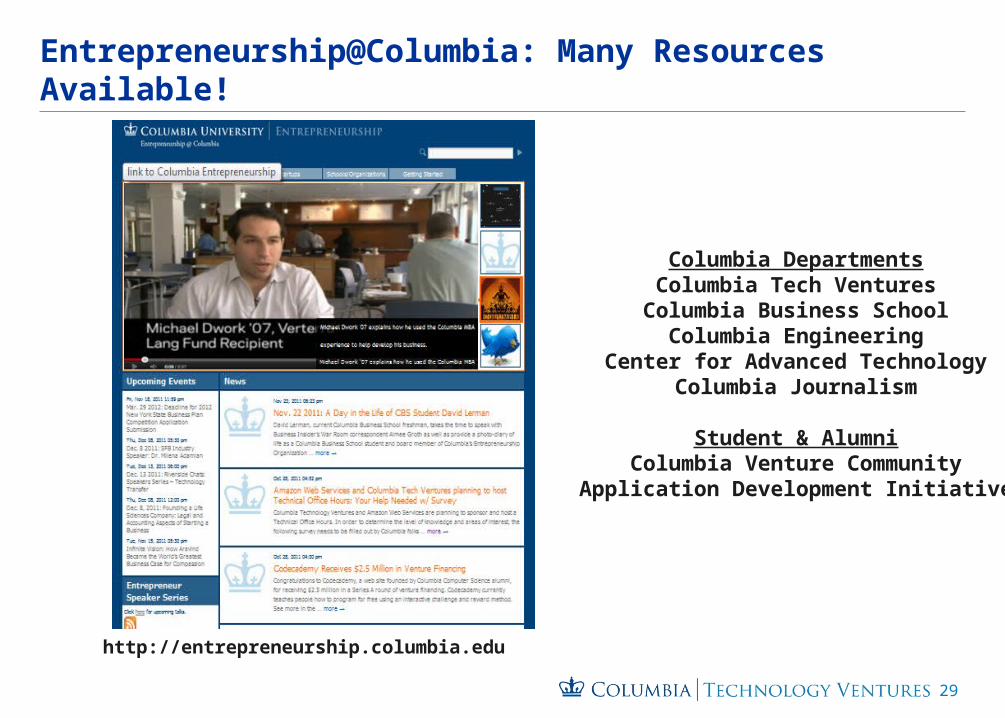
Entrepreneurship@Columbia: Many Resources Available!
Columbia DepartmentsColumbia Tech Ventures
Columbia Business SchoolColumbia Engineering
Center for Advanced TechnologyColumbia Journalism
Student & AlumniColumbia Venture Community
Application Development Initiative
http://entrepreneurship.columbia.edu
30
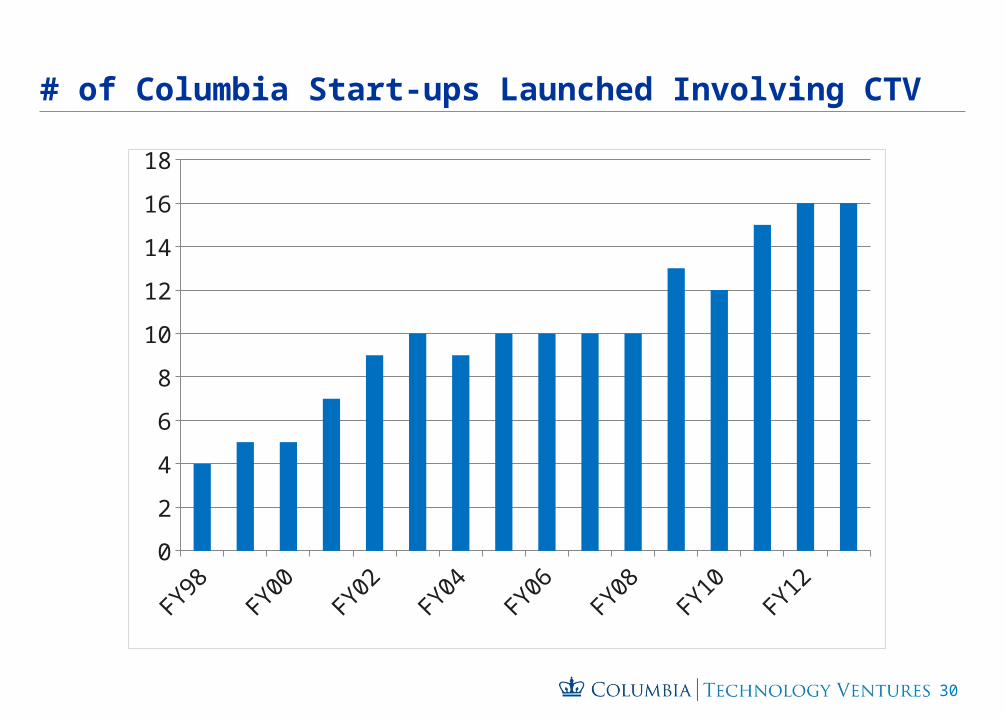
# of Columbia Start-ups Launched Involving CTV
FY98FY99
FY00FY01
FY02FY03
FY04FY05
FY06FY07
FY08FY09
FY10FY11
FY12FY13
0
2
4
6
8
10
12
14
16
18

31
Thank you!@Columbia_Tech
Columbia Technology Ventures
Columbia Technology Ventures
http://techventures.columbia.edu