introduction to structure 1.2
TRANSCRIPT
Clarity Trading Structural Analytics
Clarity Trading
Introduction to Vibration &
Structure

Clarity Trading Structural Analytics
Markets can be thought of as waves moving through a medium.

Clarity Trading Structural Analytics
Market complexity arises because
no wave is an isolated phenomenon.

Clarity Trading Structural Analytics
Market complexity arises because No wave is an isolated phenomenon.
All waves are composites of smaller aggregated Waves
Clarity Trading Structural Analytics
1
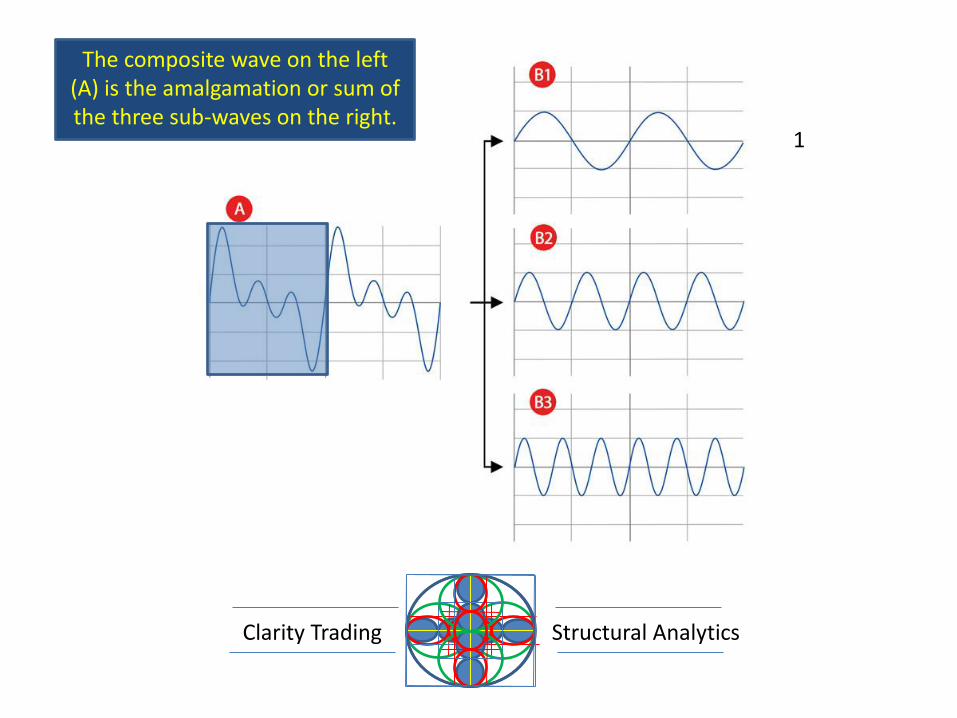
The composite wave on the left (A) is the amalgamation or sum of the three sub-waves on the right.

Clarity Trading Structural Analytics
1
The composite Wave on the left (A) is the amalgamation or sum of the three sub-waves on the right.
Wave B1 has one full wave in a distinct period.

Clarity Trading Structural Analytics
1
2
Wave B2 has two full waves in the same period as wave B1 has one full
wave.

Clarity Trading Structural Analytics
1
2
Wave B1 and B2 are octaves of
each other. They have a 1:2
relationship.
If B1 were a musical note, say
middle C on a piano, then B2 would be the next higher C
note, one octave up the keyboard.
Clarity Trading Structural Analytics
1
2
4
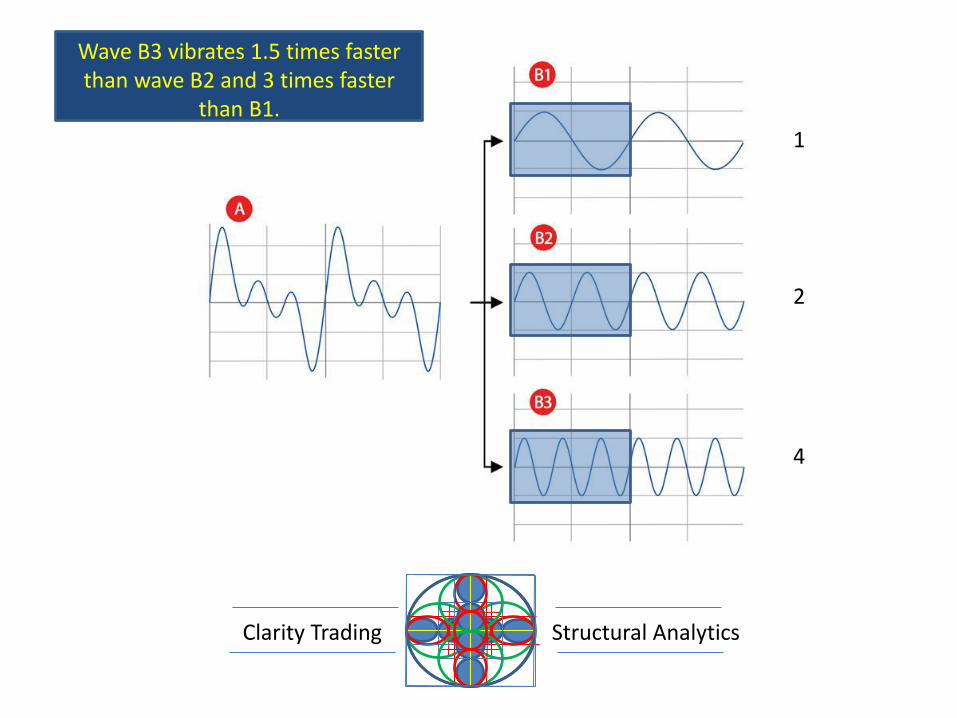
Wave B3 vibrates 1.5 times faster than wave B2 and 3 times faster
than B1.

Clarity Trading Structural Analytics
1
2
4
If B1 were middle C, then B3 would be the G note in the next octave
above middle C.

Clarity Trading Structural Analytics
1
2
4
Wave A is the composite of the three octave set of B waves. Wave
A is the wave form of the summation of waves B1, B2 and B3.

Clarity Trading Structural Analytics
Employing the summation concept, it is possible to see the influence of the component waves in market price charts.

Clarity Trading Structural Analytics
Another useful way of looking at component
waves is braiding.

Clarity Trading Structural Analytics
Instead of summing the component waves like in the
previous example, the component waves are woven or braided around each other
Clarity Trading Structural Analytics
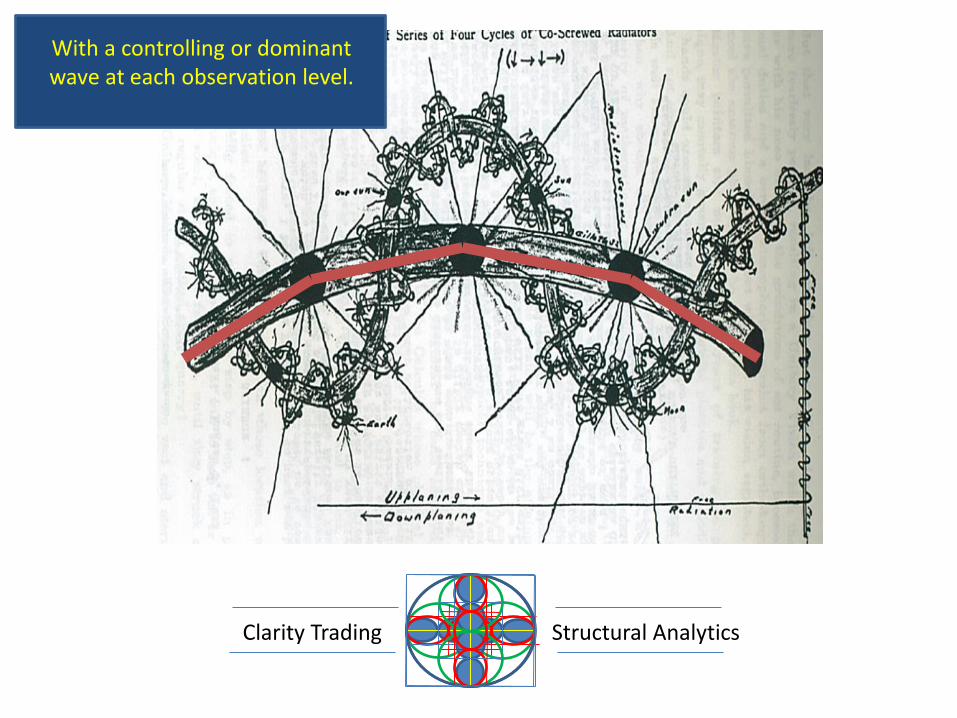
With a controlling or dominant wave at each observation level.

Clarity Trading Structural Analytics
around which the shorter, higher frequencies
braid or wrap.
Clarity Trading Structural Analytics
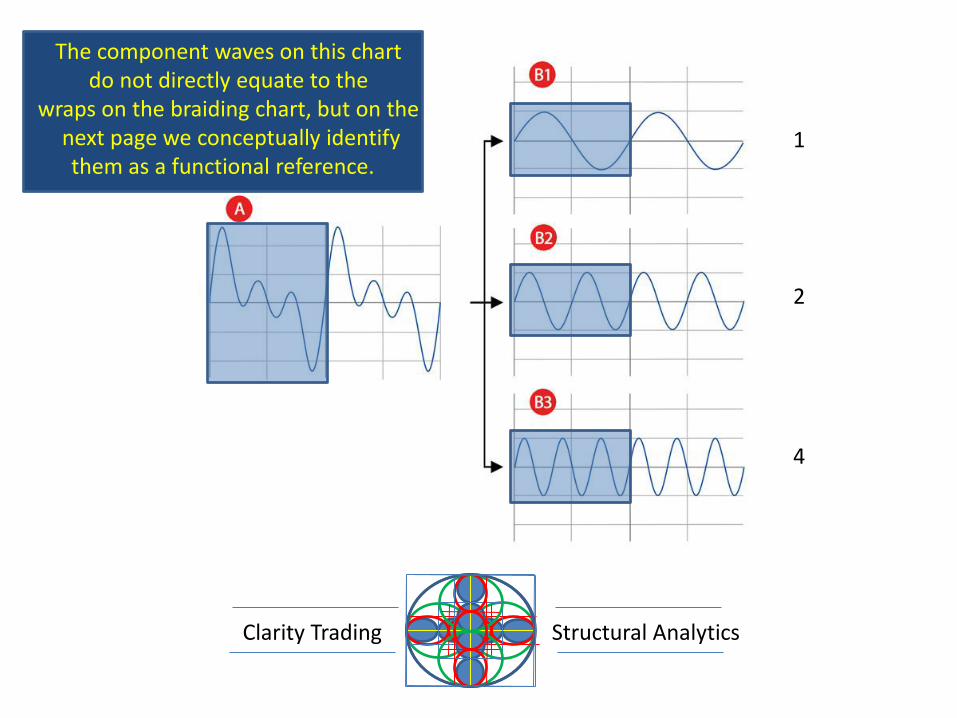
The component waves on this chart do not directly equate to the
wraps on the braiding chart, but on the next page we conceptually identify them as a functional reference.
1
2
4

Clarity Trading Structural Analytics
B1, the longest wave on the composite chart, would be the
longest wave on this chart.
B1
Clarity Trading Structural Analytics
B1
B2
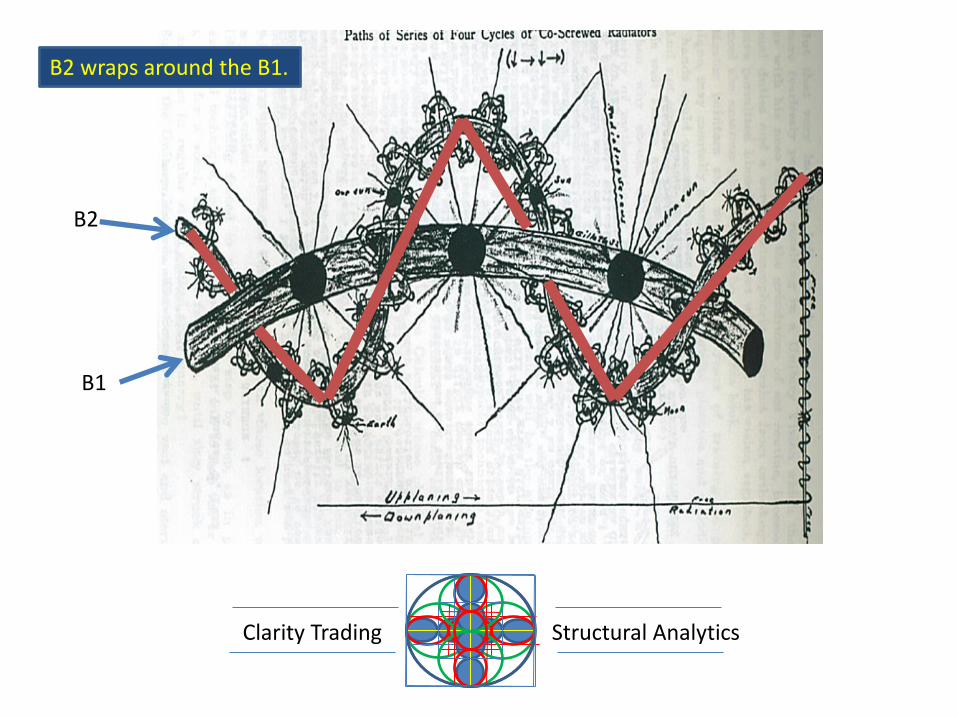
B2 wraps around the B1.

Clarity Trading Structural Analytics
B1
B2
B3
And B3 wraps around B2.

Clarity Trading Structural Analytics
Embedded harmonic
structures, like the composite waves we have been studying,
are seen throughout
nature, from the smallest to the largest scales. All embedded
and intertwined.

Clarity Trading Structural Analytics
This is a refraction
photograph of an atomic structure.
Note it is a
single snap shot in time.
Markets are successive
snapshots over multiple time
windows.

Clarity Trading Structural Analytics
The same nested,
embedded structure is
found everywhere
in the universe.
This is
Kepler’s model of the solar system.

Clarity Trading Structural Analytics
Again, note this is a single snap shot in
time.
What would this structure
look like photographed in successive
time snapshots?
Clarity Trading Structural Analytics
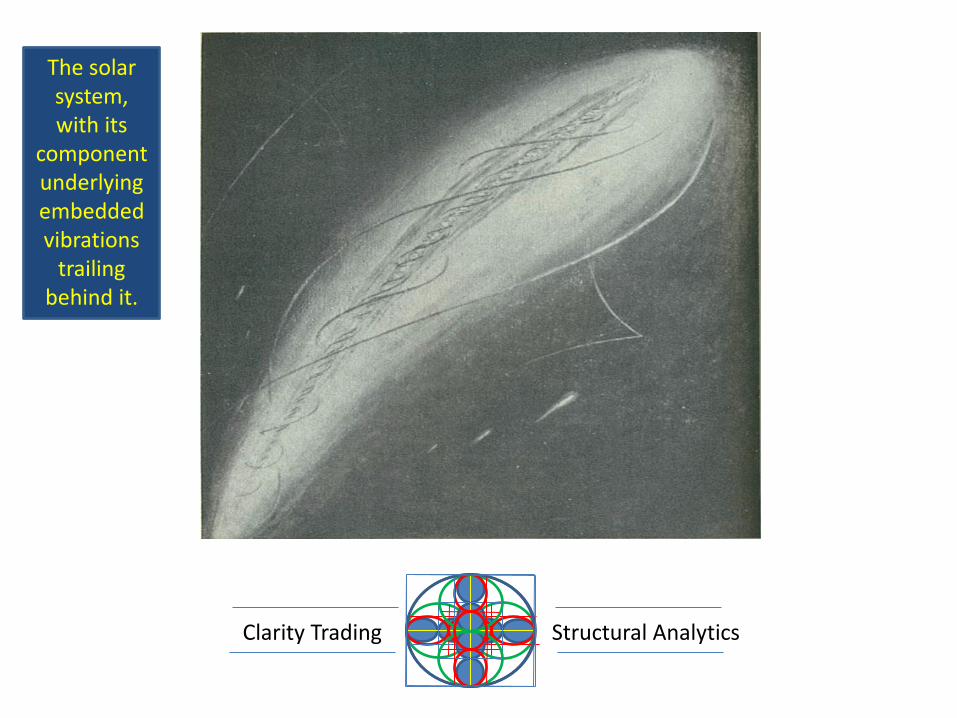
The solar system, with its
component underlying embedded vibrations
trailing behind it.
Clarity Trading Structural Analytics
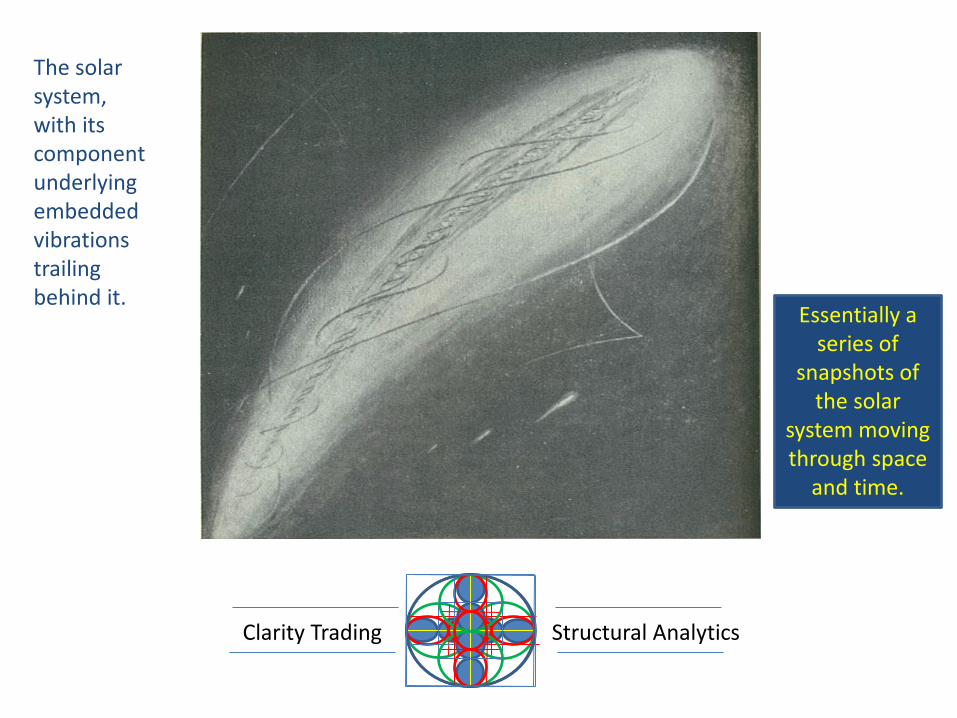
The solar system, with its component underlying embedded vibrations trailing behind it.
Essentially a series of
snapshots of the solar
system moving through space
and time.

Clarity Trading Structural Analytics
The primary difference
between the previous
picture of the solar system moving through
space / time and this chart….

Clarity Trading Structural Analytics
The primary difference between the previous picture of the solar system moving through space and time and this chart….
…is scale and simplicity.
This chart is a tight shot of only three underlying
components taken at a very close
range.

Clarity Trading Structural Analytics
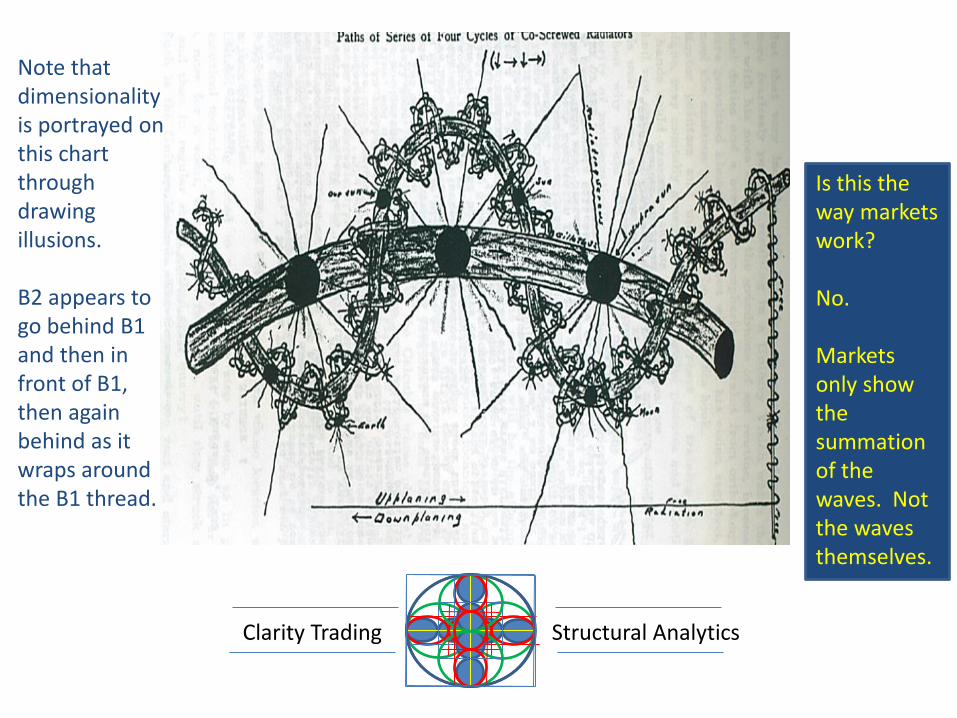
Note that dimensionality is portrayed on
this chart through drawing illusions.
B2 appears to go behind B1 and then in front of B1, then again behind as it
wraps around the B1 thread.
Clarity Trading Structural Analytics
Note that dimensionality is portrayed on this chart through drawing illusions. B2 appears to go behind B1 and then in front of B1, then again behind as it wraps around the B1 thread.
Is this the way markets work? No. Markets only show the summation of the waves. Not the waves themselves.

Clarity Trading Structural Analytics
At any given point a price is agreed to by a buyer and a seller. That price point represents all the energies of all the buyers and sellers in the world. That price
point represents the summation of all energies at that instant.

Clarity Trading Structural Analytics
The braiding chart used drawing tricks to insinuate dimensions. How does it work in markets?

Clarity Trading Structural Analytics
A Price Chart Has Two Dimensions.

Clarity Trading Structural Analytics
P R I C E
Price on the Y axis.
Y

Clarity Trading Structural Analytics
P R I C E
T I M E
And Time on the X axis
X

Clarity Trading Structural Analytics
P R I C E
T I M E
Science defines dimensions in terms of degrees of freedom. Do markets have degrees of freedom in time?

Clarity Trading Structural Analytics
No. Time moves only one way.
Strictly speaking, without introducing
another element, like volume, no freedom here.
P R I C E
T I M E
Science defines dimensions in terms of degrees of freedom. Do markets have degrees of freedom in time?

Clarity Trading Structural Analytics
P R I C E
T I M E
Markets do have degrees of freedom in price.

Clarity Trading Structural Analytics
P R I C E
T I M E
Markets do have degrees of freedom in price.
Price can move up or down.

Clarity Trading Structural Analytics
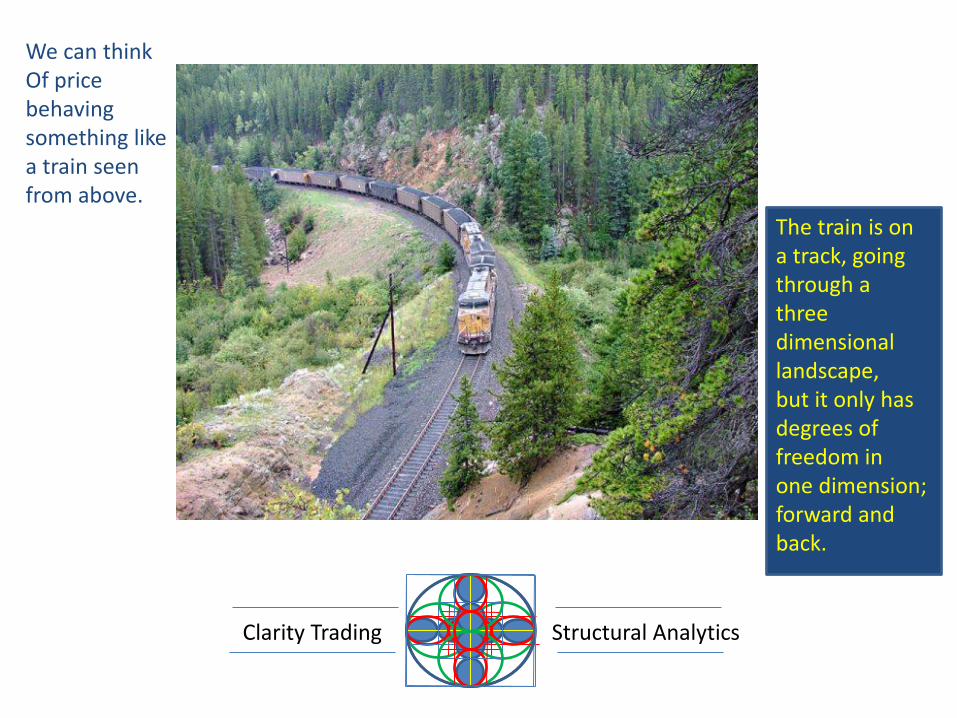
We can think of price behaving something like a train seen from above.
Clarity Trading Structural Analytics
We can think Of price behaving something like a train seen from above. The train is on
a track, going through a three dimensional landscape, but it only has degrees of freedom in one dimension; forward and back.
Clarity Trading Structural Analytics
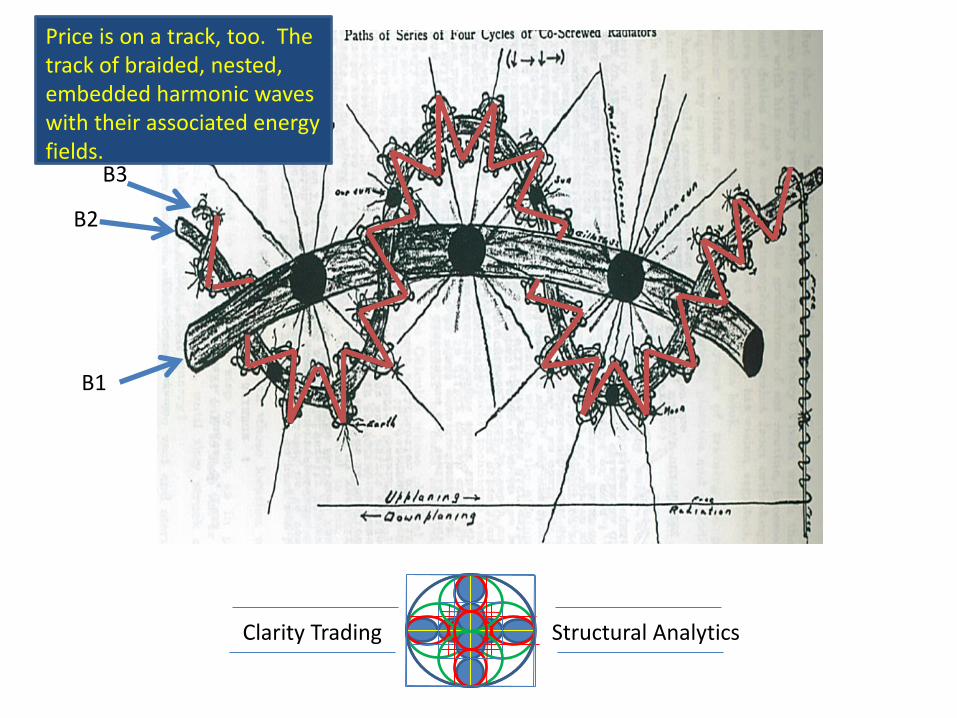
Price is on a track, too. The track of braided, nested, embedded harmonic waves with their associated energy fields.
B1
B2
B3

Clarity Trading Structural Analytics
If one understands braiding, then one understands why common structures like a double bottom followed by a bullish rotation and a structure break are so important.

Clarity Trading Structural Analytics
This Pattern Indicates that The Longer Term Braid Has Turned Up.

Clarity Trading Structural Analytics
Studying This Braiding Chart Will Provide A Great Deal of Useful Information Regarding Market Behavior.
It also will Lead to a Need to Understand Z Plane Phenomena

Clarity Trading Structural Analytics
Opportunity, at all times, is ever present, but it takes clarity to see it.
Markets are not random, but they are complex.
Clarity comes from making the complex simple.
Do not trade unless you have absolute and simple clarity.