introduction to root - phys.hawaii.eduphilipvd/teaching/14_fall_root_uhm/140911... · root - von...
TRANSCRIPT


ROOT - von Doetinchem - 2
What is ROOT?What is ROOT?Framework for large scale data handlingProvides, among others,
– an efficient data storage, access and query system (PetaBytes)
– advanced statistical analysis algorithms (multi dimensional histogramming, fitting, minimization and cluster finding)
– scientific visualization: 2D and 3D graphics, Postscript, PDF, LateX
– geometrical modeler– PROOF parallel query engine
ROOT - von Doetinchem - 3
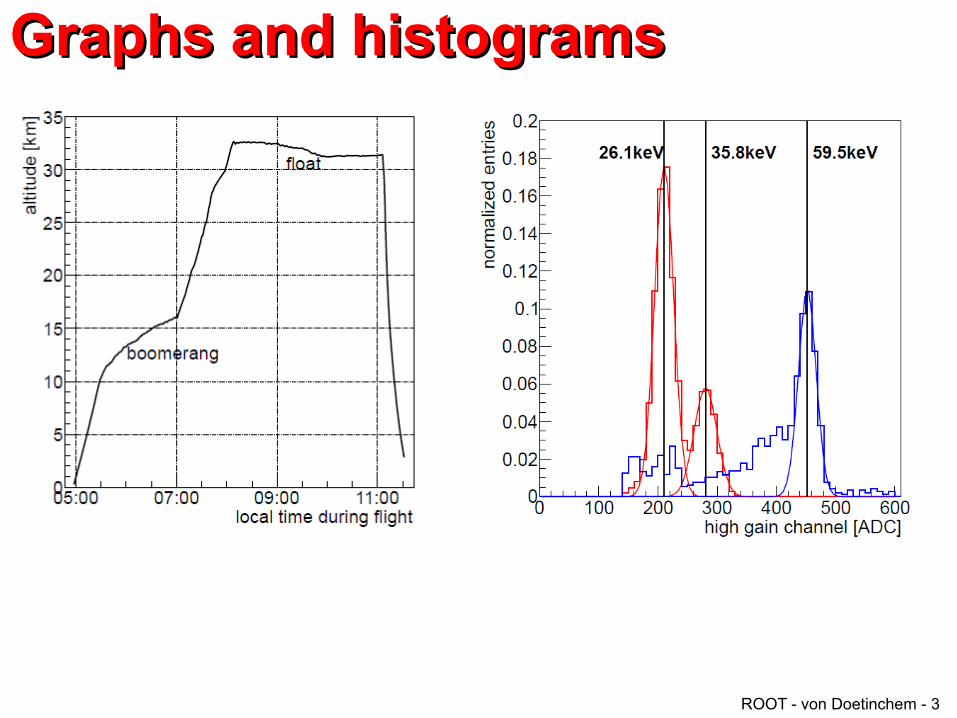
Graphs and histogramsGraphs and histograms

ROOT - von Doetinchem - 4
3d and geometry3d and geometry

ROOT - von Doetinchem - 5
OverviewOverview
• general concepts• interactive use, macros, compiled
scripts• canvas and style• histograms and graphs• fitting• write and read files• standalone programs using ROOT
ROOT - von Doetinchem - 6
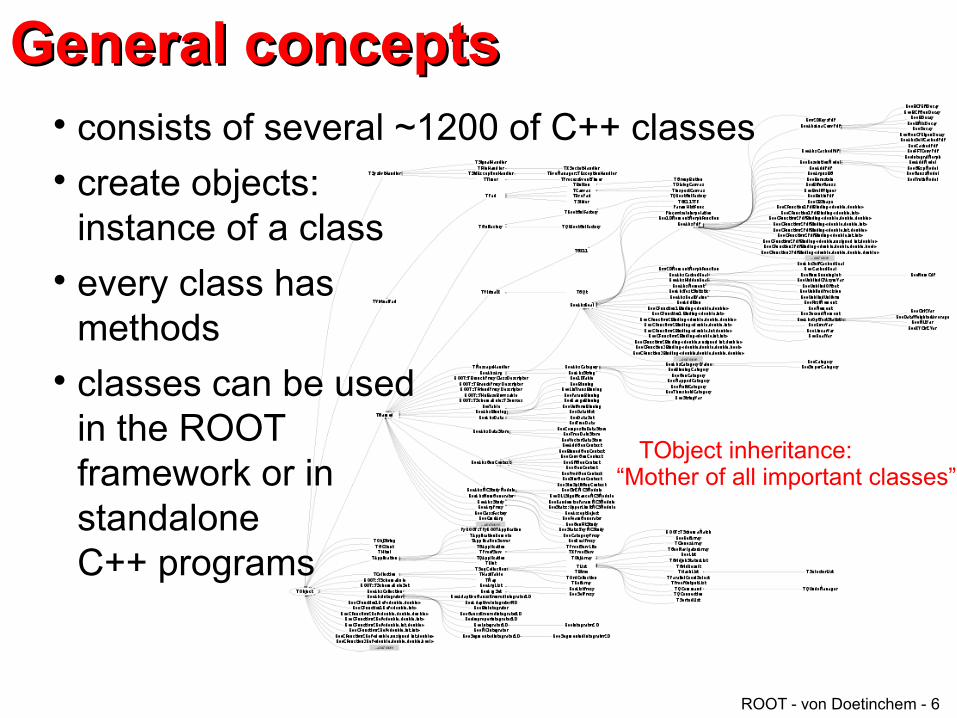
General conceptsGeneral concepts consists of several ~1200 of C++ classes create objects:
instance of a class every class has
methods classes can be used
in the ROOT framework or in standaloneC++ programs
TObject inheritance: “Mother of all important classes”

ROOT - von Doetinchem - 7
The object oriented frameworkThe object oriented framework• ROOT framework consists of ~1200 C++
• classes overview: http://root.cern.ch/root/html/ClassIndex.html
• main categories: – base classes– histograms and
minimization– tree and ntuple– linear algebra,
matrix, vector– 2D & 3D graphics– etc.

ROOT - von Doetinchem - 8
C++ reminderC++ reminder● encapsulation is the big advantage over C● object, constructors, destructor● pointers and references● Stack (local variables) and heap (dynamically allocate data)● inheritance, virtual functions● etc.
Teach yourself C++ in 21 days: http://101.lv/learn/C++
If you use C++ you have to understand these concepts!

ROOT - von Doetinchem - 9
C++ reminderC++ reminder structure of C++ program (not object oriented in this example):
compile with g++ -o cplusplus.cpp cplusplus.cpp
#include<iostream>
using namespace std;
double function(int i, double d){double result = i*d;
return result;}
int main(int argc, char * argv[]){cout<<argv[1]<<endl;
int variable_int = 3;double variable_double = 3.14;
double result = function(variable_int, variable_double);
cout<<result<<endl;
return 0;}
load library for printing to the terminal
load namespace (container for identifiers)
define a function
Print external parameter
define variables
Execute function
Print result of function execution
ROOT - von Doetinchem - 10
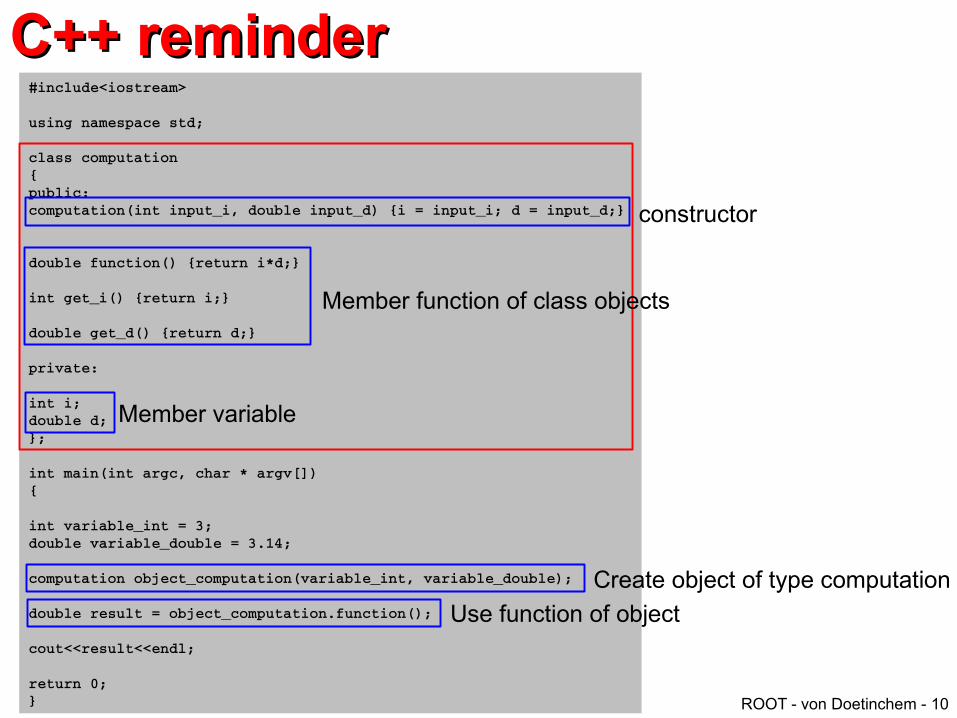
C++ reminderC++ reminder#include<iostream>
using namespace std;
class computation{public:computation(int input_i, double input_d) {i = input_i; d = input_d;}
double function() {return i*d;}
int get_i() {return i;}
double get_d() {return d;}
private:
int i;double d;};
int main(int argc, char * argv[]){
int variable_int = 3;double variable_double = 3.14;
computation object_computation(variable_int, variable_double);
double result = object_computation.function();
cout<<result<<endl;
return 0;}
constructor
Member function of class objects
Member variable
Create object of type computation
Use function of object
ROOT - von Doetinchem - 11
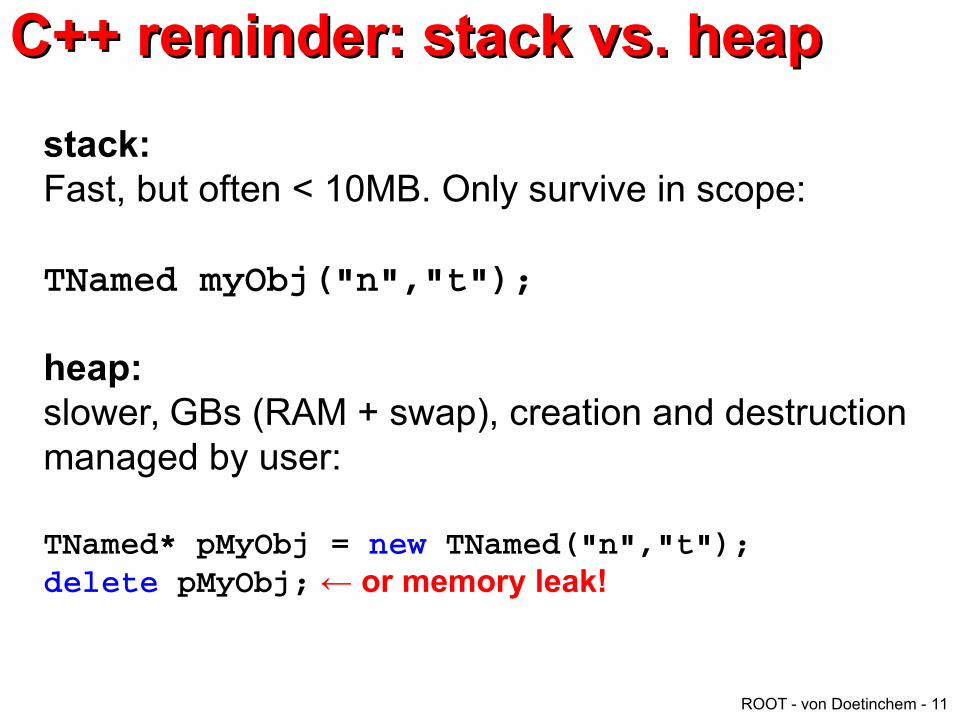
C++ reminder: stack vs. heapC++ reminder: stack vs. heap
stack:Fast, but often < 10MB. Only survive in scope:
TNamed myObj("n","t");
heap:slower, GBs (RAM + swap), creation and destruction managed by user:
TNamed* pMyObj = new TNamed("n","t");delete pMyObj; ← or memory leak!

ROOT - von Doetinchem - 12
Installation from sourceInstallation from source• download root source: http://root.cern.ch
• type the build commands:
• in most cases:
• add bin/ to PATH and lib/ to LD_LIBRARY_PATH. For the sh shell family do:
and for the csh shell family do:
>cd root>./configure –help>./configure [<arch>] [set arch appropriately if no proper default]>(g)make [or, make -j n for n core machines]
>. bin/thisroot.sh
>source bin/thisroot.csh
>./configure –enable-qt
>make

ROOT - von Doetinchem - 13
Running ROOT without installing itRunning ROOT without installing it● Run ROOT from USB flashdrive with Ubuntu live:
http://www.phys.hawaii.edu/~philipvd/teaching/14_fall_root_uhm/UbuntuliveandROOT.pdf
● A temporary server running ROOT can be reached platform independently via ssh login:
● server name: heproot.phys.hawaii.edu● username and password are the usual
@hawaii.edu login information

ROOT - von Doetinchem - 14
Class documentationClass documentation

ROOT - von Doetinchem - 15
ROOT homepage: HelpROOT homepage: Help
ROOT - von Doetinchem - 16
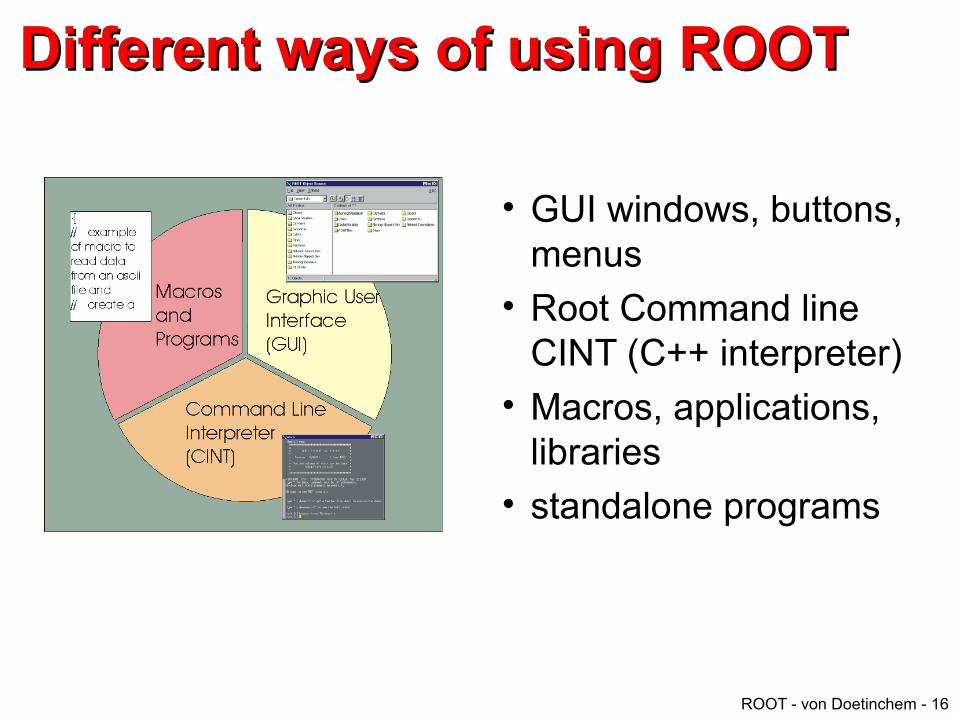
Different ways of using ROOTDifferent ways of using ROOT
• GUI windows, buttons, menus
• Root Command lineCINT (C++ interpreter)
• Macros, applications, libraries
• standalone programs

ROOT - von Doetinchem - 17
Interactive interpreterInteractive interpreterstarting and quitting ROOT
>root[0].q
options: without splash screen, batch mode>root -l>root -b
first commands (reg. C++ commands):
[0]cout<<“Hello World“<<endl;Hello World[1]int i = 2;[2]int j = 3;[3]int k = i+j;[4]cout<<k<<endl;5
shell commands[0].! ls

ROOT - von Doetinchem - 18
MacrosMacrosfile: macro.cpp{cout<<“Hello World“<<endl;int i = 2;int j = 3;int k = i+j;cout<<k<<endl;}
[0].x macro.cppHello World5
• nearly all usual C++ commands can be used in interactive or macro mode
• tab completion• BUT: commands are
interpreted and not compiled before execution: –slower–huge source of bugs

ROOT - von Doetinchem - 19
Compiled scriptsCompiled scripts
file: compiled.cpp#include<iostream>
void example()
{
cout<<"Hello World"<<endl;
int i = 2;
int j = 3;
int k = i+j;
cout<<k<<endl;
}
[0].L compiled.cpp+
[1]example()
Hello World
5
• build up scripts with a lot of different C++ functions using the ROOT classes
• debug with compiler
ROOT - von Doetinchem - 20
Compiled versus interpretedCompiled versus interpreted
Why compile? Faster execution, CINT has limitations, validate code.
Why interpret? Faster Edit → Run → Check result → Edit cycles ("rapid prototyping"). Scripting is sometimes just easier.
ROOT - von Doetinchem - 21
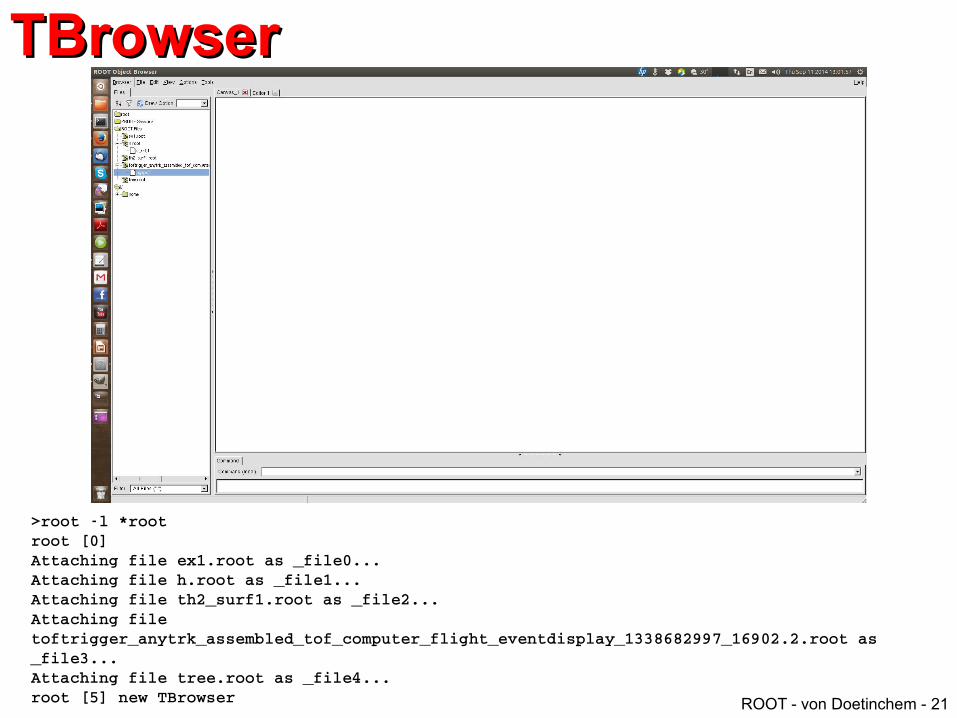
TBrowserTBrowser
>root l *rootroot [0] Attaching file ex1.root as _file0...Attaching file h.root as _file1...Attaching file th2_surf1.root as _file2...Attaching file toftrigger_anytrk_assembled_tof_computer_flight_eventdisplay_1338682997_16902.2.root as _file3...Attaching file tree.root as _file4...root [5] new TBrowser

ROOT - von Doetinchem - 22
Color and styleColor and style
TStyle * plain = new TStyle("plain","plain");plain->SetCanvasBorderMode(0); plain->SetPadBorderMode(0); plain->SetPadColor(0); plain->SetCanvasColor(0); plain->SetTitleColor(1); plain->SetStatColor(0);plain->SetTitleFillColor(0);
gROOT->SetStyle("plain");
int NRGBs = 5;int NCont = 255;
double stops[] = { 0.00, 0.34, 0.61, 0.84, 1.00 };double red[] = { 0.00, 0.00, 0.87, 1.00, 0.51 };double green[] = { 0.00, 0.81, 1.00, 0.20, 0.00 };double blue[] = { 0.51, 1.00, 0.12, 0.00, 0.00 };TColor::CreateGradientColorTable(NRGBs, stops, red, green, blue, NCont);gStyle->SetNumberContours(NCont);
• set style of canvas and colors at the beginning of your script
• many nice colors, but avoid e.g. yellow and light green!

ROOT - von Doetinchem - 23
Draw TCanvas and some objectsDraw TCanvas and some objects#include<iostream>#include<TCanvas.h>#include<TLine.h>#include<TBox.h>#include<TEllipse.h>#include<TROOT.h>
void canvas(){gROOT->Reset();
TCanvas * c = new TCanvas("c_ref","c_title", 200,10,600,600);
TLine * l = new TLine(0.1,0.2,0.4,0.7);l->SetLineWidth(2);l->SetLineColor(2);l->Draw();
TBox * b = new TBox(0.5, 0.1, 0.8, 0.7);b->SetFillColor(1);b->SetFillStyle(3001);b->Draw();
TEllipse * e = new TEllipse(0.6, 0.85, 0.2, 0.1,10, 270, 0);e->SetLineStyle(2);e->SetLineWidth(2);e->SetFillColor(4);e->Draw();}
• include classes you like to use
• reset memory
• create canvas
• choosing style, color, width is the same for all the objects one can draw
file: canvas.cpp
ROOT - von Doetinchem - 24
TPolyline3DTPolyline3D
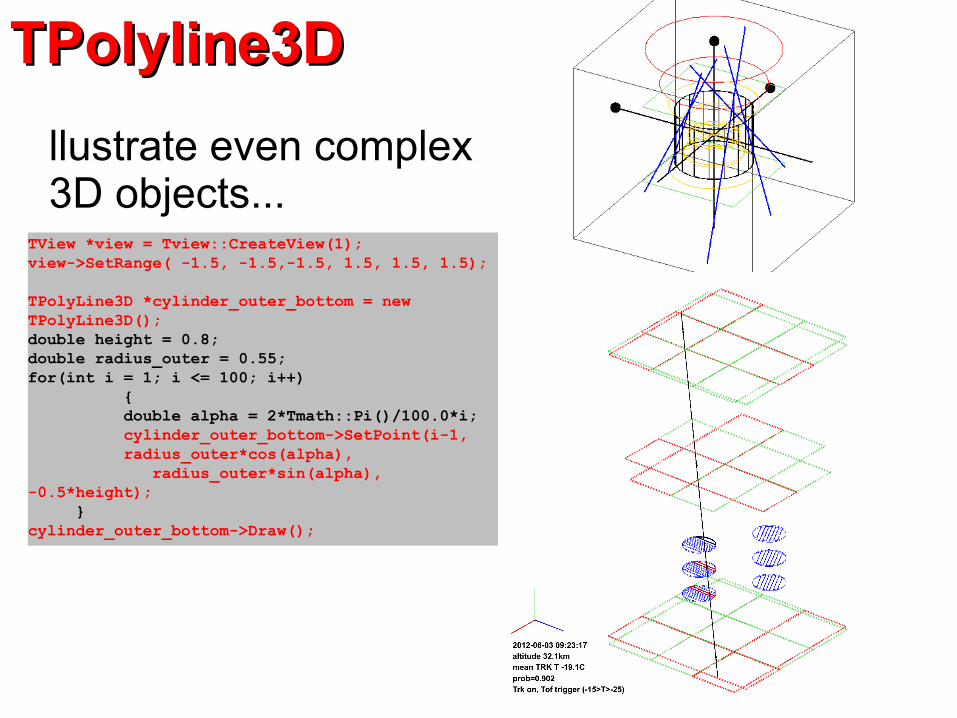
TView *view = Tview::CreateView(1);view->SetRange( -1.5, -1.5,-1.5, 1.5, 1.5, 1.5);
TPolyLine3D *cylinder_outer_bottom = new TPolyLine3D();double height = 0.8;double radius_outer = 0.55; for(int i = 1; i <= 100; i++)
{ double alpha = 2*Tmath::Pi()/100.0*i; cylinder_outer_bottom->SetPoint(i-1, radius_outer*cos(alpha), radius_outer*sin(alpha), -0.5*height);
}cylinder_outer_bottom->Draw();
llustrate even complex 3D objects...
ROOT - von Doetinchem - 25
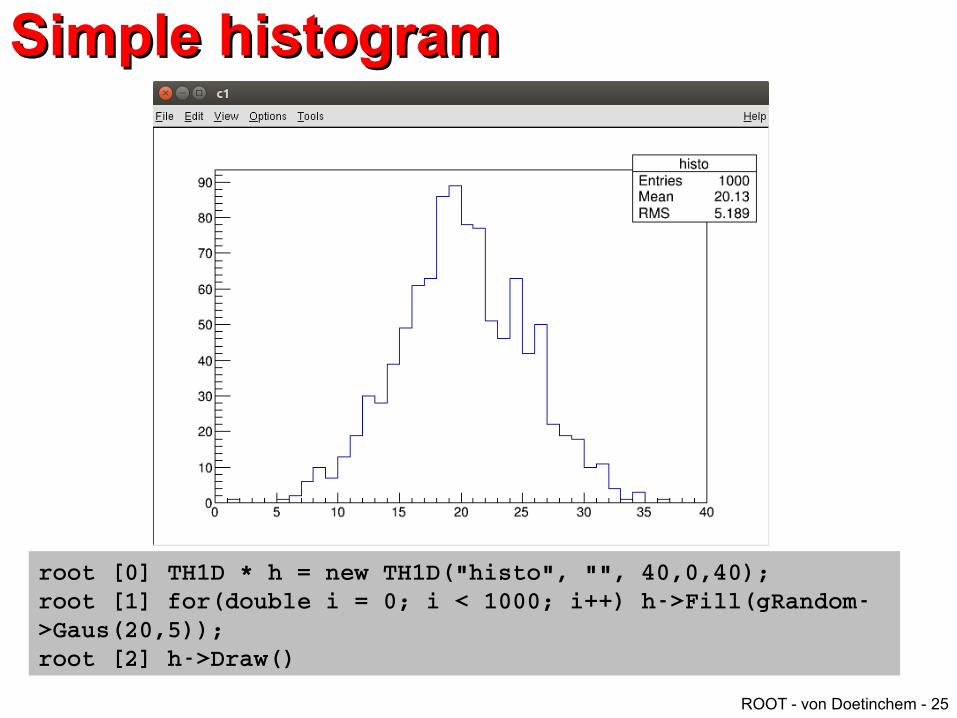
Simple histogramSimple histogram
root [0] TH1D * h = new TH1D("histo", "", 40,0,40);root [1] for(double i = 0; i < 1000; i++) h>Fill(gRandom>Gaus(20,5));root [2] h>Draw()
ROOT - von Doetinchem - 26
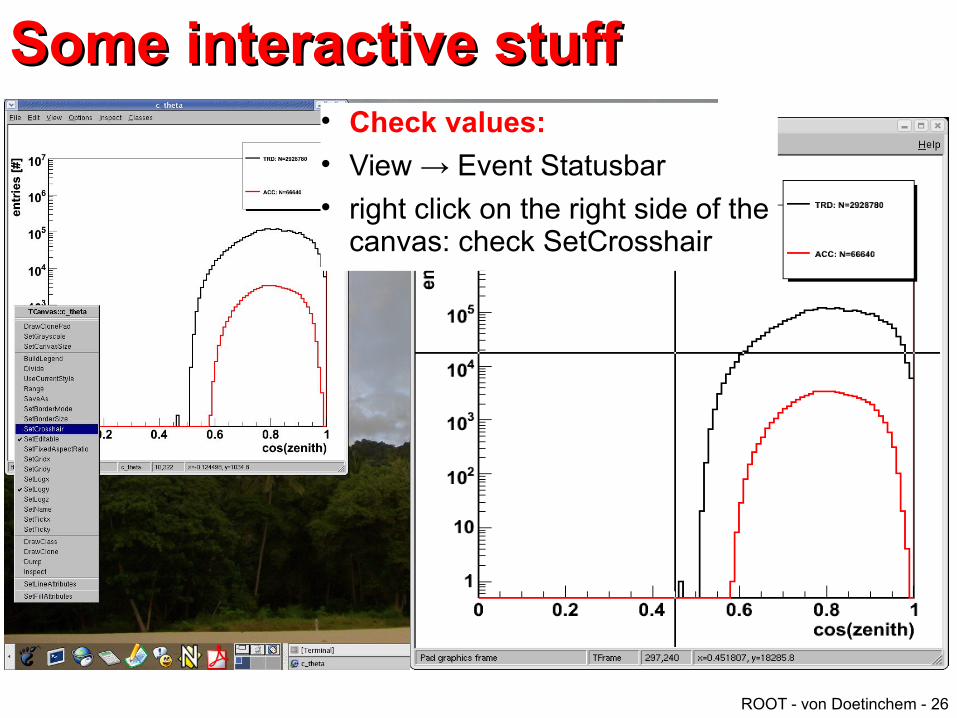
Some interactive stuffSome interactive stuff• Check values:
• View → Event Statusbar
• right click on the right side of the canvas: check SetCrosshair

ROOT - von Doetinchem - 27
Fit panelFit panel

ROOT - von Doetinchem - 28
Fit panelFit panelroot [3] for(double i = 0; i < 1000; i++) h>Fill(gRandom>Gaus(5,3));
Fit fails if you don't give any boundary conditions!

ROOT - von Doetinchem - 29
Fit panelFit panel

ROOT - von Doetinchem - 30
TF1TF1
TF1 * lin = new TF1("lin","[0]*x+[1]",-1000,1000);
g->Fit("lin","0");lin->SetLineWidth(2);lin->SetLineColor(2);lin->Draw("same");
double p0 = lin->GetParameter(0);double p1 = lin->GetParameter(1);
• fit histograms and graphs with arbitrary TF1 functions
• important options: "Q" Quiet mode (minimum printing)
"V" Verbose mode
"R" Use the Range specified in the function range
"N" Do not store the function, do not draw
"0" Do not plot the result of the fit.

ROOT - von Doetinchem - 31
More fittingMore fitting
root [16] TF1 * DoubleGaus = new TF1("DoubleGaus","[0]*TMath::Gaus(x,[1],[2])+[3]*TMath::Gaus(x,[4],[5])",0,40);root [17] DoubleGaus>SetParameters(1,3,4,1,15,7);root [18] h>Fit(DoubleGaus) FCN=40.489 FROM MIGRAD STATUS=CONVERGED 556 CALLS 557 TOTAL EDM=5.97935e08 STRATEGY= 1 ERROR MATRIX UNCERTAINTY 2.8 per cent EXT PARAMETER STEP FIRST NO. NAME VALUE ERROR SIZE DERIVATIVE 1 p0 1.31324e+02 5.73918e+00 9.89089e03 2.57901e05 2 p1 5.19007e+00 1.43660e01 1.12277e05 3.17013e03 3 p2 3.15074e+00 1.52351e01 3.99160e04 1.93389e03 4 p3 1.59830e+02 4.40063e+00 4.88964e03 2.29952e05 5 p4 2.02050e+01 1.39070e01 1.91970e04 2.20778e04 6 p5 4.81596e+00 1.05339e01 1.59206e04 2.02993e03
Give rough parameter estimatesto force fit in the right direction

ROOT - von Doetinchem - 32
TH1 histogramsTH1 histograms
TCanvas * c = new TCanvas("c","theta", 200,10,600,600);c->SetLeftMargin(0.12);c->SetRightMargin(0.05);
TH1F * frame = c->DrawFrame(0,0.5,1, 1e7);
frame->SetTitle("");frame->GetYaxis()->SetTitle("entries [#]");frame->GetXaxis()->SetTitle("cos(zenith)");frame->GetXaxis()->SetNdivisions(505);frame->GetYaxis()->SetTitleOffset(1.5);
h_trd->SetLineWidth(2);h_trd->SetLineColor(1);h_trd->Draw("same");
h_acc->SetLineWidth(2);h_acc->SetLineColor(2);h_acc->Draw("same");
gPad->SetLogy(1);
TH1D * h_trd = new TH1D("trd", "trd", 100,0,1);
double value;h_trd->Fill(value);
• create and fill histogram
• draw histogram
• draw canvas and frame
TLegend* leg = new TLegend(0.7,0.75,0.95,0.95);leg->SetFillColor(0);leg->AddEntry(h_trd,“TRD“,"L");leg->AddEntry(h_acc_theta,“ACC“,"L");
leg->Draw();
• draw legend
ROOT - von Doetinchem - 33
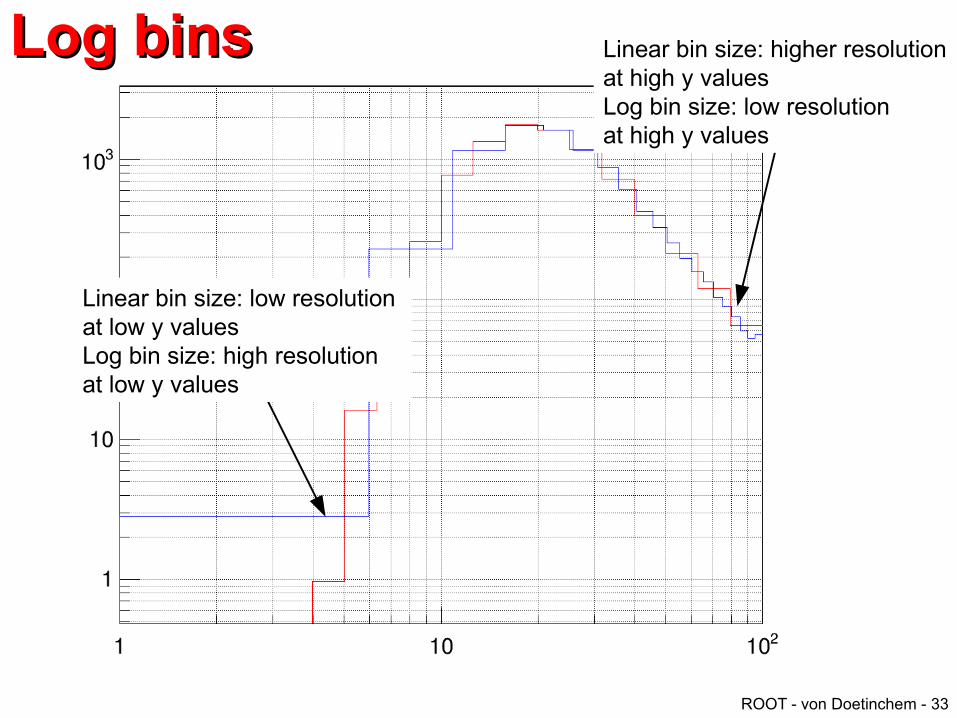
Log binsLog bins
Linear bin size: low resolution at low y valuesLog bin size: high resolutionat low y values
Linear bin size: higher resolution at high y valuesLog bin size: low resolutionat high y values
ROOT - von Doetinchem - 34
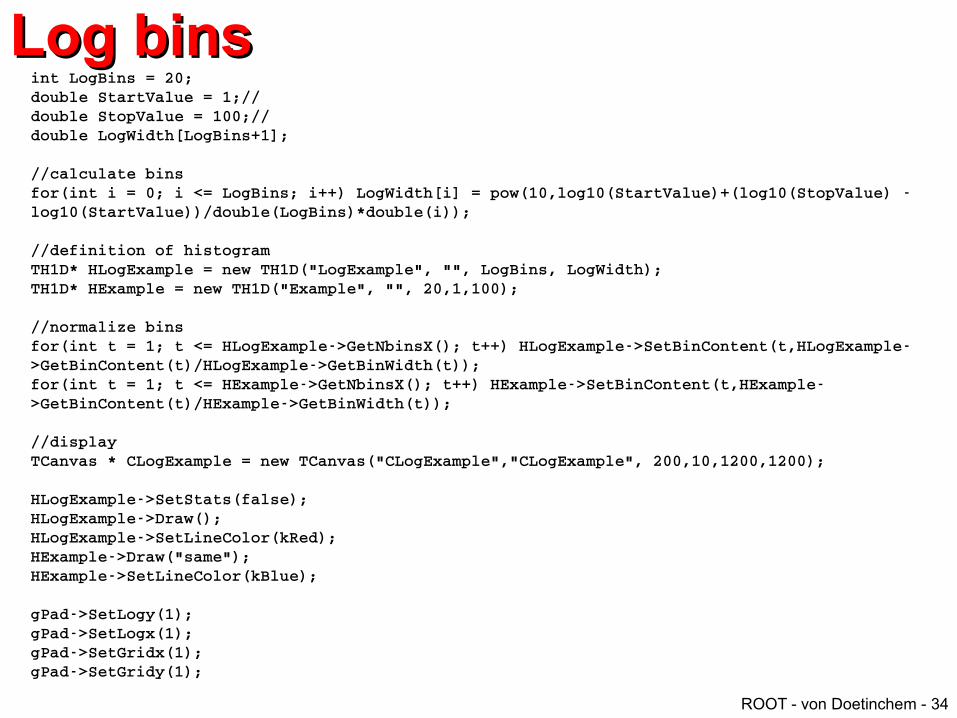
Log binsLog binsint LogBins = 20;double StartValue = 1;//double StopValue = 100;//double LogWidth[LogBins+1];
//calculate binsfor(int i = 0; i <= LogBins; i++) LogWidth[i] = pow(10,log10(StartValue)+(log10(StopValue) log10(StartValue))/double(LogBins)*double(i));
//definition of histogramTH1D* HLogExample = new TH1D("LogExample", "", LogBins, LogWidth);TH1D* HExample = new TH1D("Example", "", 20,1,100);
//normalize binsfor(int t = 1; t <= HLogExample>GetNbinsX(); t++) HLogExample>SetBinContent(t,HLogExample>GetBinContent(t)/HLogExample>GetBinWidth(t));for(int t = 1; t <= HExample>GetNbinsX(); t++) HExample>SetBinContent(t,HExample>GetBinContent(t)/HExample>GetBinWidth(t));
//displayTCanvas * CLogExample = new TCanvas("CLogExample","CLogExample", 200,10,1200,1200);
HLogExample>SetStats(false);HLogExample>Draw();HLogExample>SetLineColor(kRed);HExample>Draw("same");HExample>SetLineColor(kBlue);
gPad>SetLogy(1);gPad>SetLogx(1);gPad>SetGridx(1);gPad>SetGridy(1);

ROOT - von Doetinchem - 35
Important TH1 methodsImportant TH1 methodsint Fill(double x, double w)void AddBinContent(int bin, double w)void SetBinContent(int bin, double content)void SetBinError(int bin, double error)
void FillRandom(const char* fname, int ntimes = 5000)
void FillRandom(TH1* h, int ntimes = 5000)double GetRandom()
void Add(const TH1* h1, double c1 = 1)void Multiply(TF1* h1, double c1 = 1)void Divide(TF1* f1, double c1 = 1)
double GetEntries()double Integral(Option_t* option = "")void Scale(double c1 = 1, Option_t* option
= "")
double GetMean(int axis = 1)double GetRMS(int axis = 1)
double GetBinCenter(int bin)double GetBinContent(int bin)double GetBinError(int bin)double GetBinLowEdge(int bin)double GetBinWidth(int bin)
int GetMaximumBin()int GetMinimumBin()
Tobject* Clone(const char* newname = "")void Reset(Option_t* option = "")
TH1* Rebin(int ngroup = 2, char* newname = "", double* xbins = 0)
void Smooth(int ntimes = 1, Option_t* option = "")
int Fit(TF1* f1, Option* option = "", Option* goption = "", double xmin = 0, double xmax = 0)
Important and often used TH1 methods, for sure NOT complete!
http://root.cern.ch/root/html/TH1D.html

ROOT - von Doetinchem - 36
TText, TLatex, TPaveTextTText, TLatex, TPaveTextTText t;t.SetTextSize(0.1);t.SetTextAngle(20);t.SetTextColor(4);t.DrawText(0.1,0.2,"test 1 2 3");
TPaveText *p_acc_z_adc_norm_highest_bottom = new TPaveText(0.6,0.2,0.9,0.6,"NDC");p_acc_z_adc_norm_highest_bottom->AddText("bla");p_acc_z_adc_norm_highest_bottom->AddText("bupp");p_acc_z_adc_norm_highest_bottom->SetFillColor(0);p_acc_z_adc_norm_highest_bottom->Draw();
TLatex latex;latex.SetTextSize(0.08);latex.SetTextAlign(13);latex.DrawLatex(0.2,0.8,"x = #frac{y+z/2}{y^{2}+1}");
• write text on your canvas!

ROOT - von Doetinchem - 37
AxisAxisTGaxis *axis1 = new TGaxis(-4.5,-0.2,5.5,-0.2,-6,8,510,"");axis1->SetName("axis1");axis1->Draw();
TGaxis *axis2 = new TGaxis(-4.5,0.2,5.5,0.2,0.001,10000,510,"G");axis2->SetName("axis2");axis2->Draw();
TGaxis *axis3 = new TGaxis(-9,-0.8,-9,0.8,-8,8,50510,"");axis3->SetName("axis3");axis3->Draw();
TGaxis *axis4 = new TGaxis(-7,-0.8,-7,0.8,1,10000,50510,"G");axis4->SetName("axis4");axis4->Draw();
TGaxis *axis5 = new TGaxis(-4.5,-0.6,5.5,-0.6,1.2,1.32,80506,"-+");axis5->SetName("axis5");axis5->SetLabelSize(0.03);axis5->SetTextFont(72);axis5->SetLabelOffset(0.025);
axis5->Draw();
TGaxis *axis6 = new TGaxis(-4.5,0.6,5.5,0.6,100,900,50510,"-");axis6->SetName("axis6");axis6->Draw();
TGaxis *axis7 = new TGaxis(8,-0.8,8,0.8,0,9000,50510,"+L");axis7->SetName("axis7");axis7->SetLabelOffset(0.01);axis7->Draw();
TGaxis *axis8 = new TGaxis(6.5,0.8,6.499,-0.8,0,90,50510,"-");axis8->SetName("axis8");axis8->Draw();
• various options for axis
• operations on TGaxis also apply for regular axis of histograms/graphs
ROOT - von Doetinchem - 38
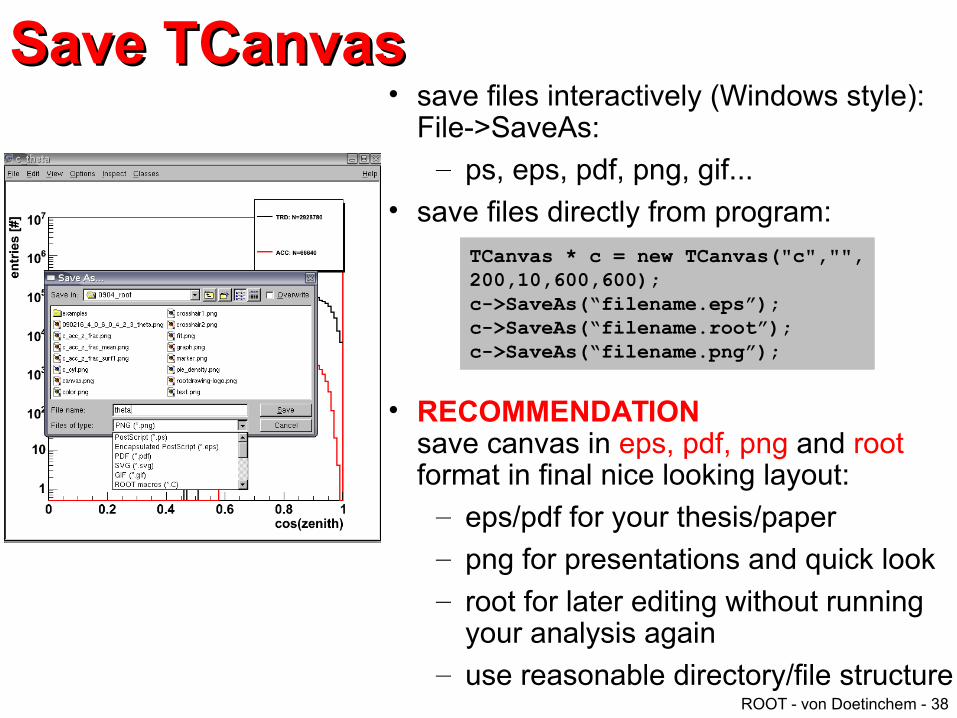
Save TCanvasSave TCanvas• save files interactively (Windows style):
File->SaveAs:– ps, eps, pdf, png, gif...
• save files directly from program:
• RECOMMENDATIONsave canvas in eps, pdf, png and root format in final nice looking layout:
– eps/pdf for your thesis/paper– png for presentations and quick look– root for later editing without running
your analysis again– use reasonable directory/file structure
TCanvas * c = new TCanvas("c","", 200,10,600,600);c->SaveAs(“filename.eps”);c->SaveAs(“filename.root”);c->SaveAs(“filename.png”);
ROOT - von Doetinchem - 39
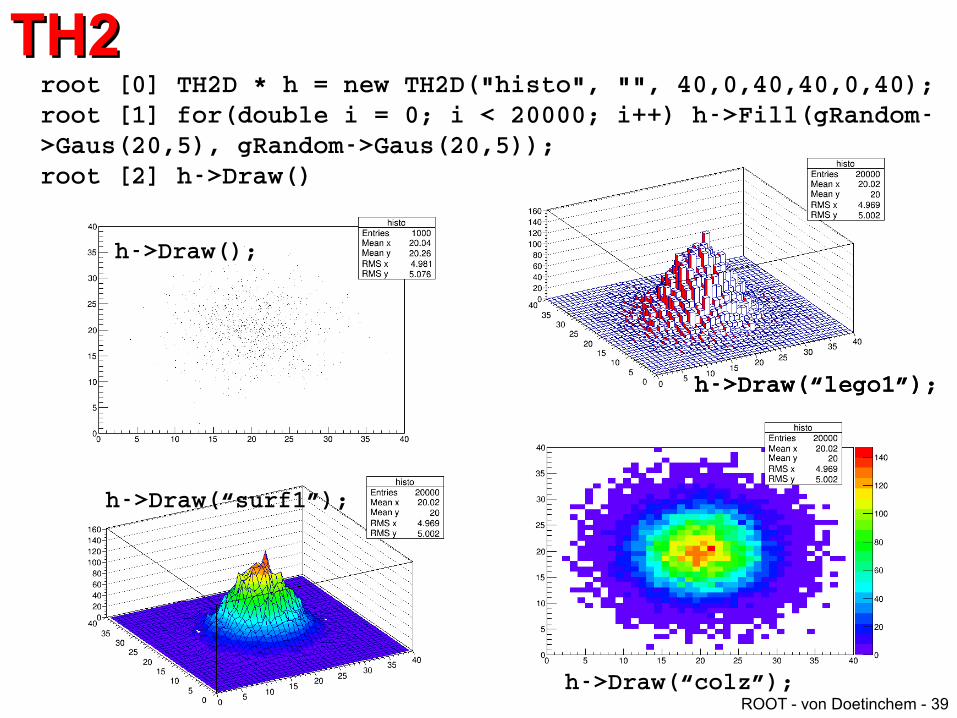
TH2TH2root [0] TH2D * h = new TH2D("histo", "", 40,0,40,40,0,40);root [1] for(double i = 0; i < 20000; i++) h>Fill(gRandom>Gaus(20,5), gRandom>Gaus(20,5));root [2] h>Draw()
h>Draw();
h>Draw(“surf1”);
h>Draw(“lego1”);h>Draw(“lego1”);
h>Draw(“colz”);

ROOT - von Doetinchem - 40
TPieTPiefloat vals[] = {0.721,0.233,0.0462,0.0133};int colors[] = {2,4,6,8};char label[4][200] ={"dark energy", "cold dark matter", "baryons", "< neutrinos"};int nvals = 4;
TCanvas *cpie = new TCanvas("cpie","TPie test",700,700);
TPie *pie = new TPie("pie","",nvals,vals,colors);
pie->SetAngularOffset(304);pie->SetTextSize(0.04);pie->GetSlice(0)->SetTitle("dark energy"); pie->GetSlice(1)->SetTitle("cold dark matter"); pie->GetSlice(2)->SetTitle("baryons"); pie->GetSlice(3)->SetTitle("< neutrinos"); pie->Draw("3d <");
ROOT - von Doetinchem - 41
TGraphTGraph
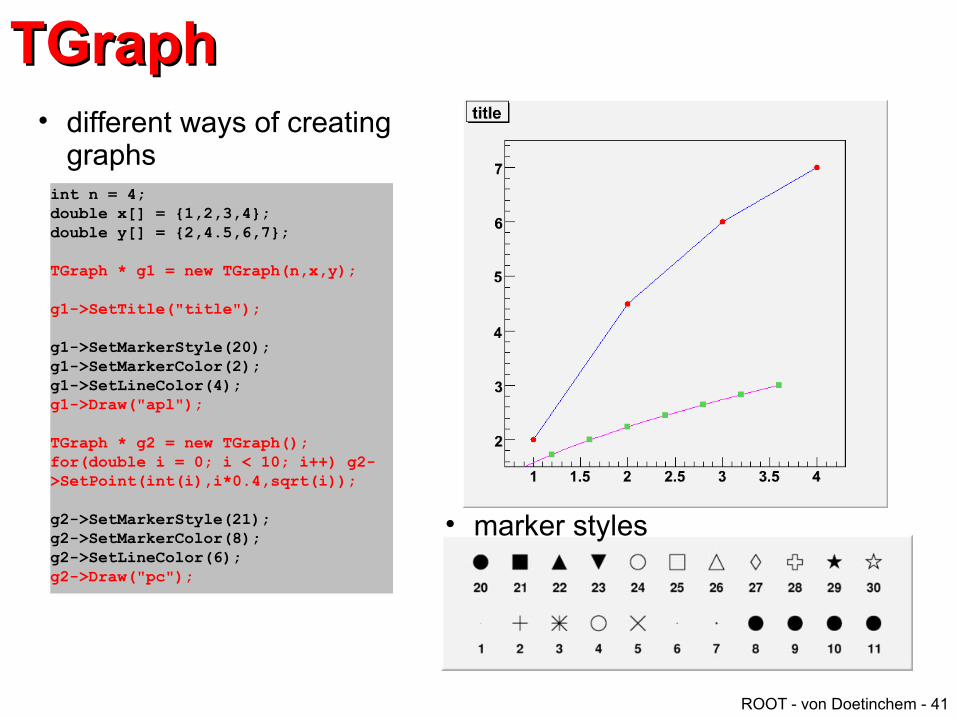
int n = 4;double x[] = {1,2,3,4};double y[] = {2,4.5,6,7};
TGraph * g1 = new TGraph(n,x,y);
g1->SetTitle("title");
g1->SetMarkerStyle(20);g1->SetMarkerColor(2);g1->SetLineColor(4);g1->Draw("apl");
TGraph * g2 = new TGraph();for(double i = 0; i < 10; i++) g2->SetPoint(int(i),i*0.4,sqrt(i));
g2->SetMarkerStyle(21);g2->SetMarkerColor(8);g2->SetLineColor(6);g2->Draw("pc");
• different ways of creating graphs
• marker styles

ROOT - von Doetinchem - 42
Time stampTime stamp
g>GetYaxis()>SetTitleOffset(1.6);g>GetYaxis()>SetTitle("# clean tracks with at least 2 TRK hits");g>GetXaxis()>SetTimeDisplay(1);g>GetXaxis()>SetNdivisions(505, false);g>GetXaxis()>SetTimeFormat("%H:%M");
In graph or histogram just use the time in UNIX time format

ROOT - von Doetinchem - 43
Asymmetric error barsAsymmetric error bars
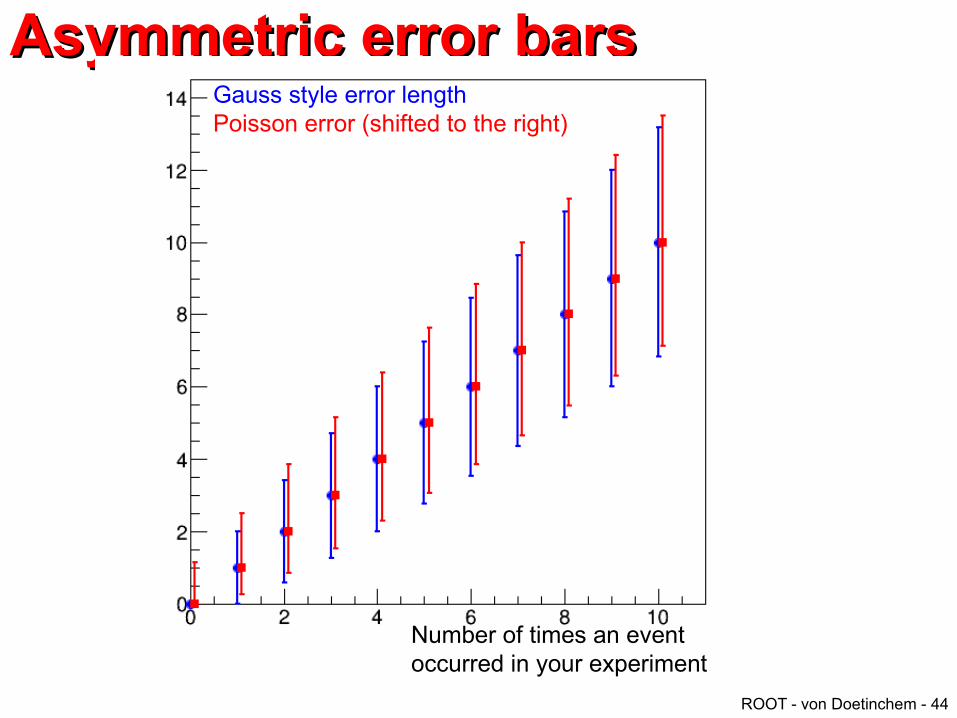
root [0] TH1D *h1 = new TH1D("h1","",21,0.5,20.5)root [1] TH1D *h10 = new TH1D("h10","",21,0.5,20.5)root [2] for(double i = 0; i < 1000; i++) h1>Fill(gRandom>Poisson(1));root [3] for(double i = 0; i < 1000; i++) h10>Fill(gRandom>Poisson(10));root [4] h1>Draw()root [5] h10>SetLineColor(kBlack);root [6] h10>Draw("same")
The arithmetic mean of a sufficiently large number of iterates of independent random variables, each with a well-defined expected value and well-defined variance, will be approximately normally distributed.
ROOT - von Doetinchem - 44
Asymmetric error barsAsymmetric error barsGauss style error lengthPoisson error (shifted to the right)
Number of times an eventoccurred in your experiment

ROOT - von Doetinchem - 45
Asymmetric errorsAsymmetric errorsvoid poisson(){TCanvas * CPoisson = new TCanvas("Bin","Bin", 200,10,600,600);
CPoisson>SetLeftMargin(0.15);CPoisson>SetRightMargin(0.04);CPoisson>SetTopMargin(0.04);
double PoissonDown[11] = {0,0.268,0.864,1.55,2.29,3.06,3.85,4.65,5.47,6.3,7.14};double PoissonUp[11] = {1.15,2.5,3.86,5.15,6.4,7.63,8.84,10,11.2,12.4,13.5};
TGraphAsymmErrors * GPoisson = new TGraphAsymmErrors;TGraphErrors * GGaus = new TGraphErrors;
int points = 0;for(double i = 0; i < 11; i++) { GGaus>SetPoint(points,i,i); GGaus>SetPointError(points,0,sqrt(i));
GPoisson>SetPoint(points,i+0.1,i); GPoisson>SetPointEYhigh(points,PoissonUp[int(i)]i); GPoisson>SetPointEYlow(points,iPoissonDown[int(i)]);
points++; }
GGaus>Draw("AP");GGaus>SetLineColor(kBlue);GGaus>SetLineWidth(2);GGaus>SetMarkerStyle(20);GGaus>SetMarkerColor(kBlue);
GPoisson>Draw("P");GPoisson>SetLineColor(kRed);GPoisson>SetLineWidth(2);GPoisson>SetMarkerStyle(21);GPoisson>SetMarkerColor(kRed);}

ROOT - von Doetinchem - 46
Calculate efficienciesCalculate efficienciesvoid calc_efficiency(int n, int N){TH1D h_n("h_n","", 1, 0, 1);TH1D h_N("h_N","", 1, 0, 1);
h_n.SetBinContent(1,n);h_N.SetBinContent(1,N);
TGraphAsymmErrors g;g.BayesDivide(&h_n, &h_N);
double mean;double temp;g.GetPoint(0,temp,mean);
double error_low = g.GetErrorYlow(0);double error_high = g.GetErrorYhigh(0);cout<<"(n="<<n<<", N="<<N<<") | efficiency: "<<mean<<" "<<error_low<<" +"<<error_high<<" @ 68.3% Confidence Level"<<endl;}
How to calculate error for efficiency when the efficient is very small
● naive: n=5, N =1000 → efficiency = n/N = 0.005 → use Gaussian error approach for relatively large n: error: sqrt(5)/1000=0.0022However this is wrong! → What does that even mean if the efficiency is below zero within a little more than 2.2 standard deviations
● We have to use binomial statistics:(n=5, N=1000) | efficiency: 0.005 -0.0019 +0.0026 @ 68.3% Confidence Level
ROOT - von Doetinchem - 47
ExerciseExercise● Fill a histogram randomly (n=~10,000) with a Landau distribution with a most probable value at 20 and a “width” of 5 (use the ROOT website to find out about the Landau function)
● Fill the same histogram randomly (n=~5,000) with a Gaussian distribution centered at 5 with a “width” of 3
● Write a compiled script with a fit function that describes the total histogram nicely (it might be a good idea to fit both peaks individually first and use the fit parameters for a combined fit)
● Add titles to x- and y-axis
● Include a legend of the histogram with number of entries, mean, and RMS values
● Add text to the canvas with the fitted function parameters
● Draw everything on a square-size canvas (histogram in blue, fit in red)
● Save as png, eps, and root file
● Email me your result: [email protected]
ROOT - von Doetinchem - 48
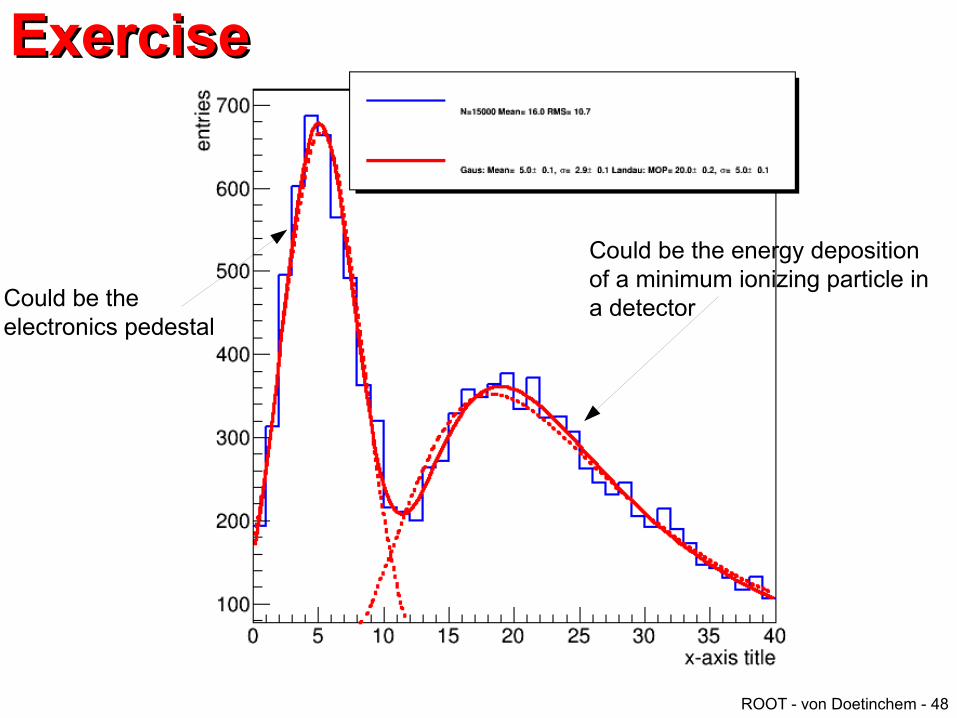
ExerciseExercise
Could be the energy depositionof a minimum ionizing particle ina detectorCould be the
electronics pedestal

ROOT - von Doetinchem - 49
Solution exercise 1Solution exercise 1#include<iostream>
#include<TH1D.h>#include<TF1.h>#include<TCanvas.h>#include<TRandom.h>#include<TStyle.h>#include<TLegend.h>#include<TROOT.h>#include<TPaveText.h>
void exercise1(){gROOT>Reset();TStyle * plain = new TStyle("plain","plain");plain>SetCanvasBorderMode(0);plain>SetPadBorderMode(0);plain>SetPadColor(0);plain>SetCanvasColor(0);plain>SetTitleColor(1);plain>SetStatColor(0);plain>SetTitleFillColor(0);
gROOT>SetStyle("plain");gStyle>SetPalette(1);
//create empty histogramTH1D * h = new TH1D("histo", "", 40,0,40);//disable display of histogram statisticsh>SetStats(false);
//fill with Landau distributionfor(double i = 0; i < 10000; i++) h>Fill(gRandom>Landau(20,5));
//fill with Gaus distributionfor(double i = 0; i < 5000; i++) h>Fill(gRandom>Gaus(5,3));
//define fit functionsTF1 * FitFunc1 = new TF1("FitFunc1","[0]*TMath::Gaus(x,[1],[2])",0,40);TF1 * FitFunc2 = new TF1("FitFunc2","[0]*TMath::Landau(x,[1],[2])",0,40);TF1 * FitFuncCombined = new TF1("FitFunc2","[0]*TMath::Gaus(x,[1],[2])+[3]*TMath::Landau(x,[4],[5])",0,40);
//fit both peaks individually with reasonable initial parameters and fitting rangeFitFunc1>SetParameters(1,3,4);h>Fit(FitFunc1,"0","",0,10);
FitFunc2>SetParameters(1,17,7);h>Fit(FitFunc2,"0","",10,40);
ROOT - von Doetinchem - 50
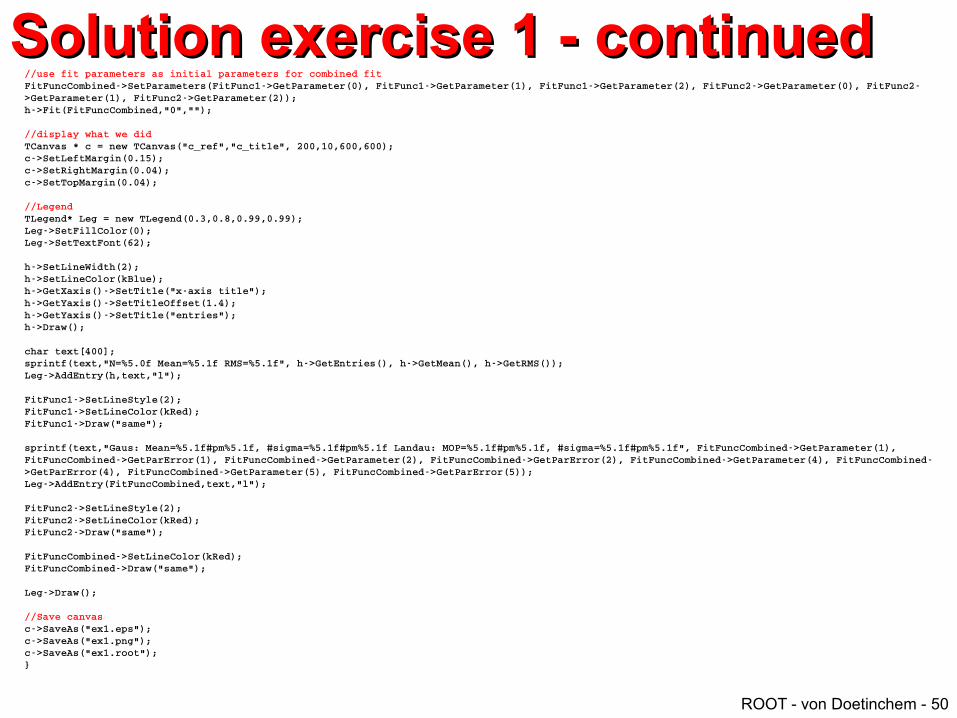
Solution exercise 1 - continuedSolution exercise 1 - continued//use fit parameters as initial parameters for combined fitFitFuncCombined>SetParameters(FitFunc1>GetParameter(0), FitFunc1>GetParameter(1), FitFunc1>GetParameter(2), FitFunc2>GetParameter(0), FitFunc2>GetParameter(1), FitFunc2>GetParameter(2));h>Fit(FitFuncCombined,"0","");
//display what we didTCanvas * c = new TCanvas("c_ref","c_title", 200,10,600,600);c>SetLeftMargin(0.15);c>SetRightMargin(0.04);c>SetTopMargin(0.04);
//LegendTLegend* Leg = new TLegend(0.3,0.8,0.99,0.99);Leg>SetFillColor(0);Leg>SetTextFont(62);
h>SetLineWidth(2);h>SetLineColor(kBlue);h>GetXaxis()>SetTitle("xaxis title");h>GetYaxis()>SetTitleOffset(1.4);h>GetYaxis()>SetTitle("entries");h>Draw();
char text[400];sprintf(text,"N=%5.0f Mean=%5.1f RMS=%5.1f", h>GetEntries(), h>GetMean(), h>GetRMS());Leg>AddEntry(h,text,"l");
FitFunc1>SetLineStyle(2);FitFunc1>SetLineColor(kRed);FitFunc1>Draw("same");
sprintf(text,"Gaus: Mean=%5.1f#pm%5.1f, #sigma=%5.1f#pm%5.1f Landau: MOP=%5.1f#pm%5.1f, #sigma=%5.1f#pm%5.1f", FitFuncCombined>GetParameter(1), FitFuncCombined>GetParError(1), FitFuncCombined>GetParameter(2), FitFuncCombined>GetParError(2), FitFuncCombined>GetParameter(4), FitFuncCombined>GetParError(4), FitFuncCombined>GetParameter(5), FitFuncCombined>GetParError(5));Leg>AddEntry(FitFuncCombined,text,"l");
FitFunc2>SetLineStyle(2);FitFunc2>SetLineColor(kRed);FitFunc2>Draw("same");
FitFuncCombined>SetLineColor(kRed);FitFuncCombined>Draw("same");
Leg>Draw();
//Save canvasc>SaveAs("ex1.eps");c>SaveAs("ex1.png");c>SaveAs("ex1.root");}