introduction to innovation surveys and some very basic
TRANSCRIPT

Introduction to innovation surveys and some very basic econometrics
Pierre Mohnen
August 2016
Jena, Summer School, 2016

Main references
• Mairesse, Jacques and Pierre Mohnen, « Using innovation surveys for econometric analysis », in the Handbook of the Economics of Innovation, B. H. Hall and N. Rosenberg (editors), Elsevier, Amsterdam, 2010, 1130-1155.
Jena, Summer School, 2016

Innovation and indicators
• R&D
• Patents + patent citations
• Bibliometrics
• Innovation surveys: inputs and outputs

Definition of R&D
• Frascati Manual
Jena, Summer School, 2016
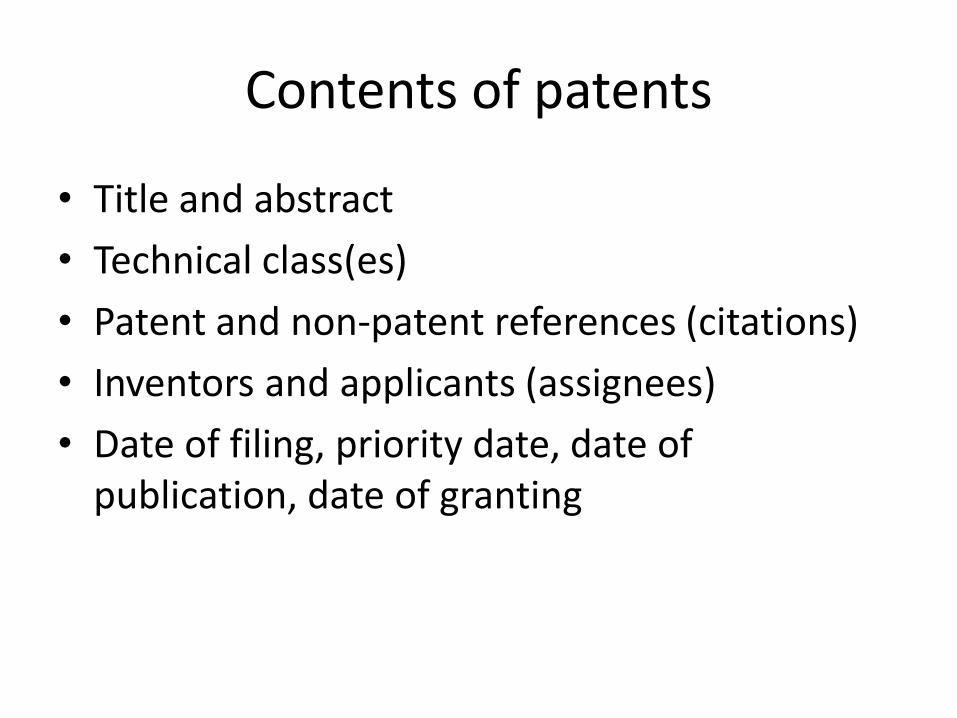
Contents of patents
• Title and abstract
• Technical class(es)
• Patent and non-patent references (citations)
• Inventors and applicants (assignees)
• Date of filing, priority date, date of publication, date of granting

Example (taken from OECD Patent Statistics Manual, 2009)

Innovation Surveys
• Late 80s, early 90s: pilot innovation surveys in Canada, France, Germany, Italy, Luxembourg, the Netherlands, Norway, Sweden, Uruguay and the United States
• Oslo Manual (1992, 1996, 2005)
• Community Innovation Surveys (CIS)
– CIS1 (90-92), CIS2 (94-96), CIS3 (98-00), CIS4 (02-04), CIS2006 (04-06), CIS2008 (06-08), …
• Yearly data from Mannheim innovation panel (Germany) since 1992, ESSE (Spain) since 1990
• World Bank and EBRD, Innovation Follow-up, BEEPS
Jena, Summer School, 2016

Purpose of innovation surveys
• Measure of innovation performance
– Input side
– Output side
• Comparison of innovation performance across sectors, countries
• Link of innovation performance with productivity, employment, competition,…
Jena, Summer School, 2016

History
• Carter and Williams, UK, 1950s, for the Science and Industry Committee of the British Association for the Advancement of Science
• Arthur D. Little, E. Mansfield and S. Myers, U.S., 1960s for the National Science Foundation
• K. Pavitt, 1970s, Science and Policy Research Unit (SPRU) in Brighton

History (2)
• Late 80s, early 90s: pilot innovation surveys in Canada, France, Germany, Italy, Luxembourg, the Netherlands, Norway, Sweden, Uruguay and the United States
• Oslo Manual (1992, 1996, 2005)
• Community Innovation Surveys (CIS)
– CIS1 (90-92), CIS2 (94-96), CIS3 (98-00), CIS4 (02-04), CIS2006 (04-06), CIS2008 (06-08)

History (3)
• Annual surveys in Germany since 1993, bi-annual surveys in the Netherlands since 1999
• Surveys on particular sectors (e.g. Canadian survey on construction industry, Dutch LEI survey on agriculture)
• Surveys with questions on innovation:
– ESEE in Spain: 10 years of data
– World Bank administered Investment Climate Survey
– Chinese National Bureau of Statistics annual survey on large and medium size enterprises

Related surveys
• Literature-based counts of innovation like the one commissioned in 1982 by the U.S. Small Business Administration
• Statistics Canada Survey on the Commercialization of Innovation, 2007 and repeated Surveys of Advanced Technologies in Manufacturing
• French surveys of organizational innovation and on intellectual property rights
• Yale Survey on Industrial Research and Development
• Carnegie Mellon University R&D Survey
• Patval Survey on inventors

Countries with innovation surveys
• EU countries (CIS surveys)• Canada• Norway, Switzerland, Russia, Turkey • Australia, New Zealand• Argentina, Brazil, Chile, Colombia, Mexico, Peru,
Uruguay, Venezuela• South Korea, Taiwan, Singapore, Malaysia, Thailand,
Japan, China, Vietnam, Indonesia • South Africa, Tunisia, NEPAD
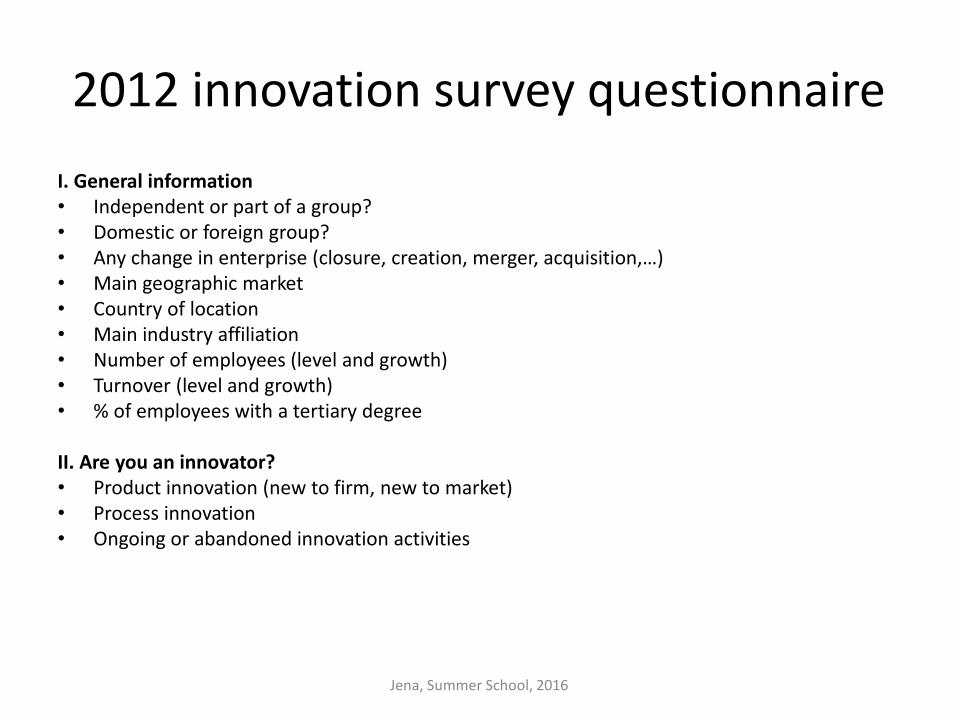
2012 innovation survey questionnaire
I. General information• Independent or part of a group?• Domestic or foreign group?• Any change in enterprise (closure, creation, merger, acquisition,…)• Main geographic market• Country of location• Main industry affiliation• Number of employees (level and growth)• Turnover (level and growth)• % of employees with a tertiary degree
II. Are you an innovator?• Product innovation (new to firm, new to market)• Process innovation• Ongoing or abandoned innovation activities
Jena, Summer School, 2016

2012 innovation survey questionnaire
• Questions conditional on being a product innovator
• Questions conditional on being a process innovator
• Questions conditional on being a product innovator, a process innovator, or with ongoing or abandoned innovation activities– Occurrence and extent of innovation activities
– Financial support
– Co-operation
– Competitiveness
– Information sources
Jena, Summer School, 2016

2012 innovation survey questionnaire
• Questions to all:
– Organizational innovation
– Marketing innovation
– Public procurement
– Innovation strategies
– Innovation obstacles
Jena, Summer School, 2016

Summary of content
• Innovation outputs
– Commercialization as opposed to invention (to compare with patents and bibliometrics)
– Different types (product, process, organis., marketing)
– Levels of novelty
• Innovation inputs
– Besides R&D, other innovation expenditures
• Innovation modalities
– Cooperation, sources of information, objectives of innovation, public support, obstacles, innovation strategies
Jena, Summer School, 2016
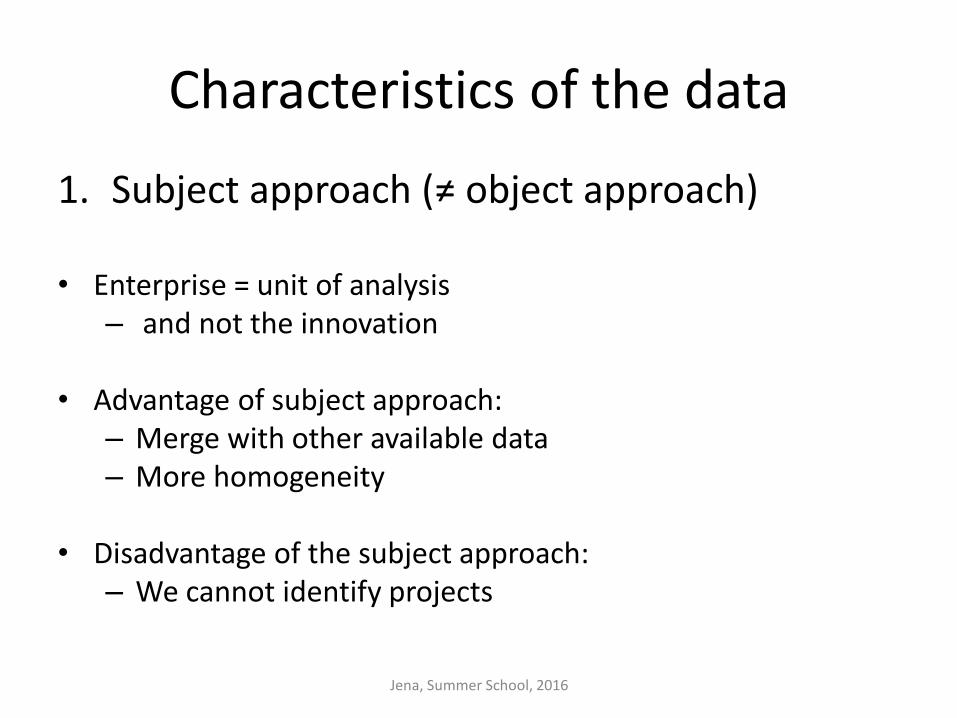
Characteristics of the data
1. Subject approach (≠ object approach)
• Enterprise = unit of analysis– and not the innovation
• Advantage of subject approach:– Merge with other available data– More homogeneity
• Disadvantage of the subject approach:– We cannot identify projects
Jena, Summer School, 2016

Characteristics of the data (2)
2. Qualitative data
• Dichotomous, ordered categorical, unordered categorical
• Latent variables and distributional assumptions
• Less informative than continuous data
Jena, Summer School, 2016
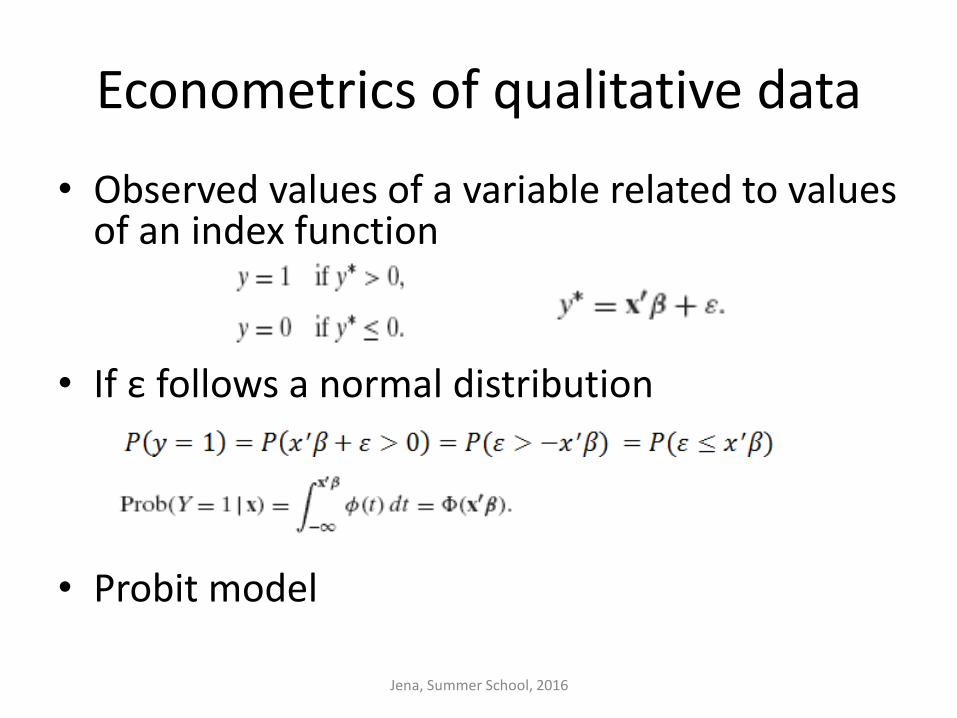
Econometrics of qualitative data
• Observed values of a variable related to values of an index function
• If ε follows a normal distribution
• Probit model
Jena, Summer School, 2016

Maximum likelihood estimation
By numerical methods search for 𝛽 that maximize the likelihood function.
Jena, Summer School, 2016

Characteristics of the data (3)
3. Censored variables
– Potential sample selection
– Few explanatory variables to discriminate between innovators and non-innovators
Jena, Summer School, 2016

Characteristics of the data (4)
4. Subjective data + errors in variables
– What is new? New to the market?
– Share of innovative sales
– Innovation expenditures
Jena, Summer School, 2016

Characteristics of the data (5)
5) Simultaneity
• Most of the variables in the survey are simultaneously determined, feeding on each other
• Solution: IV estimation • Problem:
– Cross-sectional data• Few variables to instrument
– If panel data, • Few years• 4 years apart• Random sampling• timing
Jena, Summer School, 2016

IV estimator
• Solution: Find instrumental variables
• Instead of exploiting X’ε=0=X’(Y-Xβ)=0
hence
we exploit the no-correlation between Z and ε: Z’ε=0=Z’(Y-Xβ)=0
hence
YXXXOLS ')'(ˆ 1
YZXZIV ')'(ˆ 1
Jena, Summer School, 2016
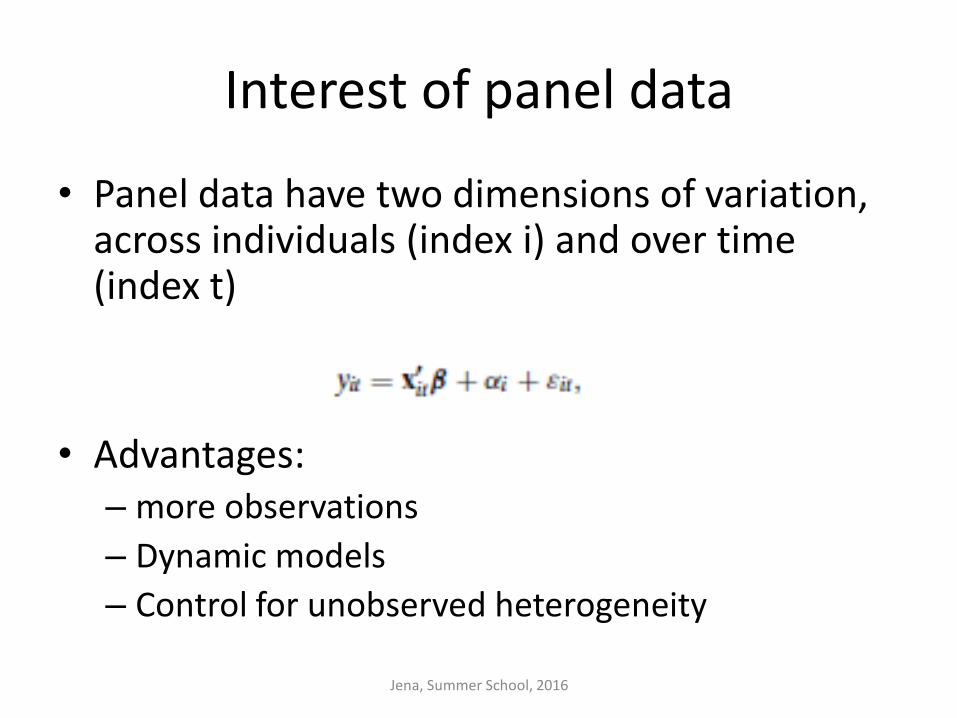
Interest of panel data
• Panel data have two dimensions of variation, across individuals (index i) and over time (index t)
• Advantages: – more observations
– Dynamic models
– Control for unobserved heterogeneity
Jena, Summer School, 2016

Use of innovation surveys
• Monitoring and benchmarking
• Understanding innovation
• Policy guidance
Jena, Summer School, 2016

Monitoring and benchmarking
• Cross-tabulations– Innovation-size– Innovation-government support– Innovation-cooperation,…
• Interest:– Do firms with government support innovate more or do more R&D?
• Follow the evolution of a country’s innovation performance and compare it to other countries
• Interest:– Are some countries lagging behind or catching?
• Caution: correlation does not mean causality
Jena, Summer School, 2016

Constructing indexes
• Aggregate in one index many indicators
• Examples– European innovation scoreboard– Global summary innovation index
• Difficulties:– Which indicators to include in the index?– Weights ?– Intertemporal comparison when components change?– International comparisons when questions differ?– How to aggregate qualitative variables?– Importance of complementarities
Jena, Summer School, 2016

Global Innovation Index (WIPO, Cornell Univ. , INDEAD)
Jena, Summer School, 2016
Understanding innovation
• Determinants
• Effects
– Productivity
– Employment
– Survival
• Persistence
• Complementarities
Jena, Summer School, 2016

Determinants of innovation
• Cohen, W. M. (2010), “Fifty years of empirical studies of innovative activity and performance”, in the Handbook of the Economics of Innovation, B. H. Hall and N. Rosenberg (editors), Elsevier, Amsterdam, 2010, 129-212.
• Size
• Market structure (competition)
• Industry characteristics: demand, technological opportunity, appropriability
• Firm characteristics
Jena, Summer School, 2016

How little we can explain
• “Innovation accounting framework” (Mairesse-Mohnen, 2001, 2003)
AE
C
EAE
Z
EAE
C
EA efZZfwwfyy )2/()()( 2222
BE
C
EBE
Z
EBE
C
EB efZZfwwfyy )2/()()( 2222
Jena, Summer School, 2016

Tobit type II model
(A1) ii uy 1
*
1 11ibx
(A2) ii uz 2
*
2 22ibx
(A3) *
2222 ))1/(ln( iiii zyyz and 11 iy if *
1iy >0
iz2 unobserved and 01 iy if *
1iy 0
iu1 | iu2 ~ N(0, ) where [ 2
21212
2
1 | ], 1 = 1.
Jena, Summer School, 2016

Three kinds of expectations
•)()|(),( 1111211 bxxyExxyE iiiiii (4)
1 12 1 2 2 1 2 1 2 2 1 2 1 2( | , ) ( , ) ( , )
ii i i i i i i i i i i i i
x bE y x x y f u u du du y f u u du du
(5)
1 12 1 2 1 2 1 2 1 1 1 1 2
2 1 2 1 2 1 2 1 1
( | , , 1) ( , | )
or
( | , , 1) ( | , ) / ( )
ii i i i i i i i i i i
x b
i i i i i i i i
E y x x y y f u u u x b du du
E y x x y E y x x x b
(6)
Jena, Summer School, 2016

Intensity of Innovation Unconditionally on Being Innovative
Source:
European
intensity
Industry
effects
Size
and Group
effects R&D effects
Environ-
ment effects
Sum of
structural
effects
Expected
intensity Innovativity
Observed
intensity
High-tech Industries
Belgium 34.7 -1.2 2.6 0.9 0.7 3.0 37.7 0.2 37.9
Denmark 34.7 1.3 -0.7 0.4 0.4 1.4 36.1 0.7 36.8
Germany 34.7 1.3 0.6 0.9 1.7 4.5 39.2 4.6 43.8
Ireland 34.7 -0.6 -2.2 0.1 -0.1 -2.6 32.1 3.1 35.2
Italy 34.7 0.4 1.1 -0.9 -1.6 -1.0 33.7 -8.1 25.6
Netherlands 34.7 -0.8 -1.1 -0.6 0.1 -2.4 32.3 1.0 33.3
Norway 34.7 -0.5 -0.2 -0.7 -1.5 -2.9 31.8 -1.6 30.2
Average 34.7 0.0 0.0 0.0 0.0 0.0 34.7 0.0 34.7
Jena, Summer School, 2016
References
• Mairesse, J. and P. Mohnen (2001), “To Be or Not to Be Innovative: An Exercise in Measurement”, STI Review. Special Issue on New Science and Technology Indicators, OECD, 27, 103-129.
• Mairesse, J. and P. Mohnen (2002), “Accounting for Innovation and Measuring Innovativeness: An Illustrative Framework and an Application”, American Economic Review, Papers and Proceedings, 92(2), 226-230.
• Mairesse, J. and P. Mohnen (2005), “The Importance of R&D for Innovation: A Reassessment Using French Survey Data”, The Journal of Technology Transfer, special issue in memory of Edwin Mansfield, 30(1-2), 183-197.
Jena, Summer School, 2016

How does innovation affect productivity?
• Product innovation
– Cannibalization
– Complementarities
– Scale economies, learning by doing
– Latent demand for the new product
• Process innovation
– Cost reduction, which can lower price, increase demand, lead to scale economies
Jena, Summer School, 2016

How does innovation affect productivity (2)?
• Part of the productivity effect may reflect monopoly power, quality improvements, i.e. price effects that do not correspond to quantity effects
• There could be complementarities between different types of innovation
– Process and organizational innovations
– Product and marketing innovations
Jena, Summer School, 2016

The « CDM » model
DiversificationMarket share
Knowledge Capital
R&D
Innovation
Productivity
SizeIndustry
Demand PullTechnology Push
Physical CapitalSkills
Jena, Summer School, 2016

Some references
• Crépon, B., E. Duguet and J. Mairesse (1998), “Research and Development, Innovation and Productivity: An Econometric Analysis at the Firm Level”, Economics of Innovation and New Technology, 7(2), 115-158.
• Mairesse Jacques, Pierre Mohnen and Élisabeth Kremp, « The Importance of R&D and Innovation for Productivity: A Reexamination in Light of the 2000 French Innovation Survey », Annales d’Économie et de Statistique, 79/80, 487-527, 2005.
• Hall, B.H., 2011. Innovation and productivity. Nordic Economic Policy Review, 2, pp.167-204.
• Mohnen, P. and B. Hall, “Innovation and productivity: An update”, Eurasian Business Review, 3(1), 47-65, 2013.
Jena, Summer School, 2016

One Possible Structure of CDM model
Variables:
Endogenous in blue
Exogenous in black
R&D
selection
R&D
intensity
Process
innovation
Product
new to
market
innovation
Labor
productivity
Industry x x x x x
Size x x x x x
Group x x x x x
Government support x x x x x
Cost push x x x
Demand pull x x x
International x x
Cooperation x x
Diversification x x
Market share x x
Cooperation x x
Sources of information:
Internal (firm, group) x x
Market (suppliers) x x
Basic (univers., public labs) x x
Tacit (exhibits, conferences) x x
Materials/employee x
Capital/employee x
Process innovation x
Product innovation x
R&D/ employee x x ((x))
Jena, Summer School, 2016

Different direct and indirect estimates of productivity elasticities (in %) with respect to R&D
High-Tech Industries
Estimates of productivity elasticities
with respect to R&D*:
R&D
per
employee
Through
Products
new to the
firm
Through
Products
new to the
market
Through
Patent
holdings
Correcting only for selectivity
(complete model - full sample)
3.40
(0.52)
0.02
(0.56)
0.00
(0.31)
0.04
(0.36)
Correcting only for endogeneity
(complete model – sub-samples)
4.50
(1.44)
3.80
(1.57)
3.73
(1.39)
4.44
(1.59)
Correcting for selectivity and
endogeneity
(complete model - full sample)
4.28
(0.93)
4.55
(1.13)
4.37
(0.99)
4.88
(1.14)
Mairesse, Mohnen, Kremp, AES, 2005 report importance of correcting for endogeneity and selectivity
Jena, Summer School, 2016

Jena, Summer School, 2016

Jena, Summer School, 2016

Jena, Summer School, 2016

Jena, Summer School, 2016

Stylized results using continuous measures of innovation
• Elasticity of productivity w/t sales of new products/employee: positive, significant, around 0.25
• Elasticity lower and more volatile if w/t share of sales due to new products
• Lower elasticity if dependent variable = growth instead of level of productivity
• Lower elasticity if human capital or physical capital is controlled for.
• In general, lower elasticities for manufacturing than for services
• In general, elasticities are similar with products new to the firm and products new to the market.
Jena, Summer School, 2016

Stylized results using dichotomous measures of innovation
• Individual indicators of innovation yield positive and significant coefficients
• Simultaneous introduction of various innovation indicators often yields non-significant coefficients, and if one is significant it is more often product than process
• Process innovation has often a negative coefficient if together with product innovation intensity
• Less significant semi-elasticities if growth regression
• New-to-market stronger than new-to-firm innovations
Jena, Summer School, 2016

Difficulties
• Identification problems– The stronger measure (intensity) dominates
– Product and process often occur jointly
– Effect of process innovation more difficult to identify because less of a revenue effect
• Results less informative because:– Timing is unclear (3-year period)
– Magnitude of success is unknown
– No correction for size
Jena, Summer School, 2016

Persistence
• If a firm has innovated in the past, will it keep on innovating in the future?
• Difference between true persistence (having innovated in the past) and spurious persistence (unobserved individual effect)
– True persistence of innovation found by Peters (2007, 2009), Duguet and Monjon (2001), Cefis (1996), Raymond et al (2007)
– More in innovation input than in innovation output
– More in high-tech than in low-tech
Jena, Summer School, 2016

Complementarities
• Edgeworth complementarity “doing more of one thing increases the return of doing more of another thing”
• Scattered evidence– Complementarity product-process innovations: Miravete and Pernias
(2006), Martinez-Ros & Labeaga (2009), Ballot, Fakhfakh, Galia, Salter (2012), Polder, van Leeuwen, Mohnen, Raymond (2010)
– Schmidt and Rammer (2007): Product and process innovations lead to higher cost reductions or new-to-market product innovation when combined with both organizational and marketing innovations
– Productivity gains from innovation often involves organizational innovation (alone, with process, with product and process) (Polder et al, 2010)
– Contingencies (Ballot et al, 2012): complementarity may depend on size, knowledge intensity, may show up in some countries, not in others.
– Importance of correcting for unobserved heterogeneity (Miravete and Pernias, 2006)
Jena, Summer School, 2016

Miravete and Pernias (2006)
• MIRAVETE, E. and J. PERNÍAS (2006), “Innovation complementarity and scale of production”, Journal of Industrial Economics, 54, 1-29.
• Output, product and process innovations: complementarity?• Spanish firm data, 1988 and 1992.• Panel data allow the control for unobserved heterogeneity• Objective function is unobserved, hence CORR approach• Unconditional correlation points to complementarity.• Conditional correlations, i.e. on the (generalized) residuals of reduced
form regressions, also point to complementarity. Differences in firms’ characteristics suffice to account for previously observed differences in magnitudes of pairwise correlations.
• Correlations among firm strategies disappear when unobservable heterogeneity is controlled for.
Jena, Summer School, 2016

Cassiman and Veugelers (2006)
• CASSIMAN, B. and R. VEUGELERS (2006), “In search of complementarity in innovation strategy: Internal R&D and external knowledge acquisition”, Management Science, 52(1), 68-82).
• Belgian firms, CIS1• Make (own R&D) and buy (license, R&D contracting, take over, hire away):
binary variables• Positive effect of make and buy in regression explaining share of sales due
to new products• Positive correlation of the error term in a bivariate probit after controlling
for industry, size and innovation intensity, but no more once basic R&D reliance and effectiveness of strategic protection are included (source of complementarity)
• Two-step estimation where the NoMakeNoBuy, MakeOnly, BuyOnly and MakeAndBuy binary observations are instrumented by predicted probabilities from a binary probit or a multinomial logit: interaction term no longer significant (probably because of poor instruments)
Jena, Summer School, 2016

Suggestions of improvement
• Harmonization of surveys across countries• Stability of questionnaire over time, at least for core questions• More information about non-innovators • Follow a core of firms survey after survey: longitudinal data• Examine the sensitivity of the results to respondent, to order
of questions• Merge innovation survey data with other data• Ease access to data • Collect data on groups and especially on multinationals• Collaboration between researchers and statisticians
Jena, Summer School, 2016

What have we learned?
• Using innovation surveys, confirmation of magnitude and significance of rates of return to R&D
• Complementarity between different types of innovation: mixed results
• Importance of non-technological innovation• Importance of spillovers, hence level of aggregation of the
analysis matters• Importance of dynamics: length in time dimension of the
analysis matters; persistence• Less evidence of feedback from productivity to innovation
than of innovation causing productivity• Causality?
Jena, Summer School, 2016