introduction to earth’s changing environment. 4 branches of earth science 1) astronomy-the study...
TRANSCRIPT

INTRODUCTION TO EARTH’S CHANGING
ENVIRONMENT

4 BRANCHES OF EARTH SCIENCE
• 1) Astronomy-The study of the solar system and universe. All matter, time energy and space.• 2) Geology-The study of the Earth’s origin,
history, structure and processes• 3) Meteorology-The study of the Earth’s
atmosphere. (Weather and Climate)• 4) Oceanography-The study of the Earth’s oceans.
(waves, tides and currents)

OBSERVATION• A fact about the environment produced by one or
more human senses-sight, hearing, touch, taste, smell• Examples: Rough, bright, sweet, red etc.

INFERENCE•A judgment based on observations•An educated guess. (Synonym: hypothesis.)• Ex: weather forecasts

CLASSIFICATION:
• Grouping things with similar properties together Examples: For living things we use Kingdom,
Phylum, Class, Order, Family, Genus, Species. For stars: The H-R diagram(Classification of Stars Diagram.) For minerals: The Properties of Common Minerals Chart. (Find the Classification of Stars Diagram and Properties of Common Minerals Chart in Earth Science Reference Tables. (ESRT)

MEASUREMENT• Comparing a known standard to an unknown
object• Must have a NUMBER and UNIT to mean
something-Ex. 6.25 cm 24o c 6 hrsExample: When you’re using a ruler, you’re comparing the
object being measured to the ruler’s standard units.
Day 3:

3 FUNDAMENTAL UNITS OF MEASURE
1. Length• Kilometers, meters, centimeters,
millimeters
2. Mass• Kilogram, gram, milligram
3. Time• Year, day, hour, minute, second

DERIVED UNITS OF MEASURE
• 2 or more fundamental units of measure used together.• Ex. Speed: m/s – meters per second• Ex. Volume: cm3 – cubic centimeters• Ex. Density: g/cm3 – grams per cubic
centimeter
ERROR
There is no such thing as a perfect measurement ……
All human measurements contain error All human measurements contain error because they are just appoximations because they are just appoximations of the true value. Scientists agree on of the true value. Scientists agree on values and call them accepted valuesvalues and call them accepted values
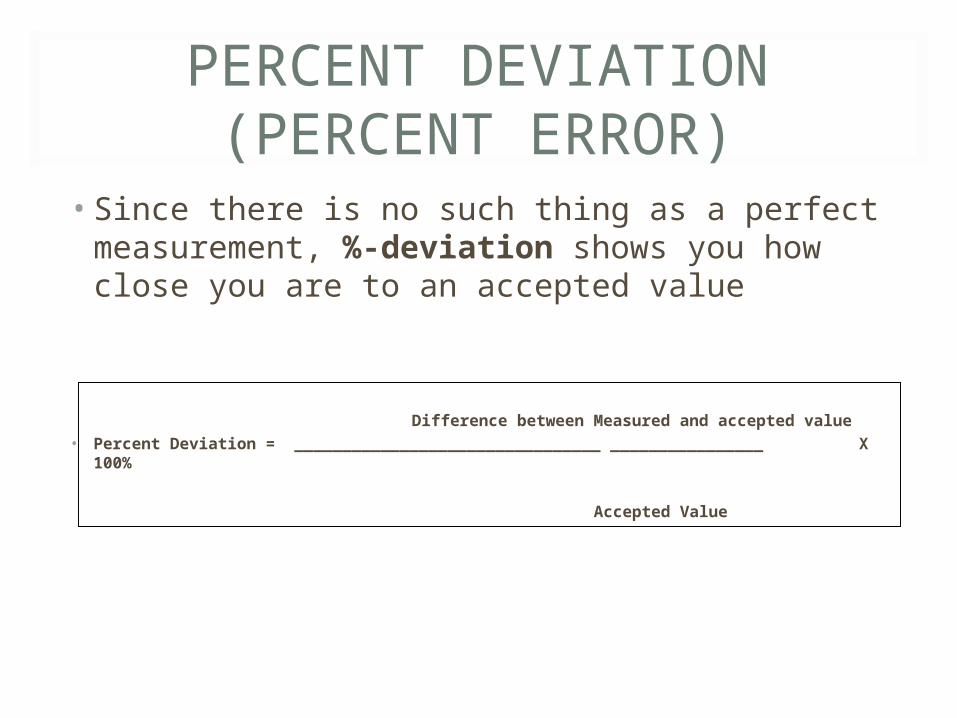
PERCENT DEVIATION (PERCENT ERROR)
• Since there is no such thing as a perfect measurement, %-deviation shows you how close you are to an accepted value
Difference between Measured and accepted value• Percent Deviation = ________________________________ ________________ X 100%
Accepted Value

SAMPLE %-DEVIATION (PERCENT ERROR)
Example (put in your notes):
A student found the air temperature to be 86.7ºF. If the correct temperature was 85.0ºF, what was her percent deviation? Show equation, plug in numbers and solve! Answer is on next slide.

DID YOU GET:
•2.0%•If not, try again!•Remember, the top number in the fraction must be positive, and you must divide by the real or accepted value.

SAMPLE %-DEVIATION (PERCENT ERROR)
1. A student found the mass of a rock to be 12.0 grams. If the actual mass of the rock was 10.0 grams, what was his percent deviation?
2. Mary estimated there were 728 marbles in a jar. When she actually counted them, she found it contained 800. What was her percent deviation?
3. A student found the density of a rock to be 7.3 g/cc. If the actual density was 7.5 g/cc, what was the student’s percent error?

CLASS WORK
•Do Observation and Measurement worksheet.•Go over.•HW: pp.4-5, 1-9 m/c

SCIENTIFIC NOTATION
• A standardized way to express very large (or very small) numbers.• Scientific Notation:
____ X 10__
# must be exponent(+ or -) between 1.000… and 9.9999…
Day 4:
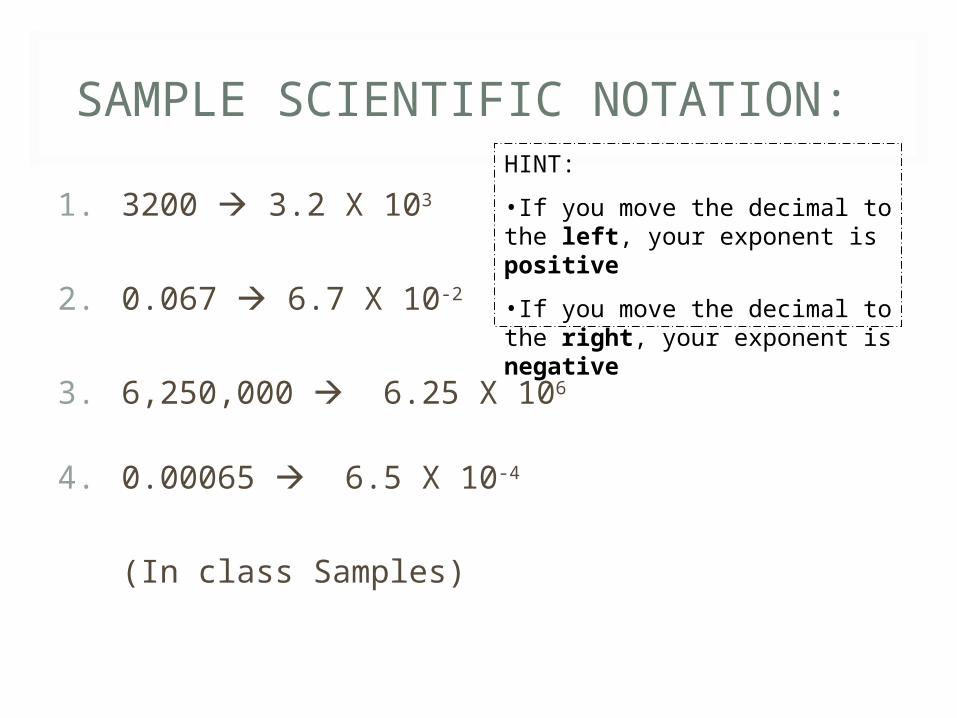
SAMPLE SCIENTIFIC NOTATION:
1. 3200 3.2 X 10³
2. 0.067 6.7 X 10⁻²
3. 6,250,000 6.25 X 10⁶
4. 0.00065 6.5 X 10⁻⁴
(In class Samples)
HINT:
•If you move the decimal to the left, your exponent is positive
•If you move the decimal to the right, your exponent is negative

CLASSWORK
•Scientific Notation work sheet•Go over.

DENSITY:
• Measure of how closely packed molecules or atoms are in a material
• Density = Mass / Volume• Density = Amount of Matter (grams)
Amount of space it takes up
(cc, cm3, or ml)
Units: g/cc; or g/cm3; or g/ml
Day 5:

DEFINITIONS
• Mass: The amount of matter in an object. Measured with a scale/balance.• Volume: The amount of space an object takes up.
There are at least 2 ways to find volume. See next slide!

2 METHODS OF VOLUME CALCULATION:
• Regular VolumeRegular Volume V = Length x Width x Height of a regular shaped object •Usually measured in cubic centimeters (cc) or cm3
• Volume by Volume by DisplacementDisplacement• Place a known volume
of water in a grad. cylinder• Place the irregularly
shaped object in the graduated cylinder with the water; record new volume• Subtract the starting
volume from your new volume to get the volume of the object.

CALCULATING DENSITY, MASS OR VOLUME:
• Covering a letter on the triangle leaves how to solve it. Cover D leaving M/V, etc.
• Mass=? Volume=? Try to solve. Answers next slide.• When using equations, there will always be
units !!!!!!!!
D
M
V

•D = M/V
•M= DxV
•V=M/D

DENSITY SAMPLES:
1. If a rock sample has a mass of 25.0 grams and a volume of 12.5 cc, what is its density?
2. If a sample has a density of 2.5 g/cc and a mass of 50.0 grams, find its volume.
3. If a sample has a volume of 300.0 cc and a density of 4.5 g/cc, find its mass.
Answers next slide.
ANSWERS
•1) 2.0 g/cc•2) 20 cc•3) 1350 gNote the units. If you’re solving for volume, the
answer is the unit for volume, in this case, cubic centimeter or cc. If you solving for mass, the answer is the unit of mass gram (g.)

CALCULATE THE DENSITY
OF THEFOLLOWING IN
YOURNOTEBOOKS:
ANSWERS NEXT SLIDE.

ANSWERSALUMINUM: 2.7G/CC
WATER: 1.0G/CCBALSA WOOD: 0.4 G/CC
WHICH SUBSTANCE FLOATS ON WATER? WHICH SINKS?

WHY WERE ALL THE DENSITY ANSWERS THE SAME FOR EACH SUBSTANCE?
• The density of a pure, solid substance is always the same no matter how much of it there is!!! (Except when you change the temp. and/or pressure of/on the substance.)•Density equations mathematically shrink or expand substances so they are the same size. This makes it easier to understand their densities in relation to each other.

FACTORS AFFECTING DENSITY•Temperature: • As T Increases, D decreases• As T decreases, D increases
Pressure: • As P increases, D increases• As P decreases, D decreases

EXAMPLE
• When you heat an object, it’s volume gets bigger but the mass stays the same so the density decreases. Think about the fraction ½. If the bottom number gets bigger, the fraction gets smaller. Like ½=0.5, ¼=0.25, 1/8= 0.125 . I know what fraction of a pizza I’d want for lunch! The same works for density. If the volume shrinks when it’s cold, the bottom number gets smaller while the mass stays the same so the density increases. Boooo yaaaaa!

CLASSWORK
•Density work sheet.•Go over answers.•HW: p. 7, 10-18

QUIZ TOMORROW
• Study density triangle• Use it to find 3
equations, one to solve for mass, then volume, then density.• Make sure to use
proper units with answers.

FLOTATION:
• Material with the lower density will float in a material with a greater density• Water reaches its maximum density at 4ºC. That
means ice is less dense. That’s why it floats! Find the density of water on the cover of your ESRTs.

CHANGE•When the characteristics of part of the environment are altered. All change involves the flow of energy across an interface (a boundary)

2 TYPES OF CHANGE
•Cyclic Change•Change that repeats in a predictable pattern• Ex: tides, moon phase cycles, length of daylight, length of night, seasons.
•Non-cyclic Change•Random change• Ex: Weather conditions, volcanic eruptions, earthquakes.

FRAMES OF REFERENCE DESCRIBE CHANGE
1.Time– How long it took for a change to
occur
2.Space– Where the change occurred

RATE OF CHANGE• A measure of how fast a change occurs
RATE OF = Change in field ValueCHANGE Time
Day 7:
SAMPLE RATE OF CHANGE PROBLEMS
1. A student moved 12.0 meters in 8.0 seconds. What was his rate of travel?
2. When it began snowing at 6PM there was 4 inches of snow on the ground. By 9PM there was 12 inches of snow on the ground. What was the rate of change for the snowfall from 6PM to 9PM (to the nearest 1/10th)?

ANSWERS
•1) 1.5 m/s•2) 2.7 in/hr•Did you have Units? BOOM!

GRAPHING RATE OF CHANGE:
• Graph the following data using appropriate scales on a sketch graph in your notes. (You draw and add numbers.) Time will be your X axis!
Temperature inside a car was noted as shown: 7AM - 18 degrees C
8AM - 20 degrees C9AM - 24 degrees C10AM - 28 degrees C

GRAPHICAL RELATIONSHIPS
• A relationship showing how one thing affects another• Direct Relationship:• One quantity increases and the other one also increases• As X increases, Y increases. If you’re solving for volume,
the answer is the unit for volume, in this case, cubic centimeter or cc.
Independent Variable – “X”
Dependent Variable – “Y”
Day 9:

INDIRECT RELATIONSHIP
• When one quantity increases causing the other to decrease
-as X increases,Y decreases.
Dependent Variable – “Y”
Independent Variable – “X”

“NO CHANGE” RELATIONSHIP
• What ever X does, it does not change Y. No relationship.As X increases, Y stays the same,
dependent Variable – “Y”
independent Variable – “X

CYCLIC RELATIONSHIP
• This graph shows a repeating change. Often called a cyclic change. As X increases, Y increases, decreases, increases etc.
- Ex. seasonal changes- Ex. Tidal charts
dependent Variable – “Y”
independent Variable – “X

WHAT DOES THIS GRAPH SAY?
As heat increases, body odor increases. The line tells you what the Y axis (B.O.) is doing.
Body odor
Day 9:
Heat

HOMEWORK
1. Pp. 10-11, 19-282. Pp. 12-14, 29-39, Part A, 1-15