introduction - page web viewbooklet 4: irrigation essentials . introduction . this booklet is the...
TRANSCRIPT

Booklet 4: Irrigation Essentials
Introduction This booklet is the fourth of the series of six booklets providing a comprehensive resource for irrigation managers and operators in New Zealand.
This booklet covers the background resource information needed to successfully design, install and manage irrigation. It includes - soil water properties, climate and weather, and the crop being grown.
Figure 1 summarises the interaction of soil, climate and the crop – a field scale irrigation water cycle.
Figure 1: Irrigation water cycle
1
water table

Key Concepts Soil Water Terminology Soil Texture Soil Profile Soil Water Holding Capacity Soil Infiltration Rate
Soils
The Importance of Soil
Soil is a short-term ‘water store’ for plant growth. Plants access the water held in the soil to continue growing between rainfall or irrigation events. Soils vary greatly depending on their make-up and origin. The amount of water stored and a soil’s ability to receive and release water also varies.
New Zealand has very diverse and changeable soil types. Frequently changes from deep to shallow, and coarse to fine textures are found over very short distances. For successful irrigation, a property’s soil characteristics must be verified (mapped) at farm scale (1:5,000). Public soil maps are usually mapped between 1:50,000 – 1:250,000. These provide a guide to what soil types you may find on your property but are not sufficiently detailed for irrigation. Soil water sensing technologies, such as Electro Magnetic Conductance (EM mapping) are now readily available. These allow extremely detailed soil mapping but still require ground-truthing.
Soil PropertiesSoil is made up of a mixture of mineral matter (soil particles), organic matter, water and air. A typical loam soil is made up of 45% mineral matter, 5% organic matter, 25% water, and 25% air.
Air and water occupy the pore spaces in soils. Pore spaces are the voids (holes) between the soil particles. Soil has both macro and micro pores. The macro-pores act as drains within the soil, allowing water to enter and flow through it. The micro-pores act as water stores. Air and/or water occupy approximately half the volume of soil. Fine-textured soils have more total pore space than coarse textures. As soils absorb water, the air space decreases.
For irrigation, the main soil properties of interest are: Texture Structure Depth Water Infiltration Rate Drainage Characteristics Upward Water Movement (Capillary Rise).
TextureTexture is important as it influences a soil’s:
Water holding capacity Drainage characteristics
2

Water infiltration rate Upward water movement (capillary rise)
Soil texture describes the particle sizes in soil. Particles are grouped as
1. clay (<0.002mm)2. silt (0.002-0.05mm) 3. sand (>0.05mm)
Soil texture description is based on the fractions of particle sizes present. The soil texture triangle in Figure 2 shows soil texture names with the proportions of sand, silt and clay in each.
Figure 2: Soil texture triangle labels soil textures according to proportions of sand, silt and clay
For example, the blue arrows in Figure 2 show a soil with 50% sand, 20% silt and 30% clay. It fits within the “sandy clay loam” description.
Methods for determining soil texture are provided in the extension resources.
3

Figure 3: Soil profile with three main horizons
Soil Profiles and HorizonsA soil profile is composed of successive layers known as horizons (Error: Reference source notfound3).
Many New Zealand soils are formed from alluvial (river borne) or loess (wind borne) deposits. Soils may have many horizons, each laid down at different times with different materials. Because of this, the texture of each horizon needs to be determined. This in turn will determine the characteristics of the whole soil profile.
Organic Matter Typically, the upper most layers or horizons have the most organic matter. Organic matter is important as it improves soil structure by acting as a binding agent. It causes soil to clump together forming soil aggregates. Organic matter can hold up to 90% of its weight in water and releases nearly all of it for plants to uptake. The combination of these attributes improves the soil's ability to take-up and hold water.
Soil StructureStructure refers to the arrangement of, and connections between, soil particles. Structure is a function of the texture and organic matter. Soil structure influences many important soil properties: rate of water infiltration, water holding capacity, aeration, and drainage, because of its effects on pore size and connectivity. Well-structured soils have a network of inter-connected pores which enable water to infiltrate and drain easily. Compacted soils have fewer and unconnected pores resulting in a slower flow rate into and through it.
Soil DepthA combination of texture, structure and depth determine a soil’s water holding capacity. Generally, the deeper the soil the greater its water holding capacity, however many New Zealand soils have pans (permanent or seasonal) or other impermeable layers that inhibit or exclude water and plant root penetration. Also, some soils frequently become water logged, particularly during the winter months. The anaerobic (no air) conditions that water logging creates limits or reduces rooting depth.
4

Soil Drainage and PermeabilityA soil’s permeability and drainage characteristics control the rate of water movement through it (permeability) and out of it (drainage).
Generally, coarser, well-structured soils have better permeability and drainage properties. Rain and irrigation entering (infiltrating) the soil can easily move through it, filling it to capacity and draining the excess.
Key features that indicate problems with permeability and drainage are brown and grey mottling (a sign of extended wetness) or very grey or pale soils (a sign of water logging). Hard and compacted layers or very fine textured layers can cause slow movement. Anything that stops root penetration reduces the plants’ access to soil moisture (and nutrients).
Water logging from slow permeability and drainage, or high water tables make plants more drought prone by reducing their effective rooting depth.
Upward Capillary FluxCapillary forces in the soil allow water to move upwards against the force of gravity. Fine pores pull water from wetter (high water potential) to drier (low water potential) zones.
The effect is that water from below the root zone can move up from the water table and supply crop needs. Soil moisture measurement is the only way to monitor what is happening if your soil is subject to capillary rise.
Water Holding Capacity (WHC)Soil holds water like a sponge. It soaks it up until it can hold no more, then it drains. The total amount that can be stored is the Water Holding Capacity (WHC) of the soil.
WHC is dependent on texture, structure and depth of the soil. Coarse textured sandy and gravelly soils have low water storage and fast drainage. Silts and clays retain more water and drain slower.
WHC is usually expressed in millimetres (equivalent to rainfall) held per depth of soil (mm/100mm), which is the same as percentage soil moisture. For example 25mm (water) per 100mm of soil is equivalent to 25% soil moisture.
Water Holding Capacity PropertiesFigure 4 shows how soil water is held in the macro and micro pores between the soil particles. Water is held in the pores by capillary action; the smaller the pore, the tighter it is held. When all the pores are full the soil is saturated. If more water is added it drains out under the force of gravity. This is drainage.
After a day or two, the macro-pores empty. Micro-pores are able to hold water against gravity so are still full. At this stage the soil is said to be at Field Capacity.
5

Figure 4: Saturation, Field Capacity and Wilting Points
Figure Water Holding Capacity is largely dependent on Soil Texture
Plants access the ‘easy-to-get water’ first, but as the soil dries, capillary forces become stronger and the plant has to work harder to draw the water from the soil. At a point termed Stress Point, plant growth is slowed and yield potential is reduced. Plants will survive beyond this point but become increasingly stressed. Stress point is variable because it is related to crop type, rooting depth and soil type.
At a certain point, plants can get no more water from the soil. At this point they permanently wilt and die. This is the Permanent Wilting Point. Beyond the permanent wilting point there is still water in the soil but it is too tightly held for the plant to uptake (hydroscopic water).
Knowledge of field capacity (full point) stress point (trigger point) and permanent wilting point (death) are vital to successfully manage irrigation.
Available Water Holding Capacity (AWHC)The term ‘Available Water Holding Capacity’ (AWHC) refers to the water held between the field capacity and the permanent wilting point. This is the total plant available water.
Figure 5 shows typical soil available water holding capacities (AWHC), field capacities (FC) and permanent wilting points (WP) for different soil textures in mm of water per 100mm of soil depth.
For the examples shown
Sands have low water storage (FC 12mm) but most of the water can be abstracted by the plant (WP 2mm) resulting in low AWHC = 10mm/100mm soil depth.
Loams have high water storage (FC 33mm) and most of the water can be abstracted by the plant (WP 13mm) resulting in high AWHC = 20mm/100mm soil depth.
Clays have high water storage (FC 38mm).However they retain much of the water and do not make it available to the plant (WP 24mm) resulting in moderate AWHC = 14mm/100mm soil depth.
Readily Available WaterThe amount of water in a soil that supports maximum plant growth is known as ‘Readily Available Water’. It is the difference between Field Capacity and the Stress Point (Figure 6).
6

Figure 6. Soil water holding terminology
As a rule of thumb only about half of the total amount of water is easily accessed by plants. The rest takes work to extract, and crop yield is decreased. So the default stress point is 50% of AWHC
Determining Available Water Holding Capacity The Available Water Holding Capacity determines the size of the soil’s storage from which plants can draw water.
This is a fundamental piece of information to design and schedule irrigation. Table 1 gives an indication of Available Water Holding Capacity for the various soil classes.
To determine AWHC four pieces of information are required:
Class Millimetres per 100 mm of soil depth
Down to 300 mm
Below 300 mm
Sand 15 5Loamy sand 18 11Sandy loam 23 15Fine sandy loam 22 15Silt loam 22 15Clay loam 18 11Clay 17.5 11Peat 20-25 >20-25
1. A soil profile split into each horizon2. The Ssoil texture of each horizonypes in the soil profile 3. Information on WHC for each texture4. The Ddepth of each horizons5. To obtain the information Information on WHC for the soil types
for 1, 2 and 4........ . . .To get 1 and 2 – find a ruler, and and a spade, and dig a hole!
SFor 3 – soils WHC information for 3, can be obtained from regional council websites and Landcare research online data base “S-Map Online”. It can be determined on site using tools such as neutron probes.
7

As WHC is very variable, even within aone paddock, caution is needed when using the regional soil maps and databasesdatabases. Such information isThe information from maps and online databases is likely to be very general and at a coarse scale. S, and both soil properties and types should therefore be checked on site. If stones are present, the water holding capacity value should be reduced by the same percentage, i.e. if stones make up 30% of the soil volume, reduce the soil water holding capacity by 30%.
Soils specialists (pedologists) can give advice based on either knowledge of how certain soil types behave, or by direct measurement.
Detailed methods to determine WHC are outlined in the ‘extension resources’ section.
Soil Infiltration RateThe soil infiltration rate is the speed at whichthat applied water, (rainfall or irrigation), can ienters absorbed by the soil. It is ddescribed as the millimetres depth of water infiltrated per hour (mm/hr).
Infiltration rates differ for eachaccording to soils typeproperties The rate at which this occurs is different for every soil and is and are also influenced by a number managementof practicesfactors. The key factors that influence soil infiltration are:
Texture -is the first influence with coarser texturessoils (sands and gravels) allow water to enter the soil absorbing water faster than finer ones (clays and silts)soils.
Management practices - these can affect the soils structural condition.; Ccultivation, stock and vehicle compaction can significantly reduce infiltration rates.
Soil Moisture – Infiltration Rrates also vary with soil moisture contentlevel, slowing as the soil becomes progressively wetter.
If water is applied faster than ithe soil can absorb it can enter the soil, ponding and/orwith associated run-off and or drainage will occur. Ponding also often results in preferential flow - drainage through the macro-pores . Applying irrigation in excess of the soil’s infiltration rateThis significantly reduces irrigation efficiency, is wasteful of the water resource and can cause crop damage.
WAny water that dis drainsing through the soil profile or runs-off overmoving across the surface is takesing valuable nutrients and topsoil with it. TSo the wastage of the water resource is then compounded by the wastage of nutrients and fertility.
Infiltration Oover Ttime Infiltration rates reduces as the soil becomes wetter. As the soil is gets wetter, the larger pores are filled first leaving the finer pores to fill after.
This means it reduces when the length of time irrigation occurs duration (time) increases.
This is shown in Figure 7Figure .
8

Figure 7:xx Soil infiltration intake curvesAs This is because the soil is getsting wetter, and the larger pores are filled first leaving the finer pores to fill after.
Table 2 Error: Reference source not found can be used to choose the appropriate an infiltration curve in Figure . Finer (clay) soils have lower curves than coarser (sandy) soils.
Management influences Compaction of soils from stock or vehicle movement, poor structure as a result of cultivation practices or stock pugging, and formation of an impermeable layer below the surface from cultivation methods all have the effect of reduceing soil infiltration rates.
Hill slopes also need to be taken into account as they also decrease infiltration rateswater is more easily able to move across the surface before soaking into the soil. TSee table 3 provides a guide to maximum infiltration rates to these.
xy
SBare, smooth soils with sparse and low ground cover allow greater movement of water across them. This gives the water more chance to move laterally before it has a chance to soak in.
9
Table 2: Intake Curve and Soil Classxy

10
Table 3: Maximum Infiltration rates on flat and sloping

Extension Rresources
Determining Soil TextureThere are various ways to determine soil texture. Soil maps and soil books Gmay give gSome guidance as to the likely soils present and their related textures can be obtained from soil maps and/or soil books. However,But on-site verification confirmation is essential to be confident – dig a hole!necessary.
The twohree main methods for determining texture are given belowdetailed:.
1. By SseparationSoil texture can be determined using a settling separation method. Sand particles suspended in water will sink faster than silt, and silt particleswhich sinks faster than clay.
Method A sieved (to remove stones and debris) soil sample is mixed into water and broken down into individual particles.
A reagent is added to break apart clumps of clay particles which otherwise can behave like sand grains.
The sample is shaken in a cylinder and the depth of soil that has settled after 1 minute (sand), 60 minutes (silt), and a day (clay) recorded. Note: After 1 day Tthere may still be some cloudiness (that is very fine clay) still in suspension in the water. If this is significant the sample should be left for a longer time period..
The proportions of sand, silt and clay are then related to used with the texture triangle to find the textural classname.
2. By FfeelA quick and accurate enough way to assess texture is to use Thein’s “texture-by-feel” method.
Follow the step-by-step example below or rRefer to the flow diagram following
Method Step 1
Place some about 50g of soil in your hand and use a spray mist bottle to moisten the soil. Let the water soak into the soil and then work it between your fingers until it is thoroughly moist. Once the soil is moist, try to form a ball.
If the soil does not form a ball, it is a SAND
IIf the soil forms a ball, go on to Step 2.
11

Step 2
Place the ball of soil between your thumb and index finger and gently push and squeeze it into a ribbon.
If the soil will not form a ribbon it is a LOAMY SAND or a SILT
If you can make a ribbon, go to Step 3.
Step 3
If the soil forms a short ribbon (<2 cm), and is:
At most slightly sticky Easy to squeeze Smooth
It is a LOAM, go to Step 4
If the soil forms a medium ribbon (2 to 5 cm), and is:
Somewhat sticky Somewhat hard to squeeze
It is a CLAY LOAM, go to Step 4
If the soil forms a long ribbon (>5 cm) without breaking, and is:
Very sticky Hard to squeeze Stains your hands and has a shine when rubbed
It is a CLAY, go to Step 4
Step 4
Wet a small pinch of the soil in your palm and rub it with a forefinger. If the soil:
Feels very gritty every time you squeeze the soil, go to A Feels very smooth (like flour), with no gritty feeling, go to B Feels only a little gritty, go to C
A. Add the word SANDY to the initial classification. Soil texture is either: SANDY CLAY SANDY CLAY LOAM SANDY LOAM
12

Figure 8:1 “S-map Online” from Landcare Research
(see smap.landcareresearch.co.nz/)
B. Add the word SILT or SILTY to the initial classification. Soil texture is either: SILTY CLAY SILTY CLAY LOAM SILT LOAM
C. Leave the original classification. Soil texture is either: CLAY CLAY LOAM LOAM
Insert “procedure for analysing soil texture” flow diagram
Determining Soil Water Hholding CcapacitiesLandcare Research has made itsis making national soils data more readily accessible through services such as “S-Map Online”. (Figure 8:1).
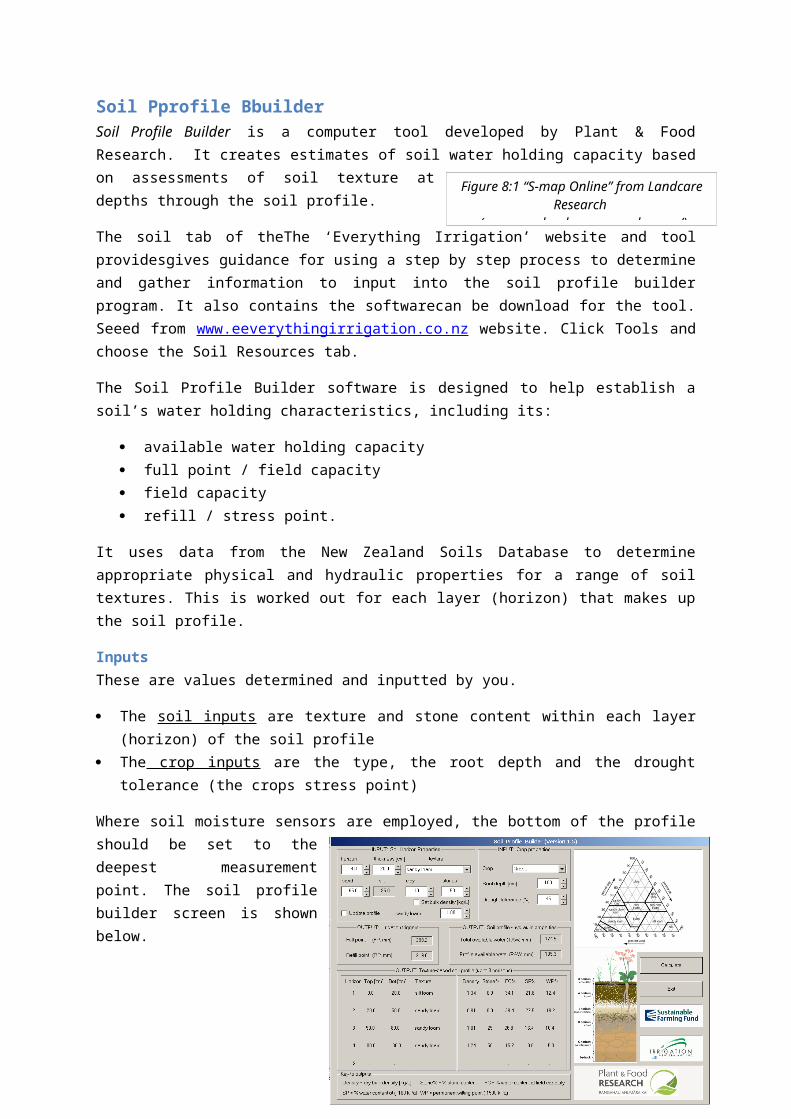
Soil Pprofile Bbuilder Soil Profile Builder is a computer tool developed by Plant & Food Research. It creates estimates of soil water holding capacity based on assessments of soil texture at depths through the soil profile.
The soil tab of theThe ‘Everything Irrigation’ website and tool providesgives guidance for using a step by step process to determine and gather information to input into the soil profile builder program. It also contains the softwarecan be download for the tool. Seeed from www.eeverythingirrigation.co.nz website. Click Tools and choose the Soil Resources tab.
The Soil Profile Builder software is designed to help establish a soil’s water holding characteristics, including its:
available water holding capacity full point / field capacity field capacity refill / stress point.
It uses data from the New Zealand Soils Database to determine appropriate physical and hydraulic properties for a range of soil textures. This is worked out for each layer (horizon) that makes up the soil profile.
13

InputsThese are values determined and inputted by you.
The soil inputs are texture and stone content within each layer (horizon) of the soil profile The crop inputs are the type, the root depth and the drought tolerance (the crops stress point)
Where soil moisture sensors are employed, the bottom of the profile should be set to the deepest measurement point. The soil profile builder screen is shown below.
Outputs The outputs give guideline
values for the full point and refill point for irrigation, plus the total available water and the readily available water in the soil profile.
14

Moisture Rrelease CcurvesMoisture or Water release curves show the relationship between the amount of water in the soil and how tightly it is held by the soil. This is the critical element in determining water holding capacity. Related terms are soil water retention curve, and soil moisture characteristic.
Note that water release curves are also known as water retention curves – referring to the amount of water retained by the soil at a given tension.
The amount of water is described as the volumetric water content, effectively the millimetres depth of water in 100mm of soil depth. It can be measured with tools such as neutron probes, or by weighing the wet soil, drying it and weighing it again (gravimetric method).
How tightly soil water is held is described by matric potential, the suction (tension) required to draw the water out from the soil. This can be measured with a tensiometer, and is usually reported as negative kilopascals (kPa). Tensiometers may be labelled in centibars (cBar) which is the same as kPa.
Figure Figure 28 shows that the water release curves are different for different soils, and there is a noticeable drop in stored volume at moderate tensions.
Moisture release curves are able to be derived determined from soil cores taken from your soils paddocks and sent to a suitably equipped laboratory. Note that considerable care is essential when taking and transporting the samples.
Critical TtensionsThere is variation in the tension values used to define critical points: field capacity, stress point and wilting point. This is due to the variety of factors that can have an effect. However, Iin general:
Field Capacity is about 10 kPa Stress Point is about 60 - 100kPa Wilting Point is about 1,500 kPa
Stress point is particularly variable, in part because it ishas strongly related to crop type as well as soil types.
15
Figure 2 8: Soil moisture release curves for a range of soils (adapted from Hodnett and Tomasella)

On-Ssite (in-situ) MmeasurementsMoisture release curves can also be determined from direct measurements made on-site. One way is to measure saturated and dry soil with a neutron probe and a tensiometer. This is usually a task for a trained specialist.
The easiest time to do this is in mid-summer when the soil is naturally very dry. Note that Permanent Wilting Point is by definition where soil has dried to the point that pasture is wilting and dying off.
A nearby area can be soaked with water over a period of days then left to drain for a day or so. This is by definition Field Capacity.
This only gives estimates of field capacity and permanent wilting point. Plotting volumetric water content (neutron probe results) against soil tension (tensiometer readings) as the wetted soil dries out can fill in the mid points to give the curve its shape.
Data Ffrom Soil Moisture MmonitoringIn irrigated areas, soil moisture information from monitoring may be available for the soil type(s) of interest. Data Historic data from field monitoring will show where field capacity is, as the content will stabilise at some level after heavy rain or irrigation. Stress point can be identified as the point at which water use starts to be limitedslow as the soil dries out. Companies providing soil moisture monitoring services usuallyshould generate soil moisture release curves for each site.
Measuring Iinfiltration RrateA process for measuring the infiltration rate of a soil is the double ring infiltration test.
Texture Structure Infiltration Permeability (mm/h)
Sand None Very rapid >120 >250
Sandy loam
Weak Very rapid >120None Rapid 60-120
Loam Moderate Rapid 60-120Weak-/Nnone
Moderate -. Rrapid
20-60
Clay loam
Moderate Moderate -. Rrapid
20-60
Weak Moderate 5-20None Slow 2.5-5
Light clay
Well Moderate 5-20Moderate Slow 2.5-5Weak Very slow <2.5
Medium to heavy clay
Well Slow 2.5-20Moderate Very slow <2.5Weak Very slow <2.5
The standard test uses a 300 mm ring inside a 600 mm ring. Both are driven 150 mm into the soil to seal, and kept filled with water throughout the test (figure 9Error: Reference source not found).
16

The outside ring saturates the soil at the same rate as the inside ring, and deals with outwards movement. The aim is for the inside ring to only have infiltration vertically down into the soil, as would occur in a rain or irrigation event.
Figure 4 Double ring set up for soil infiltration rate testing
The test continues until the speed at which water infiltrates into the soil from the inner ring is constant, and this “steady rate” is taken as the infiltration rate.
Soil infiltration rates are very variable; a crack or wormhole can make a big difference. FAO state that at least two tests should be done at a site. In practice, more are advised, . and don’tIt does not take much longer to complete more tests if multiple sets of rings are available. Table 4 gives typical infiltration vales.
The infiltration rates determines the maximum irrigation intensity without run-off or ponding.
Table 1 Typical values of infiltration and saturated hydraulic conductivity based on texture and degree of structure (Adapted from FAO)
Texture Structure Infiltration Permeability (mm/h)
Sand None Very rapid >120 >250
Sandy loam
Weak Very rapid >120None Rapid 60-120
Loam Moderate Rapid 60-120Weak/none Mod. rapid 20-60
Clay loam
Moderate Mod. rapid 20-60Weak Moderate 5-20None Slow 2.5-5
Light clay
Well Moderate 5-20Moderate Slow 2.5-5Weak Very slow <2.5
Medium to heavy clay
Well Slow 2.5-20Moderate Very slow <2.5Weak Very slow <2.5
17
Figure 3 9: Double ring set up for measuring soil infiltration rateSoil moisture release curves for a
Table 4: Typical values of infiltration and saturated hydraulic conductivity based on texture and degree of structure (Adapted from FAO)Figure 5 Soil moisture
Key Llearning’sConcepts box
Plants mainly use water primarily for cooling purposes Actual Plant Water Use (Evapotranspiration, ET)T =
Reference Crop PE/ Potential Evaporation (PET)T multiplied by* the Ccrop Ffactor Crop Ffactors and Stress PointsMAD vary with Crop Ggrowth Sstages Crop Rrooting Ddepth determines how much of the Ssoil’s Wwater Holding Capacity a
plant can access
Crops
Crop Wwater Uuse The primary function of irrigation is to maintain a steady supply of water for crops to use. Crops use water predominantly for cooling and to transport nutrients purposes, however some is also used for and then growth (tissue building). Once atFrom a full cover, a crop uses, approximately 95% percent of the its water needs foruse is due to transpiration and evaporation from the crop canopy.
Evapotranspirationn Crop water use is also known as Evapotranspiration (ET).
Evapotranspiration is a combination of two separate processes, transpiration (T) and evaporation (E):.
Crop Crop factor
Pasture 1.0Clover 1.0Lucerne 1.2Barley 1.0Wheat 1.0Maize 1.1Beans 1.0Onions 1.0Beet 1.0Potatoes 1.05Tomatoes 1.0Apples 0.85Citrus 0.8Grapes 0.8Kiwifruit 1.0Olives 0.7
1. Evaporation (E) is the water evaporated from the soil and the plant’s surface.2. Transpiration (T) is the water transpired to the atmosphere from small openings on the leaf
surfaces, called stomata (sweating). 3. Evaporation (E) is the water evaporated from the soil and the plants surface and wet soil.
18

Table 6:q Crop factorscoefficients relative to a pasture reference dropbased on pasture (Source:
NZ Irrigation Design Code of Practice (2007)
Actual Evapotranspiration (ET) is different to the Potential Evapotranspiration (PET).
Actual ET is the water that is lost by a specific crop and can be thought of as “water used”. PET can be thought of as "water need". It is the amount of water that wouldt would
evaporate and transpire from a full cover, mature crop under no stress (water, disease etc) given the local environmental conditions.
Crop water use (ET) is influenced by prevailing weather conditions, available water in the soil, crop species and growth stage.
19

How crop cover alters Crop factors Crop factor =f 1 Crop factor c=f 0.4 (accounting for
sosoil evaporation)
Crop Ffactor
Crop Crop factor
Pasture 1.0Clover 1.0Lucerne 1.2Barley 1.0Wheat 1.0Maize 1.1Beans 1.0Onions 1.0Beet 1.0Potatoes 1.05Tomatoes 1.0Apples 0.85Citrus 0.8Grapes 0.8Kiwifruit 1.0Olives 0.7
Different crops, stages of crop growth and /or different ground cover fractions create have different water demands. Irrigation management To accounts for this using a Crop Water Use Factors factors or a Crop Factor (cf) is used.
WSo when calculating water demand, the PET (of a reference crop figure) is multiplied by the crop factor to get the actual crop’s ET. If the crop factorcoefficient is smaller than 1one, the crop uses less water than reference crop, if it is larger it uses moreET and vice versa.
For example if a healthy fully fgrown maize crop is scheduled to be irrigated and the average PET forecast daily values are 4 mm for the next 10ten days. The calculation is: 4 mm x* 10 days x* 1.1(crop factorcf) = 44 mm of irrigationwater to be applied to supply the crop needs for the next 10ten days.
However, for a pasture crop the calculation is: 4 mm x* 10 days x* 1.0 (crop factor) = 40 mm.
Table 6 is taken from the New Zealand Irrigation Design Code of Practice and givesoffers a number of default peak crop factor valuess as default values Table ..
20

Table 7:q Crop rooting depthscoefficients based on pasture (Source: NZ Irrigation Design Code of Practice (2007)
Soil Eevaporation When soil is exposed, evaporation will take place until the soil's top layer (15-20 mm) is dried out. Significant evaporation occurs after rain or irrigation. Typically when using an overhead spray irrigation system the crop factor to use is not less than 0.4 because of the soil evaporation effect.
Hot Ddays On excessively hot and windy days, with PET above 8 or 9 mm/day, many of the common crops grown in NZplants cannot absorb moisture fast enough to keep up with the rate of transpiration. Even though the soil water is not limiting, they still wilt. This can be mistaken for a shortage of available water, but as soon as the temperature cools the plant will recover.
Crop Root DepthA plant's rooting characteristics determine how much of the soil moisture can be accessed by the plant. A deep rooted crop has access to a greater amount of soil moisture than does a shallow-rooted crop, usually allowing it to go longer between irrigation events.
The root depth may be affected by the soil depth, constraining soil layers or even markedabrupt changes in soil texture. Water logged soils can inhibit root growth similar to a hard pan. MFor most crops, most crops water use comes froacmtivity is in shallower roots 200 – 400mm. However, particularly for permanent crops, But even relatively sparse roots at depth can draw water.
To The best way to determine root depth is to digdigging a hole and measureing how far into the profile thethe depth of roots in the profileare present is the most accurate method. Repeat this at various places in a crop of field as it may be variable.
The range of root depths of mature crops is shown in the table 7below. .
Crop Root depth range (mm)Pasture 200 -– 500Arable crops 200 – 1000 (typically a wide range depending on crops and conditions).
Lucerne roots have been found at can exceed depths of greater than 9m!)Tree crops 800 – 2500Vine crops 900 – 5000 mmVegetable crops 250 – 600 mm (typically a wide range depending on crops and conditions
duration).
WhenIf a new crop is planned it may be necessary to estimate likely root depth from published values. Ensure an on-site soil inspection Iidentifiesying possible root restrictions. If possible, relieve or eliminate these before a crop is planted enables those restrictions to be relieved or eliminated.
Root depth influences the irrigation interval and the maximum depth of water that can be applied in an irrigation event. However, irrigation strategies that promote deep rooting are advantageous to crop resilience. Note:
21

Table 8: Example: Maximum Allowable Deficit’s (MAD’s) for different crop growth stagesq Crop coefficients based on pasture (Source: NZ Irrigation Design Code of Practice (2007)
Crop root depth can be influenced by the irrigation management. Fwith frequent small applications of water will promoteing shallower rootings as the plant does not have to grow deep roots to looking for water.
Crop Ttype and Ddemand Pprofile Many crops yield and quality can be influenced by timing and management of irrigation. Various fruit, vegetable and arable crops are managed in different ways depending on whether they are a fruiting or vegetative crop.
Plants can be manipulated by aAltering timing and amount of irrigation to carefully manage stress levels. This can encourage or discourage flowering, alter vegetative growth, avoid crop health issues and ripen or change the quality characteristics of the crop. Different crops have different critical moisture periods.Effects are crop specific.
Case study of grapes or spuds or wheat water management – FAR/ hortnz/andrew
Maximum Aallowable Ddepletion (– MAD)Maximum Allowable Depletion (MAD) is another term for the stress point. It is the amount of water allowed to be depleted from the root zone before irrigation is requiredscheduled. It is expressed as a percentage of maximum water-holding capacity of the soil. At the time of irrigation, the soil water deficit should be less than or equal to the MAD. This ensures that the crop will not suffer from water stress and will produce maximum potential yield.
The goal of irrigation is to keep the water content in the root zone above the allowable depletion level. Irrigation scheduling should consider sensitivity of the crop to water stress at different growth stages.
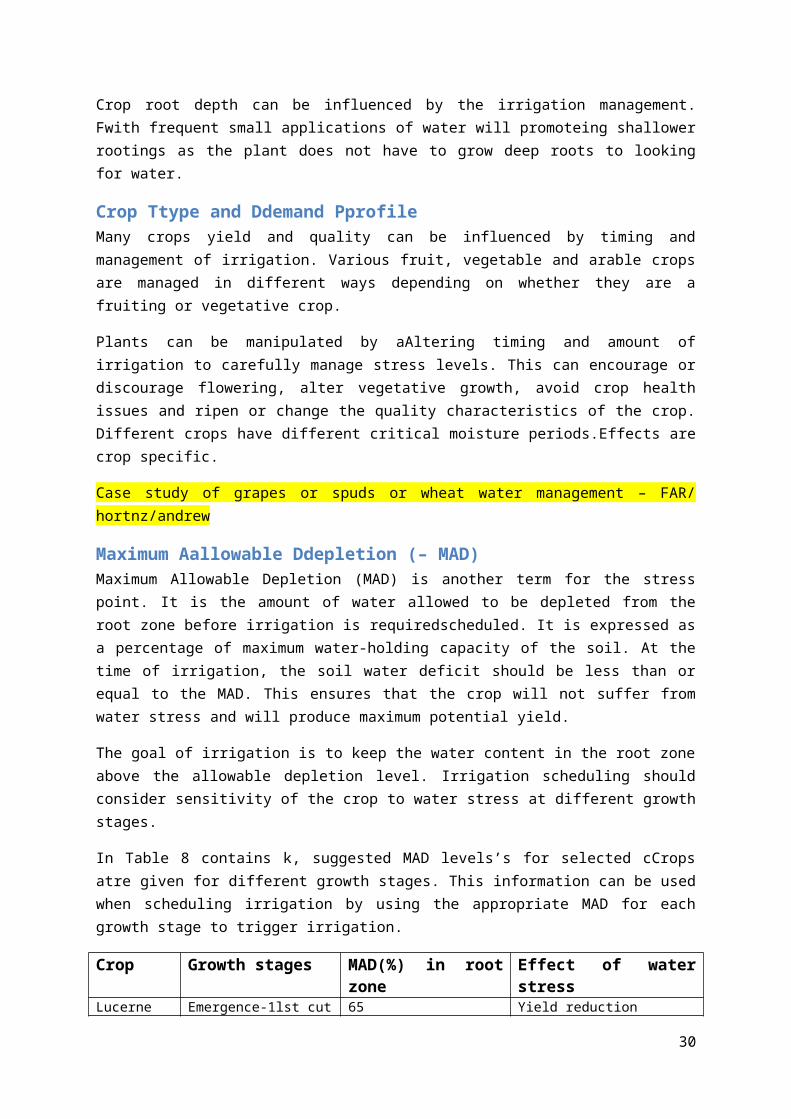
In Table 8 contains k, suggested MAD levels’s for selected cCrops atre given for different growth stages. This information can be used when scheduling irrigation by using the appropriate MAD for each growth stage to trigger irrigation.
Crop Growth stages MAD(%) in root zone Effect of water stressLucerne Emergence-1lst cut
1lst cut-2nd cut 2nd cut-3rd cut 3rd cut-4th cut
65 50 40 60-70
Yield reduction
Potatoes Early vegetative period Tuber bulking period Ripening period
40-60 30-40 65
Many jumbo and lower yield
Corn Emergence-12 leaf 12 leaf-dough Dough-maturity
60-70 50 60-70
Yield reduction of 24 kg /ha per mm of water deficit
Small grains Emergence-first node First node-flowering Milk ripe-maturity
65-70 40-60 50-70
Yield reduction of 14 kg/ha per mm of water deficit for a barley crop.
Soybeans Before flowering First flower-first pod First pod-maturity
65-70 60-65 60-70
Yield reduction
22

23

Climate and Weather The terms climate and weather are used in different ways. Climate often refers to the pasthistoric data and general trends (drier in summer, 750mm rain per year on average). whereasand Weather refers to specific days or events (25mm of rain on 18 October, 5.3mm of PET yesterday) and to futurethe (forecast) data over coming days.
The four main climate factors effecting irrigation are:
Evapotranspiration Rainfall Soil Ttemperature Wind
Evapotranspiration (ET)Average daily Evapotranspiration (ET) is used to determine likely crop water needs. It is also a determinant of an irrigation system’s peak design capacity.
Evapotranspiration is calculated from:
Solar Radiation Air Temperature Air Humidity Wind Speed
ET is high on hot, windy, dry days and low on cool, still, moist days. ET is variable over long distances (50 to 100 km) but does not fluctuate dramatically within short distances (0 to 10 km).
There can be very high daily ET values,, howeverbut an irrigation system designed to meetfor such athat demand would seldom be used to capacity. It would therefore be extremely costly (and economically inefficient) to do so. As Tthe soil offers a short-term significant water storagebuffer, typically providing with more than over a week’sa few days’ supply, most i.
Irrigationirrigation systems are designed generally aims to meet the peak ET, averaged over a week at highest demand.
RainfallKnowledge of rainfall is critical to manage irrigation. Rainfall is ‘free irrigation’ and irrigation applications should be adjusted accordingly, . although aHowever, an irrigation system’s limitations such as rotation time (return interval) must be taken into account, for example its rotation length.
Rainfall is the most variable of the critical factors, with and has significant variations over relatively short distances. Accurately measuring rainfall at theyour property is essentialrecommended for successfullyto be able to managing irrigationschedule correctly. Alternatively iInformation is available from local weather stations but may not be accurate for your site.
24

Soil TemperatureSoil temperature has a key role in plant growth. At soil temperatures below 9-10oC, plant growth slows significantly or stops and soil moisture is not the limiting factor towill not limit plant growth.
Irrigating when soils are below this temperature will not increase production. It may even decrease production by keeping the soil wet and cold for longer. A dry soil warms up faster than a wet soil. Optimum plant growth occurs between 15 - 20oC.
Soil temperature fluctuates during the day as solar radiation warms and re- radiation cools the soil. The standard for measurement is the 9am soil temperature at 100mcm soil depth.
WindWind is also a highly variable factor both from day to day and across a district. Topography can have a large effect on wind direction and speed.
The main problem of wind on irrigation is its effect on distribution pattern. A strong wind can blow sprayed irrigation water well off-target. Even a moderate wind can reduce irrigation uniformity resulting inmaking some areas being over-watered and some under-watered. Direct evaporation from wind is not significant (<5%) the main effect is the irrigation distribution, however strong winds do increase ET values.
Knowledge of wind patterns can help select a system type, or make design or system adjustments to account for its effects.
All aspects vary from day to day and season to season. Keeping accurate records and matching forecasts and crop demands with irrigation system capacity is the key to irrigation scheduling.
Sources of Climate (historical) InformationClimate data is available from a number of sources.
Regional and district council websites National Institute of Water and Atmospheric Research (NIWA) MetService Other Crown Research Institutes NZ Fire Service (Rural Fire Network) Private companies Irrigation schemes Own climate station
NIWA and MetService operates a network of high quality climate stations across New Zealand. To infill the gaps NIWA has developed a virtual grid that covers New Zealand with points 5km apart. Data from existing climate stations is used to create “virtual climate data” at each point.
As with any data, wherever possible, check the data provided makes sense for the site. Compare virtual data with any actual data available. This is particularly important in hill areas where climate trends can vary rapidly over short distances.
When collecting climate data it is important to consider the accuracy and specification level of the instruments. Climate instrumentsThey are very specialised and sensitive, and a high level of
25

maintenance is required to guarantee accuracy. This is covered in more detail in the extension section.
Sources of Weather (forecast) InformationInstantaneous and forecast weather information is available from a wide variety of media including television, newspapers, radio, and websites. Precipitation, temperature, wind and general conditions are reported in the mainstream media with more specific details of ET, region specific details and soil temperatures readily available from local newspapers and websitesand targeted print and digital media.
Numerous websites offer weather forecasts and immediate conditions. These include:
Irrigation New Zealand, http://www.everythingirrigation.co.nz/
Metservice, http://www.metservice.com/national/index
Universities e.g. http://www.metvuw.com/
Private e.g. http://www.hortplus.metwatch.co.nz/
http://www.wunderground.com/
26

Figure 116: Inner workings of Ttipping bucket rain gauge
Figure 7 Pyranometer or radiometer mounted on automatic weather station
Figure Standard rain gauge
Extension Rresources
Climate data instruments The most common examples of climate data instruments are a maximum/minimum thermometer and a rain gauge.
Rainfall Rainfall is measured in millimetres (mm). The recommended way of measuring rainfall is with a standard rain gauge (figure 10Error:Reference source not found).
The inner cylinder is filled by 25mm of rain, with overflow flowing into the outer cylinder.
Other types of gauges include the popular plastic ‘wedge gauge’ (cheap, fragile, inaccurate and not recommended).
Measurement can be automated using a tipping bucket (Figure 116) or weighing rain gauge. If choosing an automatic gauge, look for quality.
Soil temperatureThere is a range of soil temperature sensors available from hand held thermometers to automated ones that are combined with soil moisture sensors.
Solar RadiationRadiation is measured with a pyranometer (Figure 7).
Air Ttemperature and HhumidityAir sensors must be shielded from direct sunlight. Current technology may combine sensors, or use separate ones for temperature and humidity.
Wind SspeedWind speed is traditionally measured with a spinning cup anemometer, and wind direction with a
weather vane. New technology does both with one unit.
Recording OoptionsThere are many electronic data gathering and logging options available. These can range from relatively low cost sensors for single variables, to automatic weather stations fitted with multiple sensors and telemetry. Manual recording requires a regular time commitment that can be reduced by use of electronic data loggers and /or telemetry.
Data loggersData loggers record the data in-situ and have to be downloaded manually.
27

Telemetry Telemetry is an automated communications process by which data is collected from instruments and transmitted to receiving equipment for monitoring, display, and recording. The data can be transmitted at varying intervals or live streamed for real time display and monitoring. It uses either cell phone or radio-wave connections.
A fully telemetered climate station with robust loggers and automated data transfer is very convenient but costly.
Sensor OoptionsThere are numerous sensors available at a range of prices. QRank quality and reliability should be high on the listly when making purchasing decisions. Maintenance is an on-going cost and must be done regularly. It makes sense to consider community owned, high quality, professionally serviced climate station options.
When comparing options consider the following:
1. Precision The resolution to which the sensor can measure a variable (e.g. 0.1 versus 0.5oC temperature) – what do you require?
2. Accuracy The closeness of a sensor reading to actual conditions – this will be no less than plus or minus the sensor precision – again what do you require?
3. Range Will the sensor record over the full range of expected conditions? If not, does it matter (a frost is a frost)?
4. Reliability Is the sensor robust and suitable for use in the intended location? Many of the less expensive loggers are not suited to long term outdoor use.
Data LloggingAs with sensors, there are many data logger options.
Considerations include:
Quality. If a data logger fails before data has been down loaded it is lost forever. Good quality data loggers are not cheap.
Number of inputsEach sensor requires a separate input. Add up the things you may want to monitor, now and in the near future. Inputs could include:
Rainfall Ground surface temperature
Humidity Soil temperature
28

Leaf wetness Air temperature
Wind speed Soil moisture (shallow)
Wind direction Soil moisture (deep)
Solar radiation Soil moisture (medium)
It doesn’t take long to reach a large number of potential sensors and readings to record.
Logging capacity How long can the logger run unattended? How often are you prepared or able to download it? Three months is a good minimum to aim for.
Programming How is this done and how hard is it to do? Ideally you should be able to drive the logger without reading the manual.
Climate Stations
On farm climate stations are a feasible option to monitor and collect climate parameters specific to a your property. A typical on-farm climate station set-up is shown in figureFigure .
LocatingSiting a Climate Station To obtain accurate measurements site selection is critical. The main considerations are:
29Figure 8 All equipment needs regular
maintenance and calibration. The information is very valuable, and care
must be taken in its collection.
Figure 9 10m high wind speed measurement requires a significant mast. Lower measurements require correction for standard climate data use
The climate station must be sited at a distance which is beyond the influence of obstructions such as buildings and trees.
What factors to measure. This is dependent on the purpose i.e. irrigation scheduling, frost protection, plant observations.
Accessibility and security .
In addition to site location it is essential routine quality assurance activities are undertaken on the resulting data.
Annual inspections/calibrations must be carried out to verify the condition and exposure of the sensors.
Requirements of Mmeasuring Eequipment and Ssensors
Wind Speed and Direction – Anemometer Located over open level terrain
Distance away from the nearest buildings, trees or obstructions of at least x10 the height of obstruction.
Standard measurement height is 10 metres. A correction can be applied to convert non-standard heights to 10 metres.
Measurement heights below 3m are generally not recommended.
Air Temperature and Humidity – Thermometer and Hygrometer / Psychrometer Housed in a ventilated radiation shield
Located a distance of at least x4 the height of nearby buildings, trees, or obstructions
At least 30 m from large paved areas
Sited in an open level area, at least 9 m in diameter, with short mown grass or bare soil
Standard measurement height 1.25 to 2.0m
Housing location must avoid: large industrial heat sources; rooftops; steep slopes; sheltered hollows; high vegetation; shaded areas; swamps; areas that snow drifts; low spots that pool water after rain.
Solar Radiation – Pyranometer Mounted away from shadows, reflective surfaces, and sources of artificial radiation General
recommendation: no obstruction above the 10o horizontal plane
Mounting should be on the northernmost part (by either crossarm or pyranometer mounting arm) of the climate station to minimise shading from the other climate station structures
Mounting height is not critical. However, pyranometers mounted at heights of 3 metres or less are easier to level and clean.
30
Figure 11: a Typical on-farm climate station set-up

Soil Temperature The measurement site for soil temperature should be at least 1 m2 and typical of the surface of
interest
The ground surface within the immediate area (10m radius) should also be level and have ground cover representative of the conditions to which it is being applied
31

The standard measurement depth for agriculture is 0.1 metres.
32

Guidelines for the Specification of Agricultural Irrigation Systems
References See: Presley and Thein, Estimating Soil Texture By Feel, Kansas State University MF-2852http://www.ksre.ksu.edu/library/crpsl2/mf2852.pdf
C Hedley, J Ekanayake and P Roudier. Wireless soil moisture sensor networks for precision irrigation scheduling. Accessed via: www.massey.ac.nz/~flrc/workshops/12/paperlist12.htm
Soil Water Retention (Release) Curve. Soils, Agron 305. Accessed via: www.agronomy.ksu.edu/teaching/p.aspx?tabid=51
The FAO website and “Chapter 2: Physical aspects of crop productivity.”www.fao.org/docrep/V9926E/v9926e04.htm
Coloradao State university – Extension website “Crop water use and growth stages”
http://www.ext.colostate.edu/pubs/crops/04715.html
Australian Bureau of Meteorology (1997). Observation Specification 2013.1: Guidelines for the siting and exposure of meteorological instruments and observing facilities.
US Environment Protection Agency (2000). Meteorological Monitoring Guidance for Regulatory Modelling Applications, EPA-454/R-99-005. Office of Air Quality Planning and Standards, North Carolina.
World Meteorological Organisation (1983). The Guide to Agricultural Meteorological Practices (WMO-No.134). Chapter 2 (updated 2010) Agricultural meteorological variables and their observation.
33