introduction into r for historians (part 1: introduction)
TRANSCRIPT

Quantitave research methodsStatistical Software
Introducing R vocabularyGetting help
Installing R and RStudio
Introduction into R
Richard L. Zijdeman
28 May 2015
Richard L. Zijdeman Introduction into R

Quantitave research methodsStatistical Software
Introducing R vocabularyGetting help
Installing R and RStudio
1 Quantitave research methods
2 Statistical Software
3 Introducing R vocabulary
4 Getting help
5 Installing R and RStudio
Richard L. Zijdeman Introduction into R

Quantitave research methodsStatistical Software
Introducing R vocabularyGetting help
Installing R and RStudio
Quantitave research methods
Richard L. Zijdeman Introduction into R

Quantitave research methodsStatistical Software
Introducing R vocabularyGetting help
Installing R and RStudio
Why
To answer descriptive and explanatory questions on populations
Richard L. Zijdeman Introduction into R

Quantitave research methodsStatistical Software
Introducing R vocabularyGetting help
Installing R and RStudio
Workflow: PTE
problem (research question)theory (hypothesis)empirical test . . . with loops between T-E and P-T-E
Richard L. Zijdeman Introduction into R

Quantitave research methodsStatistical Software
Introducing R vocabularyGetting help
Installing R and RStudio
Research Questions
descriptive (to what extent. . . )comparative (comparing two entities)
trend (comparison over time)
explanatory (focus on mechanism at hand)
Richard L. Zijdeman Introduction into R

Quantitave research methodsStatistical Software
Introducing R vocabularyGetting help
Installing R and RStudio
Theory
deductive reasoningexplanans
general mechanismcondition
explanandum (hypothesis)
Richard L. Zijdeman Introduction into R

Quantitave research methodsStatistical Software
Introducing R vocabularyGetting help
Installing R and RStudio
Empirical test
sample vs. populationrandom vs. stratified samplestesting technique, e.g.:
T-test, correlation, regression
Software required for faster analysis
Richard L. Zijdeman Introduction into R

Quantitave research methodsStatistical Software
Introducing R vocabularyGetting help
Installing R and RStudio
Statistical Software
Richard L. Zijdeman Introduction into R

Quantitave research methodsStatistical Software
Introducing R vocabularyGetting help
Installing R and RStudio
The dangers of analysing with spreadsheets(e.g. MS Excel)
tempting to input and clean data in the same sheetdifficult to track cleaning rulesdefaults mess up your data (e.g. 01200 -> 1200)
Richard L. Zijdeman Introduction into R
Quantitave research methodsStatistical Software
Introducing R vocabularyGetting help
Installing R and RStudio
Why use syntax (scripting)
Efficiency (really)Quality (error checking)ReplicatabilityCommunication
Richard L. Zijdeman Introduction into R
Quantitave research methodsStatistical Software
Introducing R vocabularyGetting help
Installing R and RStudio
R
R is open source, which is good and bad:
anybody can contribute (check, improve, create code)free of chargebut: R depends on collective action
cannot ‘demand’ supportsprawl of packages
Richard L. Zijdeman Introduction into R

Quantitave research methodsStatistical Software
Introducing R vocabularyGetting help
Installing R and RStudio
RStudio
browser for Rprovides easy access to:
scriptsdataplotsmanual
Richard L. Zijdeman Introduction into R
Quantitave research methodsStatistical Software
Introducing R vocabularyGetting help
Installing R and RStudio
Introducing R vocabulary
Richard L. Zijdeman Introduction into R

Quantitave research methodsStatistical Software
Introducing R vocabularyGetting help
Installing R and RStudio
R script
* series of commands to manipulate data* always save your script, NEVER change your data
original data + script = reproducable research
Richard L. Zijdeman Introduction into R

Quantitave research methodsStatistical Software
Introducing R vocabularyGetting help
Installing R and RStudio
R Session
* contains scripts, data, functions* can be saved 'workspace image'* prefer not to:
+ sessions are usually cluttered+ only useful if running script takes time
Richard L. Zijdeman Introduction into R

Quantitave research methodsStatistical Software
Introducing R vocabularyGetting help
Installing R and RStudio
Assignment
* 'attach' values to an object (e.g. a variable)
x <- 5y <- 4z <- x*yprint(z)
## [1] 20
Richard L. Zijdeman Introduction into R
Quantitave research methodsStatistical Software
Introducing R vocabularyGetting help
Installing R and RStudio
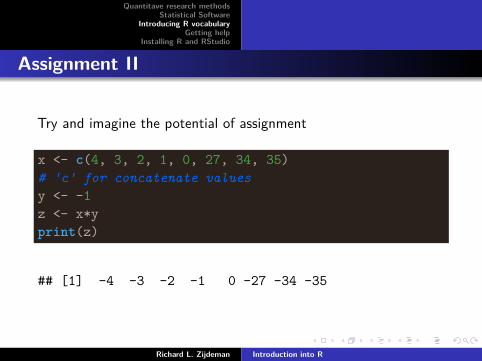
Assignment II
Try and imagine the potential of assignment
x <- c(4, 3, 2, 1, 0, 27, 34, 35)# 'c' for concatenate valuesy <- -1z <- x*yprint(z)
## [1] -4 -3 -2 -1 0 -27 -34 -35
Richard L. Zijdeman Introduction into R

Quantitave research methodsStatistical Software
Introducing R vocabularyGetting help
Installing R and RStudio
Data.frame
basically a tablecontains columns (variables)contains rows (cases)“flat table” in Kees’ terminology
my.df <- data.frame(x,z)str(my.df) # show STRucture
## 'data.frame': 8 obs. of 2 variables:## $ x: num 4 3 2 1 0 27 34 35## $ z: num -4 -3 -2 -1 0 -27 -34 -35
Richard L. Zijdeman Introduction into R

Quantitave research methodsStatistical Software
Introducing R vocabularyGetting help
Installing R and RStudio
Packages and libraries
base R (core product)additional packages
CRAN repositoryspread through ‘mirrors’choose a local, but active mirror
Githubpackages not on CRANdevelopment versions of CRAN libraries
Richard L. Zijdeman Introduction into R

Quantitave research methodsStatistical Software
Introducing R vocabularyGetting help
Installing R and RStudio
Getting help
Richard L. Zijdeman Introduction into R
Quantitave research methodsStatistical Software
Introducing R vocabularyGetting help
Installing R and RStudio
Build-in help: “?”
?[function] / ?[package]e.g. “?plot” or “?graphics”
check the index for user guides and vignettes
Richard L. Zijdeman Introduction into R
Quantitave research methodsStatistical Software
Introducing R vocabularyGetting help
Installing R and RStudio
Cran website
ManualsR FAQR Journal
Richard L. Zijdeman Introduction into R

Quantitave research methodsStatistical Software
Introducing R vocabularyGetting help
Installing R and RStudio
Online communities
StackoverflowInstance of StackexchangeReputation based Q&A
Specific lists for packages, e.g.:ggplot2R-sig-mixed-models
Richard L. Zijdeman Introduction into R
Quantitave research methodsStatistical Software
Introducing R vocabularyGetting help
Installing R and RStudio
Asking a question Getting an answer
Search the web: others must have had this problem tooIf you raise a question:
be politebe conciseshort backgroundreplicatable exampledebrief your efforts sofar
Richard L. Zijdeman Introduction into R

Quantitave research methodsStatistical Software
Introducing R vocabularyGetting help
Installing R and RStudio
Installing R and RStudio
Richard L. Zijdeman Introduction into R
Quantitave research methodsStatistical Software
Introducing R vocabularyGetting help
Installing R and RStudio
Download R
Instructions via http://www.r-project.orgChoose a CRAN mirrorhttp://cran.r-project.org/mirrors.html
close, but active too!Romania hasn’t gone (yet!)
Click on ‘Download R for Windows’Follow usual installation procedureDouble click on R
You should now have a working session!Close the session, do not save workspace image
Richard L. Zijdeman Introduction into R

Quantitave research methodsStatistical Software
Introducing R vocabularyGetting help
Installing R and RStudio
RStudio
RStudio is found on http://www.rstudio.comDownload the version for your OS (e.g. windows)
http://www.rstudio.com/products/rstudio/download/
Install by double clicking on the downloaded fileStart RStudio by double clicking on the iconYou do not need to start R, before starting RStudio
Richard L. Zijdeman Introduction into R