introduction education and immigration researchers have noted that immigration sometimes produces a...
TRANSCRIPT

INTRODUCTION Education and Immigration Researchers have noted that immigration sometimes produces a “barbell” shaped educational distribution – high concentrations of immigrants with low-education and those with advanced degrees (Martin 1995, Frey 2004). Currently, there are no comprehensive estimates of the extent to which credentials earned in other countries affect the educational distribution of the U.S. population. We produce estimates of the number of such credentials, and how they are distributed among various segments of the population aged 25 and over. To what extent does the “barbell” distribution reflect the contributions of domestic and foreign education systems? Frey, William H. (2004) “Brain Drains, Brain Gains.” American Demographics. Martin, Phillip L. (1995) “The Economics of Immigration.” Quill Magazine.
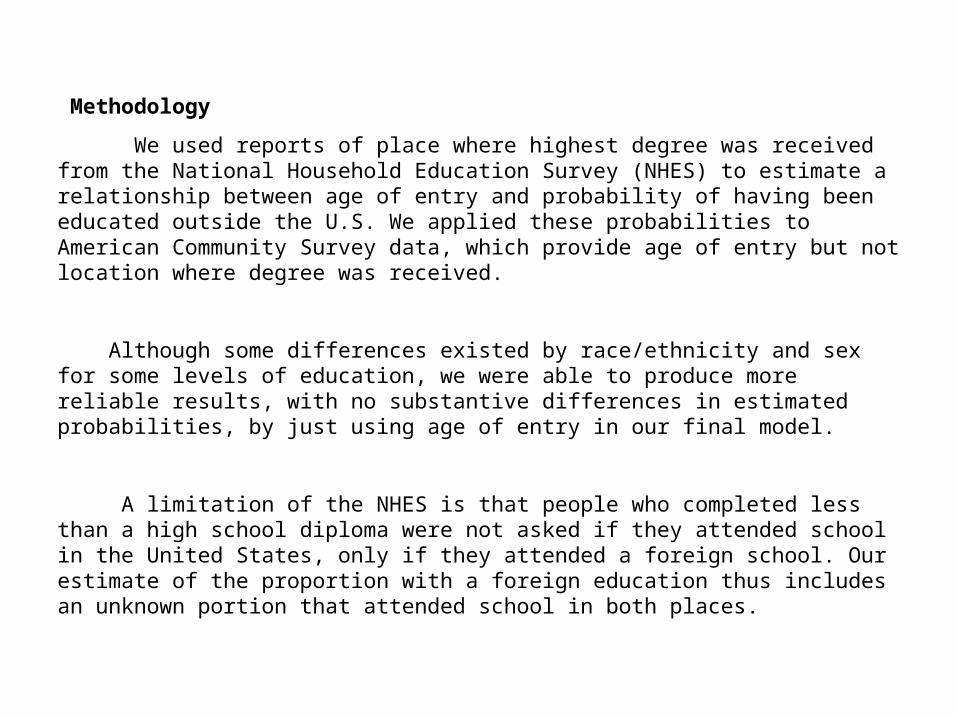
Methodology
We used reports of place where highest degree was received from the National Household Education Survey (NHES) to estimate a relationship between age of entry and probability of having been educated outside the U.S. We applied these probabilities to American Community Survey data, which provide age of entry but not location where degree was received.
Although some differences existed by race/ethnicity and sex for some levels of education, we were able to produce more reliable results, with no substantive differences in estimated probabilities, by just using age of entry in our final model.
A limitation of the NHES is that people who completed less than a high school diploma were not asked if they attended school in the United States, only if they attended a foreign school. Our estimate of the proportion with a foreign education thus includes an unknown portion that attended school in both places.

2001 National Household Education Survey
The NHES was established by the National Center for Education Statistics to study educational issues that cannot be addressed in institutional surveys. The NHES provides cross sectional estimates for the 50 states and the District of Columbia.
2004 American Community Survey
In 2004, the ACS published data for all states, most areas with populations of 250,000 or more, and select areas of 65,000 or more. Beginning with our data release in 2006, the ACS will publish annual single-year estimates for all areas of 65,000 or more. In 2008, the ACS will publish its first three-year period estimates for areas of 20,000 or more. The 2004 survey data collection took place in 31 test sites and 1203 additional counties. In 2005, the survey was expanded to include all counties including all municipios in Puerto Rico.
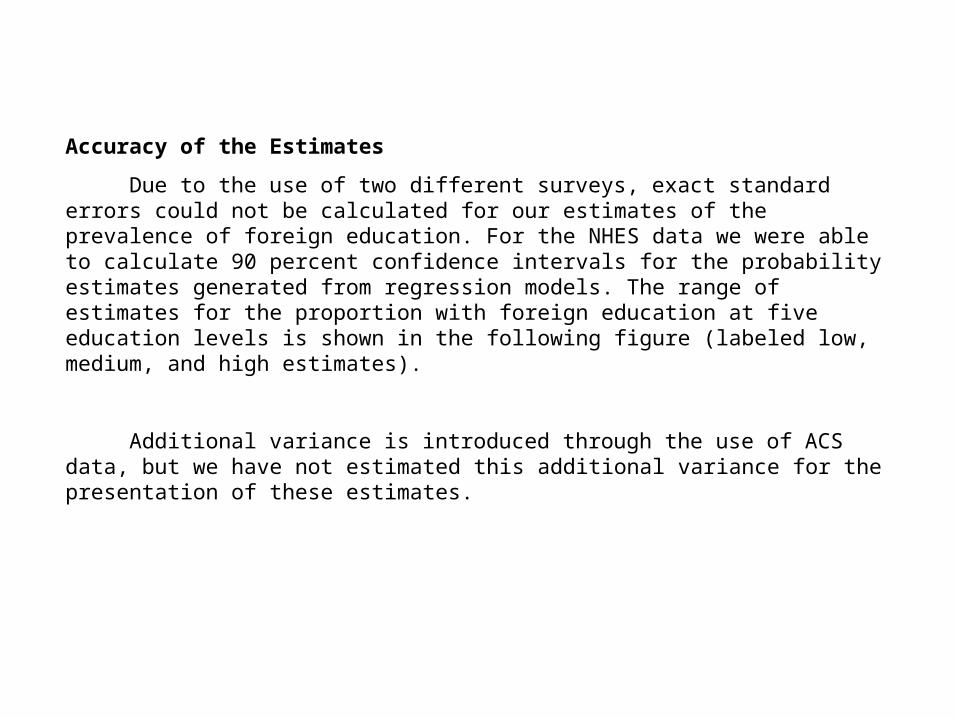
Accuracy of the Estimates
Due to the use of two different surveys, exact standard errors could not be calculated for our estimates of the prevalence of foreign education. For the NHES data we were able to calculate 90 percent confidence intervals for the probability estimates generated from regression models. The range of estimates for the proportion with foreign education at five education levels is shown in the following figure (labeled low, medium, and high estimates).
Additional variance is introduced through the use of ACS data, but we have not estimated this additional variance for the presentation of these estimates.

Range of Estimates, Percent with Foreign Education
0.0
5.0
10.0
15.0
20.0
25.0
30.0
Less than highschool
High schoolgraduate
Some college orassociate's degree
Bachelor's degree Advanced degree
Per
cent High estimate
Medium
Low estimate
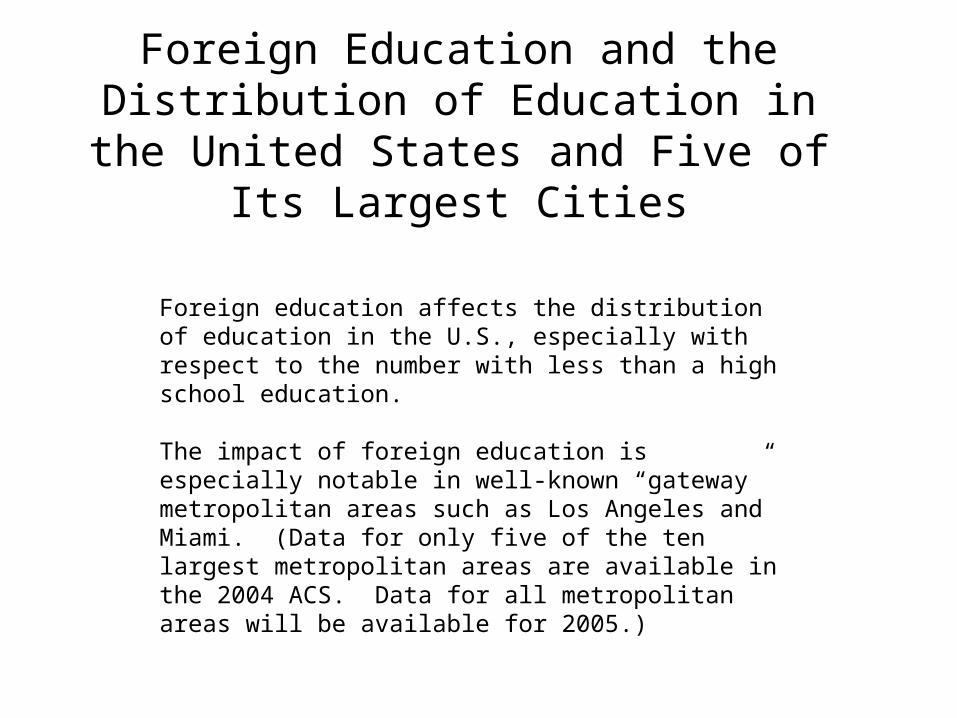
Foreign Education and the Distribution of Education in the United States and Five of Its
Largest Cities
Foreign education affects the distribution of education in the U.S., especially with respect to the number with less than a high school education.
The impact of foreign education is especially notable in well-known “gateway” metropolitan areas such as Los Angeles and Miami. (Data for only five of the ten largest metropolitan areas are available in the 2004 ACS. Data for all metropolitan areas will be available for 2005.)

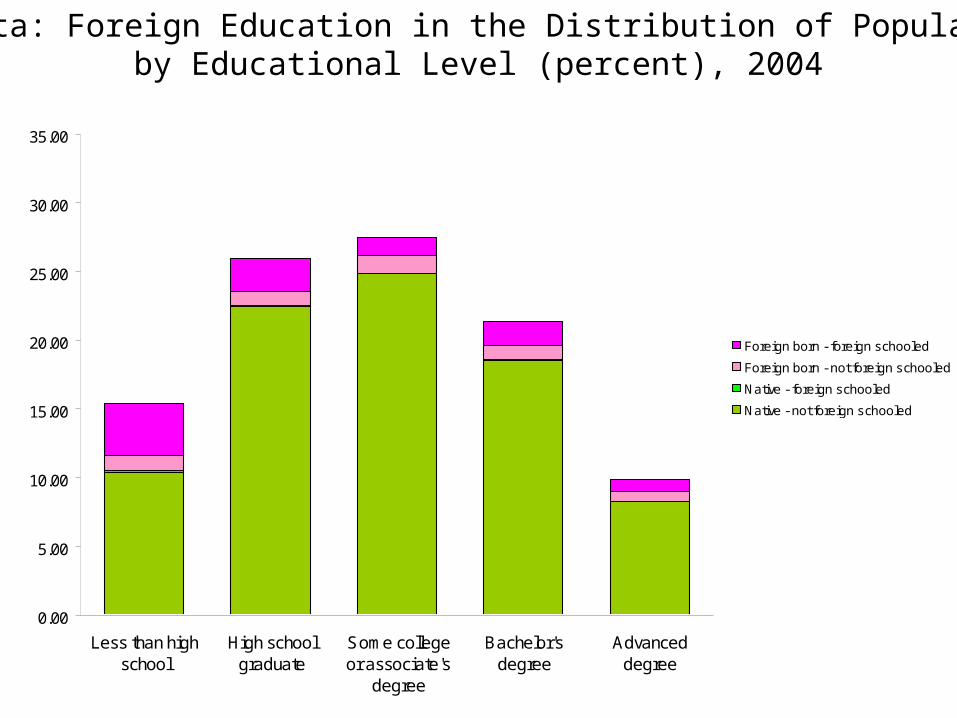
Foreign Education in the U.S. Distribution of Population by Educational Level (Midpoint Estimate, percent), 2004
0.00
5.00
10.00
15.00
20.00
25.00
30.00
35.00
Less than highschool
High schoolgraduate
Some collegeor associate's
degree
Bachelor'sdegree
Advanceddegree
Foreign born - foreign schooled
Foreign born - not foreign schooled
Native - foreign schooled
Native - not foreign schooled
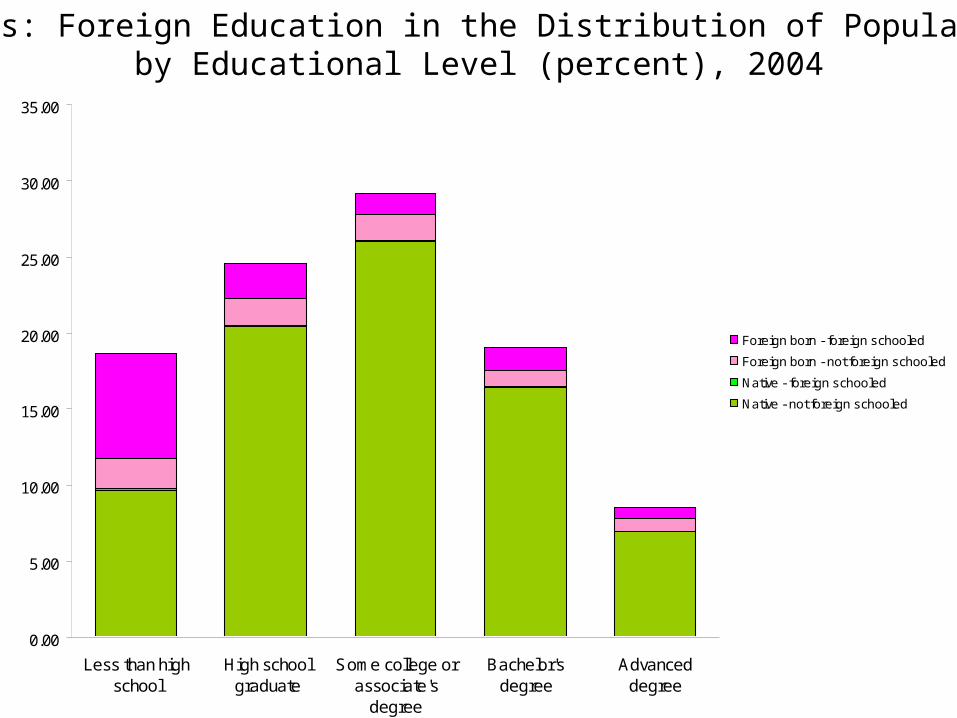
Atlanta: Foreign Education in the Distribution of Population by Educational Level (percent), 2004
0.00
5.00
10.00
15.00
20.00
25.00
30.00
35.00
Less than highschool
High schoolgraduate
Some collegeor associate's
degree
Bachelor'sdegree
Advanceddegree
Foreign born - foreign schooled
Foreign born - not foreign schooled
Native - foreign schooled
Native - not foreign schooled
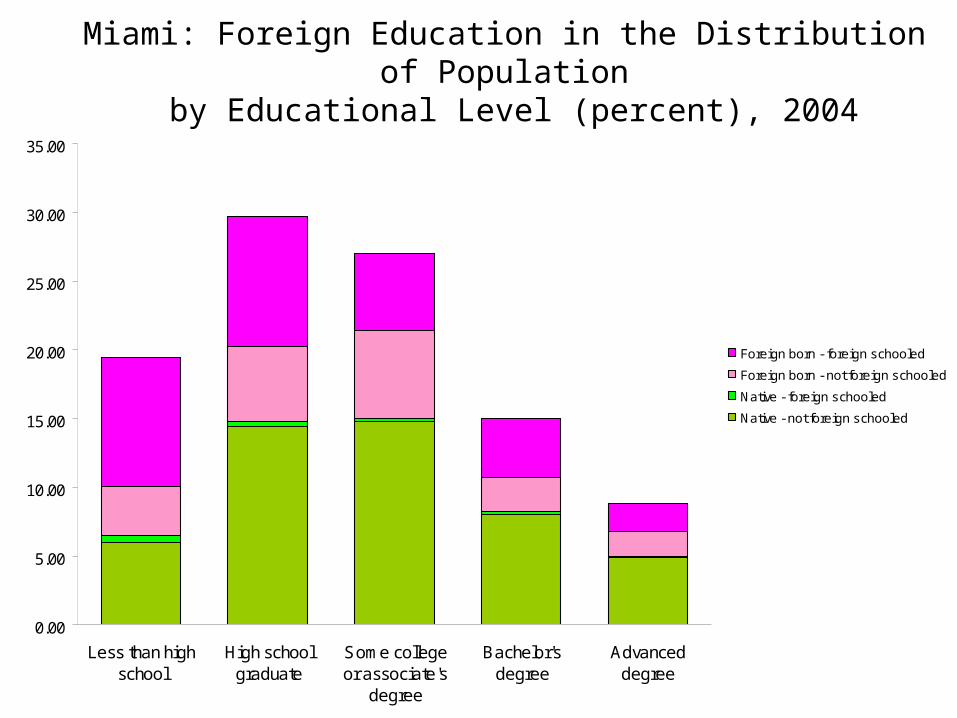
Miami: Foreign Education in the Distribution of Population by Educational Level (percent), 2004
0.00
5.00
10.00
15.00
20.00
25.00
30.00
35.00
Less than highschool
High schoolgraduate
Some collegeor associate's
degree
Bachelor'sdegree
Advanceddegree
Foreign born - foreign schooled
Foreign born - not foreign schooled
Native - foreign schooled
Native - not foreign schooled

Los Angeles: Foreign Education in the Distribution of Population by Educational Level (percent), 2004
0.00
5.00
10.00
15.00
20.00
25.00
30.00
35.00
Less than highschool
High schoolgraduate
Some college orassociate's
degree
Bachelor'sdegree
Advanceddegree
Foreign born - foreign schooled
Foreign born - not foreign schooled
Native - foreign schooled
Native - not foreign schooled
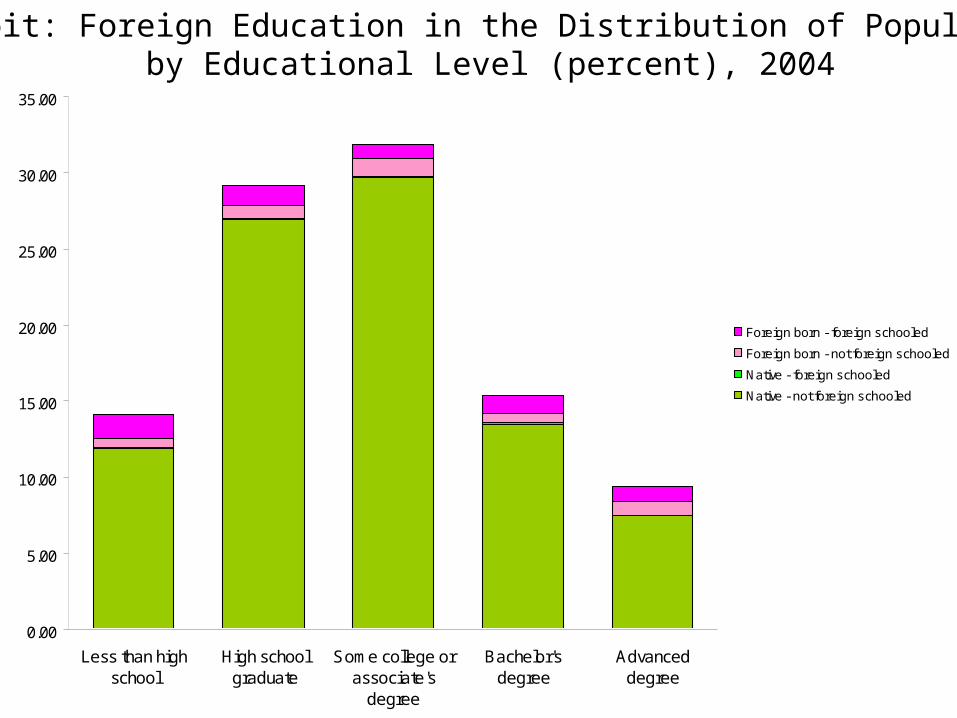
Dallas: Foreign Education in the Distribution of Population by Educational Level (percent), 2004
0.00
5.00
10.00
15.00
20.00
25.00
30.00
35.00
Less than highschool
High schoolgraduate
Some college orassociate's
degree
Bachelor'sdegree
Advanceddegree
Foreign born - foreign schooled
Foreign born - not foreign schooled
Native - foreign schooled
Native - not foreign schooled
Detroit: Foreign Education in the Distribution of Population by Educational Level (percent), 2004
0.00
5.00
10.00
15.00
20.00
25.00
30.00
35.00
Less than highschool
High schoolgraduate
Some college orassociate's
degree
Bachelor'sdegree
Advanceddegree
Foreign born - foreign schooled
Foreign born - not foreign schooled
Native - foreign schooled
Native - not foreign schooled
Barbell-Shaped Education Distribution, Revisited
The foreign born make up 29 percent of those with less than a high school education, and 17 percent of those with an advanced degree, while they are only 10 percent of those with some college or an associate degree.
If we exclude those who attended foreign schools (among those who completed less than high school) or received foreign degrees (among those with a high school diploma or higher education), we find that the foreign born make up 4 to 8 percent of the total at all educational categories.

Foreign Born Population as Percent of Total Population by EducationLevel, 2004 American Community Survey
0.0
5.0
10.0
15.0
20.0
25.0
30.0
35.0
Less than high school High school graduate Some college Bachelor's degree Advanced degree
Per
cent
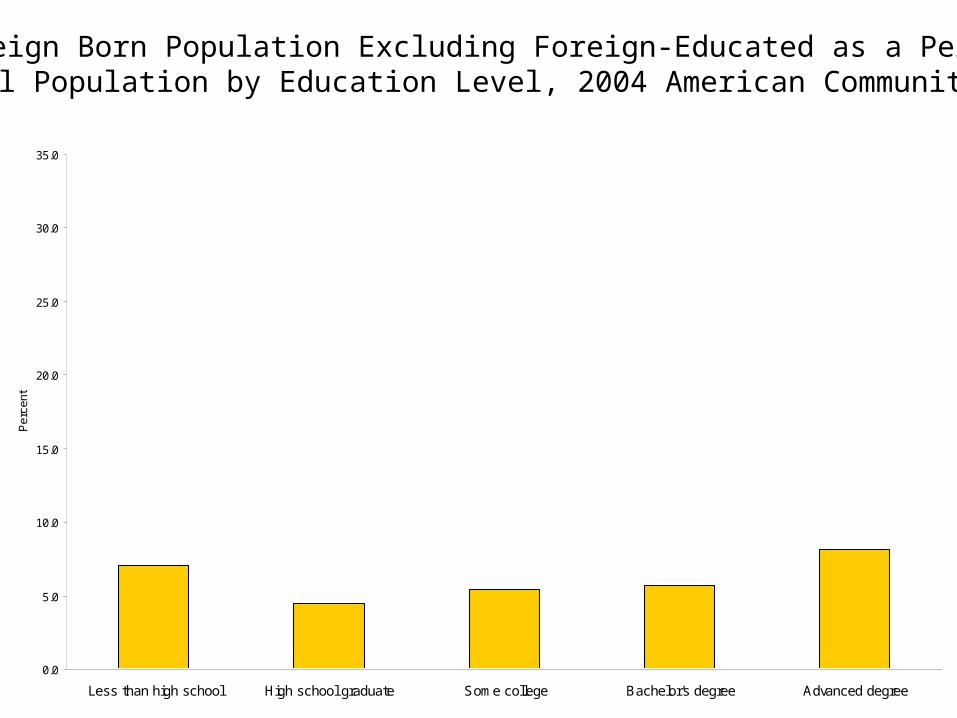
Foreign Born Population Excluding Foreign-Educated as a Percentof Total Population by Education Level, 2004 American Community Survey
0.0
5.0
10.0
15.0
20.0
25.0
30.0
35.0
Less than high school High school graduate Some college Bachelor's degree Advanced degree
Per
cent
Educational Attainment Levels
The nominal ranking of ten states with the greatest percentage of population with less than a high school diploma is affected greatly by the influence of foreign education.
The nominal ranking of ten states and Washington DC with the greatest percentage of population with an advanced degree is not affected greatly by prevalence of foreign degree recipients.
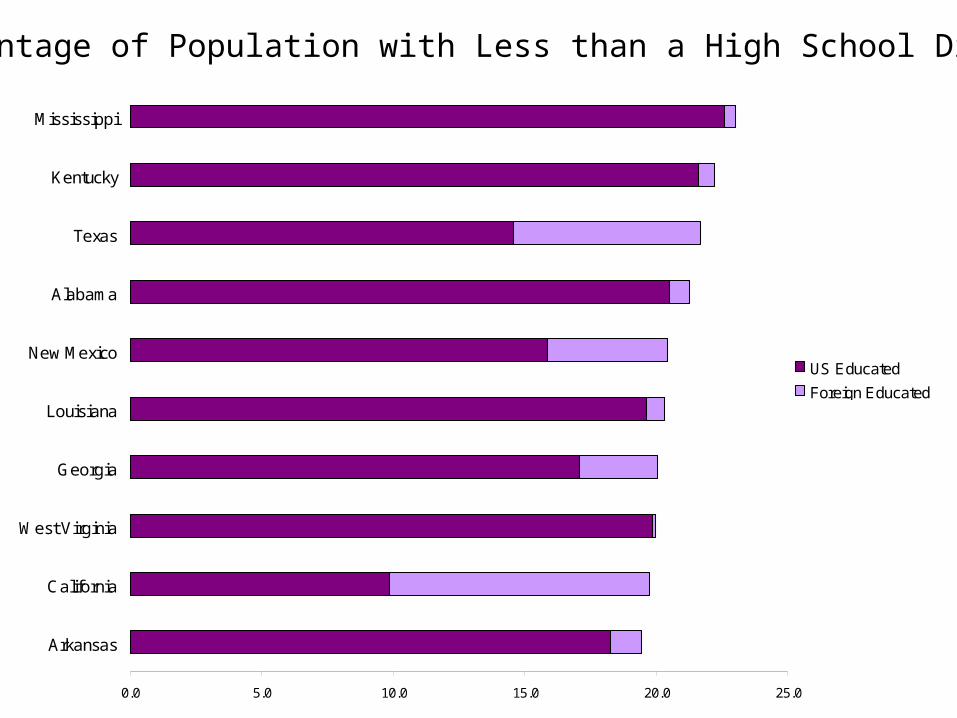
Percentage of Population with Less than a High School Diploma
0.0 5.0 10.0 15.0 20.0 25.0
Arkansas
California
West Virginia
Georgia
Louisiana
New Mexico
Alabama
Texas
Kentucky
Mississippi
US Educated
Foreign Educated
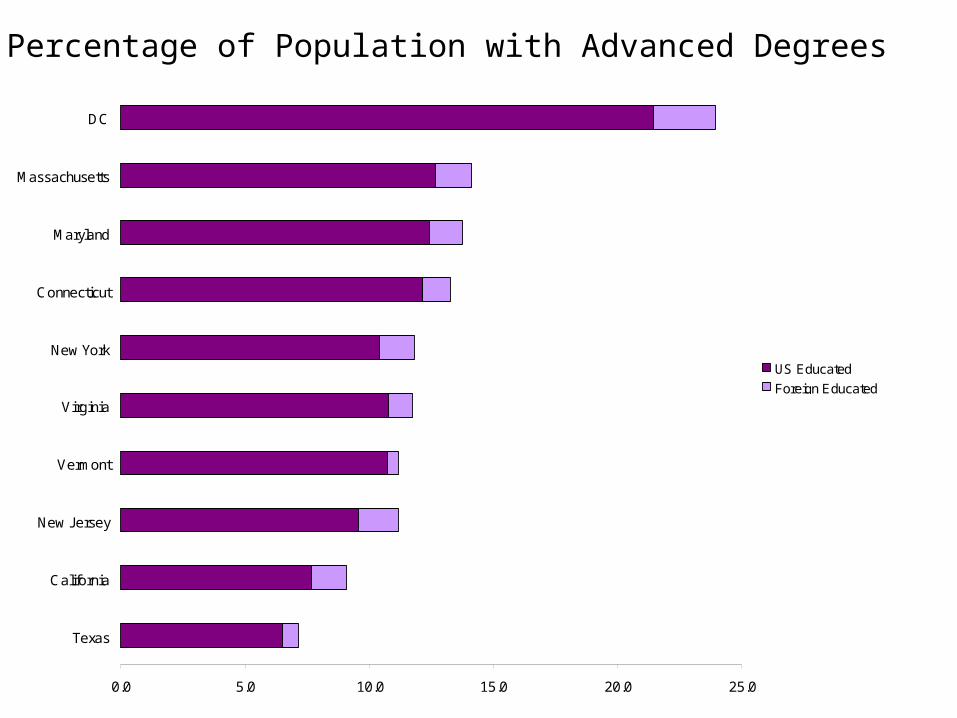
Percentage of Population with Advanced Degrees
0.0 5.0 10.0 15.0 20.0 25.0
Texas
California
New Jersey
Vermont
Virginia
New York
Connecticut
Maryland
Massachusetts
DC
US Educated
Foreign Educated

Education by Race, Hispanic Origin, and Age
Foreign degree receipt is relatively more common for people classifying themselves as Asian alone, Some other race, or Hispanic or Latino.
Age has a strong association with foreign education among those with less than a high school diploma.

Percentage of Population without a High School Diploma who Attended a Foreign School by Race and Hispanic Origin
18.5
7.1 8.2
67.1
41.5
58.7
17.6
57.7
0
10
20
30
40
50
60
70
White Alone Black orAfrican
AmericanAlone
AmericanIndian and
AlaskaNative Alone
Asian Alone NativeHawaiianand Other
PacificIslanderAlone
Some OtherRace Alone
More ThanOne Race
Hispanic orLatino (ofany race)
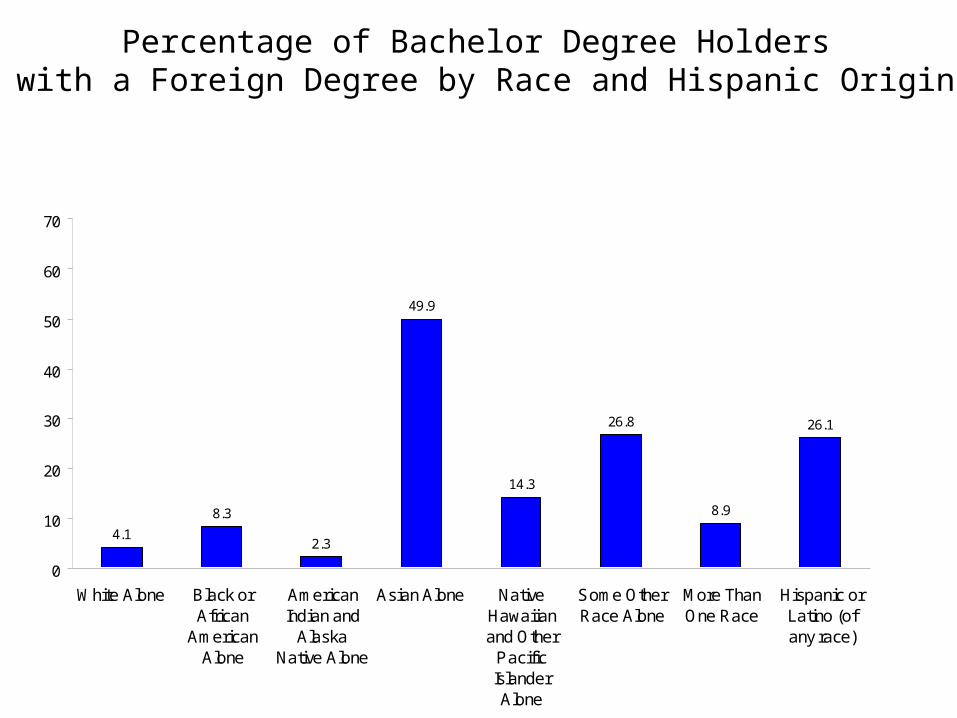
Percentage of Bachelor Degree Holders with a Foreign Degree by Race and Hispanic Origin
4.1
8.3
2.3
49.9
14.3
26.8
8.9
26.1
0
10
20
30
40
50
60
70
White Alone Black orAfrican
AmericanAlone
AmericanIndian and
AlaskaNative Alone
Asian Alone NativeHawaiianand Other
PacificIslanderAlone
Some OtherRace Alone
More ThanOne Race
Hispanic orLatino (ofany race)

17.8
36.6
32.3
26.8
20.9
13.4
0
5
10
15
20
25
30
35
40
18-24 25-34 35-44 45-54 55-64 65 or over
Percentage of Population with Less than a High School Degree Who Attended a Foreign School by Age

2.4
7.2
9.4 9.2 9.3 9.1
0
5
10
15
20
25
30
35
40
18-24 25-34 35-44 45-54 55-64 65 or over
Percentage of Population of College Graduates with a Foreign Degree by Age
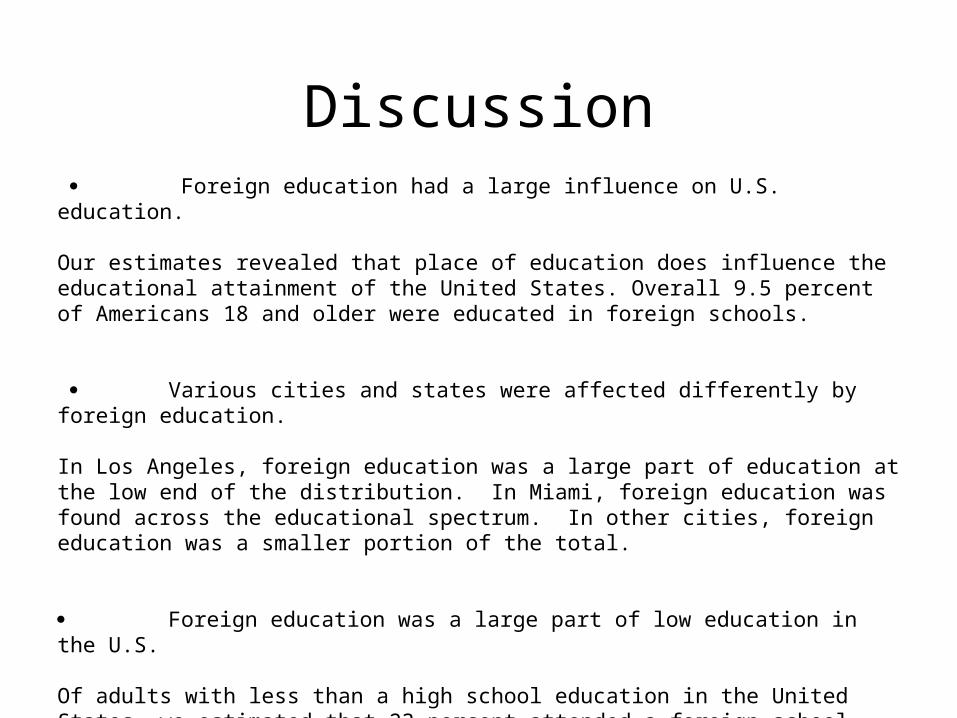
Discussion Foreign education had a large influence on U.S. education. Our estimates revealed that place of education does influence the educational attainment of the United States. Overall 9.5 percent of Americans 18 and older were educated in foreign schools.
Various cities and states were affected differently by foreign education.
In Los Angeles, foreign education was a large part of education at the low end of the distribution. In Miami, foreign education was found across the educational spectrum. In other cities, foreign education was a smaller portion of the total.
Foreign education was a large part of low education in the U.S. Of adults with less than a high school education in the United States, we estimated that 23 percent attended a foreign school. Among adults in the United States with a high school diploma, an estimated eight percent attended a foreign school.
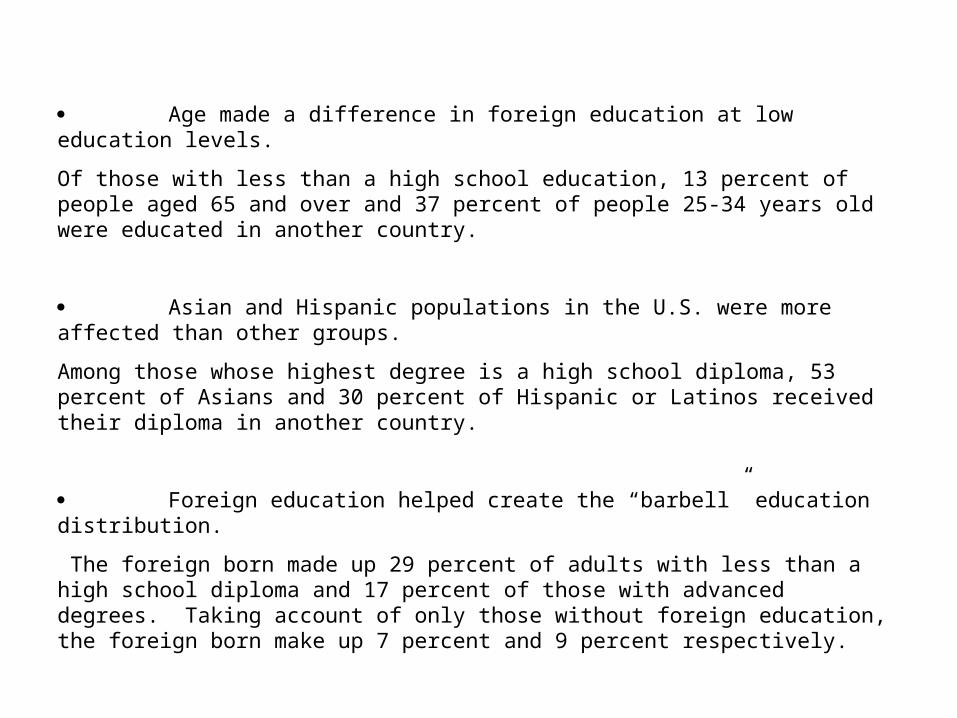
Age made a difference in foreign education at low education levels.
Of those with less than a high school education, 13 percent of people aged 65 and over and 37 percent of people 25-34 years old were educated in another country.
Asian and Hispanic populations in the U.S. were more affected than other groups.
Among those whose highest degree is a high school diploma, 53 percent of Asians and 30 percent of Hispanic or Latinos received their diploma in another country.
Foreign education helped create the “barbell” education distribution.
The foreign born made up 29 percent of adults with less than a high school diploma and 17 percent of those with advanced degrees. Taking account of only those without foreign education, the foreign born make up 7 percent and 9 percent respectively.